

Abstract
Protein–RNA recognition is highly affinity-driven and regulates a wide array of cellular functions. In this study, we have curated a binding affinity data set of 40 protein–RNA complexes, for which at least one unbound partner is available in the docking benchmark. The data set covers a wide affinity range of eight orders of magnitude as well as four different structural classes. On average, we find the complexes with single-stranded RNA have the highest affinity, whereas the complexes with the duplex RNA have the lowest. Nevertheless, free energy gain upon binding is the highest for the complexes with ribosomal proteins and the lowest for the complexes with tRNA with an average of −5.7 cal/mol/Å2 in the entire data set. We train regression models to predict the binding affinity from the structural and physicochemical parameters of protein–RNA interfaces. The best fit model with the lowest maximum error is provided with three interface parameters: relative hydrophobicity, conformational change upon binding and relative hydration pattern. This model has been used for predicting the binding affinity on a test data set, generated using mutated structures of yeast aspartyl-tRNA synthetase, for which experimentally determined ΔG values of 40 mutations are available. The predicted ΔGempirical values highly correlate with the experimental observations. The data set provided in this study should be useful for further development of the binding affinity prediction methods. Moreover, the model developed in this study enhances our understanding on the structural basis of protein–RNA binding affinity and provides a platform to engineer protein–RNA interfaces with desired affinity.
Keywords: protein–RNA interaction, binding affinity, dissociation constant, conformation change, regression model
INTRODUCTION
Biomolecular assemblies involving proteins and RNAs are essential for many cellular functions, and the stability of these assemblies is mediated by the noncovalent interactions (Pauling and Pressman 1945; Kauzmann 1959; Chothia and Janin 1975; Janin 1995; Draper 1999; Nadassy et al. 1999; Jones 2001; Treger and Westhof 2001; Bahadur et al. 2008). These noncovalent forces are responsible for the binding processes as well as for the folding of the biomolecules; however, specificity plays an important role in the recognition. Although the conformation of the chemical groups, constituting the biomolecules in three dimensions (3D), determine the specificity of binding, the energy required for the biomolecules to adopt this conformation is the determinant factor for the affinity of complex formation and is termed as the free energy of binding. At equilibrium, the change in Gibbs free energy upon binding (ΔG) can be determined from the reaction kinetics in terms of the dissociation constant Kd. Although numerous biophysical and biochemical methods are available to determine the Kd (and consequently the ΔG) values, the gap between the experimentally determined atomic structures of the complexes available in the Protein Data Bank (PDB) (Berman et al. 2002) and their corresponding free energy of binding is still enormous. To bridge this gap, many physics-based methods have been developed to determine the ΔG values theoretically (Kollman 1993), which are often correlated with their corresponding experimental values when available in the literature (Horton and Lewis 1992; Murphy et al. 1993; Vajda et al. 1994; Janin 1995; Ma et al. 2002; Audie and Scarlata 2007; Su et al. 2009; Kastritis and Bonvin 2010). Although these methods are extensively used on the protein–ligand and on the protein–protein complexes (Ballester and Mitchell 2010; Moal et al. 2011), they are yet to be tested on the protein–RNA complexes. One of the major difficulties in testing them on the protein–RNA complexes is the scarcity of the available experimental data of protein–RNA binding affinity. However, the growing interest in the field of studying protein–RNA interactions made available a handful of experimentally determined Kd values for a diverse set of protein–RNA complexes.
Recently, we have assembled a protein–RNA docking benchmark v2.0, which contains 126 complexes (Nithin et al. 2017) as an update to the v1.0 of protein–RNA docking benchmarks (Barik et al. 2012b; Pérez-Cano et al. 2012; Huang and Zou 2013). Of these complexes, the binding affinity values are available for 40 cases in the literature. The curated data set represents a wide array of biological functions with affinities covering eight orders of magnitude (range between 10−4 and 10−11 M), as well as four different structural classes. We train a mathematical model to predict the protein–RNA binding affinity using structural and physicochemical parameters of the protein–RNA interfaces derived from this data set. In addition, we have successfully tested this model on a data set of mutated structures of yeast Asp-tRNA synthetase complexed with its cognate tRNA, for which experimental ΔG values of 40 mutations are available in the literature (Eriani and Gangloff 1999). Our findings will provide a basis for the quantitative description of protein–RNA binding affinity and may further be extended to engineer protein–RNA interfaces with desired affinity. Additionally, the curated data set can be used for further development and testing of algorithms to predict the protein–RNA binding affinity.
RESULTS
The data set of protein–RNA binding affinity
The starting point of the present study is the protein–RNA docking benchmark v2.0 compiled by Nithin et al. (2017). We performed an exhaustive literature survey to curate the binding affinity data of the protein–RNA complexes, for which at least one unbound structure is available. The binding affinity data set contains 40 complexes, for which the Kd values were determined by any of the six methods described in the Materials and Methods section. For each complex in this data set, we report the following parameters in Table 1: PDB entry code and the chain identifiers for the complex and its constituents, the length of the RNA molecule in the crystal structure and in the solution, the Kd value and the derived ΔG, the temperature and the pH at which the measurements were done, the experimental methodologies used, and the references reporting the publications. In addition, we also report the values of interface area (B), free energy gain upon binding of the partner molecules, c-rmsd, p-rmsd, i-rmsd, and the flexibility of the interface.
TABLE 1.
The data set for the protein–RNA binding affinity

There are different data sets available for protein–RNA binding affinity values curated by multiple groups (Nithin et al. 2018). With 73 cases, the first data set of affinity values was developed in 2013 by the Liu group (Yang et al. 2013). The PDBBind data set developed by the Wang group reports affinity values for six protein–RNA complexes (Liu et al. 2015). Similarly, the Bahadur group had curated the data set of affinity values for alanine substitutions in protein components of protein–RNA complexes, which reports 94 experimental affinity values for 14 native structures (Barik et al. 2016). This data set was later expanded by the Deng group to include 49 RNP complexes (Pan et al. 2018), which reports 334 experimental affinity values. More recently, the Mitchell and Zhu groups developed the dbAMEPNI data set, which reports experimentally determined affinity values for 51 protein–RNA complexes (Liu et al. 2018) and for 193 alanine substitutions in these RNA-binding proteins. In the current study, we have used the data set of affinity values curated for complexes available in the protein–RNA docking benchmark, which is highly nonredundant, making the choice justified.
Experimental techniques used to measure the affinity values
An important aspect to be considered about the binding affinity data set is the methodological difference among different experimental techniques used for affinity measurements (Kastritis and Bonvin 2013). Protein–RNA binding affinity is highly dependent on temperature, pH, and ionic strength, as well as the presence of a high concentration of other macromolecules. This has been carefully checked for all the cases present in this data set and is reported in Table 1. The affinity values reported in Table 1 were measured by the following experimental methods: EMSA (Ryder et al. 2008), filter binding assay (Rio 2012), fluorescence spectroscopy (Vivian and Callis 2001), kinetic study (Goodrich and Kugel 2015), ITC (Feig 2009), and SPR (Katsamba et al. 2002). All the experiments that measured the reported dissociation constants in the present data set have been performed in the temperature range between 273 K and 338 K.
In 13 cases, the Kd values were determined by EMSA, which is routinely used to visualize the protein–RNA interactions (Ryder et al. 2008). This method relies on the electronic property of the RNA surface, which helps them to migrate toward an anode upon application of an electric field in an agarose or polyacrylamide gel matrix. The average Kd value determined by EMSA is in the micromolar range, although it reports both high affinity (Kd = 5.4 × 10⁻¹¹ M) in the helicase dbpA-23S rRNA fragment complex (Hardin et al. 2010) and low affinity (Kd = 1.0 × 10⁻⁶ M) in elongation factor Sel B and the RNA complex (Yoshizawa et al. 2005). The dissociation constants measured by EMSA were at different temperatures, and the average ΔG is −10.55 kcal/mol (Table 1). EMSA captures more stable interactions, which can tolerate electrophoresis conditions and heat generated during the process (Hellman and Fried 2007).
Fluorescent spectroscopy (Vivian and Callis 2001) makes use of either the intrinsic tryptophan fluorescence (Ghisaidoobe and Chung 2014) or fluorophore-labeled oligonucleotide probes (Pagano et al. 2011) to quantitatively monitor the protein–nucleic acid interactions. This method is the second major method that reports nine Kd values with an average of 1.25 × 10⁻⁵ M, and the corresponding average for ΔG is −8.81 kcal/mol. The value ranges from 1.1 × 10⁻⁴ M in the complex between Nab3-RRM and the UCUU recognition sequence (Lunde et al. 2011) to 4.0 × 10⁻⁸ M in the complex between the ZnF domain and pre-mRNA (Teplova and Patel 2008). The affinity measurements by the fluorescence titration method could be affected by the use of a labeling that may alter the binding behavior of the complex (Klotz 1985).
Filter binding assay (Rio 2012) is the third major method that reports Kd values for eight complexes. This methodology is based on the assumption that proteins bind to nucleic acids, and if a protein is associated with a nucleic acid, then the complex can also be retained on a nitrocellulose filter (Hall and Kranz 1999). This method is fully informative when there is a single binding site, but it fails at the presence of multiple binding sites. The average Kd value reported by this method is 6.44 × 10⁻⁷ M (corresponding average ΔG value is −11.30 kcal/mol) with a range from 5.0 × 10⁻⁶ M in the complex between the Rho transcription termination factor and cytosine-rich RNA (Martinez et al. 1996) to 3.33 × 10⁻¹¹ M in the complex between SRP and 4.5S RNA (Batey et al. 2001). These values were measured either at 298 K or at 310 K. The association between the protein and the nucleic acid must be tight enough to survive the filtration, and the protein must be able to retain the bound nucleic acid when it is in turn bound to the filter (Oehler et al. 1999).
ITC measures the heat taken up or given off during interaction between protein and RNA (Feig 2009). The enthalpy changes associated with the binding are measured by calorimetry, which makes it the only method available for directly determining the thermodynamic parameters associated with an interaction (Ladbury and Chowdhry 1996). ITC was used in the determination of Kd values for seven complexes with an average Kd of 4.67 × 10⁻⁷ M, and the values range from 1.2 × 10⁻⁶ M in the complex between NS1 and dsRNA (Cheng et al. 2009) to 1.26 × 10⁻⁸ M in the complex between GTPase ERA and 16S rRNA (Tu et al. 2011). Even though ITC has high sensitivity, the extraction of heat effects of complex formation can be challenging under certain conditions. For instance, when the association of protein and RNA exhibits small binding enthalpy, the signal-to-noise ratio is relatively low. Similarly, when the complex formation is a rather slow process, the kinetically low process can get neglected (Du et al. 2016).
The other two methods, SPR and kinetic study, report Kd values for two (9.8 × 10⁻¹⁰ M and 5.3 × 10⁻⁹ M) and one (3.6 × 10⁻⁷ M) complex, respectively. SPR is an optical technique that measures the refractive index near the surface of the sensor (Yang et al. 2008). SPR (Biacore) is able to detect more transient and less stable interactions in the solution phase when the ligand molecule is provided at a very low concentration ranging from picomolar to nanomolar (Katsamba et al. 2002). However, the measurements performed by SPR could be affected by mass transfer limitations and the heterogeneity of the binding surface (Schuck and Zhao 2010).
Affinity in different structural classes
In the present data set, nine out of 40 complexes have both the protein and the RNA components in their free forms. Table 2 represents the data set divided into four structural classes as provided in the protein–RNA docking benchmark: (A) complexes with tRNA, (B) complexes with ribosomal protein, (C) complexes with duplex RNA, and (D) complexes with single-stranded RNA. They represent 12.5%, 5%, 37.5%, and 45% of the cases, respectively. In addition, Table 2 provides the mean value and the standard deviation for ΔG, B, and i-rmsd in each class. All the structures reported in this data set are of medium affinity class as described in the affinity benchmark of protein–protein complexes by Kastritis et al. (2011).
TABLE 2.
Affinity and structural classes of the complexes

The structural class A contains five complexes with aminoacyl tRNA synthetases and their corresponding tRNAs. The Kd is in the range from 3 × 10⁻⁸ M to 3.6 × 10⁻⁷ M. The average ΔG in this class is −9.97 kcal/mol, and the corresponding average interface area (B) is 4022 Å2. The data set contains only two Kd values for the class B complexes involving ribosomal protein and rRNA. For both of them, the dissociation constant is ∼7 × 10⁻⁸ M. The average ΔG in this class is −9.4 kcal/mol, and the average B is 1404 Å2. Class C, complexes with duplex RNA, exhibits a wide Kd range from 1.2 × 10⁻⁶ M to 3.33 × 10⁻¹¹ M with an average of 1.04 × 10⁻⁷ M (corresponding average ΔG value is −11.47 kcal/mol). In this class, the highest affinity is found in the complex between the SRP and 4.5S RNA (Kd is 3.33 ×10⁻¹¹ M). Here, the minor groove of 4.5S RNA recognizes the M domain of SRP and the recognition is highly sequence-specific (Batey et al. 2001). The buried surface area between the protein and the RNA is 1364 Å2 (Fig. 1A) with a fully flexible interface (i-rmsdRNA = 30.4 Å). The average ΔG in class C complexes is −11.5 kcal/mol, and the average B is 2313 Å2. Class D involves complexes with single-stranded RNA with a wide Kd ranging from 9.80 × 10⁻¹⁰ M to 1.10 × 10⁻⁴ M. The average ΔG is −8.98 kcal/mol, and the average B is 1950 Å2. This structural class contains the lowest affinity complex involving Nab3-RRM and the UCUU recognition sequence (Kd is 1.1 × 10⁻⁴ M) in which the protein–RNA recognition process is sequence-specific (Lunde et al. 2011). The buried surface area between the protein and the RNA is very small (926 Å2) (Fig. 1B) with a rigid interface (i-rmsd = 1.2 Å). Table 2 shows that average ΔG is the highest for complexes involving single-stranded RNA and the lowest for complexes involving duplex RNA with significant standard deviation in each class.
FIGURE 1.

Test cases in the protein–RNA affinity data set. (A) Structure of an SRP in complex with 4.5 S RNA (PDB ID: 1HQ1; structural class C), and (B) structure of the Rho transcription termination factor in complex with cytosine-rich RNA (PDB ID: 2A8V; structural class D). In each case, the bound form of the protein is in green, and the unbound form is in cyan. The bound form of RNA is in gray, and the unbound is in olive.
Conformational changes and the binding affinity
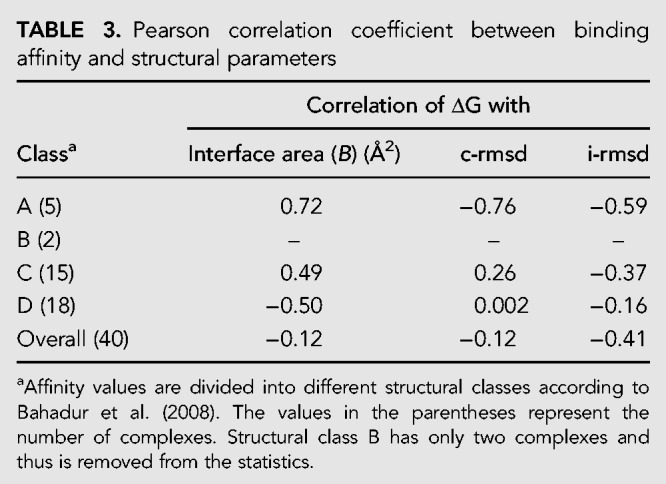
Protein–RNA interactions are often associated with conformational changes in which both the protein and the RNA molecules undergo significant rearrangements in their 3D structures upon binding (Ellis et al. 2007). At the protein side, the frequent changes include the side-chain rotation, small adjustments of the main chain, or large movements of the domains. Nevertheless, large domain movement exhibited in the ribosomal protein L1-mRNA complex (Tishchenko et al. 2006) or the transition of the polypeptide chain from disordered to ordered state exhibited in the P22 N-peptide bound to boxB RNA (Bahadur et al. 2009) and in the pseudouridine synthase TruB-tRNA complex (Pan et al. 2003) are also associated with RNA binding. Being more flexible than protein, RNA undergoes larger conformational changes than its partner protein at the protein–RNA binding site (Barik et al. 2012b). The data set displays examples with varying flexibility at the protein–RNA binding sites. While at one end it has a full flexible protein exemplified in the O-phosphoseryl-tRNA kinase-tRNA-Sec complex (i-rmsd: 27.3 Å; PDB ID: 3ADB), at the other end it has a rigid complex formed between exosome and substrate RNA (i-rmsd: 0.3 Å; PDB ID: 3IEV). The corresponding ΔG values are −11.31 kcal/mol and −7.98 kcal/mol, respectively, with a significant difference in their interface area, which are 3014 Å2 and 1533 Å2, respectively (Table 1). Average i-rmsd is the lowest in the complexes with single-stranded RNA and the highest in the complexes with double-stranded RNA (Table 2); however, the overall correlation with the ΔG is poor (Table 3).
TABLE 3.
Pearson correlation coefficient between binding affinity and structural parameters
Variable length of the RNA and affinity measurements
For each complex, Table 1 shows the length of the RNA in the crystal structure, as well as in the solution prepared for the Kd measurement. In most cases, the length of the RNA in the solution used for determining the Kd values are different from those available in the crystal structures. In the structural class A, in all but one case, the length of the RNAs from crystal and from solution is identical. This exception is found in the complex CCA-adding enzyme bound to 35-mer tRNA. Here, the partial tRNA used in the crystal is a synthetic construct (Tomita et al. 2006). In the structural class B, the RNA molecules in the crystal are shorter than those in the solution for Kd measurements. In the structural class C, significant RNA length variability is observed in three out of 15 cases. In the structural class D, significant RNA length variability is observed in nine out of 18 cases. In all of these cases, where the length variation exists, most of the crystal structures contain a part of the full-length RNA or synthetic RNA constructs, which are generally biologically irrelevant. In such cases, to predict the binding affinity theoretically, predictors should start with the longer RNA and model its conformation (Sim et al. 2012).
Mathematical model for the prediction of binding affinity
The data set of affinity values curated in this study has been used to generate a regression model to predict the binding affinity from various structural and physicochemical parameters (Supplemental Table S1). We have developed mathematical models as described in the Materials and Methods section using Eureqa (Schmidt and Lipson 2009). Models with R2 (the coefficient of determination) below 0.8 were discarded. The models fitted with the lowest error are selected and listed in Supplemental Table S2. The best fit model with minimum values for maximum error reported in the regression fitting is
| (1) |
where is the fraction of nonpolar interface atoms on the protein side. The parameter dr quantifies the relative hydration of interfaces. It is defined as the ratio of the average distance of interface waters to the average distance of interface atoms (Barik and Bahadur 2014). All the distances were measured from the center of mass of the interface. The above model has a goodness of fit (R2) value of 0.92 and a correlation coefficient of 0.96, with a mean absolute error of 0.27 and mean squared error of 0.30. The goodness of fit is represented graphically as a plot of experimental and predicted values of ΔG (Fig. 2).
FIGURE 2.
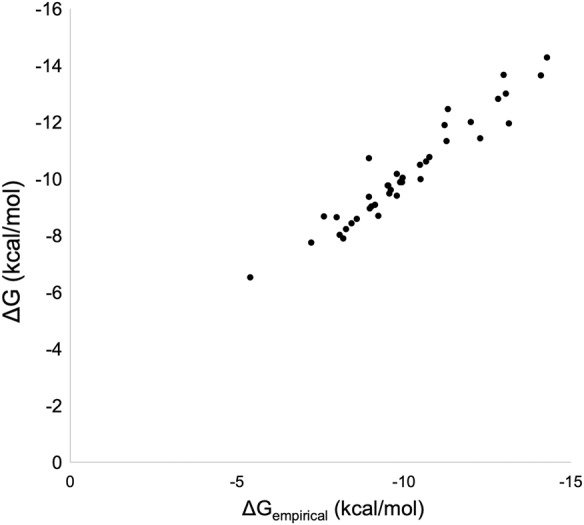
Observed ΔG (in kcal/mol) versus predicted ΔGempirical (in kcal/mol) for the training data set.
The intrinsic variability embedded in different experimental techniques for measuring the binding affinity may account for the difference between the predicted and the experimental values. To test the validity of the model building process, different models were trained on data derived from a single experimental method. The experimental methods A, B, C, and E were used to train the models. The number of data points available for experimental methods D and F was not sufficient to train mathematical models. Equations 2 to 5 represent the best models from training using data from A, B, C, and E, respectively:
| (2) |
| (3) |
| (4) |
| (5) |
The models trained were tested on the data set and the results are shown in Figure 3. The variable sensitivity report for all the models is available in Supplemental Table S3.
FIGURE 3.
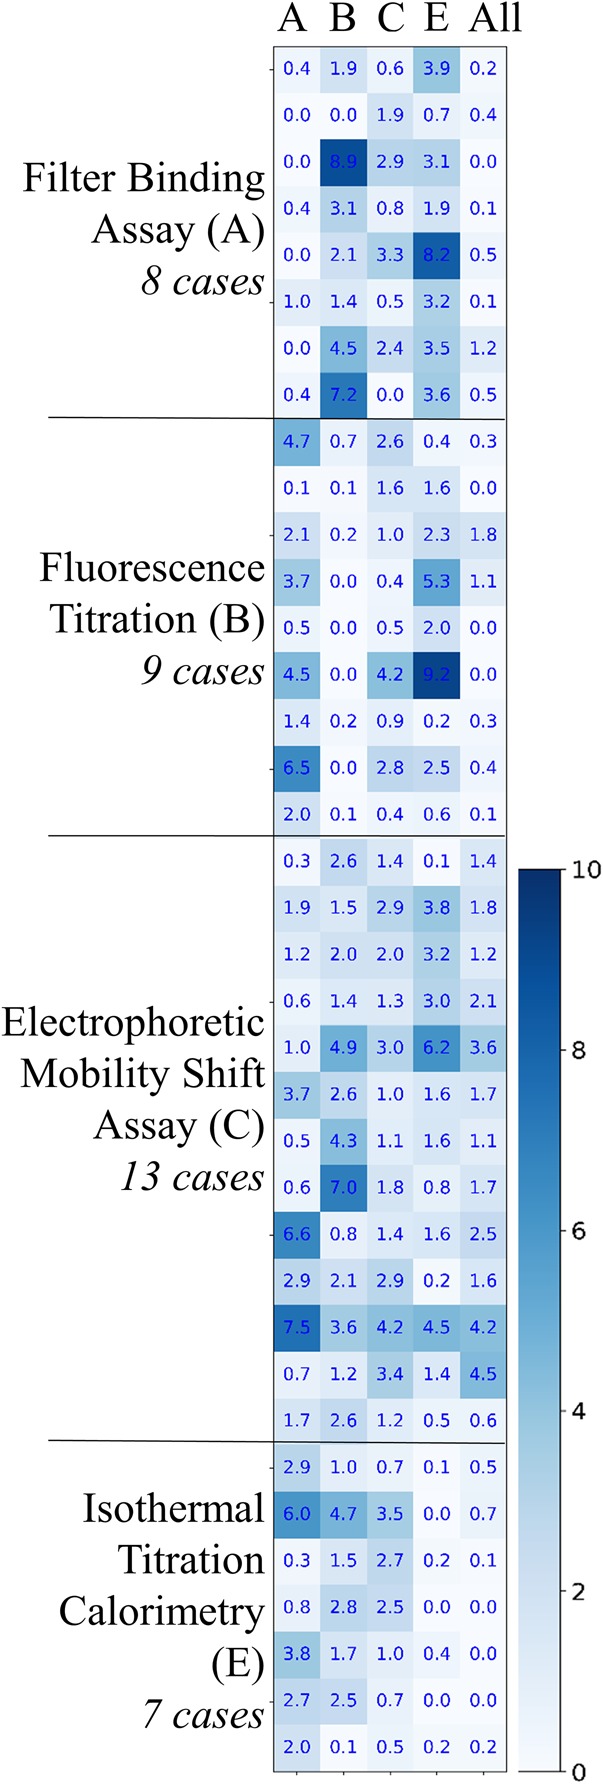
A comparison of predictions for models trained on four data sets segregated based on the experimental method as well as the overall training data set. The four segregated data sets include Kd values determined by filtration assay (A), fluorescence titration (B), EMSA (C), and ITC (E). The number of data points available for Kd determined by two experimental methods, binding kinetics (D) and SPR (F), was not sufficient to train independent mathematical models.
Validation of the mathematical model on the test data set
The model was tested on a data set of ΔG values curated from literature for yeast aspartyl-tRNA synthetase (AspRS) (Eriani and Gangloff 1999). Experimentally determined ΔG values for 40 mutations are available for this complex. Yeast AspRS (PDB ID: 1ASY) representing the various mutated residues at interface and noninterface regions is shown in Figure 4. We modeled each of these mutated structures using the native structure as the template. The various structural and physicochemical parameters were calculated for the mutated structures and the ΔGempirical values were calculated using the developed model (Supplemental Table S4). The predicted ΔGempirical and experimental ΔG are presented as a scatter plot in Figure 5. The standard error, the mean absolute error, and the percentage relative error observed in this prediction are 1.69%, 1.42%, and 16.95% (Supplemental Table S4), respectively.
FIGURE 4.
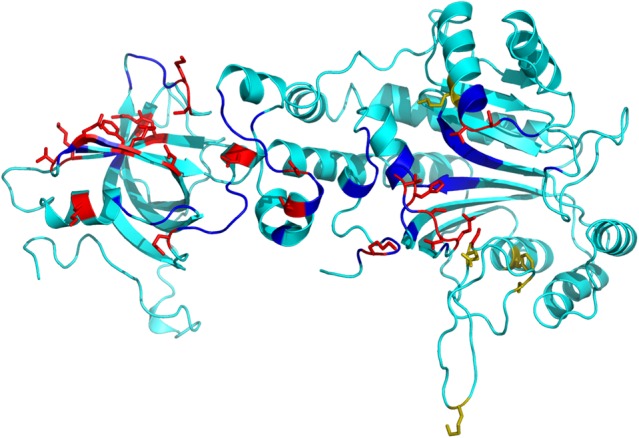
Mutated residues in yeast Asp-tRNA synthetase (PDB ID: 1ASY). The interface and the noninterface residues are shown in blue and cyan, respectively. The residues mutated at the interface are shown in red, whereas those at the noninterface region are shown in olive.
FIGURE 5.
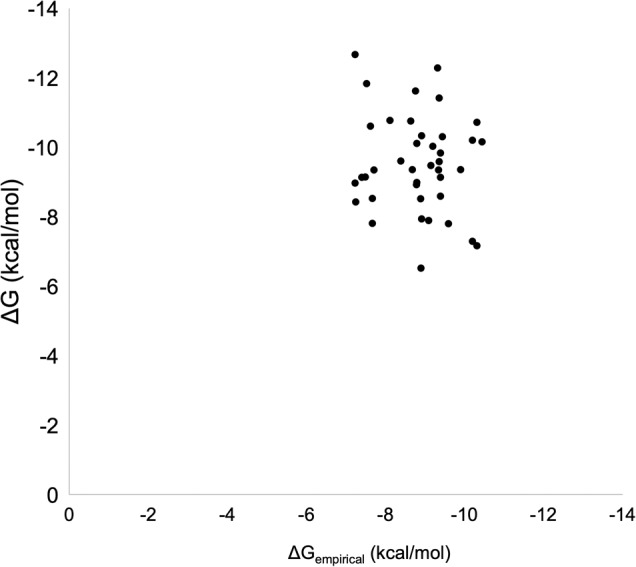
Observed ΔG (in kcal/mol) versus predicted ΔGempirical (in kcal/mol) for the substitutions in yeast Asp-tRNA synthetase.
DISCUSSION
The availability of experimental binding affinity values facilitates correlating them with the structural data available from the 3D structure determination methods. The binding affinity measures the strength of the association between the biomolecules, and because of the difficulty to measure them directly from the experiments in some specific systems, efforts have been made to estimate them from the correlation derived from the structural data. This effort is very successful in the case of protein–protein complexes correlating the binding free energy with the buried surface area (Chothia and Janin 1975; Guharoy and Chakrabarti 2005). The affinity benchmark for protein–protein complexes (Kastritis et al. 2011; Vreven et al. 2015) facilitates the progress of the theoretical models that uses 3D atomic structures to predict the binding free energy. This was started almost 29 years ago by Horton and Lewis (1992), with a handful of experimental dissociation constants curated from the literature. Since then, many computational methods have been developed based on empirical, semi-empirical, or knowledge-based approaches, which predict the binding affinity of protein–protein (Baker and Murphy 1998; Ma et al. 2002; Audie and Scarlata 2007; Kastritis et al. 2011; Tian et al. 2012; Janin 2014; Xue et al. 2016), protein–ligand (Böhm 1994; Eldridge et al. 1997; Mitchell et al. 1999; Gilson and Zhou 2007; Kim and Skolnick 2008; Ballester and Mitchell 2010), and protein–DNA complexes (Selvaraj et al. 2002; Zhang et al. 2005) with varied success. However, because of lack of availability of data, implementation of these methods on protein–RNA complexes is still in its infancy (Yang et al. 2014). The success of all these binding affinity prediction methods partially depends on the quality of the data, which can often be contaminated by incorrect Kd values or by the association of Kd with incorrect PDB entries due to human error during the literature search. However, even for a high-quality data set, these methods fail to predict the binding affinity correctly because of the lack of accountability for the conformational changes during the binding process.
In this current study, we have developed a structure-based mathematical model for the prediction of protein–RNA binding affinity values. The model was trained on a curated data set of protein–RNA binding affinity available in the literature. In addition, the model was further validated on a protein–RNA complex, for which the binding affinity values of 40 mutations are available in the literature. The affinity benchmark for the protein–protein complexes includes 179 entries (Vreven et al. 2015); however, because of the scarcity of data on protein–RNA complexes, we are restricted here to only 40 entries. Our data set is not only diverse in terms of the RNA structural classes with complexes involving tRNA and ribosomal RNA to duplex and single-stranded RNA, but also diverse in terms of the partners’ affinity with Kd ranging between 10−4 M and 10−11 M. This data set also represents a wide variety of complexes, resembling rigid body, semiflexible, and full flexible based on the conformational changes upon complex formation (Bahadur et al. 2008).
In the present data set of protein–RNA binding affinity, the linear correlations (Pearson correlation coefficient r) between ΔG and i-rmsd and between ΔG and p-rmsd are mediocre, −0.41 and −0.51, respectively. However, there is no observable correlation between ΔG and interface area (B) and between ΔG and c-rmsd for the entire data set (Table 3). In the unbound–unbound class, there exists a good correlation between ΔG and i-rmsd (r = −0.91). Except in class A, a mixed correlation is observed between the affinity and the structural parameters among different structural classes. We have calculated the free energy gain upon complex formation (the free energy per unit buried surface area of the protein–RNA complex), which is −5.7 cal/mol/Å2 for the entire data set (Table 2). This gain is maximum for the complexes with ribosomal proteins (−7.0 cal/mol/Å2) and minimum for the complexes with tRNA (−2.7 cal/mol/Å2). For the other two structural classes, this value is −5.6 cal/mol/Å2 (complexes with duplex RNA) and −5.9 cal/mol/Å2 (complexes with single-stranded RNA). We did not obtain a correlation coefficient of >0.73 in any class or in any temperature category. This may be attributed to the effect of temperature, pH, and ionic strength on the measurement of Kd. This is evident in our data set as the temperature, pH, and ionic strength are different for different experimental measurements.
The curated data set was trained to develop a mathematical model to predict the values of binding free energy of protein–RNA complexes from the structural parameters. The mathematical model developed in this study depends on structural and physicochemical parameters of both the bound and the unbound structures, namely, the fraction of nonpolar protein atoms at the interface, the interface rmsd, and the distribution of water molecules at the interface. Previous reports show that these three parameters play crucial roles in determining protein–RNA recognition (Bahadur et al. 2008; Barik and Bahadur 2014; Barik et al. 2015, 2016). Furthermore, these parameters were also used quite efficiently by many research groups to address various issues in macromolecular recognition (Jayaram and Jain 2004; Rodier et al. 2005; Li and Lazaridis 2007; Teyra and Pisabarro 2007; Janin and Bahadur 2008; Reichmann et al. 2008; Hou et al. 2011; Barik and Bahadur 2014; Barik et al. 2015, 2016). For example, they are quite efficient in discriminating the biological interfaces from the crystal contacts in protein–protein complexes (Bahadur et al. 2004; Rodier et al. 2005; Janin et al. 2008; Terribilini 2008; Iwakiri et al. 2012) and are useful in efficient scoring function for macromolecular docking (Chen et al. 2004; Zheng et al. 2007; Setny and Zacharias 2011; Tuszynska and Bujnicki 2011; Zhao et al. 2011; Li et al. 2012; Huang et al. 2013, 2016; Huang and Zou 2014) and the prediction of binding affinity and binding hotspots (Yang et al. 2014; Barik et al. 2016; Krüger et al. 2018; Pan et al. 2018). The model depends on the fraction of nonpolar interface area, , which measures the hydrophobicity at the binding sites. It is evident that the protein–RNA binding is often driven by the conformational changes, and the mathematical model includes the effect of conformational flexibility in the empirical estimation of binding free energy. The model has two terms with this parameter. In the first term, the relationship is inverse, and this shows that a highly polar interface is preferred for RNA binding. This is typical of protein–RNA interfaces, as the polar residues contribute significantly to the binding to the negatively charged phosphate of RNA (Bahadur et al. 2008; Barik et al. 2015). Moreover, the nonpolar region of the interface undergoes significant conformational changes and higher changes in accessible surface area (Mukherjee and Bahadur 2018). The dependence of binding affinity on the parameter dr indicates the important role played by the water molecules in protein–RNA recognition (Barik and Bahadur 2014; Barik et al. 2016). The dr values indicate the relative hydration of protein–RNA recognition sites. Previous studies have demonstrated that the water-binding sites at the protein–RNA interfaces vary significantly from the protein–protein interfaces (Rodier et al. 2005; Barik and Bahadur 2014; Mukherjee et al. 2019). The contribution of water-mediated interactions at the protein–RNA interfaces is significantly higher than at the protein–protein interfaces, and a substantial amount of these interactions are mediated by the 2′ OH group of the ribose sugar. The mathematical model trained in this study shows that the “dr” values contribute significantly to the ΔGempirical values. This can be attributed to the higher number of water-mediated interactions at the protein–RNA interface.
The model was tested on AspRS (PDB ID: 1ASY), for which experimentally determined affinity values of 40 mutations are available (Eriani and Gangloff 1999), which were not used in the training data set. Of these 40 mutations, 29 are single, 10 are double, and one is a triple mutant (Supplemental Table S4). All the affinity values for the native and mutant structures were measured using nitrocellulose binding assay (Eriani and Gangloff 1999). The majority (35) of these mutations are at the interface, whereas only five are at the noninterface region. Our model predicted the affinity values of 29 (75%) mutants with an absolute error of < 2 kcal/mol. In the case of eight mutants, the absolute error is within a limit of 3.5 kcal/mol. The remaining two cases, in which the absolute error is >3.5 kcal/mol, are double mutants at the interface. In these two cases, the ΔΔG values are significantly higher, 2.68 and 2.97 kcal/mol.
The different amino acid substitutions in AspRS were at four different binding regions: the terminal A binding region, the acceptor arm binding region, the anticodon loop binding region and the central core binding region (Eriani and Gangloff 1999). The terminal A binding region does not influence the binding of tRNA to AspRS in the ground state and is involved in acylation. The prediction model shows the lowest root mean squared error (RMSE)—0.83 kcal/mol—for these cases. The predicted values in substitutions on the anticodon binding region and central core binding region show comparable RMSEs with 1.99 kcal/mol and 1.91 kcal/mol, respectively, whereas the predictions for substitutions at the acceptor arm binding region show a slightly lower RMSE of 1.66 kcal/mol. The predicted values for double substitutions involving both anticodon loop binding and acceptor arm binding regions show the highest RMSE—2.64 kcal/mol (Supplemental Table S4). While testing the mathematical model using the mutant structures of yeast AspRS, the mean standard error, the mean absolute error, and the mean percentage relative error observed are 1.69%, 1.42%, and 16.95%, respectively. However, the correlation coefficient between the experimental ΔG and predicted ΔGempirical values is poor (R2 = 0.12). This poor correlation coefficient may be attributed to two reasons: the errors introduced by modeling and the poor estimate of dr values from the modeled complexes. The template-based modeling technique is unable to recapitulate the structural changes introduced by the alanine substitutions (Fiser 2010). The higher RMSE values observed for the double mutants may be attributed to the modeling error. However, for the mutants with higher ΔΔG values, we observe higher relative error in the predicted ΔGempirical. The changes in binding affinity can be quantified in terms of ΔΔG and are indicative of the structural changes in the protein that affects the RNA binding. The correlation coefficient between the experimental and predicted ΔG values is 0.29 for mutants with ΔΔG ≤ 1.5 kcal/mol. To estimate the dr value with better accuracy, we chose a subset of eight mutants with alanine substitutions at the protein–RNA interface with ΔΔG ≤ 2.0 kcal/mol and solvated them. The solvated structures were further minimized and equilibrated and used to estimate the dr values (Supplemental Table S5). The current force fields available for simulations of protein–RNA complexes have their own limitations (Šponer et al. 2018), which might add additional errors to the modeled structures. Despite this, the correlation between experimental ΔG and predicted ΔGempirical values improves from 0.17 to 0.75 for this subset of mutants. Moreover, for this subset of eight mutants, the RMSE values improve from 1.41 kcal/mol to 0.51 kcal/mol. The prediction accuracy is very much dependent on the quality and accuracy of the experimental data. The temperature, pH, ionic condition, and intrinsic variability embedded in different techniques may also account for the difference between predicted ΔGempirical and experimental ΔG values.
Conclusion
The protein–RNA binding affinity data set curated in this study contains a wide variety of complexes in terms of their structural classes as well as their cellular functions. Moreover, the complexes have a wide range of affinities in which the dissociation constant spans eight orders of magnitude. This data set should be a valuable resource for the computational structural biologists attempting to predict the binding affinity from atomic structures and will also stimulate the development of novel methods accounting for the flexibility in the assembly formation. The major challenges in making this data set are the paucity of binding affinity data and their reliable curation from the literature. The curated data set of affinity values was used to develop a structure-based mathematical model for predicting the binding affinity of protein–RNA complexes. The model developed in this study is highly accurate and can be deployed for finding the affinity of all known protein–RNA complexes. This model will enhance our understanding of the structural basis of protein–RNA binding affinity and may be valuable to the experimentalists aiming to engineer protein–RNA interfaces with desired affinity.
MATERIALS AND METHODS
The data set of binding affinity
The protein–RNA docking benchmark was used to get the data set of protein–RNA complexes for which bound and unbound structures are available (Nithin et al. 2017). The binding affinity values were manually curated from the available literature. The publications available as references for the atomic structures submitted in the PDB were checked for the corresponding Kd values. When the values were not found in the primary citation, they were found by conducting an exhaustive search by clicking the button “Search Related Articles in PubMed.” The experimental Kd values were taken only if the protein from the publication was the same as that in the published crystal structure and if there was a match in the organism name. In most of the cases, when the reported Kd values were taken from sources other than the published X-ray structure in the PDB, the affinity measurements were done on protein samples or genetic constructs that were different from the X-ray studies and under different experimental conditions. The various experimental methods used to calculate the dissociation constants are the filter binding assay (Rio 2012), EMSA (Ryder et al. 2008), fluorescence spectroscopy (Vivian and Callis 2001), kinetic study (Goodrich and Kugel 2015), ITC (Feig 2009), and SPR (Katsamba et al. 2002). The temperature, pH, and the experimental conditions were recorded for all 40 cases from the same publication if available or from the references or protocols followed by the authors. The Gibbs free energy of dissociation was calculated by taking the temperature stated and using the following equation (c0 = 1M standard state):
| (6) |
Structural and physicochemical parameters used in the prediction of binding affinity
The following parameters of protein–RNA interfaces were considered in the prediction model: number of amino acids, number of nucleotides, number of interface water molecules, number of preserved interface waters, number of water bridges, dr (parameter to quantify the dry and wet protein–RNA interfaces), number of hydrogen bonds, fraction of nonpolar area on the protein and the RNA sides, fraction of buried atoms on the protein and the RNA sides, local density (LD) indices on the protein and the RNA sides, number of salt bridges and stacking interactions, shape complementarity index, and gap volume (GV) index. All these parameters are calculated following Barik et al. (2015) and Barik and Bahadur (2014).
The size of the protein–RNA interfaces was estimated by measuring the solvent accessible surface area (SASA) buried in the contact. The interface area (B) is the sum of the SASA of the two components less that of the complex and was calculated using the PRince web server (Barik et al. 2012a). The SASA values were measured with the program Naccess (Hubbard and Thornton 1993), which implements the Lee and Richards (1971) algorithm with a probe radius of 1.4 Å and default group radii:
| (7) |
During complex formation, an atom may lose its SASA completely and thus become fully buried in the interface. Those atoms that lose SASA upon complexation were identified as the interface atoms. The fraction of such buried atoms (fbu) was calculated at the binding regions on both the protein and the RNA side of the interface using the following equation:
| (8) |
Although fbu measures the compactness of the atomic packing at the interface, the LD index is used to measure the atomic density at each point of the interface (Bahadur et al. 2004). In brief, LD is defined as the mean number of interface atoms that are within 12 Å of another interface atom. If an interface has N atoms, and if ni atoms are within a distance of 12 Å from a given interface atom i, the LD for that subunit is calculated as below:
| (9) |
Hydrogen bonds (H-bonds) at the protein–RNA interfaces were calculated using the software HBPLUS (McDonald and Thornton 1994) with default parameters. The salt bridges at protein–RNA interfaces were calculated when the distance between the side-chain nitrogen atoms of positively charged residues and the negatively charged phosphate group of the nucleotides is within 4 Å (Barlow and Thornton 1983; Xu et al. 1997). Stacking interactions at protein–RNA interfaces are usually defined as the π–π interactions that can occur between the side chains of Tyr, Trp, Phe, His, and the RNA bases. Moreover, the π–π and π-cation stacking of Arg through its guanidinium moiety with nucleosides were included in the calculation of stacking interactions (Allers and Shamoo 2001). The planes were defined at both sides by considering the atoms constituting the aromatic rings, and the center of the plane was calculated as the midpoint of all these atoms. The cutoff distance between the centers of both the planes was kept at ≤5 Å, and the dihedral angle between the two planes was constrained to ≤30° (Allers and Shamoo 2001). The stagger angle is defined as the angle between the normal to the first plane and the vector joining the centers of the two planes. The shape correlation index (Sc) (Lawrence and Colman 1993; Allers and Shamoo 2001) was used to quantify the shape complementarity at protein–RNA interfaces. Atomic packing at protein–RNA interfaces was also evaluated using the gap volume index (GV) (Jones and Thornton 1996) given by the following equation:
| (10) |
The GV for each complex was calculated using the SURFNET program (Laskowski 1995).
The structural parameter dr was used to quantitatively define the distribution of the water molecules at the protein–RNA interface. Briefly, dr is a ratio of the average distance of interface water molecules to the average distance of interface atoms contributed by the protein and the RNA chains. In both cases, distances were measured from the center of mass of the interface:
| (11) |
The superposition of the structures was performed using the distance matrix alignment method implemented in the Dali server (Holm and Laakso 2016). The root-mean-squared displacement (rmsd) values were calculated from the interface amino acids and nucleotides after superposing the respective bound and unbound structures of the protein and the RNA components when available in their free form. For each polypeptide chain, c-rmsd was calculated, which is the displacement of all the equivalent Cα atoms between the superposed bound and the unbound proteins. For the RNA chains, the p-rmsd values were calculated in a similar way over the superposed equivalent backbone phosphorus (P) atoms. Interface rmsd (i-rmsd) values were calculated for each complex considering only the equivalent Cα atoms of the interface residues and/or the equivalent P atoms of the interface nucleotides. The different structural and physicochemical parameters used in this study are available in Supplemental Table S1.
Development of the mathematical model for prediction of binding affinity
The mathematical models were generated using regression analysis following Schmidt and Lipson (2009) implemented in Eureqa software. The different physicochemical and structural parameters for the protein–RNA complexes were provided as inputs to the software. The data set was split randomly into a training data set and a validation data set by the Eureqa software used in this study. The training set is used to generate and optimize solutions, and the validation set is used to test how well those models generalize to new data. Eureqa also uses the validation data to filter out the best models. The following mathematical operations were applied to the input variables while searching for equations that fit the input data: addition, subtraction, multiplication, division, sine, cosine, and constants. For each pair of variables, the numerical partial derivatives were calculated, and these partial derivatives were used to evaluate the symbolic functions generated in the subsequent steps. Candidate symbolic functions were generated to represent the relationship between different parameters provided as input. Initially, these functions generated were random; however, the subsequent filtering of the generated equations allows them to converge to the mathematical representation of input data. In symbolic regression, many initial random symbolic equations compete to model input data in the most parsimonious way. New equations are formed by recombining previous equations and probabilistically varying their subexpressions. The equations that model the input data well were retained, whereas unpromising solutions were removed. To evaluate the predictive ability, the partial derivatives for each pair of variables were computed for the candidate functions, and cross-validation analysis was performed with the partial derivatives derived from the input data. The best matching equations were selected, and this process was repeated iteratively until the predictive ability of these equations reached sufficient accuracy. The most parsimonious equation generated from this process was returned as the best mathematical model (Fig. 6). For each equation, the predictive ability is measured in terms of goodness of fit (R2), correlation coefficient, maximum error, mean squared error, and mean absolute error. The equations with R2 ≥ 0.80 were selected as plausible models (Supplemental Table S2). The best fit model was selected from these plausible models, and used for predicting the ΔGempirical.
FIGURE 6.

Schematic representation of the workflow followed in mathematical modeling for prediction of binding affinity in protein–RNA complexes.
Validation of the mathematical model on a test data set
The model was tested on a data set generated using mutated structures of yeast AspRS, which reports experimentally determined ΔG values of 40 mutations (Eriani and Gangloff 1999). The experimental Kd values were used to calculate both ΔG (using Equation 6) and ΔΔG values of the mutants (using Equation 12):
| (12) |
The wild-type PDB structures (PDB ID: 1ASY, IEOV) were used as the templates for modeling all the bound and unbound forms of the proteins with alanine substitutions. The modeling and energy minimization were performed using Modeler (Webb and Sali 2016). The energy-minimized modeled structures are used to calculate structural and physicochemical parameters described above for evaluating the mathematical model for predicting ΔG. For each of the 40 mutant structures, the ΔGempirical was calculated using the equation modeled in this study. To evaluate the accuracy of predictions, the RMSE was calculated using the following equation:
| (13) |
A subset of eight mutants with ΔΔG ≤ 2.0 kcal/mol was further optimized using AMBER. The complexes and their unbound structures were solvated using the TIP3P (Sun and Kollman 1995) water model with a truncated octahedral box of 10 Å. The solvated structures were energy-minimized for 10,000 cycles with restraint, followed by 10,000 cycles without restraint. The minimized structures were subjected to heating, density equilibration, and short runs of equilibration. The heating was done from 100 K to 300 K for 500 psec with restraints on the entire structure. The density equilibration was performed for 500 psec with restraints on the entire structure. The equilibration of the structures was run for four short rounds. The first three rounds of equilibration were run for 200 psec each with main chain atoms constrained. The final round of equilibration was performed for 2 nsec. Amber ff14sb force field (Maier et al. 2015) and χOL3 (Banáš et al. 2010; Zgarbová et al. 2011) were used for this study. The minimization was performed using Sander, and the subsequent steps were performed using the CUDA version of PMEMD available in the AMBER package (Götz et al. 2012; Le Grand et al. 2013; Salomon-Ferrer et al. 2013).
SUPPLEMENTAL MATERIAL
Supplemental material is available for this article.
Supplementary Material
ACKNOWLEDGMENTS
We thank Professor Joël Janin of Université Paris Sud, Orsay for the cross-validation of the data set and for the critical reading of the manuscript. C.N. thanks IIT Kharagpur for his fellowship. S.M. thanks the Council of Scientific & Industrial Research (CSIR)-University Grants Commission (UGC) and IIT Kharagpur for his fellowship. R.P.B. is thankful to CSIR, India.
Footnotes
Article is online at http://www.rnajournal.org/cgi/doi/10.1261/rna.071779.119.
REFERENCES
- Allers J, Shamoo Y. 2001. Structure-based analysis of protein–RNA interactions using the program ENTANGLE. J Mol Biol 311: 75–86. 10.1006/jmbi.2001.4857 [DOI] [PubMed] [Google Scholar]
- Audie J, Scarlata S. 2007. A novel empirical free energy function that explains and predicts protein–protein binding affinities. Biophys Chem 129: 198–211. 10.1016/j.bpc.2007.05.021 [DOI] [PubMed] [Google Scholar]
- Bahadur RP, Chakrabarti P, Rodier F, Janin J. 2004. A dissection of specific and non-specific protein–protein interfaces. J Mol Biol 336: 943–955. 10.1016/j.jmb.2003.12.073 [DOI] [PubMed] [Google Scholar]
- Bahadur RP, Zacharias M, Janin J. 2008. Dissecting protein–RNA recognition sites. Nucleic Acids Res 36: 2705–2716. 10.1093/nar/gkn102 [DOI] [PMC free article] [PubMed] [Google Scholar]
- Bahadur RP, Kannan S, Zacharias M. 2009. Binding of the bacteriophage P22 N-peptide to the boxB RNA motif studied by molecular dynamics simulations. Biophys J 97: 3139–3149. 10.1016/j.bpj.2009.09.035 [DOI] [PMC free article] [PubMed] [Google Scholar]
- Baker BM, Murphy KP. 1998. Prediction of binding energetics from structure using empirical parameterization. Methods Enzymol 295: 294–315. 10.1016/S0076-6879(98)95045-5 [DOI] [PubMed] [Google Scholar]
- Ballester PJ, Mitchell JB. 2010. A machine learning approach to predicting protein–ligand binding affinity with applications to molecular docking. Bioinformatics 26: 1169–1175. 10.1093/bioinformatics/btq112 [DOI] [PMC free article] [PubMed] [Google Scholar]
- Banáš P, Hollas D, Zgarbová M, Jurečka P, Orozco M, Cheatham TE III, Šponer J, Otyepka M. 2010. Performance of molecular mechanics force fields for RNA simulations: stability of UUCG and GNRA hairpins. J Chem Theory Comput 6: 3836–3849. 10.1021/ct100481h [DOI] [PMC free article] [PubMed] [Google Scholar]
- Barbas A, Matos RG, Amblar M, López-Viñas E, Gomez-Puertas P, Arraiano CM. 2008. New insights into the mechanism of RNA degradation by ribonuclease II: identification of the residue responsible for setting the RNase II end product. J Biol Chem 283: 13070–13076. 10.1074/jbc.M709989200 [DOI] [PubMed] [Google Scholar]
- Barik A, Bahadur RP. 2014. Hydration of protein-RNA recognition sites. Nucleic Acids Res 42: 10148–10160. 10.1093/nar/gku679 [DOI] [PMC free article] [PubMed] [Google Scholar]
- Barik A, Mishra A, Bahadur RP. 2012a. PRince: a web server for structural and physicochemical analysis of protein-RNA interface. Nucleic Acids Res 40: W440–W444. 10.1093/nar/gks535 [DOI] [PMC free article] [PubMed] [Google Scholar]
- Barik A, Nithin C, Manasa P, Bahadur RP. 2012b. A protein–RNA docking benchmark (I): nonredundant cases. Proteins 80: 1866–1871. 10.1002/prot.24083 [DOI] [PubMed] [Google Scholar]
- Barik A, Nithin C, Pilla SP, Bahadur RP. 2015. Molecular architecture of protein–RNA recognition sites. J Biomol Struct Dyn 33: 2738–2751. 10.1080/07391102.2015.1004652 [DOI] [PubMed] [Google Scholar]
- Barik A, Nithin C, Karampudi NB, Mukherjee S, Bahadur RP. 2016. Probing binding hot spots at protein–RNA recognition sites. Nucleic Acids Res 44: e9 10.1093/nar/gkv876 [DOI] [PMC free article] [PubMed] [Google Scholar]
- Barlow DJ, Thornton JM. 1983. Ion-pairs in proteins. J Mol Biol 168: 867–885. 10.1016/S0022-2836(83)80079-5 [DOI] [PubMed] [Google Scholar]
- Batey RT, Sagar MB, Doudna JA. 2001. Structural and energetic analysis of RNA recognition by a universally conserved protein from the signal recognition particle. J Mol Biol 307: 229–246. 10.1006/jmbi.2000.4454 [DOI] [PubMed] [Google Scholar]
- Berman HM, Battistuz T, Bhat TN, Bluhm WF, Bourne PE, Burkhardt K, Feng Z, Gilliland GL, Iype L, Jain S, et al. 2002. The Protein Data Bank. Acta Crystallogr D Biol Crystallogr 58: 899–907. 10.1107/S0907444902003451 [DOI] [PubMed] [Google Scholar]
- Beuth B, Pennell S, Arnvig KB, Martin SR, Taylor IA. 2005. Structure of a Mycobacterium tuberculosis NusA-RNA complex. EMBO J 24: 3576–3587. 10.1038/sj.emboj.7600829 [DOI] [PMC free article] [PubMed] [Google Scholar]
- Böhm HJ. 1994. The development of a simple empirical scoring function to estimate the binding constant for a protein–ligand complex of known three-dimensional structure. J Comput Aided Mol Des 8: 243–256. 10.1007/BF00126743 [DOI] [PubMed] [Google Scholar]
- Chakrabarti S, Jayachandran U, Bonneau F, Fiorini F, Basquin C, Domcke S, Le Hir H, Conti E. 2011. Molecular mechanisms for the RNA-dependent ATPase activity of Upf1 and its regulation by Upf2. Mol Cell 41: 693–703. 10.1016/j.molcel.2011.02.010 [DOI] [PubMed] [Google Scholar]
- Chao JA, Lee JH, Chapados BR, Debler EW, Schneemann A, Williamson JR. 2005. Dual modes of RNA-silencing suppression by Flock House virus protein B2. Nat Struct Mol Biol 12: 952–957. 10.1038/nsmb1005 [DOI] [PubMed] [Google Scholar]
- Chao JA, Patskovsky Y, Almo SC, Singer RH. 2008. Structural basis for the coevolution of a viral RNA-protein complex. Nat Struct Mol Biol 15: 103–105. 10.1038/nsmb1327 [DOI] [PMC free article] [PubMed] [Google Scholar]
- Chen Y, Kortemme T, Robertson T, Baker D, Varani G. 2004. A new hydrogen-bonding potential for the design of protein–RNA interactions predicts specific contacts and discriminates decoys. Nucleic Acids Res 32: 5147–5162. 10.1093/nar/gkh785 [DOI] [PMC free article] [PubMed] [Google Scholar]
- Cheng A, Wong SM, Yuan YA. 2009. Structural basis for dsRNA recognition by NS1 protein of influenza A virus. Cell Res 19: 187–195. 10.1038/cr.2008.288 [DOI] [PubMed] [Google Scholar]
- Chiba S, Itoh Y, Sekine S, Yokoyama S. 2010. Structural basis for the major role of O-phosphoseryl-tRNA kinase in the UGA-specific encoding of selenocysteine. Mol Cell 39: 410–420. 10.1016/j.molcel.2010.07.018 [DOI] [PubMed] [Google Scholar]
- Chothia C, Janin J. 1975. Principles of protein–protein recognition. Nature 256: 705–708. 10.1038/256705a0 [DOI] [PubMed] [Google Scholar]
- Draper DE. 1999. Themes in RNA–protein recognition. J Mol Biol 293: 255–270. 10.1006/jmbi.1999.2991 [DOI] [PubMed] [Google Scholar]
- Du X, Li Y, Xia Y-L, Ai S-M, Liang J, Sang P, Ji X-L, Liu S-Q. 2016. Insights into protein-ligand interactions: mechanisms, models, and methods. Int J Mol Sci 17: 144 10.3390/ijms17020144 [DOI] [PMC free article] [PubMed] [Google Scholar]
- Eldridge MD, Murray CW, Auton TR, Paolini GV, Mee RP. 1997. Empirical scoring functions: I. The development of a fast empirical scoring function to estimate the binding affinity of ligands in receptor complexes. J Comput Aided Mol Des 11: 425–445. 10.1023/A:1007996124545 [DOI] [PubMed] [Google Scholar]
- Ellis JJ, Broom M, Jones S. 2007. Protein–RNA interactions: structural analysis and functional classes. Proteins 66: 903–911. 10.1002/prot.21211 [DOI] [PubMed] [Google Scholar]
- Eriani G, Gangloff J. 1999. Yeast aspartyl-tRNA synthetase residues interacting with tRNA(Asp) identity bases connectively contribute to tRNA(Asp) binding in the ground and transition-state complex and discriminate against non-cognate tRNAs. J Mol Biol 291: 761–773. 10.1006/jmbi.1999.3012 [DOI] [PubMed] [Google Scholar]
- Feig AL. 2009. Studying RNA–RNA and RNA–protein interactions by isothermal titration calorimetry. Methods Enzymol 468: 409–422. 10.1016/S0076-6879(09)68019-8 [DOI] [PMC free article] [PubMed] [Google Scholar]
- Fiser A. 2010. Template-based protein structure modeling. Methods Mol Biol 673: 73–94. 10.1007/978-1-60761-842-3_6 [DOI] [PMC free article] [PubMed] [Google Scholar]
- Ghisaidoobe ABT, Chung SJ. 2014. Intrinsic tryptophan fluorescence in the detection and analysis of proteins: a focus on Förster resonance energy transfer techniques. Int J Mol Sci 15: 22518–22538. 10.3390/ijms151222518 [DOI] [PMC free article] [PubMed] [Google Scholar]
- Gilson MK, Zhou HX. 2007. Calculation of protein–ligand binding affinities. Annu Rev Biophys Biomol Struct 36: 21–42. 10.1146/annurev.biophys.36.040306.132550 [DOI] [PubMed] [Google Scholar]
- Goodrich JA, Kugel JF. 2015. Studying the affinity, kinetic stability, and specificity of RNA/protein interactions: SINE ncRNA/Pol II complexes as a model system. Methods Mol Biol 1206: 165–178. 10.1007/978-1-4939-1369-5_15 [DOI] [PMC free article] [PubMed] [Google Scholar]
- Götz AW, Williamson MJ, Xu D, Poole D, Le Grand S, Walker RC. 2012. Routine microsecond molecular dynamics simulations with AMBER on GPUs. 1. Generalized born. J Chem Theory Comput 8: 1542–1555. 10.1021/ct200909j [DOI] [PMC free article] [PubMed] [Google Scholar]
- Guharoy M, Chakrabarti P. 2005. Conservation and relative importance of residues across protein–protein interfaces. Proc Natl Acad Sci 102: 15447–15452. 10.1073/pnas.0505425102 [DOI] [PMC free article] [PubMed] [Google Scholar]
- Hall KB, Kranz JK. 1999. Nitrocellulose filter binding for determination of dissociation constants. In RNA–protein interaction protocols (ed. Haynes SR), pp. 105–114. Humana Press, Totowa, NJ. [DOI] [PubMed] [Google Scholar]
- Hardin JW, Hu YX, McKay DB. 2010. Structure of the RNA binding domain of a DEAD-box helicase bound to its ribosomal RNA target reveals a novel mode of recognition by an RNA recognition motif. J Mol Biol 402: 412–427. 10.1016/j.jmb.2010.07.040 [DOI] [PMC free article] [PubMed] [Google Scholar]
- Hauenstein S, Zhang CM, Hou YM, Perona JJ. 2004. Shape-selective RNA recognition by cysteinyl-tRNA synthetase. Nat Struct Mol Biol 11: 1134–1141. 10.1038/nsmb849 [DOI] [PubMed] [Google Scholar]
- Hellman LM, Fried MG. 2007. Electrophoretic mobility shift assay (EMSA) for detecting protein-nucleic acid interactions. Nat Protoc 2: 1849–1861. 10.1038/nprot.2007.249 [DOI] [PMC free article] [PubMed] [Google Scholar]
- Holm L, Laakso LM. 2016. Dali server update. Nucleic Acids Res 44: W351–W355. 10.1093/nar/gkw357 [DOI] [PMC free article] [PubMed] [Google Scholar]
- Horton N, Lewis M. 1992. Calculation of the free energy of association for protein complexes. Protein Sci 1: 169–181. 10.1002/pro.5560010117 [DOI] [PMC free article] [PubMed] [Google Scholar]
- Hou T, Wang J, Li Y, Wang W. 2011. Assessing the performance of the MM/PBSA and MM/GBSA methods. 1. The accuracy of binding free energy calculations based on molecular dynamics simulations. J Chem Inf Model 51: 69–82. 10.1021/ci100275a [DOI] [PMC free article] [PubMed] [Google Scholar]
- Huang SY, Zou X. 2013. A nonredundant structure dataset for benchmarking protein–RNA computational docking. J Comput Chem 34: 311–318. 10.1002/jcc.23149 [DOI] [PMC free article] [PubMed] [Google Scholar]
- Huang SY, Zou X. 2014. A knowledge-based scoring function for protein–RNA interactions derived from a statistical mechanics-based iterative method. Nucleic Acids Res 42: e55 10.1093/nar/gku077 [DOI] [PMC free article] [PubMed] [Google Scholar]
- Huang DB, Vu D, Cassiday LA, Zimmerman JM, Maher LJ III, Ghosh G. 2003. Crystal structure of NF-κB (p50)2 complexed to a high-affinity RNA aptamer. Proc Natl Acad Sci 100: 9268–9273. 10.1073/pnas.1632011100 [DOI] [PMC free article] [PubMed] [Google Scholar]
- Huang Y, Liu S, Guo D, Li L, Xiao Y. 2013. A novel protocol for three-dimensional structure prediction of RNA–protein complexes. Sci Rep 3: 1887 10.1038/srep01887 [DOI] [PMC free article] [PubMed] [Google Scholar]
- Huang Y, Li H, Xiao Y. 2016. Using 3dRPC for RNA–protein complex structure prediction. Biophys Rep 2: 95–99. 10.1007/s41048-017-0034-y [DOI] [PMC free article] [PubMed] [Google Scholar]
- Hubbard SJ, Thornton JM. 1993. NACCESS: program for calculating accessibilities. Department of Biochemistry and Molecular Biology, University College, London. [Google Scholar]
- Iwakiri J, Tateishi H, Chakraborty A, Patil P, Kenmochi N. 2012. Dissecting the protein–RNA interface: the role of protein surface shapes and RNA secondary structures in protein–RNA recognition. Nucleic Acids Res 40: 3299–3306. 10.1093/nar/gkr1225 [DOI] [PMC free article] [PubMed] [Google Scholar]
- Janin J. 1995. Protein–protein recognition. Prog Biophys Mol Biol 64: 145–166. 10.1016/S0079-6107(96)00001-6 [DOI] [PubMed] [Google Scholar]
- Janin J. 2014. A minimal model of protein–protein binding affinities. Protein Sci 23: 1813–1817. 10.1002/pro.2560 [DOI] [PMC free article] [PubMed] [Google Scholar]
- Janin J, Bahadur RP. 2008. Relating macromolecular function and association: the structural basis of protein–DNA and RNA recognition. Cell Mol Bioeng 1: 327–338. 10.1007/s12195-008-0032-8 [DOI] [Google Scholar]
- Janin J, Bahadur RP, Chakrabarti P. 2008. Protein–protein interaction and quaternary structure. Q Rev Biophys 41: 133–180. 10.1017/S0033583508004708 [DOI] [PubMed] [Google Scholar]
- Jayaram B, Jain T. 2004. The role of water in protein–DNA recognition. Annu Rev Biophys Biomol Struct 33: 343–361. 10.1146/annurev.biophys.33.110502.140414 [DOI] [PubMed] [Google Scholar]
- Jia MZ, Horita S, Nagata K, Tanokura M. 2010. An archaeal Dim2-like protein, aDim2p, forms a ternary complex with a/eIF2α and the 3′ end fragment of 16S rRNA. J Mol Biol 398: 774–785. 10.1016/j.jmb.2010.03.055 [DOI] [PubMed] [Google Scholar]
- Jones S. 2001. Protein-RNA interactions: a structural analysis. Nucleic Acids Res 29: 943–954. 10.1093/nar/29.4.943 [DOI] [PMC free article] [PubMed] [Google Scholar]
- Jones S, Thornton JM. 1996. Principles of protein–protein interactions. Proc Natl Acad Sci 93: 13–20. 10.1073/pnas.93.1.13 [DOI] [PMC free article] [PubMed] [Google Scholar]
- Kastritis PL, Bonvin AM. 2010. Are scoring functions in protein–protein docking ready to predict interactomes? Clues from a novel binding affinity benchmark. J Proteome Res 9: 2216–2225. 10.1021/pr9009854 [DOI] [PubMed] [Google Scholar]
- Kastritis PL, Bonvin AM. 2013. On the binding affinity of macromolecular interactions: daring to ask why proteins interact. J R Soc Interface 10: 20120835 10.1098/rsif.2012.0835 [DOI] [PMC free article] [PubMed] [Google Scholar]
- Kastritis PL, Moal IH, Hwang H, Weng Z, Bates PA, Bonvin AM, Janin J. 2011. A structure-based benchmark for protein–protein binding affinity. Protein Sci 20: 482–491. 10.1002/pro.580 [DOI] [PMC free article] [PubMed] [Google Scholar]
- Katsamba PS, Park S, Laird-Offringa IA. 2002. Kinetic studies of RNA–protein interactions using surface plasmon resonance. Methods 26: 95–104. 10.1016/S1046-2023(02)00012-9 [DOI] [PubMed] [Google Scholar]
- Kauzmann W. 1959. Some factors in the interpretation of protein denaturation. Adv Protein Chem 14: 1–63. 10.1016/S0065-3233(08)60608-7 [DOI] [PubMed] [Google Scholar]
- Kim R, Skolnick J. 2008. Assessment of programs for ligand binding affinity prediction. J Comput Chem 29: 1316–1331. 10.1002/jcc.20893 [DOI] [PMC free article] [PubMed] [Google Scholar]
- Klotz IM. 1985. Ligand–receptor interactions: facts and fantasies. Q Rev Biophys 18: 227–259. 10.1017/S0033583500000354 [DOI] [PubMed] [Google Scholar]
- Kollman P. 1993. Free-energy calculations—applications to chemical and biochemical phenomena. Chem Rev 93: 2395–2417. 10.1021/cr00023a004 [DOI] [Google Scholar]
- Krüger DM, Neubacher S, Grossmann TN. 2018. Protein–RNA interactions: structural characteristics and hotspot amino acids. RNA 24: 1457–1465. 10.1261/rna.066464.118 [DOI] [PMC free article] [PubMed] [Google Scholar]
- Ladbury JE, Chowdhry BZ. 1996. Sensing the heat: the application of isothermal titration calorimetry to thermodynamic studies of biomolecular interactions. Chem Biol 3: 791–801. 10.1016/S1074-5521(96)90063-0 [DOI] [PubMed] [Google Scholar]
- Laskowski RA. 1995. SURFNET: a program for visualizing molecular surfaces, cavities, and intermolecular interactions. J Mol Graph 13: 323–330. 307-328 10.1016/0263-7855(95)00073-9 [DOI] [PubMed] [Google Scholar]
- Lawrence MC, Colman PM. 1993. Shape complementarity at protein/protein interfaces. J Mol Biol 234: 946–950. 10.1006/jmbi.1993.1648 [DOI] [PubMed] [Google Scholar]
- Lee B, Richards FM. 1971. The interpretation of protein structures: estimation of static accessibility. J Mol Biol 55: 379–400. 10.1016/0022-2836(71)90324-X [DOI] [PubMed] [Google Scholar]
- Le Grand S, Götz AW, Walker RC. 2013. SPFP: speed without compromise—a mixed precision model for GPU accelerated molecular dynamics simulations. Comput Phys Commun 184: 374–380. 10.1016/j.cpc.2012.09.022 [DOI] [Google Scholar]
- Li Z, Lazaridis T. 2007. Water at biomolecular binding interfaces. Phys Chem Chem Phys 9: 573–581. 10.1039/B612449F [DOI] [PubMed] [Google Scholar]
- Li X, Ranjith-Kumar CT, Brooks MT, Dharmaiah S, Herr AB, Kao C, Li P. 2009. The RIG-I-like receptor LGP2 recognizes the termini of double-stranded RNA. J Biol Chem 284: 13881–13891. 10.1074/jbc.M900818200 [DOI] [PMC free article] [PubMed] [Google Scholar]
- Li CH, Cao LB, Su JG, Yang YX, Wang CX. 2012. A new residue-nucleotide propensity potential with structural information considered for discriminating protein–RNA docking decoys. Proteins 80: 14–24. 10.1002/prot.23117 [DOI] [PubMed] [Google Scholar]
- Liu Z, Li Y, Han L, Li J, Liu J, Zhao Z, Nie W, Liu Y, Wang R. 2015. PDB-wide collection of binding data: current status of the PDBbind database. Bioinformatics 31: 405–412. 10.1093/bioinformatics/btu626 [DOI] [PubMed] [Google Scholar]
- Liu L, Xiong Y, Gao H, Wei DQ, Mitchell JC, Zhu X. 2018. dbAMEPNI: a database of alanine mutagenic effects for protein-nucleic acid interactions. Database (Oxford) 2018: bay034 10.1093/database/bay034 [DOI] [PMC free article] [PubMed] [Google Scholar]
- Locatelli GA, Spadari S, Maga G. 2002. Hepatitis C virus NS3 ATPase/helicase: an ATP switch regulates the cooperativity among the different substrate binding sites. Biochemistry 41: 10332–10342. 10.1021/bi026082g [DOI] [PubMed] [Google Scholar]
- Lunde BM, Hörner M, Meinhart A. 2011. Structural insights into cis element recognition of non-polyadenylated RNAs by the Nab3-RRM. Nucleic Acids Res 39: 337–346. 10.1093/nar/gkq751 [DOI] [PMC free article] [PubMed] [Google Scholar]
- Ma XH, Wang CX, Li CH, Chen WZ. 2002. A fast empirical approach to binding free energy calculations based on protein interface information. Protein Eng 15: 677–681. 10.1093/protein/15.8.677 [DOI] [PubMed] [Google Scholar]
- Maier JA, Martinez C, Kasavajhala K, Wickstrom L, Hauser KE, Simmerling C. 2015. ff14SB: improving the accuracy of protein side chain and backbone parameters from ff99SB. J Chem Theory Comput 11: 3696–3713. 10.1021/acs.jctc.5b00255 [DOI] [PMC free article] [PubMed] [Google Scholar]
- Martinez A, Opperman T, Richardson JP. 1996. Mutational analysis and secondary structure model of the RNP1-like sequence motif of transcription termination factor Rho. J Mol Biol 257: 895–908. 10.1006/jmbi.1996.0210 [DOI] [PubMed] [Google Scholar]
- McDonald IK, Thornton JM. 1994. Satisfying hydrogen bonding potential in proteins. J Mol Biol 238: 777–793. 10.1006/jmbi.1994.1334 [DOI] [PubMed] [Google Scholar]
- Miller MT, Higgin JJ, Hall TM. 2008. Basis of altered RNA-binding specificity by PUF proteins revealed by crystal structures of yeast Puf4p. Nat Struct Mol Biol 15: 397–402. 10.1038/nsmb.1390 [DOI] [PMC free article] [PubMed] [Google Scholar]
- Mitchell JBO, Laskowski RA, Alex A, Forster MJ, Thornton JM. 1999. BLEEP—potential of mean force describing protein–ligand interactions: II. Calculation of binding energies and comparison with experimental data. J Comput Chem 20: 1177–1185. [DOI] [Google Scholar]
- Moal IH, Agius R, Bates PA. 2011. Protein–protein binding affinity prediction on a diverse set of structures. Bioinformatics 27: 3002–3009. 10.1093/bioinformatics/btr513 [DOI] [PubMed] [Google Scholar]
- Mukherjee S, Bahadur RP. 2018. An account of solvent accessibility in protein–RNA recognition. Sci Rep 8: 10546 10.1038/s41598-018-28373-2 [DOI] [PMC free article] [PubMed] [Google Scholar]
- Mukherjee S, Nithin C, Divakaruni Y, Bahadur RP. 2019. Dissecting water binding sites at protein–protein interfaces: a lesson from the atomic structures in the Protein Data Bank. J Biomol Struct Dyn 37: 1204–1219. 10.1080/07391102.2018.1453379 [DOI] [PubMed] [Google Scholar]
- Murphy KP, Xie D, Garcia KC, Amzel LM, Freire E. 1993. Structural energetics of peptide recognition: angiotensin II/antibody binding. Proteins 15: 113–120. 10.1002/prot.340150203 [DOI] [PubMed] [Google Scholar]
- Nadassy K, Wodak SJ, Janin J. 1999. Structural features of protein–nucleic acid recognition sites. Biochemistry 38: 1999–2017. 10.1021/bi982362d [DOI] [PubMed] [Google Scholar]
- Nithin C, Mukherjee S, Bahadur RP. 2017. A non-redundant protein–RNA docking benchmark version 2.0. Proteins 85: 256–267. 10.1002/prot.25211 [DOI] [PubMed] [Google Scholar]
- Nithin C, Ghosh P, Bujnicki JM. 2018. Bioinformatics tools and benchmarks for computational docking and 3D structure prediction of RNA–protein complexes. Genes (Basel) 9: E432 10.3390/genes9090432 [DOI] [PMC free article] [PubMed] [Google Scholar]
- Oddone A, Lorentzen E, Basquin J, Gasch A, Rybin V, Conti E, Sattler M. 2007. Structural and biochemical characterization of the yeast exosome component Rrp40. EMBO Rep 8: 63–69. 10.1038/sj.embor.7400856 [DOI] [PMC free article] [PubMed] [Google Scholar]
- Oehler S, Alex R, Barker A. 1999. Is nitrocellulose filter binding really a universal assay for protein–DNA interactions? Anal Biochemi 268: 330–336. 10.1006/abio.1998.3056 [DOI] [PubMed] [Google Scholar]
- Okabe M, Tomita K, Ishitani R, Ishii R, Takeuchi N, Arisaka F, Nureki O, Yokoyama S. 2003. Divergent evolutions of trinucleotide polymerization revealed by an archaeal CCA-adding enzyme structure. EMBO J 22: 5918–5927. 10.1093/emboj/cdg563 [DOI] [PMC free article] [PubMed] [Google Scholar]
- Pagano JM, Clingman CC, Ryder SP. 2011. Quantitative approaches to monitor protein–nucleic acid interactions using fluorescent probes. RNA 17: 14–20. 10.1261/rna.2428111 [DOI] [PMC free article] [PubMed] [Google Scholar]
- Pan H, Agarwalla S, Moustakas DT, Finer-Moore J, Stroud RM. 2003. Structure of tRNA pseudouridine synthase TruB and its RNA complex: RNA recognition through a combination of rigid docking and induced fit. Proc Natl Acad Sci 100: 12648–12653. 10.1073/pnas.2135585100 [DOI] [PMC free article] [PubMed] [Google Scholar]
- Pan Y, Wang Z, Zhan W, Deng L. 2018. Computational identification of binding energy hot spots in protein–RNA complexes using an ensemble approach. Bioinformatics 34: 1473–1480. 10.1093/bioinformatics/btx822 [DOI] [PubMed] [Google Scholar]
- Pauling L, Pressman D. 1945. The serological properties of simple substances. IX. Hapten inhibition of precipitation of antisera homologous to the o-, m-, and p-azophenylarsonic acid groups. J Am Chem Soc 67: 1003–1012. 10.1021/ja01222a033 [DOI] [Google Scholar]
- Pérez-Cano L, Jiménez-García B, Fernández-Recio J. 2012. A protein-RNA docking benchmark (II): extended set from experimental and homology modeling data. Proteins 80: 1872–1882. 10.1002/prot.24075 [DOI] [PubMed] [Google Scholar]
- Raymond DD, Piper ME, Gerrard SR, Skiniotis G, Smith JL. 2012. Phleboviruses encapsidate their genomes by sequestering RNA bases. Proc Natl Acad Sci 109: 19208–19213. 10.1073/pnas.1213553109 [DOI] [PMC free article] [PubMed] [Google Scholar]
- Reichmann D, Phillip Y, Carmi A, Schreiber G. 2008. On the contribution of water-mediated interactions to protein-complex stability. Biochemistry 47: 1051–1060. 10.1021/bi7019639 [DOI] [PubMed] [Google Scholar]
- Rio DC. 2012. Filter-binding assay for analysis of RNA–protein interactions. Cold Spring Harb Protoc 2012: 1078–1081. [DOI] [PubMed] [Google Scholar]
- Rodier F, Bahadur RP, Chakrabarti P, Janin J. 2005. Hydration of protein–protein interfaces. Proteins 60: 36–45. 10.1002/prot.20478 [DOI] [PubMed] [Google Scholar]
- Rozhdestvensky TS, Tang TH, Tchirkova IV, Brosius J, Bachellerie JP, Huttenhofer A. 2003. Binding of L7Ae protein to the K-turn of archaeal snoRNAs: a shared RNA binding motif for C/D and H/ACA box snoRNAs in Archaea. Nucleic Acids Res 31: 869–877. 10.1093/nar/gkg175 [DOI] [PMC free article] [PubMed] [Google Scholar]
- Ryder SP, Recht MI, Williamson JR. 2008. Quantitative analysis of protein–RNA interactions by gel mobility shift. Methods Mol Biol 488: 99–115. 10.1007/978-1-60327-475-3_7 [DOI] [PMC free article] [PubMed] [Google Scholar]
- Sachs R, Max KE, Heinemann U, Balbach J. 2012. RNA single strands bind to a conserved surface of the major cold shock protein in crystals and solution. RNA 18: 65–76. 10.1261/rna.02809212 [DOI] [PMC free article] [PubMed] [Google Scholar]
- Salomon-Ferrer R, Götz AW, Poole D, Le Grand S, Walker RC. 2013. Routine microsecond molecular dynamics simulations with AMBER on GPUs. 2. Explicit solvent particle mesh Ewald. J Chem Theory Comput 9: 3878–3888. 10.1021/ct400314y [DOI] [PubMed] [Google Scholar]
- Sashital DG, Jinek M, Doudna JA. 2011. An RNA-induced conformational change required for CRISPR RNA cleavage by the endoribonuclease Cse3. Nat Struct Mol Biol 18: 680–687. 10.1038/nsmb.2043 [DOI] [PubMed] [Google Scholar]
- Schmidt M, Lipson H. 2009. Distilling free-form natural laws from experimental data. Science 324: 81–85. 10.1126/science.1165893 [DOI] [PubMed] [Google Scholar]
- Schuck P, Zhao H. 2010. The role of mass transport limitation and surface heterogeneity in the biophysical characterization of macromolecular binding processes by SPR biosensing. Methods Mol Biol 627: 15–54. 10.1007/978-1-60761-670-2_2 [DOI] [PMC free article] [PubMed] [Google Scholar]
- Schumacher MA, Pearson RF, Moller T, Valentin-Hansen P, Brennan RG. 2002. Structures of the pleiotropic translational regulator Hfq and an Hfq-RNA complex: a bacterial Sm-like protein. EMBO J 21: 3546–3556. 10.1093/emboj/cdf322 [DOI] [PMC free article] [PubMed] [Google Scholar]
- Selvaraj S, Kono H, Sarai A. 2002. Specificity of protein-DNA recognition revealed by structure-based potentials: symmetric/asymmetric and cognate/non-cognate binding. J Mol Biol 322: 907–915. 10.1016/S0022-2836(02)00846-X [DOI] [PubMed] [Google Scholar]
- Setny P, Zacharias M. 2011. A coarse-grained force field for protein–RNA docking. Nucleic Acids Res 39: 9118–9129. 10.1093/nar/gkr636 [DOI] [PMC free article] [PubMed] [Google Scholar]
- Sim AY, Minary P, Levitt M. 2012. Modeling nucleic acids. Curr Opin Struct Biol 22: 273–278. 10.1016/j.sbi.2012.03.012 [DOI] [PMC free article] [PubMed] [Google Scholar]
- Singh M, Wang Z, Koo BK, Patel A, Cascio D, Collins K, Feigon J. 2012. Structural basis for telomerase RNA recognition and RNP assembly by the holoenzyme La family protein p65. Mol Cell 47: 16–26. 10.1016/j.molcel.2012.05.018 [DOI] [PMC free article] [PubMed] [Google Scholar]
- Soler N, Fourmy D, Yoshizawa S. 2007. Structural insight into a molecular switch in tandem winged-helix motifs from elongation factor SelB. J Mol Biol 370: 728–741. 10.1016/j.jmb.2007.05.001 [DOI] [PubMed] [Google Scholar]
- Spierer P, Bogdanov AA, Zimmermann RA. 1978. Parameters for the interaction of ribosomal proteins L5, L18, and L25 with 5S RNA from Escherichia coli. Biochemistry 17: 5394–5398. 10.1021/bi00618a012 [DOI] [PubMed] [Google Scholar]
- Šponer J, Bussi G, Krepl M, Banáš P, Bottaro S, Cunha RA, Gil-Ley A, Pinamonti G, Poblete S, Jurečka P, et al. 2018. RNA structural dynamics as captured by molecular simulations: a comprehensive overview. Chem Rev 118: 4177–4338. 10.1021/acs.chemrev.7b00427 [DOI] [PMC free article] [PubMed] [Google Scholar]
- Stein AJ, Fuchs G, Fu C, Wolin SL, Reinisch KM. 2005. Structural insights into RNA quality control: the Ro autoantigen binds misfolded RNAs via its central cavity. Cell 121: 529–539. 10.1016/j.cell.2005.03.009 [DOI] [PMC free article] [PubMed] [Google Scholar]
- Su Y, Zhou A, Xia X, Li W, Sun Z. 2009. Quantitative prediction of protein-protein binding affinity with a potential of mean force considering volume correction. Protein Sci 18: 2550–2558. 10.1002/pro.257 [DOI] [PMC free article] [PubMed] [Google Scholar]
- Sun YX, Kollman PA. 1995. Hydrophobic solvation of methane and nonbond parameters of the Tip3p water model. J Comput Chem 16: 1164–1169. 10.1002/jcc.540160910 [DOI] [Google Scholar]
- Teplova M, Patel DJ. 2008. Structural insights into RNA recognition by the alternative-splicing regulator muscleblind-like MBNL1. Nat Struct Mol Biol 15: 1343–1351. 10.1038/nsmb.1519 [DOI] [PMC free article] [PubMed] [Google Scholar]
- Teplova M, Song J, Gaw HY, Teplov A, Patel DJ. 2010. Structural insights into RNA recognition by the alternate-splicing regulator CUG-binding protein 1. Structure 18: 1364–1377. 10.1016/j.str.2010.06.018 [DOI] [PMC free article] [PubMed] [Google Scholar]
- Teplova M, Wohlbold L, Khin NW, Izaurralde E, Patel DJ. 2011. Structure-function studies of nucleocytoplasmic transport of retroviral genomic RNA by mRNA export factor TAP. Nat Struct Mol Biol 18: 990–998. 10.1038/nsmb.2094 [DOI] [PMC free article] [PubMed] [Google Scholar]
- Terribilini M. 2008. “Computational analysis and prediction of protein–RNA interactions.” PhD thesis, Iowa State University, Iowa. [Google Scholar]
- Teyra J, Pisabarro MT. 2007. Characterization of interfacial solvent in protein complexes and contribution of wet spots to the interface description. Proteins 67: 1087–1095. 10.1002/prot.21394 [DOI] [PubMed] [Google Scholar]
- Tian F, Lv Y, Yang L. 2012. Structure-based prediction of protein-protein binding affinity with consideration of allosteric effect. Amino Acids 43: 531–543. 10.1007/s00726-011-1101-1 [DOI] [PubMed] [Google Scholar]
- Tishchenko S, Nikonova E, Nikulin A, Nevskaya N, Volchkov S, Piendl W, Garber M, Nikonov S. 2006. Structure of the ribosomal protein L1-mRNA complex at 2.1 Å resolution: common features of crystal packing of L1-RNA complexes. Acta Crystallogr D Biol Crystallogr 62: 1545–1554. 10.1107/S0907444906041655 [DOI] [PubMed] [Google Scholar]
- Tomita K, Ishitani R, Fukai S, Nureki O. 2006. Complete crystallographic analysis of the dynamics of CCA sequence addition. Nature 443: 956–960. 10.1038/nature05204 [DOI] [PubMed] [Google Scholar]
- Treger M, Westhof E. 2001. Statistical analysis of atomic contacts at RNA–protein interfaces. J Mol Recognit 14: 199–214. 10.1002/jmr.534 [DOI] [PubMed] [Google Scholar]
- Tu C, Zhou X, Tarasov SG, Tropea JE, Austin BP, Waugh DS, Court DL, Ji X. 2011. The Era GTPase recognizes the GAUCACCUCC sequence and binds helix 45 near the 3′ end of 16S rRNA. Proc Natl Acad Sci 108: 10156–10161. 10.1073/pnas.1017679108 [DOI] [PMC free article] [PubMed] [Google Scholar]
- Tuszynska I, Bujnicki JM. 2011. DARS-RNP and QUASI-RNP: new statistical potentials for protein–RNA docking. BMC Bioinformatics 12: 348 10.1186/1471-2105-12-348 [DOI] [PMC free article] [PubMed] [Google Scholar]
- Uter NT, Gruic-Sovulj I, Perona JJ. 2005. Amino acid-dependent transfer RNA affinity in a class I aminoacyl-tRNA synthetase. J Biol Chem 280: 23966–23977. 10.1074/jbc.M414259200 [DOI] [PubMed] [Google Scholar]
- Vajda S, Weng Z, Rosenfeld R, DeLisi C. 1994. Effect of conformational flexibility and solvation on receptor-ligand binding free energies. Biochemistry 33: 13977–13988. 10.1021/bi00251a004 [DOI] [PubMed] [Google Scholar]
- Vivian JT, Callis PR. 2001. Mechanisms of tryptophan fluorescence shifts in proteins. Biophys J 80: 2093–2109. 10.1016/S0006-3495(01)76183-8 [DOI] [PMC free article] [PubMed] [Google Scholar]
- Vreven T, Moal IH, Vangone A, Pierce BG, Kastritis PL, Torchala M, Chaleil R, Jiménez-García B, Bates PA, Fernandez-Recio J, et al. 2015. Updates to the integrated protein-protein interaction benchmarks: docking benchmark version 5 and affinity benchmark version 2. J Mol Biol 427: 3031–3041. 10.1016/j.jmb.2015.07.016 [DOI] [PMC free article] [PubMed] [Google Scholar]
- Walden WE, Selezneva A, Volz K. 2012. Accommodating variety in iron-responsive elements: crystal structure of transferrin receptor 1 B IRE bound to iron regulatory protein 1. FEBS Lett 586: 32–35. 10.1016/j.febslet.2011.11.018 [DOI] [PubMed] [Google Scholar]
- Webb B, Sali A. 2016. Comparative protein structure modeling using MODELLER. Curr Protoc Protein Sci 86: 2.9.1–2.9.37. 10.1002/cpps.20 [DOI] [PubMed] [Google Scholar]
- White R, Rusconi C, Scardino E, Wolberg A, Lawson J, Hoffman M, Sullenger B. 2001. Generation of species cross-reactive aptamers using “Toggle” SELEX. Mol Ther 4: 567–573. 10.1006/mthe.2001.0495 [DOI] [PubMed] [Google Scholar]
- Xu D, Tsai CJ, Nussinov R. 1997. Hydrogen bonds and salt bridges across protein–protein interfaces. Protein Eng 10: 999–1012. 10.1093/protein/10.9.999 [DOI] [PubMed] [Google Scholar]
- Xue LC, Rodrigues JP, Kastritis PL, Bonvin AM, Vangone A. 2016. PRODIGY: a web server for predicting the binding affinity of protein–protein complexes. Bioinformatics 32: 3676–3678. [DOI] [PubMed] [Google Scholar]
- Yang X, Gérczei T, Glover LT, Correll CC. 2001. Crystal structures of restrictocin-inhibitor complexes with implications for RNA recognition and base flipping. Nat Struct Biol 8: 968–973. 10.1038/nsb1101-968 [DOI] [PubMed] [Google Scholar]
- Yang Y, Wang Q, Guo D. 2008. A novel strategy for analyzing RNA–protein interactions by surface plasmon resonance biosensor. Mol Biotechnol 40: 87–93. 10.1007/s12033-008-9066-3 [DOI] [PMC free article] [PubMed] [Google Scholar]
- Yang Q, Gilmartin GM, Doublie S. 2010. Structural basis of UGUA recognition by the Nudix protein CFIm25 and implications for a regulatory role in mRNA 3′ processing. Proc Natl Acad Sci 107: 10062–10067. 10.1073/pnas.1000848107 [DOI] [PMC free article] [PubMed] [Google Scholar]
- Yang X, Li H, Huang Y, Liu S. 2013. The dataset for protein–RNA binding affinity. Protein Sci 22: 1808–1811. 10.1002/pro.2383 [DOI] [PMC free article] [PubMed] [Google Scholar]
- Yang Y, Zhao H, Wang J, Zhou Y. 2014. SPOT-Seq-RNA: predicting protein–RNA complex structure and RNA-binding function by fold recognition and binding affinity prediction. In Protein structure prediction (ed. Kihara D), pp. 119–130. Springer, New York. [DOI] [PMC free article] [PubMed] [Google Scholar]
- Ye JD, Tereshko V, Frederiksen JK, Koide A, Fellouse FA, Sidhu SS, Koide S, Kossiakoff AA, Piccirilli JA. 2008. Synthetic antibodies for specific recognition and crystallization of structured RNA. Proc Natl Acad Sci 105: 82–87. 10.1073/pnas.0709082105 [DOI] [PMC free article] [PubMed] [Google Scholar]
- Yoshizawa S, Rasubala L, Ose T, Kohda D, Fourmy D, Maenaka K. 2005. Structural basis for mRNA recognition by elongation factor SelB. Nat Struct Mol Biol 12: 198–203. 10.1038/nsmb890 [DOI] [PubMed] [Google Scholar]
- Zgarbová M, Otyepka M, Šponer J, Mládek A, Banáš P, Cheatham TE III, Jurečka P. 2011. Refinement of the Cornell et al. nucleic acids force field based on reference quantum chemical calculations of glycosidic torsion profiles. J Chem Theory Comput 7: 2886–2902. 10.1021/ct200162x [DOI] [PMC free article] [PubMed] [Google Scholar]
- Zhang C, Liu S, Zhu Q, Zhou Y. 2005. A knowledge-based energy function for protein–ligand, protein–protein, and protein–DNA complexes. J Med Chem 48: 2325–2335. 10.1021/jm049314d [DOI] [PubMed] [Google Scholar]
- Zhao H, Yang Y, Zhou Y. 2011. Structure-based prediction of RNA-binding domains and RNA-binding sites and application to structural genomics targets. Nucleic Acids Res 39: 3017–3025. 10.1093/nar/gkq1266 [DOI] [PMC free article] [PubMed] [Google Scholar]
- Zheng S, Robertson TA, Varani G. 2007. A knowledge-based potential function predicts the specificity and relative binding energy of RNA-binding proteins. FEBS J 274: 6378–6391. 10.1111/j.1742-4658.2007.06155.x [DOI] [PubMed] [Google Scholar]
Associated Data
This section collects any data citations, data availability statements, or supplementary materials included in this article.