

ABSTRACT
Background
Variation in gut microbial community structure is partly attributed to variations in diet. A priori dietary indexes capture diet quality and have been associated with chronic disease risk.
Objectives
The aim of this study was to examine the association of diet quality, as assessed by the Healthy Eating Index, Alternative Healthy Eating Index-2010, alternate Mediterranean Diet, and the Dietary Approaches to Stop Hypertension Trial, with measures of fecal microbial community structure assessed in the Adiposity Phenotype Study (APS), an ethnically diverse study population with varied food intakes.
Methods
Multiethnic Cohort Study members completed a validated quantitative food frequency questionnaire (QFFQ) at cohort entry (1993–1996) and, for the APS subset, at clinic visit (2013–2015), when they also provided a stool sample. DNA was extracted from stool, and the V1-V3 region of the 16S rRNA gene was amplified and sequenced. Dietary index scores were computed based on the QFFQ and an extensive nutritional database. Using linear regression adjusted for relevant covariates, we estimated associations of dietary quality with microbiome measures and computed adjusted mean values of microbial measures by tertiles of dietary index scores.
Results
The 858 men and 877 women of white, Japanese American, Latino, Native Hawaiian, and African American ancestry had a mean age of 69.2 years at stool collection. Alpha diversity according to the Shannon index increased by 1–2% across tertiles of all 4 diet indexes measured at clinic visit. The mean relative abundance of the phylum Actinobacteria was 13–19% lower with higher diet quality across all 4 indexes (difference between tertile 3 and tertile 1 divided by tertile 1). Of the 104 bacterial genera tested, 21 (primarily from the phylum Firmicutes) were positively associated with at least 1 index after Bonferroni adjustment.
Conclusion
Diet quality was strongly associated with fecal microbial alpha diversity and beta diversity and several genera previously associated with human health.
Keywords: diet quality, gut microbiome, cohort, multiethnic, epidemiology
Introduction
Gut microbiome structure and activity are important factors related to disease risk, highlighting the need for a better understanding of how lifestyle factors affect the microbiome (1, 2). Components of diet, such as dietary fiber, have been identified as predictors of gut microbial community structure and function (3–5). Few studies have attempted to evaluate overall diet quality in relation to gut microbial diversity and structure.
Two approaches are used to assess dietary patterns from self-reported dietary data. Theoretically defined dietary patterns or diet quality indexes are typically translated using scoring systems, which indicate how closely a person's diet adheres to the dietary pattern being examined. For example, the Healthy Eating Index (HEI) reflects adherence to the Dietary Guidelines for Americans. A higher score indicates better diet quality or more healthful eating patterns. These standardized dietary quality indexes have been applied in prospective cohort studies to evaluate the relation between diet quality and diet-related chronic disease risk (6, 7). Further, they provide an objective standard for measuring dietary quality across populations (8). Alternatively, data-driven approaches use statistical methods (e.g., principal component analysis or reduced rank regression) to derive dietary patterns based on the data in each study under investigation, making these patterns difficult to compare across populations.
Adherence to standardized dietary patterns, such as the HEI and Mediterranean Diet Score (MDS), has been evaluated in relation to gut microbiome measures. Studies have also reported associations between gut microbial diversity and community structure and adherence to the Mediterranean diet. Generally, investigators found a higher adherence to the diet was associated with a beneficial gut microbiota (9–12). Similarly, in the TwinsUK cohort, both the HEI-2010 and MDS were associated with alpha- and beta-diversity measures (13). These studies begin to elucidate the contribution of overall diet, rather than specific nutrients, to the gut microbiome and ultimately provide further insight into potential microbial effects on health outcomes. However, the association between the gut microbiome and these commonly used dietary indexes has not been evaluated in an ethnically diverse population with varied food intakes.
Our objective was to examine the association of diet quality, as assessed by the HEI-2010, Alternative Healthy Eating Index (AHEI) 2010 (AHEI-2010), alternate Mediterranean diet (aMED), and Dietary Approaches to Stop Hypertension Trial (DASH) indexes, with measures of stool microbial community structure in a subset of the Multiethnic Cohort (MEC) study. Previous work in the MEC has shown differences in types of foods consumed and diet quality across the racial/ethnic groups (14). In addition to the cross-sectional analysis using diet data collected at the same time as the stool samples, dietary data obtained at cohort entry approximately 20 y earlier allowed a longitudinal analysis between diet quality and gut microbial characteristics.
Methods
Study population
The MEC is an ongoing prospective study in Hawaii and Los Angeles, California, of diet, lifestyle, and genetic risk factors for cancer and other chronic diseases. Between 1993 and 1996, more than 215,000 men and women aged 45–75 y at recruitment, and of mainly Japanese American, Native Hawaiian, white, African American, and Latino ancestry, were recruited (15). Participants in the current study were part of the Adiposity Phenotype Study (APS), which enrolled a subset of MEC members aged 60–72 y as of January 2013 and living in the catchment area of the study clinics (16). As described previously (16), invitation letters and follow-up telephone calls were used to exclude individuals with the following characteristics: current BMI outside 18.5–40 kg/m2, current or recent (<2 y) smoking, soft or metal implants (other than knee or hip replacement), or serious health conditions. Individuals who experienced weight change of >9 kg, or treatments or procedures with the potential to modify outcomes of interest, were deferred for 6 mo, when their eligibility was reconsidered.
During 2013–2016, participants were recruited within 60 sex/ethnicity/BMI strata with a participation rate of 25.6% after excluding the ineligible (n = 4624) and too ill/deceased (n = 706) of the 12,602 contacted MEC members (Supplemental Figure 1). During the clinic visit, APS participants underwent anthropometric and imaging measurements, provided a fasting blood sample, and completed questionnaires including the same validated quantitative food frequency questionnaire (QFFQ) as at cohort entry (17). Institutional Review Boards at the University of Hawaii (CHS#17200) and University of Southern California (#HS-12–00623) approved the protocol, and informed consent was provided by all participants.
Dietary assessment and indexes
The questionnaire at cohort entry and the clinic visit included a QFFQ covering over 180 food items including ethnic-specific foods (17), as well as questions on demographics, medical conditions, anthropometric measures, physical activity, and other lifestyle factors (15, 17). Metabolic equivalents of task were computed from time spent in sleep, sedentary, moderate, and vigorous activities. Using an extensive food composition database (18), scores for 4 a priori indexes (Table 1) were calculated separately for cohort entry and the APS clinic visit as described previously (14, 16). The HEI-2010 reflects the 2010 Dietary Guidelines for Americans, with higher scores indicating better adherence to federal dietary guidelines (16, 19). The AHEI-2010 (20) and the aMED (21) include foods and nutrients shown to predict chronic disease risk. The DASH includes 8 components that are emphasized in the DASH diet developed for hypertension management (21).
TABLE 1.
Characteristics of 1735 participants of the Adiposity Phenotype Study at the clinic visit, 2013–20151
| HEI-2010 | AHEI-2010 | aMED | DASH | |||||
|---|---|---|---|---|---|---|---|---|
| T1 | T3 | T1 | T3 | T1 | T3 | T1 | T3 | |
| Range of index scores | 35.2–68.4 | 77.8–99.1 | 35.6–64.5 | 73.1–99.4 | 0–3 | 6–9 | 9–22 | 27–38 |
| n | 578 | 578 | 578 | 578 | 643 | 465 | 631 | 559 |
| Sex, % | ||||||||
| M (n = 858) | 39 | 29 | 36 | 32 | 37 | 26 | 37 | 31 |
| F (n = 877) | 28 | 37 | 31 | 34 | 37 | 28 | 35 | 34 |
| Age at cohort entry, y | 48.3 ± 2.6 | 48.2 ± 2.5 | 48.4 ± 2.6 | 48.2 ± 2.5 | 48.3 ± 2.5 | 48.2 ± 2.5 | 48.2 ± 2.5 | 48.4 ± 2.5 |
| Age at clinic visit, y | 69.2 ± 2.8 | 69.0 ± 2.7 | 69.4 ± 2.8 | 69.0 ± 2.7 | 69.2 ± 2.7 | 69.0 ± 2.7 | 69.1 ± 2.8 | 69.2 ± 2.6 |
| Ethnicity, % of row | ||||||||
| White (n = 391) | 27 | 39 | 24 | 44 | 32 | 29 | 22 | 46 |
| African American (n = 279) | 32 | 35 | 40 | 28 | 36 | 27 | 41 | 29 |
| Native Hawaiian (n = 282) | 36 | 31 | 28 | 38 | 40 | 26 | 44 | 25 |
| Japanese American (n = 430) | 32 | 33 | 26 | 37 | 41 | 24 | 42 | 25 |
| Latino (n = 353) | 41 | 28 | 52 | 17 | 38 | 28 | 36 | 34 |
| History of diabetes, % | 37 | 29 | 34 | 27 | 43 | 25 | 38 | 25 |
| Antibiotic use, % | 30 | 33 | 33 | 33 | 36 | 27 | 31 | 35 |
| Moderate/vigorous activity, % of row | ||||||||
| <0.5 h/d | 50 | 25 | 48 | 19 | 50 | 19 | 52 | 21 |
| 0.5 to <1 h/d | 33 | 32 | 36 | 28 | 37 | 26 | 37 | 29 |
| 1 to <1.5 h/d | 30 | 38 | 29 | 39 | 32 | 29 | 35 | 37 |
| ≥1.5 h/d | 26 | 36 | 26 | 41 | 33 | 30 | 28 | 37 |
| Never smoked, % | 39 | 29 | 33 | 33 | 36 | 28 | 39 | 30 |
| BMI, kg/m2 | 29.1 ± 4.9 | 26.6 ± 4.6 | 29.1 ± 5.0 | 26.7 ± 4.5 | 28.6 ± 5.0 | 27.3 ± 4.7 | 29.0 ± 5.0 | 26.7 ± 4.7 |
| Total body fat DXA, kg | 27.1 ± 8.7 | 23.5 ± 8.2 | 27.8 ± 9.2 | 23.0 ± 8.3 | 26.6 ± 9.0 | 24.2 ± 8.6 | 27.1 ± 9.2 | 23.5 ± 8.6 |
| Total energy, kcal/d | 1957 ± 1050 | 1779 ± 766 | 1760 ± 887 | 1967 ± 833 | 1463 ± 615 | 2450 ± 1136 | 1618 ± 699 | 2109 ± 1082 |
| Alcohol intake, g/d | 9.7 ± 24.7 | 6.0 ± 10.9 | 6.7 ± 19.6 | 8.6 ± 15.6 | 6.4 ± 13.9 | 8.2 ± 18.9 | 7.1 ± 15.1 | 7.6 ± 16.7 |
Unless otherwise indicated values represent means ± SD and % refers to the proportion of participants in T1 and T3 for each category. AHEI-2010, Alternative Healthy Eating Index-2010; aMED, alternate Mediterranean Diet; DASH, Dietary Approaches to Stop Hypertension Trial; HEI-2010, Healthy Eating Index-2010; T1, lowest, or first tertile; T3, highest, or third tertile.
Fecal microbiome analysis
The participants collected the stool samples in RNAlater(Ambion) and stored them in their home freezer before mailing them next day or bringing them to the clinic as described previously (22). The samples were shipped on dry ice from Honolulu and Los Angeles to Seattle, where they were stored at −80°C and processed (23). Briefly, DNA was extracted and amplified for the V1-V3 region of the 16S rRNA genes, and amplicons were sequenced on the MiSeq platform (Illumina). To classify bacteria, sequences were processed using QIIME v.1.8 as described previously (23) to generate operational taxanomic units (OTUs). Shannon diversity index (24) and beta-diversity matrices—unweighted UniFrac based on presence or absence of an OTU, and weighted UniFrac, an estimate of both composition and relative abundance of the bacterial OTUs (25, 26)—were calculated in QIIME based on the mean of 10 subsamples with rarefaction to 10,000 sequences per sample.
Real-time PCR quantification of Methanobrevibacter smithii
Total bacteria were quantified using TaqMan real-time PCR (Applied Biosystems, QuantStudio 5) with primers 8FM (5′-AGAGTTTGATCMTGGCTCAG-3′) and 530R (5′-TTACCGCGGC-KGCTGGCAC-3′), and Bac338 NED–labeled probe (5′-CCAKACTCCTACGGGAGGCAGCAG-3′) (Applied Biosystems). For quality control purposes, we used a standard made of DNA extracted from the following pure cultures: Bacteroides fragilis HM-20D BEI Resources, Bifidobacterium adolescentis 15703D ATCC, Clostridioides difficile BAA-1382D-5 ATCC, Veillonella parvula 10790D-5 ATCC, and Escherichia coli. The TaqMan PCR assays were carried out in a total reaction volume of 10 μL using 5.0 μL of 2X TaqMan Multiplex Master Mix (Applied Biosystems) containing 2μL of template DNA, 0.025 μM of each probe, and 0.125 μM of each primer. The PCR thermal cycling conditions of the DNA were set at 50°C for 2 min, 95°C for 10 min, and 40 cycles of 95°C for 15 s and 60°C for 1 min (27). The archaeon Methanobrevibacter smithii was measured using PCR primers directed at archaeal 16S rRNA genes (FW 5′-CCGGGTATCTAATCCGGTTC-3′; 5′-CTCCCAGGGTAGAGGTGAAA-3′; and 5′ fluorescein-labeled (6-FAM) probe 5′-CCGTCAGAATCGTTCCAGTCAG-3′) with the following cycling conditions: 30 cycles of denaturing at 94°C for 2 min, annealing at 65°C for 45 s, and extension at 72°C for 2 min. DNA extracted from a pure culture was used to generate standard curves with the same primer probe set (Methanobrevibacter smithii, DSM 11,975). Data were analyzed using QuantStudio software (v1.2.x; Applied Biosystems). The abundance of M. smithii was expressed as a ratio of total bacteria in the sample (28).
Statistical analysis
After excluding 74 persons with missing microbiome data, 34 with incomplete dietary information, and 21 without DXA measures used for statistical adjustment (with some participants overlapping) from the 1861 participants in the APS study, the final dataset had 1735 observations (Supplemental Figure 1). The diet index scores were classified into 3 categories, each including an approximately equal number of participants, denoted as tertiles (tertile 1 is the lowest and tertile 3 the highest diet quality), although the categories do not always represent thirds due to the distribution of scores. For all analyses, we applied general linear models of gut microbial characteristics to determine the association of diet quality, adjusted for potential confounders, using SAS version 9.4 (SAS Institute, Inc.).
The primary study objective was to examine the association of diet quality at clinic visit with several measures of gut microbial diversity and the structure of the gut microbial community: alpha diversity as described by the Shannon index, UniFrac distances (unweighted and weighted), and the presence or absence of 10 phyla, M. smithii from the domain Archaea, and 104 bacterial genera. Separate prospective analyses for diet at cohort entry were performed only for models showing statistically significant results with diet quality at clinic visit. To correct for multiple comparisons, Bonferroni-adjusted significance levels were set for 11 phyla (P < 0.005) and 104 genera (P < 0.000485).
All models included sex, age, ethnicity, total energy intake (log-transformed to correct for heteroscedasticity), moderate/vigorous physical activity (<0.5, 0.5 to <1, 1 to <1.5, ≥1.5 h/d), total body fat mass from DXA, smoking history (never/past), diabetes status, and reported antibiotic use in the past year (yes/no) as covariates. Given that the HEI-2010 and DASH do not have a unique component for alcohol, we also adjusted the HEI-2010 and DASH models for alcohol intake, whereas the AHEI and aMED incorporate alcohol intake as a scoring component. For models with statistically significant associations, we computed covariate-adjusted microbiome-measure mean values for tertiles of dietary indexes. We included interaction terms of sex and ethnicity with the continuous dietary index scores to test for heterogeneity between men and women and by ethnic background. We used multiresponse permutation procedures on center log ratio–transformed, rarefied bacterial counts after calculation of a matrix based on the Euclidean distance metric to compare the composition of the fecal microbiome in tertiles 1 and 3 of the 4 dietary indexes (29). To elucidate the contributions of individual food components to alpha diversity, adherence scores for each component of the HEI-2010 across tertiles of the Shannon index were computed and presented in a radar graph (30).
Results
The current analysis included 858 men and 877 women (Table 1) with slightly larger proportions of Japanese Americans and whites than Latinos, Native Hawaiians, and African Americans. The mean age at cohort entry was ∼48 y and at clinic visit it was 69 y. Of the study participants, 29.3% were normal weight, 40.4% were overweight, and 30.3% were obese; BMI ranged from 17.1 to 49.8. Approximately 40% of participants were past smokers, the rest had never smoked. Mean BMI, total energy intake, and alcohol consumption were lower in participants in tertile 3 compared with tertile 1 of the dietary index scores. Past smokers were more likely to be in tertile 1 than never smokers, whereas participants reporting higher physical activity were more likely to be in tertile 3.
In the fecal samples from the 1735 MEC study participants, we identified 10 phyla, 104 genera, and 1300 OTUs. Prior to rarefaction, there was a mean ± SD of 36,256 ± 18,600 sequences per sample, and a mean ± SD sequence length of 494 ± 38 bp. Alpha diversity as assessed by the Shannon index increased across tertiles of all 4 diet quality indexes assessed in the APS (Table 2). The number of genera per phylum were as follows: Actinobacteria (8 genera), Firmicutes (61 genera), Bacteroidetes (16 genera), Cyanobacteria (1 genus), Fusobacteria (1 genus), Lentisphaerae (1 genus), Synergistetes (1 genus), Tenericutes (2 genera), Proteobacteria (10 genera), and Verrucomicrobia (3 genera). For diet at clinic visit, mean Shannon index values of 6.14–6.17 in tertile 3 were 1–2% higher than in tertile 1; and other than DASH, the 3 regression coefficients for the dietary indexes were statistically significant. No indication of heterogeneity by sex and ethnicity was observed (data not shown).
TABLE 2.
Alpha diversity and statistically significant phylum by tertiles of dietary indexes among 1735 participants of the Adiposity Phenotype Study1
| HEI-2010 3 | AHEI-2010 | aMED | DASH3 | |||||||
|---|---|---|---|---|---|---|---|---|---|---|
| Measure | Time | Tertile2 | n | Mean (95% CI) | n | Mean (95% CI) | n | Mean (95% CI) | n | Mean (95% CI) |
| Alpha diversity | Cohort entry | T1 | 578 | 6.02 (5.88, 6.15) | 562 | 6.01 (5.87, 6.14) | 650 | 6.05 (5.91, 6.18) | 604 | 6.03 (5.90, 6.17) |
| (Shannon) | T2 | 579 | 6.16 (6.03, 6.31) | 563 | 6.12 (5.98, 6.26) | 345 | 6.09 (5.94, 6.23) | 553 | 6.13 (5.99, 6.27) | |
| T3 | 578 | 6.17 (6.05, 6.33) | 563 | 6.18 (5.87, 6.32) | 693 | 6.15 (6.01, 6.28) | 531 | 6.21 (6.07, 6.35) | ||
| β (P)4 | 0.006 (0.0002) | 0.008 (<0.0001) | 0.024 (0.02) | 0.02 (<0.0001) | ||||||
| Clinic visit | T1 | 578 | 6.03 (5.89, 6.17) | 578 | 6.02 (5.88, 6.15) | 643 | 6.05 (5.91, 6.18) | 631 | 6.07 (5.94, 6.21) | |
| T2 | 579 | 6.15 (6.01, 6.28) | 579 | 6.13 (6.00, 6.27) | 627 | 6.11 (5.97, 6.24) | 545 | 6.11 (5.98, 6.25) | ||
| T3 | 578 | 6.15 (6.01, 6.29) | 578 | 6.14 (6.00, 6.28) | 465 | 6.16 (6.02, 6.31) | 559 | 6.17 (6.03, 6.31) | ||
| β (P)4 | 0.006 (0.001) | 0.007 (0.002) | 0.036 (0.001) | 0.011 (0.06) | ||||||
| Phylum | Cohort entry5 | T1 | 578 | 1.87 (1.65, 2.08) | 562 | 1.84 (1.62, 2.06) | 650 | 1.86 (1.64, 2.07) | 604 | 1.88 (1.67, 2.10) |
| Actinobacteria | T2 | 579 | 1.76 (1.54, 1.98) | 563 | 1.84 (1.63, 2.06) | 345 | 1.79 (1.56, 2.02) | 553 | 1.82 (1.60, 2.04) | |
| T3 | 578 | 1.73 (1.50, 1.95) | 563 | 1.66 (1.44, 1.88) | 693 | 1.73 (1.51, 1.94) | 531 | 1.65 (1.43, 1.88) | ||
| β (P)4 | −0.006 (0.02) | −0.009 (0.003) | −0.043 (0.007) | −0.018 (0.01) | ||||||
| Clinic visit5 | T1 | 578 | 2.01 (1.80, 2.23) | 578 | 1.91 (1.69, 2.12) | 643 | 1.98 (1.76, 2.19) | 631 | 1.94 (1.72, 2.16) | |
| T2 | 579 | 1.69 (1.47, 1.90) | 579 | 1.78 (1.56, 1.99) | 627 | 1.70 (1.49, 1.91) | 545 | 1.73 (1.52, 1.95) | ||
| T3 | 578 | 1.65 (1.43, 1.87) | 578 | 1.67 (1.45, 1.88) | 465 | 1.60 (1.37, 1.82) | 559 | 1.63 (1.41, 1.86) | ||
| β (P)4 | −0.016 (<0.0001) | −0.012 (<0.0001) | −0.091 (<0.0001) | −0.029 (<0.0001) | ||||||
Obtained by linear regression for 11 phyla and showing only models with Bonferroni-adjusted significance (P < 0.005); values shown are means (95% CI) adjusted for sex, age, ethnicity, total body fat from DXA, total energy intake (log-transformed), physical activity (h/d), antibiotic use in past year (yes/no), smoking history (never/past), diabetes status, and batch number of stool analysis (4 levels). AHEI-2010, Alternative Healthy Eating Index-2010; aMED, alternate Mediterranean Diet Index. DASH, Dietary Approaches to Stop Hypertension Trial; HEI-2010, Healthy Eating Index-2010.
Three groups might not exactly equal tertiles due to limited range of scores. Tertile 1 is the lowest and tertile 3 is the highest diet score.
Additional adjustment for alcohol intake (categories).
β = regression parameter and P value from trend tests with dietary index scores as continuous variable.
Adjusted means only shown for models with trend tests of P < 0.005.
After Bonferroni adjustment, the only significant phylum association with diet quality at clinic visit was for the phylum Actinobacteria, which was associated with all 4 indexes (Table 2). The mean relative abundance of the phylum Actinobacteria was 13–19% lower with higher diet quality across all 4 indexes (difference between tertile 3 and tertile 1 divided by tertile 1), but the differences across dietary indexes were relatively small. Based on diet quality at cohort entry, fewer and weaker associations with phyla emerged. Only the associations of the AHEI-2010 at cohort entry with Actinobacteria remained significant after Bonferroni adjustment (P < 0.005). No significant associations were detected for Firmicutes or the other 8 phyla.
Of the 104 bacterial genera tested, after Bonferroni adjustment 21 were significantly related to at least 1 diet quality index assessed at the APS clinic visit; 12 genera, all members of Firmicutes, were positively associated, and 9 (5 Firmicutes, 1 Actinobacteria, 3 Proteobacteria) were inversely associated (Table 3). Of these, 9 genera were significantly associated with all 4 dietary indexes, 4 genera with 3 indexes, 4 genera with 2 indexes, and 4 genera with 1 index only. For the DASH, 19 models were significant, 18 for the HEI-2010, 12 for the aMED, and 11 for the AHEI-2010. The directions of the associations agreed across all dietary indexes. Collinsella spp. represented 12.5% of the genera in the phylum Actinobacteria with 60% (range 0–100%) of the signal, whereas 9 significant genera represented 15% of all 61 genera in the phylum Firmicutes and accounted for only a mean 22% (range 0.3–59%) of the total signal. These findings are compatible with the observation that at the phylum level Actinobacteria and not Firmicutes were significantly associated with diet quality. The percentage of genera with zero prevalence in this population was below 20% except for 5 members of the Firmicutes. There was no association between the dietary indexes and Methanobrevibacter.
TABLE 3.
Genera associated with dietary indexes among 1735 participants of the Adiposity Phenotype Study at clinic visit1
| HEI-20104 | AHEI-2010 | aMED | DASH4 | |||||||||||
|---|---|---|---|---|---|---|---|---|---|---|---|---|---|---|
| Genus | Prevalence2 (%) | n 3 | β5 | SE | P | β5 | SE | P | β5 | SE | P | β5 | SE | P |
| Firmicutes; Clostridia; Clostridiales; Christensenellaceae; uncultured | 0.06 | 4 | 0.014 | ±0.003 | <0.0001 | 0.013 | ±0.003 | <0.0001 | 0.075 | ±0.016 | <0.0001 | 0.031 | ±0.006 | <0.0001 |
| Firmicutes; Clostridia; Clostridiales; Lachnospiraceae incertae sedis; human gut metagenome | 17.3 | 4 | 0.024 | ±0.003 | <0.0001 | 0.023 | ±0.004 | <0.0001 | 0.146 | ±0.022 | <0.0001 | 0.057 | ±0.008 | <0.0001 |
| Firmicutes; Clostridia; Clostridiales; Lachnospiraceae; Anaerostipes | 0 | 2 | — | — | — | — | 0.053 | ±0.014 | 0.0002 | 0.019 | ±0.005 | 0.0004 | ||
| Firmicutes; Clostridia; Clostridiales; Lachnospiraceae; Coprococcus | 0 | 1 | — | — | — | — | — | — | 0.016 | ±0.005 | 0.0004 | |||
| Firmicutes; Clostridia; Clostridiales; Lachnospiraceae; Lachnospira | 0.06 | 4 | 0.015 | ±0.003 | <0.0001 | 0.017 | ±0.004 | <0.0001 | 0.119 | ±0.021 | <0.0001 | 0.032 | ±0.008 | <0.0001 |
| Firmicutes; Clostridia; Clostridiales; Lachnospiraceae; Shuttleworthia | 58.4 | 2 | 0.008 | ±0.004 | 0.00002 | 0.011 | ±0.003 | <0.0001 | — | — | — | — | ||
| Firmicutes; Clostridia; Clostridiales; Lachnospiraceae; uncultured | 0 | 3 | 0.006 | ±0.001 | <0.0001 | — | — | 0.032 | ±0.008 | <0.0001 | 0.014 | ±0.003 | <0.0001 | |
| Firmicutes; Clostridia; Clostridiales; Lachnospiraceae; other | 0.23 | 4 | 0.012 | ±0.003 | <0.0001 | 0.012 | ±0.003 | <0.0001 | 0.089 | ±0.017 | <0.0001 | 0.029 | ±0.006 | <0.0001 |
| Firmicutes; Clostridia; Clostridiales; Ruminococcaceae; Faecalibacterium | 0 | 4 | 0.015 | ±0.003 | <0.0001 | 0.012 | ±0.003 | <0.0001 | 0.065 | ±0.017 | <0.0001 | 0.030 | ±0.006 | <0.0001 |
| Firmicutes; Clostridia; Clostridiales; Ruminococcaceae; Ruminococcus | 0 | 4 | 0.012 | ±0.002 | <0.0001 | 0.010 | ±0.002 | <0.0001 | 0.075 | ±0.012 | <0.0001 | 0.026 | ±0.005 | <0.0001 |
| Firmicutes; Clostridia; Clostridiales; Ruminococcaceae; uncultured | 0 | 1 | — | — | — | — | — | — | 0.014 | ±0.004 | 0.0003 | |||
| Firmicutes; Clostridia; Clostridiales; other | 9.7 | 4 | 0.016 | ±0.003 | <0.0001 | 0.016 | ±0.003 | <0.0001 | 0.079 | ±0.019 | <0.0001 | 0.033 | ±0.007 | <0.0001 |
| Actinobacteria; Coriobacteriia; Coriobacteriales; Coriobacteriaceae; Collinsella | 2.1 | 4 | −0.018 | ±0.004 | <0.0001 | −0.015 | ±0.004 | <0.0001 | −0.083 | ±0.023 | 0.0003 | −0.043 | ±0.008 | <0.0001 |
| Proteobacteria; Gammaproteobacteria; Enterobacteriales; Enterobacteriaceae; Escherichia | 15.2 | 3 | −0.018 | ±0.004 | <0.0001 | — | — | −0.104 | ±0.026 | <0.0001 | −0.037 | ±0.010 | <0.0001 | |
| Firmicutes; Clostridia; Clostridiales; Ruminococcaceae incertae sedis; Ruminococcus | 70.4 | 2 | −0.009 | ±0.0002 | <0.0001 | — | — | — | — | −0.021 | ±0.005 | <0.0001 | ||
| Firmicutes; Clostridia; Clostridiales; Ruminococcaceae incertae sedis; other | 33.8 | 4 | −0.012 | ±0.003 | <0.0001 | −0.013 | ±0.003 | <0.0001 | −0.061 | ±0.017 | 0.0002 | −0.023 | ±0.006 | 0.0001 |
| Firmicutes; Clostridia; Clostridiales; Ruminococcaceae; Anaerotruncus | 10.9 | 2 | −0.012 | ±0.003 | 0.0003 | — | — | — | — | −0.040 | ±0.008 | <0.0001 | ||
| Firmicutes; Clostridia; Clostridiales; Veillonellaceae; Acidaminococcus | 44.8 | 3 | −0.015 | ±0.004 | <0.0001 | — | — | −0.095 | ±0.023 | <0.0001 | −0.040 | ±0.008 | <0.0001 | |
| Firmicutes; Erysipelotrichia; Erysipelotrichales; Erysipelotrichaceae; other | 85.6 | 3 | −0.008 | ±0.002 | <0.0001 | −0.008 | ±0.002 | <0.0001 | — | — | −0.021 | ±0.004 | <0.0001 | |
| Proteobacteria; Gammaproteobacteria; Enterobacteriales; Enterobacteriaceae; Enterobacter | 13.2 | 1 | −0.015 | ±0.004 | 0.0003 | — | — | — | — | — | — | |||
| Proteobacteria; Gammaproteobacteria; Enterobacteriales; Enterobacteriaceae; Escherichia-Shigella | 14.8 | 1 | −0.017 | ±0.004 | <0.0001 | — | — | — | — | — | — | |||
Values shown are β and SE obtained by linear regression models for 103 genera and showing only models (60 out of 412) with Bonferroni-adjusted significance (P < 0.000485). The β coefficients indicate the change in relative abundance of each genus for 1 unit of diet quality score. The unit is the centered log-ratio transformed abundance, which is a scale-invariant measure and meets the linearity assumption. AHEI-2010, Alternative Healthy Eating Index-2010; aMED, alternate Mediterranean Diet; DASH, Dietary Approaches to Stop Hypertension Trial; HEI-2010, Healthy Eating Index-2010.
Prevalence indicates percent of participants without each taxa.
Number of dietary indexes with significant association.
Additional adjustment for alcohol intake (categories).
β (regression parameter), SE (standard error), and P value from trend tests with dietary index scores as continuous variables and adjusted for sex, age, ethnicity, total body fat from DXA, total energy intake (log-transformed), physical activity (h/d), reported antibiotic use in past year (yes/no), smoking history (never/past), diabetes status, and batch number of stool analysis (n = 4).
As a global measure of variation in the microbiome, 3 axes using either the weighted or unweighted UniFrac distance metric were obtained, and explained 48% (Axis 1, 35%; Axis 2, 8%; and Axis 3, 6%) or 13% (Axis 1, 9%; Axis 2, 3%; Axis 3, 2%) of the variation in the microbiome data, respectively. Of the 3 unweighted and weighted axes, the first (directly) and third (inversely) unweighted axes, and the first (inversely) and the second (directly) of the weighted axes were statistically significantly associated with diet quality (Supplemental Table 1). Aspects of the global gut microbial community were positively correlated with Axis 1 and other aspects were inversely correlated with Axis 2; however, there was substantial overlap in the gut microbial communities of individuals across the HEI-2010 tertiles (Figure 1). There was a significant difference in the fecal microbiome composition (assessed using the "T" statistic in multiresponse permutation procedures, P < 1.0 × 10⁻⁸) between the participants in tertile 3 and tertile 1 of each dietary index (HEI-2010, T = −20.5; AHEI-2010, T = −11.8; aMED, T = −14.6; DASH, T = −27.8).
FIGURE 1.
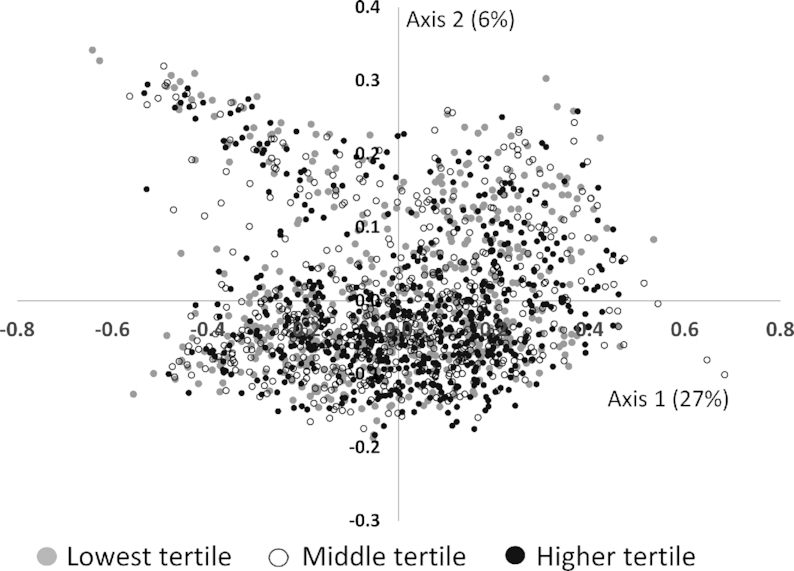
Principal coordinates analysis of the fecal microbiome using a weighted UniFrac distance metric and shaded by Healthy Eating Index-2010 tertile among 1735 participants of the Adiposity Phenotype Study.
Illustrating the 12 individual components of the HEI-2010 in a radar graph shows the relative importance of different foods in determining differences in alpha diversity (Figure 2). Adherence to recommendations for fruit and vegetable consumption was the most important; alpha diversity was greater for participants with higher intakes of total vegetables, greens and beans, total fruit, and whole fruit at the APS clinic visit. Other components with differences included sodium, refined and whole grains, the fatty acid ratio, and dairy products, whereas empty calories and protein foods did not vary across tertiles of alpha diversity.
FIGURE 2.
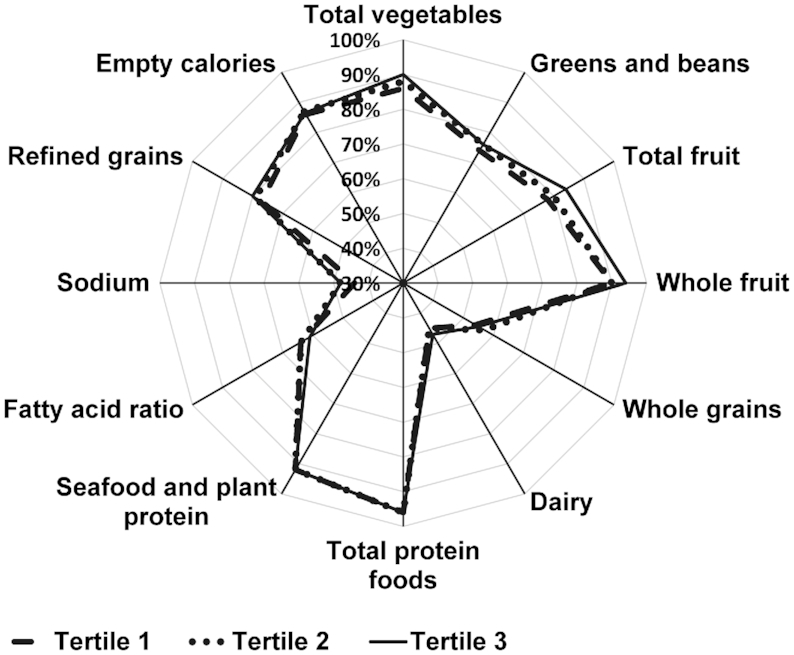
Radar graph representing the 12 component scores of the Healthy Eating Index-2010 (HEI-2010) by tertiles of alpha diversity measured by the Shannon index among 1735 participants of the Adiposity Phenotype Study at clinic visit. The mean (range) values of Shannon index by tertile were: Tertile 1: 5.6 (2.9–6.1); Tertile 2: 6.5 (6.1–6.7); Tertile 3: 7.1 (6.7–8.3). Radar graphs as shown here visualize the range of intakes among the components comprising the total HEI-2010 score. A perfect HEI-2010 total score (100% for each component) would be displayed as a line around the outside border of the radar graph. Individuals in tertile 3 (solid line) consistently had higher diet quality across the components, except for the fatty acid ratio. Discrimination regarding HEI-2010 components between tertile 3 and tertile 1 appeared to be slightly higher scores for fruit, vegetable, and sodium (the latter indicating lower sodium intake).
Discussion
In this multiethnic group of 1735 participants in the APS, diet quality at clinic visit and, to a slightly lesser degree, also at cohort entry 20 y earlier, predicted several measures of fecal microbial community structure and indicated possible long-term patterns. Higher diet quality was associated with greater alpha diversity although the differences in alpha diversity between tertiles of dietary index scores were small. The similarity of the findings for all 4 dietary indexes is consistent with studies examining the same indexes and mortality outcomes among 3 cohorts (8). Our findings are evidence that all 4 indexes capture important components of a healthful diet (8). The most important determinants of these differences in microbial diversity were fruit and vegetable intake (Figure 2). Of 10 phyla examined, the abundance of Actinobacteria was inversely associated with diet quality, but more so at clinic visit than at cohort entry. In agreement with the phyla findings, 21 out of 104 individual bacterial genera were related to diet quality, all from the Actinobacteria, Firmicutes, and Proteobacteria phyla. The associations across the 4 indexes of diet quality were comparable in magnitude, probably because of similarities in underlying components used for scoring.
Our results agree with several reports. Bowyer et al. (13) reported that 16 genera were associated with HEI-2010 and 6 with MDS. The significant associations reported in their study were predominantly between the taxa in Actinobacteria, Firmicutes, and a minor fraction of Proteobacteria, similar to findings in our study. Several genera overlapped with those identified in the MEC, including Lachnospira, Ruminococcus, Coprococcus, and members of the families Christensenellaceae, Coriobacteriaceae, and Erysipelotrichaceae. A study by Claesson et al. (31) showed that the healthy food diversity index (32) correlated positively with fecal alpha diversity (Shannon index) in a sample of 178 individuals (≥65 y) in the United Kingdom who were community-dwelling or in long-term residential care. Further, alpha and beta diversity also differed by data-derived diet groups, with individuals in the “low-fat/high-fiber” group having higher fecal microbial diversity than individuals in the “high-fat/low-fiber” group. However, in the TwinsUK cohort, Bowyer et al. identified 2 phyla (Tenericutes and Lentisphaerae) positively associated, and 2 phyla (Fusobacteria and Chlorobi) inversely associated with HEI-2010, but did not detect significant associations with MDS (13).
Higher dietary pattern scores have been associated with higher total SCFA concentrations, which have beneficial properties for human health (33–36). Our study revealed strikingly consistent patterns across dietary indexes. Approximately half of the significant genera (11/21) associated with HEI-2010 also showed the same significant trend in the other indexes. Interestingly, many of the bacteria have been identified as members of a “core” microbiome found in cohorts that consume westernized diets, suggesting an integral association with human health (3). The indexes not only capture differences in dietary intake but also, as shown here, fundamental features of the microbiome composition in relation to diet. Fiber-fermenting bacteria in particular were captured; Faecalibacterium, Lachnospira, and Ruminococcus (Table 3) were significantly associated with diet quality and have been associated with fermentation and production of SCFAs (37–42). For example, a study showed that reduction of Ruminococcus bromii in the human gut led to significantly lower starch fermentation and reduced exposure to SCFAs (43).
The gut microbiome associated with human disorders shows reduced bacterial species richness and diversity that is often affected by poor-quality diets (44–46). In our study, the genus Collinsella was significantly inversely associated with all 4 dietary indexes. Several inflammatory diseases have been associated with an increase in Collinsella, including irritable bowel syndrome, rheumatoid arthritis, diabetes, and colon cancer (47–50). Collinsella, which has been associated with low intake of dietary fiber and altered fat metabolism, has been positively associated with host plasma concentration of cholesterol. Collinsella spp. are also capable of bile acid deconjugation (51, 52). The HEI-2010 was also inversely associated with 2 members of the family Enterobacteriaceae, that is, Enterobacter and Escherichia-Shigella (Table 3), which were not captured by the other indexes of dietary intake. Members of this family have been associated with lower intake of dietary fiber, a hallmark of a westernized diet (53–55). Escherichia-Shigella and Enterobacter have also been associated with diet-related diseases linked to increased systemic inflammation (56–59).
The observation that diet quality as assessed 20 y before stool collection predicted characteristics of the gut microbiome agrees with evidence of long-term patterns of gut microbial composition. An investigation following 5 individuals for up to 12 y found that environmentally introduced changes during adulthood affected primarily the abundance but not the presence of specific microbial species (60). A subject-specific microbiome core, that is, an individual pattern of certain genera, remained constant over time and was only disturbed to a limited degree by antibiotic use and dietary factors (60). A more recent report based on 2 cohorts (3) detected a 14-genera core microbiota. The relative stability of gut microbiota was also confirmed in studies of a Hutterite community showing higher between-population than seasonal variation in the microbiome (61), of 10 Japanese men and women (62), and of a group of 308 US men (63).
Strengths of this study include the large, well-characterized sample, the ethnic diversity, the wide range of BMI within the study population, the stringent protocol for fecal sample collection, and capacity to evaluate associations between the fecal microbial community and current diet, as well as the diet assessed 20 y previously using a QFFQ designed to capture nutritional intakes of 5 different ethnic groups. The incorporation of 4 dietary indexes within the MEC allowed the assessment of diet quality based on diverse guidelines (14). Limitations include the small number of participants within each sex-by-ethnicity group, which prevented stratification by subgroup, and the limited age range of the study sample. When we tested for interactions in the diversity models, no indication for heterogeneity across sex and ethnic groups was detected. Further, we only had 1 stool sample per participant with which to characterize an individual's microbiome; however, previous studies have shown that a single assessment adequately captures the interindividual variation (23, 64).
Our findings support a role for a high-quality diet in the structure and diversity of the gut microbiome, as assessed at the time of and 20 y before stool collection, among individuals across BMI categories. With increasing knowledge of how gut microbial composition influences the risk of various diseases, interest is growing on how to modify the microbiome within populations. As the nutritional community moves toward assessing dietary patterns instead of single nutrients, counseling individuals to adopt dietary changes that positively impact these patterns can also affect the gut microbiome and overall health status. As shown by the current analysis, several commonly used diet quality indexes based on diverse guidelines show similar associations with parameters of the gut microbiome.
Supplementary Material
Acknowledgments
We acknowledge the contribution of the following study staff members whose excellent performance made this research possible: Adelaida Irimian, Chanthel Figueroa, Brenda Figueroa, Karla Soriano (Recruitment and Data Collection Core staff at the University of Southern California) and Dr Terrilea Burnett, Jane Yakuma, Naomi Hee, Clara Richards, Cheryl Toyofuku, Hui Chang, Janice Nako-Piburn (Recruitment and Data Collection Core staff at the University of Hawaii Cancer Center); Zhihan Huang (Data Management and Analysis Core staff at the University of Southern California) and Maj Earle, Joel Julian, Anne Tome (Data Management and Analysis Core staff at the University of Hawaii Cancer Center); Eugene Okiyama (Project Administrative Core staff at the University of Hawaii Cancer Center); Orsalem Kahsai, Wendy Thomas, Elizabeth Traylor, Crystal Voyce, and Keith Curtis (J Lampe Laboratory at Fred Hutchinson Cancer Research Center).
The authors’ responsibilities were as follows—GM, UL, JWL, MAJH, and CJB: designed the study; UL, KRM, JAS, and CJB: conducted the research; GM, MAJH, UL, LRW, and JAS: analyzed the specimens and data; GM, JWL, MAJH, and JH: wrote the article; TWR, UL, CJB, and LLM: provided critical review; GM and JWL: had primary responsibility for final content; all authors: read and approved the final manuscript.
Notes
Supported by US National Cancer Institutegrants P01CA169530, U01CA164973, P30 CA071789, P30 CA015704, and UL1TR000130.
Author disclosures: GM, MAJH, KRM, JAS, JH, TWR, LRW, CJB, LLM, UL, and JWL, no conflicts of interest.
Supplemental Figure 1 and Supplemental Table 1 are available from the “Supplementary data” link in the online posting of the article and from the same link in the online table of contents at https://academic.oup.com/jn/.
Abbreviations used: AHEI, Alternative Healthy Eating Index; aMED, alternate Mediterranean Diet; APS, Adiposity Phenotype Study; DASH, Dietary Approaches to Stop Hypertension Trial; HEI, Healthy Eating Index; MDS, Mediterranean Diet Score; MEC, Multiethnic Cohort; OTU, operational taxanomic unit; QFFQ, quantitative food frequency questionnaire.
References
- 1. Thomas S, Izard J, Walsh E, Batich K, Chongsathidkiet P, Clarke G, Sela DA, Muller AJ, Mullin JM, Albert K et al.. The host microbiome regulates and maintains human health: a primer and perspective for non-microbiologists. Cancer Res. 2017;77:1783–812. [DOI] [PMC free article] [PubMed] [Google Scholar]
- 2. Miele L, Giorgio V, Alberelli MA, De Candia E, Gasbarrini A, Grieco A. Impact of gut microbiota on obesity, diabetes, and cardiovascular disease risk. Curr Cardiol Rep. 2015;17:120. [DOI] [PubMed] [Google Scholar]
- 3. Falony G, Joossens M, Vieira-Silva S, Wang J, Darzi Y, Faust K, Kurilshikov A, Bonder MJ, Valles-Colomer M, Vandeputte D et al.. Population-level analysis of gut microbiome variation. Science. 2016;352:560–4. [DOI] [PubMed] [Google Scholar]
- 4. Simpson HL, Campbell BJ. Review article: dietary fibre-microbiota interactions. Aliment Pharmacol Ther. 2015;42:158–79. [DOI] [PMC free article] [PubMed] [Google Scholar]
- 5. Fava F, Gitau R, Griffin BA, Gibson GR, Tuohy KM, Lovegrove JA. The type and quantity of dietary fat and carbohydrate alter faecal microbiome and short-chain fatty acid excretion in a metabolic syndrome ‘at-risk’ population. Int J Obes (Lond). 2013;37:216–23. [DOI] [PubMed] [Google Scholar]
- 6. Varraso R, Chiuve SE, Fung TT, Barr RG, Hu FB, Willett WC, Camargo CA. Alternate Healthy Eating Index 2010 and risk of chronic obstructive pulmonary disease among US women and men: prospective study. BMJ. 2015;350:h286. [DOI] [PMC free article] [PubMed] [Google Scholar]
- 7. Schwingshackl L, Hoffmann G.. Diet quality as assessed by the Healthy Eating Index, the Alternate Healthy Eating Index, the Dietary Approaches to Stop Hypertension score, and health outcomes: a systematic review and meta-analysis of cohort studies. J Acad Nutr Diet. 2015;115:780–800.e5. [DOI] [PubMed] [Google Scholar]
- 8. Liese AD, Krebs-Smith SM, Subar AF, George SM, Harmon BE, Neuhouser ML, Boushey CJ, Schap TE, Reedy J. The Dietary Patterns Methods Project: synthesis of findings across cohorts and relevance to dietary guidance. J Nutr. 2015;145:393–402. [DOI] [PMC free article] [PubMed] [Google Scholar]
- 9. Haro C, Garcia-Carpintero S, Rangel-Zuniga OA, Alcala-Diaz JF, Landa BB, Clemente JC, Perez-Martinez P, Lopez-Miranda J, Perez-Jimenez F, Camargo A. Consumption of two healthy dietary patterns restored microbiota dysbiosis in obese patients with metabolic dysfunction. Mol Nutr Food Res. [Internet]2017;61(12). doi:10.1002/mnfr.201700300. [DOI] [PubMed] [Google Scholar]
- 10. Gutierrez-Diaz I, Fernandez-Navarro T, Salazar N, Bartolome B, Moreno-Arribas MV, de Andres-Galiana EJ, Fernandez-Martinez JL, Reyes-Gavilan CGD, Gueirnonde M, Gonzalez S. Adherence to a Mediterranean diet influences the fecal metabolic profile of microbial-derived phenolics in a Spanish cohort of middle-age and older people. J Agric Food Chem. 2017;65:586–95. [DOI] [PubMed] [Google Scholar]
- 11. Mitsou EK, Kakali A, Antonopoulou S, Mountzouris KC, Yannakoulia M, Panagiotakos DB, Kyriacou A. Adherence to the Mediterranean diet is associated with the gut microbiota pattern and gastrointestinal characteristics in an adult population. Br J Nutr. 2017;117:1645–55. [DOI] [PubMed] [Google Scholar]
- 12. De Filippis F, Pellegrini N, Vannini L, Jeffery IB, La Storia A, Laghi L, Serrazanetti DI, Di Cagno R, Ferrocino I, Lazzi C et al.. High-level adherence to a Mediterranean diet beneficially impacts the gut microbiota and associated metabolome. Gut. 2016;65:1812–21. [DOI] [PubMed] [Google Scholar]
- 13. Bowyer RCE, Jackson MA, Pallister T, Skinner J, Spector TD, Welch AA, Steves CJ. Use of dietary indices to control for diet in human gut microbiota studies. Microbiome. 2018;6:77. [DOI] [PMC free article] [PubMed] [Google Scholar]
- 14. Harmon BE, Boushey CJ, Shvetsov YB, Ettienne R, Reedy J, Wilkens LR, Le Marchand L, Henderson BE, Kolonel LN. Associations of key diet-quality indexes with mortality in the Multiethnic Cohort: the Dietary Patterns Methods Project. Am J Clin Nutr. 2015;101:587–97. [DOI] [PMC free article] [PubMed] [Google Scholar]
- 15. Kolonel LN, Henderson BE, Hankin JH, Nomura AMY, Wilkens LR, Pike MC, Stram DO, Monroe KR, Earle ME, Nagamine FS. A multiethnic cohort in Hawaii and Los Angeles: baseline characteristics. Am J Epidemiol. 2000;151:346–57. [DOI] [PMC free article] [PubMed] [Google Scholar]
- 16. Maskarinec G, Lim U, Jacobs S, Monroe KR, Ernst T, Buchthal SD, Shepherd JA, Wilkens LR, Le Marchand L, Boushey CJ. Diet quality in midadulthood predicts visceral adiposity and liver fatness in older ages: the Multiethnic Cohort Study. Obesity (Silver Spring). 2017;25:1442–50. [DOI] [PMC free article] [PubMed] [Google Scholar]
- 17. Stram DO, Hankin JH, Wilkens LR, Pike MC, Monroe KR, Park S, Henderson BE, Nomura AM, Earle ME, Nagamine FS et al.. Calibration of the dietary questionnaire for a multiethnic cohort in Hawaii and Los Angeles. Am J Epidemiol. 2000;151:358–70. [DOI] [PMC free article] [PubMed] [Google Scholar]
- 18. Murphy SP. Unique nutrition support for research at the Cancer Research Center of Hawaii. Hawaii Med J. 2002;61:15–7. [PubMed] [Google Scholar]
- 19. US Department of Agriculture, US Department of Health and Human Services. Dietary Guidelines for Americans 2010. [Internet] 7th ed.Washington DC: US Government Printing Office; 2010. Available from: https://health.gov/dietaryguidelines/2010/. [Google Scholar]
- 20. Chiuve SE, Fung TT, Rimm EB, Hu FB, McCullough ML, Wang M, Stampfer MJ, Willett WC. Alternative dietary indices both strongly predict risk of chronic disease. J Nutr. 2012;142:1009–18. [DOI] [PMC free article] [PubMed] [Google Scholar]
- 21. Fung TT, McCullough ML, Newby PK, Manson JE, Meigs JB, Rifai N, Willett WC, Hu FB. Diet-quality scores and plasma concentrations of markers of inflammation and endothelial dysfunction. Am J Clin Nutr. 2005;82:163–73. [DOI] [PubMed] [Google Scholar]
- 22. Fu BC, Randolph TW, Lim U, Monroe KR, Cheng I, Wilkens LR, Le Marchand L, Hullar MA, Lampe JW. Characterization of the gut microbiome in epidemiologic studies: the multiethnic cohort experience. Ann Epidemiol. 2016;26:373–9. [DOI] [PMC free article] [PubMed] [Google Scholar]
- 23. Fu BC, Randolph TW, Lim U, Monroe KR, Cheng I, Wilkens LR, Le Marchand L, Lampe JW, Hullar MAJ. Temporal variability and stability of the fecal microbiome: the Multiethnic Cohort Study. Cancer Epidemiol Biomarkers Prev. 2019;28:154–62. [DOI] [PMC free article] [PubMed] [Google Scholar]
- 24. Shannon CE, Weaver W. A mathematical theory of communication. Bell System Tech J. 1948;27:379–423., 623–56. [Google Scholar]
- 25. Lozupone C, Knight R. UniFrac: a new phylogenetic method for comparing microbial communities. Appl Environ Microbiol. 2005;71:8228–35. [DOI] [PMC free article] [PubMed] [Google Scholar]
- 26. Lozupone CA, Hamady M, Kelley ST, Knight R. Quantitative and qualitative beta diversity measures lead to different insights into factors that structure microbial communities. Appl Environ Microbiol. 2007;73:1576–85. [DOI] [PMC free article] [PubMed] [Google Scholar]
- 27. Baker GC, Smith JJ, Cowan DA. Review and re-analysis of domain-specific 16S primers. J Microbiol Methods. 2003;55:541–55. [DOI] [PubMed] [Google Scholar]
- 28. DeLong EF. Archaea in coastal marine environments. Proc Natl Acad Sci USA. 1992;89:5685–9. [DOI] [PMC free article] [PubMed] [Google Scholar]
- 29. Anderson MJ, Robinson J. Permutation tests for linear models. Aust N Z J Stat. 2001;43:75–88. [Google Scholar]
- 30. Panizza CE, Shvetsov YB, Harmon BE, Wilkens LR, Le Marchand L, Haiman C, Reedy J, Boushey CJ. Testing the predictive validity of the Healthy Eating Index-2015 in the Multiethnic Cohort: is the score associated with a reduced risk of all-cause and cause-specific mortality?. Nutrients. [Internet]2018;10(4):E452 doi:10.3390/nu10040452. [DOI] [PMC free article] [PubMed] [Google Scholar]
- 31. Claesson MJ, Jeffery IB, Conde S, Power SE, O'Connor EM, Cusack S, Harris HM, Coakley M, Lakshminarayanan B, O'Sullivan O et al.. Gut microbiota composition correlates with diet and health in the elderly. Nature. 2012;488:178–84. [DOI] [PubMed] [Google Scholar]
- 32. Drescher LS, Thiele S, Mensink GB. A new index to measure healthy food diversity better reflects a healthy diet than traditional measures. J Nutr. 2007;137:647–51. [DOI] [PubMed] [Google Scholar]
- 33. O'Keefe SJ, Li JV, Lahti L, Ou J, Carbonero F, Mohammed K, Posma JM, Kinross J, Wahl E, Ruder E et al.. Fat, fibre and cancer risk in African Americans and rural Africans. Nat Commun. 2015;6:6342. [DOI] [PMC free article] [PubMed] [Google Scholar]
- 34. Sonnenburg ED, Zheng H, Joglekar P, Higginbottom SK, Firbank SJ, Bolam DN, Sonnenburg JL. Specificity of polysaccharide use in intestinal Bacteroides species determines diet-induced microbiota alterations. Cell. 2010;141:1241–52. [DOI] [PMC free article] [PubMed] [Google Scholar]
- 35. Sonnenburg ED, Sonnenburg JL. Starving our microbial self: the deleterious consequences of a diet deficient in microbiota-accessible carbohydrates. Cell Metab. 2014;20:779–86. [DOI] [PMC free article] [PubMed] [Google Scholar]
- 36. Sonnenburg JL, Backhed F. Diet-microbiota interactions as moderators of human metabolism. Nature. 2016;535:56–64. [DOI] [PMC free article] [PubMed] [Google Scholar]
- 37. Flint HJ, Duncan SH, Scott KP, Louis P. Links between diet, gut microbiota composition and gut metabolism. Proc Nutr Soc. 2015;74:13–22. [DOI] [PubMed] [Google Scholar]
- 38. Lopez-Siles M, Martinez-Medina M, Abella C, Busquets D, Sabat-Mir M, Duncan SH, Aldeguer X, Flint HJ, Garcia-Gil LJ. Mucosa-associated Faecalibacterium prausnitzii phylotype richness is reduced in patients with inflammatory bowel disease. Appl Environ Microbiol. 2015;81:7582–92. [DOI] [PMC free article] [PubMed] [Google Scholar]
- 39. Rios-Covian D, Gueimonde M, Duncan SH, Flint HJ, de los Reyes-Gavilan CG. Enhanced butyrate formation by cross-feeding between Faecalibacterium prausnitzii and Bifidobacterium adolescentis. FEMS Microbiol Lett. [Internet]2015;362:fnv176 doi:10.1093/femsle/fnv176. [DOI] [PubMed] [Google Scholar]
- 40. Chung WSF, Walker AW, Louis P, Parkhill J, Vermeiren J, Bosscher D, Duncan SH, Flint HJ. Modulation of the human gut microbiota by dietary fibres occurs at the species level. BMC Biol. 2016;14:3. [DOI] [PMC free article] [PubMed] [Google Scholar]
- 41. Louis P, Flint HJ. Diversity, metabolism and microbial ecology of butyrate-producing bacteria from the human large intestine. FEMS Microbiol Lett. 2009;294:1–8. [DOI] [PubMed] [Google Scholar]
- 42. Louis P, Young P, Holtrop G, Flint HJ. Diversity of human colonic butyrate-producing bacteria revealed by analysis of the butyryl-CoA:acetate CoA-transferase gene. Environ Microbiol. 2010;12:304–14. [DOI] [PubMed] [Google Scholar]
- 43. Venkataraman A, Sieber JR, Schmidt AW, Waldron C, Theis KR, Schmidt TM. Variable responses of human microbiomes to dietary supplementation with resistant starch. Microbiome. 2016;4:33. [DOI] [PMC free article] [PubMed] [Google Scholar]
- 44. Cani PD, Delzenne NM. Interplay between obesity and associated metabolic disorders: new insights into the gut microbiota. Curr Opin Pharmacol. 2009;9:737–43. [DOI] [PubMed] [Google Scholar]
- 45. Cani PD, Delzenne NM. The role of the gut microbiota in energy metabolism and metabolic disease. Curr Pharm Des. 2009;15:1546–58. [DOI] [PubMed] [Google Scholar]
- 46. Le Chatelier E, Nielsen T, Qin JJ, Prifti E, Hildebrand F, Falony G, Almeida M, Arumugam M, Batto JM, Kennedy S et al.. Richness of human gut microbiome correlates with metabolic markers. Nature. 2013;500:541–6. [DOI] [PubMed] [Google Scholar]
- 47. Marchesi JR, Dutilh BE, Hall N, Peters WH, Roelofs R, Boleij A, Tjalsma H. Towards the human colorectal cancer microbiome. PLoS One. 2011;6:e20447. [DOI] [PMC free article] [PubMed] [Google Scholar]
- 48. Vijay-Kumar M, Aitken JD, Carvalho FA, Cullender TC, Mwangi S, Srinivasan S, Sitaraman SV, Knight R, Ley RE, Gewirtz AT. Metabolic syndrome and altered gut microbiota in mice lacking Toll-like receptor 5. Science. 2010;328:228–31. [DOI] [PMC free article] [PubMed] [Google Scholar]
- 49. Chen J, Wright K, Davis JM, Jeraldo P, Marietta EV, Murray J, Nelson H, Matteson EL, Taneja V. An expansion of rare lineage intestinal microbes characterizes rheumatoid arthritis. Genome Med. 2016;8:43. [DOI] [PMC free article] [PubMed] [Google Scholar]
- 50. Kassinen A, Krogius-Kurikka L, Makivuokko H, Rinttila T, Paulin L, Corander J, Malinen E, Apajalahti J, Palva A. The fecal microbiota of irritable bowel syndrome patients differs significantly from that of healthy subjects. Gastroenterology. 2007;133:24–33. [DOI] [PubMed] [Google Scholar]
- 51. Lahti L, Salonen A, Kekkonen RA, Salojarvi J, Jalanka-Tuovinen J, Palva A, Oresic M, de Vos WM. Associations between the human intestinal microbiota, Lactobacillus rhamnosus GG and serum lipids indicated by integrated analysis of high-throughput profiling data. PeerJ. 2013;1:e32. [DOI] [PMC free article] [PubMed] [Google Scholar]
- 52. Rajilic-Stojanovic M, de Vos WM. The first 1000 cultured species of the human gastrointestinal microbiota. FEMS Microbiol Rev. 2014;38:996–1047. [DOI] [PMC free article] [PubMed] [Google Scholar]
- 53. Metzler-Zebeli BU, Hooda S, Pieper R, Zijlstra RT, van Kessel AG, Mosenthin R, Ganzle MG. Nonstarch polysaccharides modulate bacterial microbiota, pathways for butyrate production, and abundance of pathogenic Escherichia coli in the pig gastrointestinal tract. Appl Environ Microbiol. 2010;76:3692–701. [DOI] [PMC free article] [PubMed] [Google Scholar]
- 54. Satoh H, Takeuchi K. Role of food and enterobacteria in the formation and prevention of small intestinal damage induced by NSAIDS. Front Gastroint Res. 2012;30:52–60. [Google Scholar]
- 55. Zumbrun SD, Melton-Celsa AR, Smith MA, Gilbreath JJ, Merrell DS, O'Brien AD. Dietary choice affects Shiga toxin-producing Escherichia coli (STEC) O157:H7 colonization and disease. Proc Natl Acad Sci USA. 2013;110:E2126–E33. [DOI] [PMC free article] [PubMed] [Google Scholar]
- 56. Bonnet M, Buc E, Sauvanet P, Darcha C, Dubois D, Pereira B, Dechelotte P, Bonnet R, Pezet D, Darfeuille-Michaud A. Colonization of the human gut by E. coli and colorectal cancer risk. Clin Cancer Res. 2014;20:859–67. [DOI] [PubMed] [Google Scholar]
- 57. Carvalho FA, Koren O, Goodrich JK, Johansson ME, Nalbantoglu I, Aitken JD, Su Y, Chassaing B, Walters WA, Gonzalez A et al.. Transient inability to manage proteobacteria promotes chronic gut inflammation in TLR5-deficient mice. Cell Host Microbe. 2012;12:139–52. [DOI] [PMC free article] [PubMed] [Google Scholar]
- 58. Feezor RJ, Oberholzer C, Baker HV, Novick D, Rubinstein M, Moldawer LL, Pribble J, Souza S, Dinarello CA, Ertel W et al.. Molecular characterization of the acute inflammatory response to infections with gram-negative versus gram-positive bacteria. Infect Immun. 2003;71:5803–13. [DOI] [PMC free article] [PubMed] [Google Scholar]
- 59. Manuzak JA, Dillon SM, Lee EJ, Dong ZM, Hecht DK, Wilson CC. Increased Escherichia coli-induced interleukin-23 production by CD16+ monocytes correlates with systemic immune activation in untreated HIV-1-infected individuals. J Virol. 2013;87:13252–62. [DOI] [PMC free article] [PubMed] [Google Scholar]
- 60. Rajilic-Stojanovic M, Heilig HG, Tims S, Zoetendal EG, de Vos WM. Long-term monitoring of the human intestinal microbiota composition. Environ Microbiol. 2012;15:1146–59. [DOI] [PubMed] [Google Scholar]
- 61. Davenport ER, Mizrahi-Man O, Michelini K, Barreiro LB, Ober C, Gilad Y. Seasonal variation in human gut microbiome composition. PLoS One. 2014;9:e90731. [DOI] [PMC free article] [PubMed] [Google Scholar]
- 62. Hisada T, Endoh K, Kuriki K. Inter- and intra-individual variations in seasonal and daily stabilities of the human gut microbiota in Japanese. Arch Microbiol. 2015;197:919–34. [DOI] [PMC free article] [PubMed] [Google Scholar]
- 63. Mehta RS, Abu-Ali GS, Drew DA, Lloyd-Price J, Subramanian A, Lochhead P, Joshi AD, Ivey KL, Khalili H, Brown GT et al.. Stability of the human faecal microbiome in a cohort of adult men. Nat Microbiol. 2018;3:347–55. [DOI] [PMC free article] [PubMed] [Google Scholar]
- 64. Claesson MJ, Cusack S, O'Sullivan O, Greene-Diniz R, de Weerd H, Flannery E, Marchesi JR, Falush D, Dinan T, Fitzgerald G et al.. Composition, variability, and temporal stability of the intestinal microbiota of the elderly. Proc Natl Acad Sci USA. 2011;108(Suppl 1):4586–91. [DOI] [PMC free article] [PubMed] [Google Scholar]
Associated Data
This section collects any data citations, data availability statements, or supplementary materials included in this article.