

Summary
Although clonal neo-antigen burden is associated with improved response to immune therapy, the functional basis for this remains unclear. Here we study this question in a novel controlled mouse melanoma model that enables us to explore the effects of intra-tumor heterogeneity (ITH) on tumor aggressiveness and immunity independent of tumor mutational burden. Induction of UVB-derived mutations yields highly aggressive tumors with decreased anti-tumor activity. However, single-cell-derived tumors with reduced ITH are swiftly rejected. Their rejection is accompanied by increased T cell reactivity and a less suppressive microenvironment. Using phylogenetic analyses and mixing experiments of single-cell clones, we dissect two characteristics of ITH: the number of clones forming the tumor and their clonal diversity. Our analysis of melanoma patient tumor data recapitulates our results in terms of overall survival and response to immune checkpoint therapy. These findings highlight the importance of clonal mutations in robust immune surveillance and the need to quantify patient ITH to determine the response to checkpoint blockade.
Keywords: anti-tumor immunity, intra-tumor heterogeneity, mutational load, melanoma, cancer neoantigens, checkpoint immunotherapy, mouse model
Graphical Abstract
Highlights
-
•
Novel mouse system to uncouple tumor mutational load and tumor heterogeneity
-
•
Lower tumor heterogeneity leads to decreased tumor growth because of immune rejection
-
•
Both clone numbers and their genetic diversity mediate tumor growth and rejection
-
•
Tumor heterogeneity is linked to patient survival and checkpoint blockade response
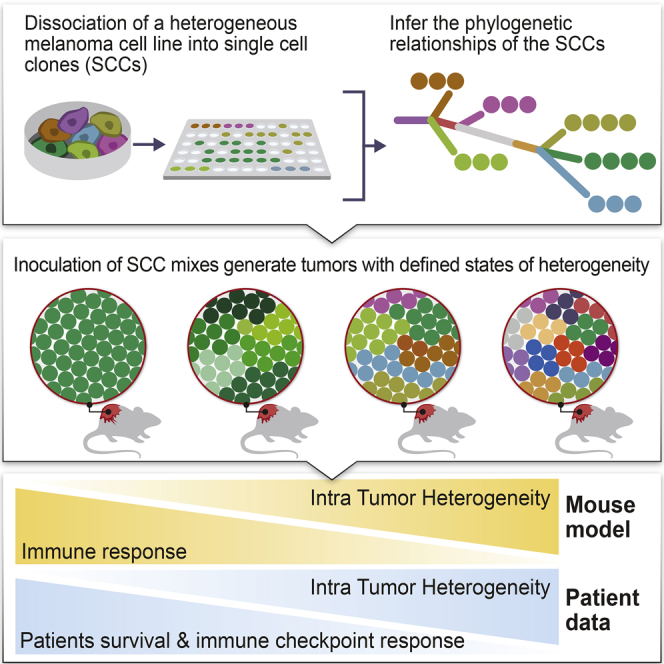
Syngeneic mouse models of melanoma and human patient data are used to explore the effect of intra-tumor heterogeneity on immune response and demonstrate that heterogeneity predicts immunotherapy outcomes better than mutational burden.
Introduction
It has recently been shown that immunotherapy strategies that enhance the anti-tumor T cell response, such as checkpoint inhibitors and adoptive T cell therapy, have remarkable clinical effects in a wide range of tumor types (Ribas and Wolchok, 2018, Wolf and Samuels, 2018). However, many tumors do not respond to checkpoint inhibitors, and the determinants of treatment efficacy remain largely unknown (Sharma et al., 2017). Neoantigens that arise as a consequence of somatic mutations within the tumor represent an attractive means to promote immune recognition in cancer (Gubin et al., 2014). Indeed, a high tumor mutational burden (TMB) and neoantigen load in tumors have been associated with an enhanced response to immune checkpoint blockade therapy (Chan et al., 2019, Germano et al., 2017, Hellmann et al., 2018, Samstein et al., 2019, Snyder et al., 2014, Van Allen et al., 2015). Cutaneous melanoma, which is among the most highly mutated malignancies (Alexandrov et al., 2013), has the highest objective response rates to checkpoint blockade (∼60% upon combined CTLA-4 and PD-1 blockade; Larkin et al., 2015). There is a growing appreciation of the key role of T cells responding to neoantigens in the efficacy of melanoma therapy (Gros et al., 2016, Gubin et al., 2014, Rooney et al., 2015, Strønen et al., 2016). Furthermore, T cell activation and dysfunctional states are essential for controlling tumor immunity (Chihara et al., 2018, Kurtulus et al., 2019, Li et al., 2019, Sade-Feldman et al., 2018).
The leading hypothesis in the immunotherapy field is that tumors with increased TMB present more neoantigens and, thus, are more immunogenic (Germano et al., 2017, Gubin et al., 2015, Hellmann et al., 2018, Rizvi et al., 2015, Strønen et al., 2016, Van Allen et al., 2015). However, tumors containing equally high TMB levels exhibit a variable immune response (Rooney et al., 2015), and some cancers with a low TMB do still respond to immunotherapy (Miao et al., 2018a), which brings into question the association between TMB and immune response. Moreover, the predicted neoantigen load does not correlate with T cell infiltration in melanoma (Spranger et al., 2016), and TMB alone is not a sensitive or specific predictor of treatment outcome (Hugo et al., 2016), suggesting that additional factors determine T cell reactivity.
In parallel, it has recently been reported that intratumor heterogeneity (ITH), manifested by the distribution of clonal versus sub-clonal mutations and neoantigens (McGranahan and Swanton, 2017, Spranger, 2016), may influence immune surveillance (McDonald et al., 2019, McGranahan et al., 2016, Reuben et al., 2017, Rosenthal et al., 2019). Specifically, clonal neoantigen burden appears to correlate with an improved response to checkpoint inhibitor blockade across a wide range of tumor types (McGranahan et al., 2016, Miao et al., 2018b) and with a favorable outcome following primary non-small-cell lung cancer (NSCLC) surgical resection (Rosenthal et al., 2019). In addition, pan-cancer analyses show better survival for tumors with low ITH (Andor et al., 2016, Jamal-Hanjani et al., 2017, Miao et al., 2018b, Morris et al., 2016). These findings point to ITH as a highly relevant determinant of tumor immune surveillance that merits further experimental evaluation.
Despite past attempts to model the effect of increased TMB (Wang et al., 2017) or ITH (Gejman et al., 2018) on immune response, no efforts have been made to study the combined effects of TMB and ITH in a comparative, causal manner. Here we developed a novel in vivo approach to evaluate the contributions of ITH and TMB on immune-mediated tumor rejection and study its parallels in patient data. Using an array of clonal mixing experiments, we further systematically dissect the functional ramifications of the two main components of tumor ITH: the number of clones generating the tumor and their genomic clonal divergence.
Results
ITH Levels Correlate with Melanoma Patient Survival
Neoantigen burden and ITH are associated with overall survival in primary lung adenocarcinomas (McGranahan et al., 2016). Reasoning that these variables may also be associated with melanoma patient survival, we analyzed a cohort of 402 untreated TCGA (The Cancer Genome Atlas; Cancer Genome Atlas Network, 2015) melanoma patients. Patients were grouped based on their mutational load, copy number variation (CNV), and ITH (estimated as the number of clones), which were computed based on each sample’s somatic copy number alterations and somatic mutation data (STAR Methods; Figures S1A–S1C). Neither mutational load nor CNV load, as a single component, was significantly associated with patient survival (Figures 1A and 1B). However, patients with low ITH had significantly better survival (Figure 1C), consistent with previous observations (Brown et al., 2014, Morris et al., 2016). Indeed, when patients were segregated by number of clones, distinct survival curves could be seen; patients with low ITH levels (2 clones) had the best survival rate, whereas those with high ITH levels (6 clones) had the worst survival rate (Figure 1D). When combining all three factors, we found that patients with a high ITH and a low mutational or CNV load had the worst survival rate (Figures 1E and 1F). These conclusions hold when controlling for potential confounding factors, including age, tumor stage, and tumor purity (STAR Methods). Finally, for each patient we computed the “cytolytic score (CYT)” (Rooney et al., 2015), which is associated with the degree of anticancer immunity based on the geometric mean expression of two key cytolytic effectors, Granzyme A and Perforin-1, which are upregulated upon CD8+ T cell activation and upon effective immunotherapy treatment. CYT scores were significantly higher in patients with low ITH compared with those with high ITH (Figure 1G; Wilcoxon rank-sum test, p = 4.32 × 10⁻⁶). Notably, the CYT scores were inversely correlated with the degree of number of clones throughout the TCGA cohort (Figure 1H; Spearman’s rho = −0.27, p = 4.3 × 10⁻⁶). Together, our results clearly demonstrate that melanoma ITH plays a role in patient survival.
Figure S1.

Characteristics of Human Melanoma TCGA Data, Related to Figure 1
A) Distribution of the somatic mutation load (silent + non-silent) on a log10 scale. B) Distribution of CNV load – defined as fraction of the genome affected by CNV. C) Distribution of the overall intra tumor heterogeneity estimated using CHAT (See STAR Methods).
Figure 1.

Analysis of the Association between ITH, Mutational Load, and Patient Survival across TCGA Skin Cutaneous Melanoma Samples
(A) Kaplan-Meier survival curves (time is measured in days on the x axis) of patients with high versus low mutational load. Log rank statistics: 1.96, p = 0.16.
(B) Kaplan-Meier survival curves of patients with high versus low CNV load. Log rank statistics: 0.31, p = 0.577.
(C) Kaplan-Meier survival curves of patient with high versus low ITH. Log rank statistics: 3.97, p = 0.046.
(D) Kaplan-Meier survival curves for patients segregated by their number of clones.
(E) Kaplan-Meier survival curves of patients segregated based on the combination of mutational load and ITH. Log rank statistics: 9.2, p = 0.0267.
(F) Kaplan-Meier survival curves of patients segregated based on the combination of CNV load and ITH. Log rank statistics: 4.57, p = 0.206.
(G) CYT score (in log scale) of patients with high versus low ITH. ∗∗∗p < 0.001, Wilcoxon’s test.
(H) CYT score (in log scale) of patients segregated by their number of clones. Spearman’s rho: −0.27, p < 0.001.
For further information regarding the analyses, please refer to STAR Methods and Figure S1.
Establishing an In Vivo Mouse System to Uncouple TMB and ITH
Following these retrospective association results in human patients, we sought to establish an experimental in vivo mouse system that would enable us to uncouple TMB and ITH and study their influence on tumor immunogenicity in a causal, systematic manner. First, to assess the effect of increased mutational load and increased concomitant heterogeneity on anti-tumor immunity, we exposed the mouse melanoma B2905 cell line (Patel et al., 2017) to UVB irradiation (Figure 2A), a key carcinogenic source driving melanoma initiation (De Fabo et al., 2004). Because the literature regarding UVB research in melanoma varies considerably with respect to the amount of radiation exposure needed to induce melanoma genesis, we first titrated the amount of radiation needed for an optimal UVB response without compromising cell longevity. We found that a UVB dose of 600 J/m2 was sufficient to induce p53 elevation (Budden et al., 2016) and cyclobutane pyrimidine dimer (CPD) formation (Chen et al., 2014) while maintaining the longevity of the murine melanoma cell lines B2905 and B16F10.9 (Figures S2A and S2B).
Figure 2.

Differential Heterogeneity Induces Differential Tumor Growth In Vivo
(A) Scheme of experimental design for generating UVB-irradiated cells and generating SCCs derived from UVB-irradiated cells. Cell lines are irradiated by UVB at dosage of 600 J/m2; from these irradiated cells, SCCs are generated.
(B) Distribution of variant allele frequencies (VAFs) of parental B2905 cells (black), UVB-irradiated B2905 cells (red), SCC 1 (purple), and SCC 2 (green) in log2 space. VAF > 0.25 (log2 = −2) is considered clonal.
(C) Tumors excised from mice inoculated with either parental or UVB-irradiated cell lines on day 15 after inoculation.
(D) In vivo tumor growth in mice inoculated with parental B2905 cells (black) and UVB-irradiated cells (red). n = 3–4; data are representative of three independent experiments. Data are mean ± SEM. ∗p < 0.05, ∗∗∗p < 0.001, two-way ANOVA followed by Bonferroni’s post hoc test.
(E) Tumors excised from UVB-irradiated B2905 cells versus SCC 2, day 19.
(F) In vivo growth of tumors in mice inoculated with UVB (red) or SCC 1 (purple) and SCC 2 (green). n = 4–5; data are representative of two independent experiments. Data are mean ± SEM.
∗∗p < 0.01∗∗∗p < 0.001, two-way ANOVA followed by Bonferroni’s post hoc test. ∗ refers to UVB and SSC 1 comparisons; # refers to UVB and SSC 2 comparisons. See also Figure S2, Table S1, and Table S2.
Figure S2.

In Vitro and In Vivo Assessment of UVB-Treated Cells, Related to Figure 2 and Table S2
A) western blot for p53 and GAPDH in B16F10.9 and B2905 cells 24h post irradiation in various UVB dosages. B) Immunofluorescence stains for UVB-induced cyclobutane pyrimidine dimer (CPD) in parental B2905 cells -untreated (left) and UVB irradiated (right). The UVB irradiated cells were fixed, washed and subjected to immunostaining two minutes after irradiation. Scale bar represents 200 μM (for 10x magnification) and 100 μM (for 20x magnification). C) Distribution of somatic alterations in the parental cell line, in comparison to those occurring following UVB exposure show increase in C > T alterations (distribution of added mutations is shown relative to parental). p value was calculated based on the Chi-square test D) Mutation signatures identified by DeconstructSigs for the mutation changes following UVB irradiation (UVB B2905 versus Parental cell line). E-F) In vitro proliferation of parental versus UVB irradiated B2905, and B16F10.9, respectively, starting from 500 cells at day 0. Data are mean ± SEM. G) In vivo tumor growth in mice inoculated with parental B16F10.9 (left panel) and UVB irradiated B16F10.9 (right panel). n = 5, data are representative of two independent experiments. H) Day of tumor onset for the experiment shown in G. I) In vivo tumor growth in mice inoculated with parental B2905 (Black) or UVB irradiated B2905 (red) lines, treated with anti-PD-1 or IgG control antibodies at days 6, 9, and 12 post cells inoculation (n = 11-12). Data are mean ± SEM. Comparisons between parental B2905 tumors treated with IgG or anti-PD-1 treated are depicted by asterisks, whereas comprisons between UVB B2905 tumors treated with IgG or anti-PD-1 are depcited by cross. ∗,+p < 0.05, ∗∗p < 0.01, ∗∗∗p < 0.001, one-way ANOVA followed by Tukey's post hoc test, J) Mutation signature 7, associated with UVB exposure, is identified in SCC 1 and 2 (deconstructSigs tool). K) Macroscopic tumor growth for tumors derived from UVB, SCC 1 and SCC 2 at day 15.
As expected, whole exome sequencing (WES) of these samples revealed that the TMB had increased by 2,734 exonic mutations (Table S1). The number of C > T transversions, a hallmark of melanoma, had also risen (Table S2) (Viros et al., 2014; Figure S2C), as had the UVB-grounded signature 7 (Alexandrov et al., 2013; Figure S2D). In parallel with the increase in TMB upon UVB irradiation, we also detected an increase in ITH from the distribution of the variant allele frequency (VAF; the frequency of a mutation within the population plotted against the probability density function), which was skewed toward a more subclonal phenotype (VAF < 0.25) (Williams et al., 2016) and exhibited a relatively small fraction of clonal single-nucleotide variants (SNVs): 0.063 compared with 0.079 in the parental cell line (Table S1; Figure 2B).
UVB-irradiated B2905 cells grew at a slower rate in vitro compared with non-irradiated B2905 cells (Figure S2E), the irradiated cell line gave rise to tumors with an increased growth rate when transplanted into immunocompetent syngeneic mice (Figures 2C and 2D). This effect was not cell line specific because irradiated B16F10.9 cells showed the same pattern of reduced growth in vitro (Figure S2F) and increased tumorigenicity in vivo (Figures S2G and S2H).
We then assessed whether tumors derived from these two lines, parental B2905 and UVB-irradiated B2905, had a differential response to PD-1 blockade. We found that the response of mice with the UVB-irradiated cell line to anti-PD-1 treatment was considerably milder than the response of those with parental B2905 cells (Figure S2I). Given that the UVB signature cannot predict checkpoint blockade response in melanoma patients (Miao et al., 2018b) and that excessive TMB did not reduce tumor growth, we hypothesized that differences in heterogeneity may play a role in mediating tumor growth in vivo.
Lower Tumor Heterogeneity Leads to Decreased Tumor Growth
To discriminate between the functional effects of ITH and TMB, we assessed the cell growth and immunogenicity of melanoma cells with low ITH but distinct TMB levels. This involved generating single-cell clones (SCCs) from UVB-irradiated B2905 cells (Figure 2A). We first generated and exome-sequenced two such B2905 clones, designated SCC1 and SCC2. Both clones harbored signature 7 mutations (Figure S2J), associated with UVB exposure and a much narrower clonal VAF distribution (SCC1 fraction of clonal SNVs = 0.846, SCC2 fraction of clonal SNVs = 0.887), testifying to significantly lower ITH levels than the origin cell line (Figure 2B). Importantly, the single-cell cloning procedure is stochastic, meaning that heterogeneity is dramatically reduced but the mutational load of the various SCCs varies, ranging from 3,600 to 16,977 somatic mutations (Table S1). Unlike the UVB-irradiated parental cells, the two SCCs grew at a dramatically reduced rate in vivo and did not show an aggressive phenotype (Figures 2E and 2F; Figure S2K), suggesting that low ITH levels are associated with reduced aggressiveness.
To further explore these findings, we generated and inoculated 20 additional UVB-exposed B2905 SCCs into immunocompetent wild-type (WT) mice. We found that, despite the fact that all SCCs grew in vitro (Figure S3A), none exhibited the aggressive phenotype of their original line, giving rise to small tumors that were spontaneously rejected within 2–3 weeks (Figure 3A; Figure S3B). These results further support an association between low ITH levels and reduced aggressiveness. The mutational load, clonal SNV fraction, and C > T fraction of all assessed SCCs are presented in Figure S3C and Table S1.
Figure S3.

Supplemental Data for SCC 1–22, Related to Figure 3
A) In vitro growth of UVB irradiated B2905, and the 22 single cell clones derived from it, measured by SyberGreen proliferation assay. Data are mean ± SD. B) In vivo growth of the UVB irradiated B2905 cells and all 20 SCC depicted in Figure 3A, presented individually. n = 3 for each single cell line inoculation. n = 5 for the UVB irradiated B2905 line. C) Somatic alteration distributions of all SCCs show significant difference in comparison to the parental cell line (mutations added relative to parental are shown) p value was calculated based on the Chi-square test.
Figure 3.

Decreased Heterogeneity Correlates with Increased Anti-tumor Immune Response
(A) In vivo tumor growth in mice inoculated with the UVB-irradiated B2905 cell line (red, n = 5) or with 20 different SCCs derived from this line (SCC 3–22, black, n = 3). Data are representative of at least two independent experiments. Data are mean ± SEM.
(B) In vivo evolution experiment. Shown is a VAF plot for the UVB-irradiated B2905 line, generated from WES data of tumor samples taken on days 7, 9, 13, and 17 after inoculation. Data are representative of two biological repeats.
(C) Left: scheme of secondary cell line generation and its derivative SCCs. Right: in vivo tumor growth in mice inoculated with a secondary cell line derived from a UVB-irradiated B2905 inoculated tumor (red, n = 5) or with 5 different SCCs derived from this line (green, n = 5). Data are mean ± SEM. ∗∗∗p < 0.001 in all SCC versus secondary cell line comparisons.
(D) In vivo tumor growth in NSG immunocompromised mice inoculated with the UVB-irradiated B2905 cell line (red, n = 3) or with SCCs derived from this line (SCC 1, purple, n = 4; SCC 2, green, n = 3) or with parental B2905 cells (black, n = 3). Data are mean ± SEM.
See also Figures S3 and S4.
A possible explanation for the aggressive tumor growth of UVB-irradiated B2905 cells in vivo is the emergence of an escaper SCC within the highly heterogeneous cell population that drives the growth of the overall tumor (McGranahan and Swanton, 2017). If this is the case, then the clonal composition of the tumor should evolve over time and become more homogeneous, and, thus, SCCs derived from the tumor should not be differentially immune rejected. This was assessed by monitoring the genetic composition of the UVB-irradiated tumors using WES of tumor samples taken at different time points after cell line inoculation. However, the clonal structure and heterogeneity remained stable even 17 days after inoculation, confirming that ITH levels did not change over time (Figure 3B). To further assess whether the aggressive tumor growth is sustained when inoculated as homogeneous individual SCCs, we generated ten SCCs from two secondary cell lines derived from two distinct UVB-irradiated tumors. As seen in Figure 3C and Figure S4A, eight of the ten SCCs grew less aggressively than their respective parental cells, and none exceeded the aggressiveness of their respective parental cell line. Together, these data, showing that the vast majority of homogeneous SCCs are not aggressive and that the UVB-derived tumor remains genetically heterogeneous over time in vivo, suggest that the aggressiveness of the UVB-irradiated cell line cannot be solely explained by resistant subclones that outgrow the heterogeneous UVB-irradiated line.
Figure S4.

Characterization of Additional UVB-Irradiated B2905 Lines and SCCs Derived from Them, Related to Figure 3
A) In vivo tumor growth in mice inoculated with a secondary cell line, derived from a UVB irradiated B2905 tumor (red, n = 5) or with 5 different SCC derived from this line. (green, n = 5). Data are mean ± SEM. B-G: Additional, independent, UVB irradiated B2905 cell lines: B) C > T somatic alterations are significantly most dominant following UVB exposure (mutations added relative to parental are shown). p value was calculated based on the Chi-square test. C) Signature 7 mutations associated with UVB exposure is obtained in UVB.2 and UVB.3 using deconstructSigs tool. D) In vivo tumor growth in mice inoculated with a UVB irradiated B2905 cell line, “UVB.2,” (red, n = 6) or with 10 different single cell clones derived from this line. (black, n = 5). Data are mean ± SEM. E) In vitro growth of the cell lines described in D, measured using SyberGreen proliferation assay. Data are mean ± SEM. F) In vivo tumor growth in mice inoculated with a UVB irradiated B2905 cell line, “UVB.3,” (red, n = 5) or with 10 different single cell clones derived from this line. (black, n = 5). Data are mean ± SEM. G) In vitro growth of the cell lines described in F, measured using SyberGreen proliferation assay. Data are mean ± SEM. H) In vivo growth of tumors derived from (the first) UVB irradiated B2905, SCC 1, and SCC 2 in CD80/86−/− mice. n = 4-7. Data are mean ± SEM.
To rule out that the differential growth phenotype between the UVB-irradiated line and the SCCs derived from it was due to the incidental occurrence of some specific UVB-induced mutations in this specific UVB-irradiated cell line, we established two additional independent sets of UVB-irradiated B2905 lines (Figures S4B and S4C) and derived SCCs from them. As in the previous experiment, most of the SCCs (18 of 20) were rejected (Figures S4D and S4F). Importantly, all the generated SCCs grew well in vitro, similar to their cell of origin, UVB-irradiated B2905 cells (Figures S4E and S4G). These results recapitulate our findings with the previous UVB-irradiated cell line.
To identify the mechanisms underlying the in vivo growth differences between UVB-irradiated tumors with variable ITH levels, we focused on the first B2905 UVB-irradiated cell line. This cell line showed the most pronounced C > T alterations, the highest aggressiveness in comparison with the parental line, and a robust differential growth phenotype of all 22 non-aggressive SCCs derived from it. This forms the best setup for studying the effects of tumor heterogeneity on tumor growth in the clearest manner, with as few confounding factors as possible.
Reduced Growth of Low-Heterogeneity Tumors Is Due to Immune Rejection
The differences seen in tumor size between the parental cells, UVB-irradiated cells, and UVB-irradiated SCCs may result from different intrinsic growth rates in vivo or from an immune-dependent anti-tumor response. To investigate the latter, we tested the in vivo growth of parental and UVB-irradiated B2905 cells in immunocompromised non-obese diabetic.Cg-PrkdcscidIl2rgtm1Wjl/SzJ(NSG) mice. These mice are severely immunocompromised because they lack T, B, and natural killer (NK) cells and have impaired myeloid cells. In contrast to the differential growth in WT mice, there was no difference in growth rate between the three cell types in NSG mice (Figure 3D). This demonstrates that, indeed, the differences in growth of these cell lines are due to immune involvement. We further assessed the growth and immunogenicity of the tumors in a less immunocompromised context by inoculating the UVB-irradiated cell line and the two SCCs derived from it into CD80/86−/− double knockout mice that have intact T cells but are devoid of appropriate T cell stimulation (Bar-On et al., 2011) and are resistant to T cell-mediated autoimmunity (Wolf et al., 2018). Both clones exhibited considerably more aggressive growth in CD80/86−/− double knockout mice compared with WT mice, testifying that they are indeed tumorigenic specifically in the absence of a T cell response (Figure S4H).
Decreased Heterogeneity Leads to Elevated T Cell Reactivity and Tumor Infiltration In Vivo
We next evaluated whether the growth rates of the tumors harboring different degrees of heterogeneity are mirrored by the degree of T cell reactivity in vivo. This was assessed by extracting total T cell receptor β+ (TCRβ+) TILs (tumor-infiltrating lymphocytes) from non-irradiated parental B2905 tumors, UVB-irradiated B2905-derived tumors, and B2905 SCC 2-derived tumors. To assess T cell reactivity, we measured the fraction of TILs positive for the cytotoxic mediator Granzyme B coupled with expression of CD107a, a degranulation marker (Alter et al., 2004, Rollman et al., 2007). Although total Granzyme B+ fractions were similar in TILs derived from all tumors, the Granzyme B+ CD107a+ fraction of TILs was significantly reduced in UVB-irradiated B2905-derived tumors, whereas it remained similar in both the parental and the SCC 2-derived tumors (Figure 4A; Figure S5A). In addition, SCC 2-resident TILs contained a much higher interferon-γ+ fraction (Figure 4B; Figure S5B), indicating stronger TIL activation and cytotoxicity. To substantiate these results, we sorted CD8+ TILs from UVB-derived and SCC 2-derived tumors 16 days after inoculation, performed RNA sequencing (RNA-seq), and analyzed the TILs for their CYT score. CD8+ TILs isolated from SCC 2-derived tumors had a higher CYT score, recapitulating the high CYT scores of the low-ITH TCGA melanoma patients (Figures 1G and 1H). Furthermore, this score significantly correlated with tumor weight (Figures 4C and 4D). Thus, the SCC 2-derived tumors, which had low ITH and were ultimately rejected in vivo, were more immunogenic than their parental heterogeneous UVB-irradiated, aggressive B2905-derived tumors, which had high ITH.
Figure 4.

Homogeneous SCCs Elicit a Strong Immune Response
(A) Flow cytometry analysis of the Granzyme B and CD107a population in total TCRβ+ TILs on day 19. n = 4–5; data are mean ± SEM. ∗∗p < 0.01 for Granzyme B+ CD107a+ TILs, two-way ANOVA followed by Bonferroni’s post hoc test.
(B) Flow cytometry analysis of interferon-γ (IFN-γ) in total TILs on day 19. n = 4–5, ∗p < 0.05, Kruskal-Wallis test followed by Dunn’s multiple comparisons test.
(C) CYT score derived from RNA-seq data of sorted CD8+ TILs from UVB-irradiated B2905 and SCC 2 tumors on day 15. ∗p < 0.05, Mann-Whitney U test.
(D) Pearson correlation between CYT score and weights of tumors in Figure 3C.
(E) Quantitation of total CD8+ TILs in the indicated tumors. Four sections from each tumor and three tumors derived from each cell line were examined. A significant difference was observed between parental cells and SSC 2 but not between parental cells and UVB. Data are mean ± SEM. ∗p < 0.05, one-way ANOVA followed by Tukey’s post hoc test.
(F) Relative quantitation of the average percentage of CD8+ TILs in the tumor core versus the margin of the tumors described in (E). Data are mean ± SD.
(G) Representative immunohistochemical stain for CD8 in slides taken from tumors derived by parental, UVB and SCC 2 on day 10 after cell inoculation. The scale bars represent 100 μM.
(H) Immunofluorescence stains of CD3 and Foxp3 in tumors derived from B2905 parental, UVB, and SCC 2, 16, and 11 on days 10−11 after cell inoculation. 3–4 sections from each tumor and two tumors derived from each cell line were examined. The scale bars represent 200 μM.
(I) Relative quantitation of the percentage of Foxp3+ of CD3+ TILs described in (H). Data are mean ± SEM. ∗p < 0.05, one-way ANOVA followed by Tukey’s post hoc test.
See also Figure S5.
Figure S5.

Differential TIL Activation and Infiltration in Differentially Heterogeneous Tumors, Related to Figure 4
A-B) Flow cytometry results of the analyses described in Figure 4 A-B. C) Immunofluorescence of CD3 and CD8 in slides taken from tumors derived by B2905 Parental, UVB and SCC 2. Magnification is 4X. Pictures are representative of three mice per group. Scale bar represents 500 μM. D) higher magnification (10X) of the SCC 2 core. Scale bar represents 200 μM. E-F) Quantification of CD8+ TILs infiltration (E, ∗p < 0.05, ∗∗∗p < 0.001, One-way ANNOVA followed by Tuckey’s post hoc test) and their core versus margin localization in tumors derived from B2905-parental, UVB, and SCC 9,11,16, at day 15 post inoculation. Significant differences are seen between UVB and SSC 11/16 but not between UVB and parental cell lines. n = 3-4. G) Representative immunohistochemical stain for CD8+ cells. Slides were taken from the tumors indicated above, at day 15 post inoculation. Scale bar represents 200 μM.
In addition to the immune composition of the tumor microenvironment, the spatial distribution of TILs within the malignant mass, in particularly immune infiltration into the tumor core, correlates with better survival and treatment success (Kather et al., 2018, König et al., 2019). Immunohistochemistry (IHC) and immunofluorescence analyses of tumor sections revealed that, although tumors derived from all three cell lines accumulated CD8+ TILs in the tumor margin, those derived from SCC 2 featured both higher penetration of CD8+ cells (Figure 4E) and massive infiltration of TILs into the tumor core (Figures 4F and 4G; Figures S5C and S5D). We recapitulated these data in three additional SCCs that also formed tumors large enough for IHC analysis (Figures S5E–S5G). We next quantified the levels of regulatory T cells (Tregs), which are known to suppress anti-tumor immunity and promote tumor growth (Arce Vargas et al., 2017, Tanaka and Sakaguchi, 2017) by CD3+ Foxp3+ immunofluorescence (IF) staining of these tumors and found a direct correlation between ITH and Treg levels (Figures 4H and 4I). In conclusion, low-ITH tumors show enhanced CD8+ T cell infiltration to the tumor core, a lower presence of immunosuppressive Tregs, and higher degranulation and cytotoxicity compared with high-ITH tumors. This indicates that, indeed, low-ITH tumors elicit a strong anti-tumor response, whereas high ITH tumors are relatively non-immunogenic.
Detection of Reactive Neoantigens in Single-Cell-Derived Clones Using Immuno-peptidomics
To evaluate whether the high immunogenicity and T cell infiltration observed in tumors derived from SCCs is at least in part due to the presentation of immunogenic neoantigens, we employed immuno-peptidomics (Kalaora et al., 2016, Kalaora et al., 2018) to identify tumor-specific neoantigens in the various UVB-irradiated B2905-established SCC lines. This entailed purifying major histocompatibility complex (MHC) molecules by immunoaffinity and then analyzing the MHC-eluted peptides by capillary chromatography and tandem mass spectrometry (MS). Using this approach (STAR Methods), we identified a total of 18 neoantigens (Table S3) on 15 SCCs (synthetic peptides had a similar mass spectrum, indicating appropriate identification) (Figure S6A; STAR Methods). Thus, single-clone-specific neoantigens can be detected and might facilitate the anti-tumor immune response.
Figure S6.

Characterization of the Identified Neoantigens, Related to Figure 5
A) Mass spectra of synthetic peptides, identical in their sequence to the indicated neoantigens described in Figure 5. B) Differential binding of the identified neopeptides MHCI; Peptide binding to MHCI molecules was assessed via MHCI stabilization assay using RMA-S cells, incubated with the peptides at 0.1-100 μM for 18 hours. Surface expression of H2-Db and H2-Kb was measured by flow cytometry. C) Flow cytometry analysis showing the BM-derived DCs after 10 days of maturation in culture. These cells were used for peptide vaccination. Results are representative of the three rounds of DCs vaccination. D) Flow cytometry analysis from day 1 (first row) and day 2 (rows 2-4) of the in vivo killing assay for the immunized versus naive mice. At day 1, Splenocytes from a CD45.1+ donor mouse were either loaded with wild-type peptide, unloaded, or loaded with a mutant peptide, labeled with CFSE low, medium and high concentrations, respectively, and subjected to flow cytometry analysis to assure these cells are in 1:1:1 ratios. This splenocytes mixture was injected either to naive mouse, or to 2-3 immunized mice (all CD45.2+). 24 hours later, the immunized mice splenocytes were subjected to flow cytometry analysis. The CD45.1+CFSE+ population was gated, and specific killing percentages were calculated, relative to the naive mice. The red asterisks point to the mutant peptide loaded cells at day 2, in the naive versus immunized mice. The above analysis, for noepeptide Dnm2, is a representative of the killing assays described in Figure 5, for three different neopeptides.
To further characterize the 18 identified neoantigens, we experimentally evaluated their binding to the two murine MHC class I alleles present on the C57/B6 background, H2-Db and H2-Kb, by incubating 11 predicted binders with the TAP-2-deficient lymphoma cell line RMA-S, which can express stable MHC class I only upon peptide binding (Lladser et al., 2010). Using this approach, we identified seven neoantigens that bound H2-Db and two that bound H2-Kb (Figure 5A; Figure S6B).
Figure 5.

Detection and Characterization of HLA-Bound Neoantigens in SCCs
(A) Left: spectra of three representative neoantigens detected by targeted mass spectrometry. The SCCs in which these neoantigens were detected are indicated. Right: surface expression of H2-Db and H2-Kb on RMA-S cells incubated with the peptides at 0.1–100 μM for 18 h and measured by flow cytometry analysis.
(B) In vivo killing assay in mice immunized with the three neoantigens described in (A) using DC vaccination. The killing percentage is calculated relative to the killing measured in naive, non-vaccinated mice.
n = 2–3. Data are mean ± SEM. See also Figure S6 and Tables S2 and S3.
To test the in vivo reactivity of the three strong MHC class I binding neoantigens, we performed dendritic cell (DC)-mediated immunization against these three mutant peptides followed by an in vivo killing assay (Barber et al., 2003). For this, we used peptide-loaded, syngeneic bone marrow-derived DCs, validated as CD11c+CD80+CD86+MHCII+CCR7+ (Figure S6C). We then used CD45.1+ splenocytes loaded with either the mutant peptide (labeled with a high concentration of CFSE), WT peptide (labeled with a low concentration of CFSE) or unloaded splenocytes (labeled with a medium concentration of CFSE) and injected them at a 1:1:1 ratio (Figure S6D) into immunized mice. Twenty-four hours after splenocyte injection, specific killing was measured. As seen in Figure 5, the three neoantigen peptides induced between 17%–67% specific killing in vivo. This suggests that these neoantigens can indeed induce anti-tumor cytotoxicity in vivo, albeit at different levels of efficiency.
In conclusion, we identified 18 neoantigen peptides presented on MHC class I derived from 15 different clones and validated the in vivo reactivity of three of them. Our findings suggest that UVB-irradiated tumors do present neoantigens that can potentially mediate tumor cell killing by cytotoxic cells. However, within the vast heterogeneity of the UVB-irradiated cell line, these reactive peptides may be unable to mediate tumor elimination. In contrast, the robust rejection of the single clone-derived tumors in vivo, which have low ITH, is at least in part due to an enhanced immune response, as illustrated by the elevated levels of cytotoxicity and effector cytokines, detection of neoantigens, and successful infiltration of immune cells into the tumor core.
Systematic Clone Mixture Experiments Show that Both the Number of Clones and Their Genetic Diversity Mediate Tumor Growth and Rejection
To study the role of ITH in tumor rejection, we systematically generated tumors with defined states of heterogeneity using different combinations (mixtures) of the above-described 20 SCCs that were derived from the original, highly heterogeneous UVB-irradiated cell line. The individual SCCs were mixed in a controlled manner to dissect the functional ramifications of the two fundamental components of tumor heterogeneity: (1) the number of clones comprising the tumor and (2) the genetic diversity between them.
To choose relevant clones for the mixing experiments, we performed a phylogenetic analysis of the heterogeneous UVB cell line (STAR Methods). This yielded a phylogenetic tree with six terminal branches (TBs), numbered TB-4 to TB-10 (Figure 6A). An almost identical clustering was obtained using an orthogonal analytical methodology (Figure S7). We then placed the 20 SCCs on the various terminal branches of the tree, based on their sequence similarity. To study the role of tumor diversity in determining tumor growth, we inoculated four different mixtures of 3 SCCs and monitored their growth, as shown in Figure 6B. To achieve genetically diverse mixes, each mix contained clones from 3 different TBs of the UVB-irradiated phylogenetic tree (denoted as across branches [3AB]) (Figures 6B and 6E). As seen in Figure 6B, although diverse, none of the 3 clone mixes formed a large tumor, even 35 days after the mixes were inoculated. However, increasing the number of branches included in the mix from 3 to 6 (one clone from each TB [6AB]; Figure 6E) results in significantly larger tumors (Figures 6B and 6C) (group factor p = 0.0238 when 6AB is compared with the 3AB mixes by two-way ANOVA versus group factor p = 0.1614 when the 3AB mixes are compared without 6AB). Doubling the number of clones included from each of the six TBs (two clones from each TB [12AB]) further increased the subclonal/clonal mutation ratio (Figure 6D) and produced even more aggressive tumors (Figure 6C).
Figure 6.

Tumors Derived from Mixtures of Clones Show Differential Growth In Vivo
(A) Phylogenetic tree representation of the UVB-irradiated B2905 cell line. The tree depicts the results from mutation clustering analysis, which was used to define the distinct subclones present within the UVB cell line. The phylogenetic relationship between subclones is shown, and then each of the 20 UVB derived SCCs is mapped onto the subclonal branch with the highest genetic similarity. Each of the 20 SCCs is depicted as a ball of 100 tumor cells, with the color coding reflecting the percentage frequency of each branch in each SCC sample. Shown in the top right box is a representation of the UVB parental sample, again shown as a ball of 100 tumor cells, color-coded to match the subclonal branches. See also Figure S7.
(B) Top: Venn diagrams for the four 3AB mixes inoculated, representing the number of protein-coding mutations and their intersections between the SCC in each mix. Bottom: in vivo tumor growth curves of the four different 3AB mixes. n = 5. Data are mean ± SEM.
(C) Left: in vivo tumor growth curves of the 6WB mix (within TB-4) and 6AB mix (one SCC from each TB). n = 4–5. Right: in vivo tumor growth curves of the 12WB mix (within TB-5) and 12AB mix (two SCC from each TB) and the UVB-irradiated B2905 cell line. n = 5–6. Data are mean ± SEM.
(D) Percent clonal versus sub-clonal mutations in the mixes described in (C).
(E) The SCC included in each mix described in (B) and (C).
(F) The association between the 6AB, 6AB, 12AB, and 12WB mix mutation number (unique) and the maximal tumor volume size (cubic centimeters) within 40 days. Each dot represents an individual mouse. The graph shows statistical significance between the 6 and 12 mixes but not between mutation number and tumor volume (Wilcoxon rank-sum test).
See also Table S7.
Figure S7.

Single-Cell Clone Clustering of Shared Mutations and Phylogenetic Reconstruction, Related to Figure 6
A) Hierarchical Clustering analysis of correlations between SCCs, based on the fraction of shared mutations. B) Phylogenetic reconstruction of SCCs’ mutations based on neighbor-joining tree estimation shows consistent results (phangorn R package).
We next evaluated the functional effects of the tumor’s genetic diversity while controlling for the overall mutational load. To this end, we compared the growth of tumors generated from a mixture of clones originating from a single TB (6 SCCs within TB-4 [6WB]) with that of those generated from the 6AB mix described above (comprising clones from TB-4, TB-6, TB-7, TB-8, TB-9, and TB-10) (Figures 6C and 6E). These two mixes have the same number of clones (six) and approximately the same mutational loads (Figure 6F) but vary in their genetic diversity, as assessed by their clonal versus subclonal mutation ratios (Figure 6D). Despite having similar mutational loads, we identified striking differences in growth between 6AB and 6WB (Figure 6C). Similarly, we next compared the tumor growth curves of a mixture of 12 SCCs derived from one branch (12WB, derived from branch 5, which contains TB-4 and TB-7) with the growth of the 12AB mix (two SCCs from TB-4, TB-6, TB-7, TB-8, TB-9, and TB-10) (Figures 6C and 6E). Again, there were clear differences in tumor growth between 12AB and 12WB. Moreover, even though 12AB had a higher mutational load than 6AB (Figure 6D), its growth surpassed that of 6AB. This indicates that an increased mutational load is not sufficient to drive tumor rejection. The 12AB tumors were still not as aggressive as the UVB irradiation-derived tumors (Figure 6C), emphasizing that the latter tumors harbor a higher degree of ITH. Taken together, these results testify that both the number of tumor subclones and their genetic diversity play important roles in mediating tumor growth and rejection.
Tumor Clonal Diversity Is Associated with Overall Survival in Checkpoint Inhibitor-Treated Melanoma Patients
To further evaluate the extent to which the number of clones and their genetic diversity affect the anti-tumor immune response in human data, we analyzed four previously published melanoma checkpoint inhibitor cohorts from Snyder et al., 2014, Riaz et al., 2017, Hugo et al., 2016, and Van Allen et al. (2015). Given the results of the mixing experiment that show that both the number of clones and their diversity are important determinants of tumor growth, we analyzed patient data using the Shannon diversity index (SDI), a formal diversity metric that quantitatively measures both the number of clones and the diversity of the mutations across clones in one index. As an example, a tumor with a low SDI would have nearly all of its mutations concentrated in just one clone (a large truncal neoantigen burden). In contrast, a high-SDI tumor would have a high number of clones with mutations spread evenly or diversely across each clone (a large branched neoantigen burden) (Figure 7A). The first cohort analyzed (Snyder et al., 2014) comprised data from 54 patients treated with anti-CTLA-4 therapy. We found its SDI index to significantly associate with overall survival (p = 0.0064, SDI tested as a continuous variable, z-test from the Cox proportional hazard model; Figures 7B and 7F). Patients with a higher diversity tumor (as measured by SDI) had poorer survival, with a hazard ratio (HR) of 8.8 (95% confidence interval, 1.8–41.6) per unit increase in SDI (Figure 7F). In the second cohort (Riaz et al., 2017), containing 57 patients treated with anti-PD1 therapy, we observed a comparable but non-significant pattern (p = 0.079, HR = 2.2 [0.9–5.5] per unit increase in SDI (Figures 7C and 7F). In the third cohort (Hugo et al., 2016), composed of 21 patients treated with anti-PD1 therapy, again a comparable but non-significant pattern was noted (p = 0.096, HR = 4.2 [0.8–23.8] per unit increase in SDI; Figures 7D and 7E). In the final cohort, which had data available from 70 patients treated with anti-CTLA4 therapy, no significant association between SDI and overall survival was detected (Figures 7E and 7F); it should be noted, however, that this result is consistent with previous ITH analyses in this cohort (McGranahan et al., 2016) and may be explained by the high level of pre-treatment in this cohort, making biomarker analyses more challenging. Given that all four datasets are of fairly limited size, we performed a meta-analysis across all four studies, which yielded an overall significance value of Pmeta = 0.0105, testifying that clone number and genetic diversity between clones are drivers of the immunotherapy response in human cohorts. Importantly, this result remained significant after adjusting for tumor purity in a multi-variable analysis for each cohort, with updated Pmeta = 0.012 for the SDI variable (across all four studies), and Pmeta = 0.15 for tumor purity, suggesting that the latter is not a confounding variable in our analysis (Table S4). Similarly, we corrected for TMB in the multi-variable analysis for each cohort, which yielded an updated Pmeta = 0.039 for the SDI variable and Pmeta = 0.33 for TMB (Table S5).
Figure 7.

Shannon Diversity Index (SDI) Analysis in Immune Checkpoint Inhibitor Datasets
(A) The cartoon illustrates two examples of the SDI, top low SDI (the tumor is predominantly composed of one major clone) and bottom high SDI (the tumor is composed of multiple clones with higher evenness between clones). SDI is measured using individual tumor subclones (from Pyclone clustering) as types and the somatic mutations as entities so that a tumor with a low SDI would have nearly all mutations concentrated in just one clone, and, in contrast, a tumor with a high SDI would have a higher number of clones, with mutations spread evenly or diversely across each clone.
(B) The SDI analysis applied to the Snyder et al. (2014) anti-CTLA4 dataset. Overall survival Kaplan-Meier plots are shown for with patients with a high SDI in red (SDI above median value in cohort) and a low SDI in green. The number of patients at risk by time point is shown in the table below.
(C–E) The same data format as in (B) for the Riaz et al. (2017) anti-PD-1 dataset (C), Hugo et al. (2016) anti-PD-1 dataset (D), and Van Allen et al. (2015) anti-CTLA4 dataset (D), respectively.
(F) Forest plot showing the HR for the SDI in each dataset, with the HR value corresponding to the survival risk per unit increase (i.e., each +1 increment) in the SDI. For significance analysis, SDI is tested as a continuous variable (to show a continuous association across the full range of data) using a Cox proportional hazard model (other clinical predictors, e.g., stage, are not included).
Discussion
Here we have established an experimental system that enables one to tease apart and study the effect of TMB and ITH on tumor aggressiveness, evaluating their influence on anti-tumor immunity in a controlled manner. Our findings in mice suggest that, in melanoma, an essential genetic determinant of anti-tumor immune response is tumor heterogeneity. These results corroborate previous reports that clonal neoantigens are associated with a more robust tumor infiltrate and clinical outcome, with and without checkpoint inhibitor blockade (McGranahan et al., 2016). By systematically generating tumors composed of different SCC mixes in a designed, controlled manner, we further dissected the two major components of a tumor’s ITH, finding that both the number of distinct clones composing the tumor and the degree of their genetic diversity influence tumor aggressiveness.
Our experimental mouse data are mirrored in TCGA melanoma patients, where the overall survival rate is significantly higher in tumors with a fewer number of clones, and the combination of number of clones and diversity (their SDI) is inversely associated with overall survival in immune checkpoint inhibitor-treated cohorts. These findings, which tightly match our experimental findings in mice, further support the detrimental influence of tumor heterogeneity on the anti-tumor immune response in humans, in keeping with previous studies (McGranahan et al., 2016).
Alongside the effects on tumor growth and responsiveness, the complex mechanisms behind the modulation of anti-tumor immunity by tumor heterogeneity need to be further addressed in future studies. We suggest that diminishing tumor heterogeneity exposes tumor cells by reducing their neoantigen landscape, bringing reactive neoantigens to the “frontline,” thus better exposing them to immune detection. This, in turn, leads to enhanced infiltration into the tumor core, elevated effector cytokines, and heightened degranulation. When neoantigen-specific CD8+ T cells are able to infiltrate and kill tumor cells, more tumor antigens are exposed to the tumor microenvironment, further promoting neoantigen uptake and presentation by tumor-associated DCs, enhancing the ability of the immune system to reject the tumor. In contrast, in more heterogeneous tumor cell populations, tumor cells could have a better chance of escaping immune surveillance because the reactive neoantigens undergo “dilution” within the tumor relative to other neoantigens. The total outcome is weaker anti-tumor immunity, manifested by reduced immune infiltration into the tumor core and dampening of TIL degranulation, cytotoxicity, effector cytokine secretion, and proliferation. In addition to CD8+ T cells, we found lower numbers of Tregs in tumors derived from SCCs (low ITH) than in UVB-derived, more heterogeneous tumors, indicating a strong immunosuppressive tumor microenvironment in high-ITH tumors that is resolved in single-cell-derived tumors. Overall, our results are consistent with the recent hypothesis by Gejman et al. (2018) that, because of increased antigenic variability, the relative expression of each neoantigen is lowered in tumors with increased ITH, diminishing the TILs’ ability to home to their target cells and mount a sufficient cytotoxic response.
In addition to the differential infiltration of CD8+ T cells and differential Treg accumulation observed in the tumors, other immune mechanisms also likely play a part in the reduced response to heterogeneous versus homogeneous tumors. These may involve non-Treg CD4+ cells, which are important for priming of CD8+ T cells (Borst et al., 2018) and recognition of MHC class II-borne tumor antigens (Zanetti, 2015). Different CD4+ T cells effector subsets can have direct or indirect anti-tumor immunity. These subsets include CD4+ cytotoxic T cells that can directly eliminate MHC class II+ tumors (Haabeth et al., 2014) and CD4+ Th1 and Th17 cells that can mediate elimination of tumor cells in an antigen-specific manner (Muranski et al., 2008, Quezada et al., 2010). Indeed, strong anti-tumor responses of CD4+ cells against tumor MHC class II neoantigens in cancer patients have been reported (Linnemann et al., 2015, Tran et al., 2014, Veatch et al., 2018). This suggests an additional level of complexity within the tumor-immune interface and a significant clinical potential for future therapies.
Additional immune subsets other than T cells that may play a role in this setting encompass M1 and M2 macrophage polarization (Brown et al., 2017), NK cells (Guillerey et al., 2016) DCs (de Mingo Pulido et al., 2018), or neutrophils (Coffelt et al., 2015). To fully elucidate the immune profiles of ITH-high versus -low tumors, cutting-edge, high-dimensional techniques such as single-cell RNA-seq (Li et al., 2019, Sade-Feldman et al., 2018) and CyTOF (Gubin et al., 2018) and state-of-the-art analysis algorithms such as CIBERSORT (Newman et al., 2015) could be utilized in follow-up studies.
Although we show that high ITH impairs the immune system response, tumors with impaired immune responses can likely still acquire high levels of ITH. Thus, impaired immune response and ITH levels are tightly associated. However, whether ITH is a cause or a consequence of tumor progression or both is not fully elucidated. Interestingly, previous studies have shown that functional cooperation between genetically distinct subclones can be essential for overcoming environmental constraints and, thus, affect tumor maintenance and growth (Cleary et al., 2014, Marusyk et al., 2014) and metastatic behavior (Janiszewska et al., 2019). Of note, it has been shown recently that the immune system as well as checkpoint immunotherapy can select for low-ITH tumors (Milo et al., 2018). Understanding the complex interactions between tumor heterogeneity and the immune response and how they change during tumor evolution still remains a challenge.
Despite the strengths, there are several shortcomings of our study. Specifically, the single-cell cloning process inherently involves in vitro selection of clones. This may miss clones with a low survival capability in vitro, which does not necessarily reflect their functional importance in vivo. Likewise, we acknowledge the limitations of accurately assessing ITH from a single biopsy sample in the TCGA and immune checkpoint blockade (ICB) datasets because of the narrow sampling frame of taking just one sample from one spatial location. The sequencing depth, tumor purity, choice of processing pipeline, and nature of the single biopsy (primary versus metastatic) may also affect ITH assessment, making it challenging to derive a single prognostic measure of ITH. We believe that additional studies that quantify ITH in large-scale cohorts with multi-region biopsies are likely to shed further light on the prognostic role of tumor ITH, providing a higher-resolution view of the fundamental trends outlined in this study.
In summary, our findings show the value of evaluating ITH as an important determinant of melanoma patients’ response to checkpoint therapy. They also support the notion that clonal neoantigens are more likely to lead to better cancer vaccines (McGranahan et al., 2016, Sahin and Türeci, 2018). On the flip side, our results cast doubt on the notion that excessive mutagenesis, directed to enhance TMB, can enhance the efficacy of immunotherapy. Indeed, it is conceivable that excessive neoantigen heterogeneity may actively impair a productive anti-tumor immune response. In conclusion, our functional data support recent findings that the clonality of a tumor can be used as a biomarker for predicting better outcomes in melanoma and may improve patient matching to current immunotherapy in a manner complementary to mutational load. We suggest that ITH is a strong determinant of immune response and immunotherapy success in melanoma, highlighting the potential importance of assessing it in the clinic.
STAR★Methods
Key Resources Table
| REAGENT or RESOURCE | SOURCE | IDENTIFIER |
|---|---|---|
| Antibodies | ||
| anti-p53 (1C12) Mouse mAb | Cell signaling | Cat#2524; RRID:AB_331743 |
| Mouse anti-GAPDH | Millipore | Clone 6C5 Cat#MAB374; RRID:AB_2107445 |
| Peroxidase Affinipure Goat anti-Mouse IgG | Jackson ImmunoResearch Labs | Cat#115-035-003; RRID:AB_10015289 |
| anti-mouse PD-1 (CD279) | BioXCell | 29F.1.A12 Cat#: BE0273; RRID: AB_2687796 |
| Rat IgG2a isotype control | BioXCell | 2A3, Cat#: BE0089; RRID: AB_1107769 |
| Alexa Fluor700 anti-mouse CD45 | Biolegend | Clone 30-F11 Cat#103128; RRID:AB_493715 |
| PerCP/Cy5.5 anti-mouse CD8a | Biolegend | clone 53-6.7 Cat#100734; RRID:AB_2075238 |
| APC/Cy7 anti-mouse CD4 | Biolegend | clone GK1.5 Cat#100413; RRID:AB_312698 |
| FITC anti- mouse CD107a (LAMP-1) | Biolegend | clone 1D4B Cat#121605; RRID:AB_572006 |
| Pacific Blue anti-Granzyme B | Biolegend | clone GB11 Cat#515407; RRID:AB_2562195 |
| PE/Cy7 anti- mouse IFN-γ | Biolegend | clone XMG12 Cat #505826; RRID:AB_2295770 |
| Pacific Blue anti-mouse CD8a | Biolegend | Clone 53-6.7 Cat#100728; RRID:AB_493426 |
| PerCP anti-mouse CD4 | Biolegend | clone GK1.5 Cat#100431; RRID:AB_893329 |
| FITC anti-mouse CD45 | Biolegend | Clone 30-F11 Cat#103108; RRID:AB_312973 |
| PE/Cy7 anti-mouseCD90.2 (Thy-1.2) | Biolegend | Clone 30-H12 Cat#105325; RRID:AB_2303142 |
| PE anti-mouseTCRβ | Biolegend | clone H57-597 Cat#109207; RRID:AB_313430 |
| a-CD8a rat monoclonal antibody | eBioscience | Clone 4SM15 Cat#14-0808-82; RRID:AB_2572861 |
| Biotin Donkey anti Rat IgG (H+L) | Jackson ImmunoResearch | Cat#712-065-153; RRID:AB_2315779 |
| anti-CD3 rabbit monoclonal antibody [SP7] | Abcam | Cat#ab16669; RRID:AB_443425 |
| anti-FoxP3 rat monoclonal antibody (FJK-16 s) | Thermo Fisher Scientific | Cat#14-5773-82; RRID:AB_467576 |
| Cy2 Donkey anti Rabbit IgG (H+L) | Jackson ImmunoResearch | Cat#711-225-152; RRID:AB_2340612 |
| Cy3 Donkey anti Rat IgG (H+L) | Jackson ImmunoResearch | Cat#712-165-153; RRID:AB_2340667 |
| anti-CPD | Cosmo Bio | Cat#CAC-NM-DND-001; RRID:AB_1962813 |
| Cy3 Donkey anti Mouse IgG (H+L) | Jackson ImmunoResearch | Cat#715-165-151; RRID:AB_2315777 |
| anti-H2-Kb | ATCC | Cat#20-8-4 s (HB-11) |
| anti-H2-Db | In house; generated from hybridoma purchased from ATCC | Cat#28-14-8 s (HB-27) |
| APC anti-mouse H-2Kb | In house; generated from hybridoma purchased from ATCC | clone AF6-88.5 Cat#116517; RRID:AB_10568693 |
| PE anti-mouse H-2Db | BioLegend | clone KH95 Cat#111507; RRID:AB_313512 |
| APC anti-CD11c | Thermo Fisher Scientific | Clone N418 Cat# 17-0114-81; RRID:AB_469345 |
| Pacific Blue(TM) anti-mouse CD80 antibody | BioLegend | Clone 16-10A1 Cat# 104723; RRID:AB_2076001 |
| PE Anti-Mouse CD86 (B7-2) | Thermo Fisher Scientific | Clone PO3.1 Cat# 12-0861-81; RRID:AB_465764 |
| PE/Cy7 anti-mouse I-Ab (Anti-MHCII) | BioLegend | Clone AF6-120.1 Cat# 116419; RRID:AB_10575904 |
| PerCP-Cyanine5.5 CD197 (CCR7) Monoclonal Antibody (4B12) | Thermo Fisher Scientific | Clone 4B12 Cat# 45-1971-80; RRID:AB_925738 |
| APC Anti-Mouse CD45.1 | Thermo Fisher Scientific | Clone A20 Cat# 17-0453-82; RRID:AB_469398 |
| Chemicals, Peptides, and Recombinant Proteins | ||
| RPMI | Biological Industries | Cat#01-100-1A |
| FBS | GIBCO | Cat#12657-029 |
| L-glutamine | Biological Industries | Cat#03-020-1B |
| Penicillin/Streptomycin antibiotics | Invitrogen | Cat#15140163 |
| HEPES | Sigma | Cat#H0887 |
| DMEM | GIBCO | Cat#41965-039 |
| MCDB 153 | Sigma | Cat# M7403 |
| L-15 Medium (Leibovitz) | Sigma | Cat#L1518 |
| bovine insulin | Sigma | Cat#I0516 |
| SDS Solution 20% | Bio-Rad | Cat# 161-0418 |
| SYBR Green I | Invitrogen | Cat#S7567 |
| Water, ultra-pure | Biological Industries | Cat#01-866-1A |
| β-mercaptoethanol | EMD Millipore Corp. | Cat#444203 |
| Dulbecco’s Phosphate Buffered Saline (PBS) | Biological Industries | Cat#02-023-1A |
| sodium pyruvate | Biological Industries | Cat#03-042-1B |
| MEM-Eagle Non-essential amino acids solution | Biological Industries | Cat#01-340-1B |
| Recombinant Mouse Granulocyte Macrophage Colony Stimulating Factor GM-CSF Mouse | PROSPEC | Cat#cyt-222 |
| Lipopolysaccharides (LPS) from E-coli | Sigma | Cat#L26630 |
| Opti-MEM Reduced Serum Medium | GIBCO | Cat#31985-047 |
| CFSE | eBioscience | Cat#65-0850-84 |
| Collagenase D | Roche | Cat# 11088866001 |
| DNase I | Roche | Cat#10104159001 |
| BSA | Sigma | Cat# A9418 |
| HBSS (w/o Ca2+ or Mg++) | Bio-Lab | Cat#004717237500 |
| Collagenase IV | gibco | Cat#17104-019 |
| EGTA | Merck | Cat# 324626.25 |
| polyvinyl alcohol (PVA) | Sigma | Cat# P8136 |
| trypsin | Sigma | Cat# T4549 |
| Optiprep | Sigma | Cat#D1556 |
| Versen | Lonza | Cat#17-711E |
| Paraformaldehyde (PFA) | Electron Microscopy Sciences | Cat#15710 |
| hematoxylin | Sigma | Cat#GHS316 |
| Hoechst | Invitrogen | Cat#LSH3570 |
| Protease Inhibitors Cocktail | Sigma | Cat#P8340 |
| sodium deoxycholate | Sigma | Cat#D6750 |
| iodoacetamide | Sigma | Cat#I6125 |
| EDTA | Promega | Cat#V4231 |
| PMSF | Sigma | Cat#78830 |
| octyl-β-D glucopyranoside | Sigma | Cat#O8001 |
| Protein-A Resin | A2S | Cat#L00210 |
| FAIFNTEQM synthetic peptide | GenScript Biotech Corp. | N/A |
| VINENYDYL synthetic peptide | GenScript Biotech Corp. | N/A |
| SAYEKLYSL synthetic peptide | GenScript Biotech Corp. | N/A |
| ASLTHVDSL synthetic peptide | GenScript Biotech Corp. | N/A |
| LANETISTL synthetic peptide | GenScript Biotech Corp. | N/A |
| VAHIFVIGV synthetic peptide | GenScript Biotech Corp. | N/A |
| AGLLNSPHFI synthetic peptide | GenScript Biotech Corp. | N/A |
| HQNVNVENI synthetic peptide | GenScript Biotech Corp. | N/A |
| QAFDFAYV synthetic peptide | GenScript Biotech Corp. | N/A |
| FAALLRYSI synthetic peptide | GenScript Biotech Corp. | N/A |
| SMYLVSKL synthetic peptide | GenScript Biotech Corp. | N/A |
| Critical Commercial Assays | ||
| BD Cytofix/Cytoperm Kit | Thermo Fisher Scientific | Cat#BD 554714 |
| SENSE Total RNA-Seq Library Prep Kit for Illumina), | Lexogen | Cat#LX-009.96 1 |
| DNeasy Blood & Tissue Kit | QIAGEN | Cat# 69504 |
| SureSelectXT Mouse All Exon System | Agilent Technologies | Cat# 5190-4641 |
| Dynabeads mRNA DIRECT Kit | Invitrogen | Cat#61012 |
| SuperSignal WestPicoPLUS Chemiluminescent Suibstrat | Thermo Fisher Scientific | Cat#34580 |
| 3,3′-Diaminobenzidine tetrahydrochloride | Sigma | Cat# D5905 |
| Deposited Data | ||
| Mouse WES sequencing data | This paper | https://www.ebi.ac.uk/ena; accession number: PRJEB25961, secondary accession: ERP107928. |
| Mouse CD8+ T cell RNaseq data | This paper | https://github.com/bioinf-dev/Wolf_et_al_Cell_2019/blob/master/Other/RNAseq_mouse_CD8Tcell_TPM.txt |
| Processed data and code used for Figures 1, 2, 3, and 7 | This paper (Figures 1, 2, and 3). For Figure 7Snyder et al., 2014, Riaz et al., 2017, Hugo et al., 2016; and Van Allen et al., 2015 | https://github.com/bioinf-dev/Wolf_et_al_Cell_2019 |
| MS spectra of the identified neoantigenes and synthetic peptides | This paper | https://github.com/bioinf-dev/Wolf_et_al_Cell_2019/blob/master/Other/Spectra.pdf |
| Experimental Models: Cell Lines | ||
| Murine melanoma B2905 | Laboratory of Prof. Merlino | N/A |
| B16F10.9 | Laboratory of Prof. Eisenbach | N/A |
| RMA-s | Laboratory of Prof. Eisenbach | RRID:CVCL_2180 |
| Experimental Models: Organisms/Strains | ||
| C57BL/6JOlaHst | Envigo | N/A |
| NOD.Cg-PrkdcscidIl2rgtm1Wjl/SzJ (NSG) | The Jackson Laboratory | Cat#JAX:005557 RRID:IMSR_JAX:005557 |
| B6.129S4-Cd80tm1ShrCd86tm2Shr/J (CD80/86 −/− Double KO) | Laboratory of Prof. Jung | Cat# JAX:003610 RRID:IMSR_JAX:003610 |
| Software and Algorithms | ||
| FlowJo software | Tree Star | N/A |
| Prism | GraphPad | N/A |
| ImageLab 5.1 software | BioRad | N/A |
| FIJI | ImageJ | Schindelin et al., 2012 |
| CHAT v1.0 | Snyder et al., 2014 | https://cran.r-project.org/src/contrib/Archive/CHAT/ |
| deconstructSigs v1.8.0 | Rosenthal et al., 2016 | https://www.rdocumentation.org/packages/deconstructSigs/versions/1.8.0 |
| NetMHC v4.0 | Nielsen et al., 2003 | http://www.cbs.dtu.dk/services/NetMHC/ |
| SciClone v1.1.0 | Miller et al., 2014 | https://www.rdocumentation.org/packages/sciClone/versions/1.1.0/topics/sciClone |
| Maxqaunt v1.5.3.8 | Cox and Mann, 2008 | http://coxdocs.org/doku.php?id=maxquant:start |
| samtools v1.8 | Li et al., 2009 | http://www.htslib.org/ |
| Trimomatic v0.36 | Bolger et al., 2014 | http://www.usadellab.org/cms/index.php?page=trimmomatic |
| Salmon v0.9.2 | Patro et al., 2017 | https://salmon.readthedocs.io/en/latest/building.html |
| GATK v3.6 | McKenna et al., 2010 | https://software.broadinstitute.org/gatk/ |
| CNVkit | Talevich et al., 2016 | https://cnvkit.readthedocs.io/en/stable/ |
| CloneEvol | Talevich et al., 2016 | https://github.com/hdng/clonevol |
| BWA | Li and Durbin, 2010 | http://bio-bwa.sourceforge.net/ |
| vcf2maf | N/A | https://github.com/mskcc/vcf2maf |
| bcftools v1.3 | Li et al., 2009 | https://github.com/samtools/bcftools |
| Rstudio v1.1.423 | N/A | https://www.rstudio.com/products/rstudio/ |
| R ‘survival’ package v2.43-3. | Therneau and Grambsch, 2000 | https://cran.r-project.org/web/packages/survival/index.html |
| R ‘entropy’ package v1.2.1 | Hausser and Strimmer, 2009 | https://cran.r-project.org/web/packages/entropy/index.html |
| R ‘ggsurvplot’ function | Kassambara et al., 2017 | https://cran.r-project.org/web/packages/survminer/index.html |
Lead Contact and Materials Availability
Further information and requests for resources and reagents should be directed to and will be fulfilled by the Lead Contact, Yardena Samuels, (Yardena.Samuels@weizmann.ac.il)
There are restrictions to the availability of the B2905 cell as they require an MTA.
Experimental Model and Subject Details
Mice
Animals were maintained in a specific pathogen-free (SPF), temperature-controlled (22°C ± 1°C) mouse facility on a reverse 12-hour light, 12-hour dark cycle at the Weizmann Institute of Science. Food and water were given ad libitum. Mice were handled under protocols approved by the Weizmann Institute Animal Care Committee (IACUC 11440219-2) in accordance with international guidelines.
To generate syngeneic mouse cancer models, 6 weeks old female C57BL/6 (purchased from Envigo), NSG (The Jackson Laboratory) and CD80/86 −/− (kindly provided by Prof Steffen Jung, The Weizmann Institute) were used.
Cell lines
Murine melanoma B2905, derived from a UV-irradiated HGF-transgenic mouse on a C57BL/6 background (Patel et al., 2017) and B16F10.9 (Porgador et al., 1991) were used. The B2905 cell line was grown in RPMI (Biological Industries) containing 10% heat inactivated FBS (GIBCO), 1% L-glutamine (Biological Industries), 1% Penicillin/Streptomycin antibiotics (Invitrogen) and 12.5mM HEPES (Sigma) buffer. B16F10.9 cells were grown in DMEM medium (GIBCO) containing 10% heat inactivated FBS, 1% L-glutamine, 1% Penicillin/Streptomycin antibiotics. Both cell lines originated from male mice. Primary cell lines that were generated from solid tumors, derived from UVB-B2905 as described below, were grown in Tu2% media [80% MCDB 153 (Sigma), 20% Leibovitz’s L-15 (Sigma), 5 μg/mL bovine insulin (Sigma), 2% FBS (GIBCO), and 1.68 mM CaCl2]. The murine lymphoma mutant cell line RMA-s (Ljunggren et al., 1990) were cultured in RPMI medium supplemented with 10% heat-inactivated FBS, 40 μg/ml gentamycin sulfate and 5x10⁻⁵M β-mercaptoethanol. All cells were cultured using standard procedures in a 37°C humidified incubator with 5% CO2. Cells were tested routinely for Mycoplasma using Mycoplasma EZ-PCR test kit (cat#20-700-20, Biological Industries).
Method Details
UVB exposure
Cells were seeded in 10cm plates. 24 hours later, at confluence of 80%, the cells were exposed to UVB using bench XX-15M 302nm UV lamp. Irradiation was measured using the UVX radiometer (Ultra Violet Products, Cambridge, UK). All cell lines indicated in the study (B2905-UVB, B2905-UVB.2, B16F10.9-UVB) were UVB irradiated with 600J/m2, with the exception of the B2905-UVB.3 cell line, that was sequentially irradiated with 250 J/m2 for 3 times before isolating and culturing single cell clones from the surviving population.
In vitro proliferation
For in vitro proliferation assays, cells were seeded in six replicates (500 cells per well) in 96 well plates and incubated for five to eight days. Samples were analyzed every 24-48 hours by lysing the cells in 50 μL 0.2% SDS/well and incubating at 37°C for 30 minutes. Following incubation, 150 μl/well of SYBR staining solution [1:750 SYBR Green I (Invitrogen), diluted in water] were added and the plates were incubated at room temterature in the dark for ten minutes. Fluorescence intensities were measured for each well using FLUOstar OPTIMA BMG LABTECH reader.
Generation of single-cell clones
For SCCs generation, cells were plated in 96 well plates, in a concentration of 1 cell/well. 10 days later, cells were monitored and wells that showed more than one focal clone were excluded. Single clones were passaged to establish cell lines. The number of passages was controlled.
Western blotting
24 hours post irradiation, cells were washed once with PBS and scraped and harvested in sample buffer (2.5% w/v SDS, 25% v/v Glycerol, 125mM Tris pH-6.8, 0.01% w/v bromophenol blue, 4% β-mercaptoethanol, in water). Samples were sonicated for ten seconds (30% amplitude, Branson Digital Sonifier) and heated at 95°C for 5 minutes. Proteins were resolved on 10% SDS-polyacrilamide gels and transferred to 0.45μm nitrocellulose membranes (Bio-Rad). Western blots were probed with anti-mouse p53 (Cell signaling) and GAPDH (Millipore). Antibodies were detected using peroxidase-conjugated AffiniPure goat anti-mouse IgG (Jackson ImmunoResearch Labs) and enhanced chemiluminescence western blotting detection reagents (Thermo Fisher scientific). Gels were Imaged by CemiDoc XRS+ (Bio-Rad) and analyzed by ImageLab 5.1 software (BioRad).
In vivo mouse experiments
Tumor inoculation
For experiments with the B2905 cell line, 5∗105 cells were injected in 100ul PBS, intradermal, into the right lower flank after shaving. In experiments in which the genomic clonal structure was monitored over time, the same cell line and the same amount of cells (1∗105) were inoculated at the same time, to multiple WT C57B/6 mice. At indicated times post inoculation, tumors were excised (2 mice each time point) and their gDNA was subjected to WES. In experiments in which several clones were inoculated as a mixture, and more than one possible clone could be chosen, we used clones that have similar in vitro growth to avoid a large number of passages prior to inoculation. Each clone was equally represented in the mixture, and the total number of injected cells was 5∗105. For experiments with the B16F10.9 cell line, 1∗105 cells were injected. Tumors were measured using calipers. Tumor volume was assessed by measuring tumor diameter and calculation using the equation π/6∗(tumor diameter)3. Mice with tumor volume of ≥ 1 cm3 were euthanized.
Anti PD-1 treatment
anti-PD-1 (29F.1.A12, BioXCell, 250ug) and IgG2a control (2A3, BioXCell, 250ug) antibodies were administrated via retro-orbital injections at days 6,9, and 12 from tumor cells inoculation.
In Vivo killing assay
DCs were generated in vitro according to Lutz et al. (1999): Femurs and tibiae of 6 weeks old female C57BL/6 mice were removed and purified from the surrounding muscle tissue. Both bone ends were cut with scissors and the marrow was flushed with PBS using a 27G1/2 Syringe. Clusters within the marrow suspension were disintegrated by vigorous pipetting. Cells were washed with PBS, seeded at 4 × 10⁶ per 100mm bacteriological Petri dishes (Falcon, #351029), in 10 mL DC medium [RPMI, 10% FBS, 1mM sodium pyruvate, x1 non-essential amino acid, 2mM glutamine, 1% Penicillin/Streptomycin antibiotics and 5∗10−5M β-mercaptoethanol] containing 200 U/ml rmGM-CSF (ProSpec), and incubated at 37°C, 5% CO2. Three day later (day 3), additional 10 mL of DC medium containing 200 U/ml rmGM-CSF were added to the plates. At day 6, half of the culture supernatant was collected, centrifuged, and the cell pellet was resuspended in 10 mL fresh DC medium containing 200 U/ml rmGM-CSF, and plated back into the original plate. At day 8, non-adherent cells were harvested, counted, adjusted to 15∗106 cells per 10 mL DC medium supplemented with 100U/ml rmGM-CSF and seeded in 10cm plates. At day 9, lipopolysacchride (LPS, Sigma) was added at 1 μg/ml to maturate the DCs. At day 10, the cells were collected and washed twice with PBS (1000rpm, 10 min, 18°C). A small fraction of the cells were subjected to FACS analysis, to validate DCs markers: CD11c+CD80+CD86+MHCII+CCR7+. The rest of the DC enriched cell population was adjusted to 6∗106 /ml in OptiMEM (GIBCO), and loaded with 50μM synthetic peptide for 3 hours in 37°C. After incubation, cells were washed with PBS and injected i.p. to C57BL/6 WT mice (106 cell/mouse) in 3 boosts, 7 days apart. 10 days following the last vaccination, splenocytes were isolated from WT CD45.1+ mice that were pulsed with 25μM WT peptide, or left untreated, or loaded with 25uM mutated peptide for 1.5h at 37°C. Following incubation, cells were labeled with 0.03μM or 0.3μM or 3μM CFSE (eBioscience), respectively). A 1:1:1 mixture of the cells (total of 20X106) was intravenously transferred to immunized mice and to naive, age matched, control mice. 24 hours later, spleens were excised, stained with anti CD45.1mAb (Thermo Fisher Scientific) and the differential clearance of the stained cell populations was evaluated using flow cytometry. Stained cells were acquired on LSRII flow cytometer at the Weizmann FACS facility and analyzed using FlowJo software (Tree Star). Specific killing was defined as:
Flow cytometry of TILs
Tumors were surgically removed from animals and were place in cold PBS. Following, tumors were mechanically shredded using scalpel and incubated in RPMI medium containing 2mg/ml Collagenase D (Roche), and 2 mg/ml DNaseI (Roche) in 37°C for 20min. The resulting cell suspension was washed with PBS, passed through a 70-μm filter (Falcon) and cells were incubated in FACS buffer (PBS supplemented with 1%BSA (Sigma), 2mM EDTA and 0.05% sodium azide) in the presence of staining antibody. For intracellular staining, the Cytofix/Cytoperm Kit (Fisher Scientific) was used according to the manufacturer’s instruction. Cells were acquired on FACSCanto, LSRII, and LSRFortessa systems (BD) and analyzed with FlowJo software (Tree Star). Antibodies used for flow cytometry were: anti-mouse CD8, CD4, TCRβ, CD107a, Granzyme B, and IFN-γ (all Biolegend).
RNA-sequencing
CD45+, Thy-1.2+, TCRβ+, CD8+ cells were sorted from tumors at day 16 post inoculation using FACSAria II sorter (BD). mRNA was purified from the sorted cells using Dynabeads mRNA DIRECT Purification Kit (Invitrogen), according to the manufactures protocol. RNA-Libraries were constructed using SENSE Total RNA-Seq Library Prep Kit for Illunima (LEXOGEN), loaded onto Illumina NextSeq 500 sequencer using the Nextseq High Output V2 150 sequencing kit (Illumina, 150 bp, single reads).
Secondary cell line generation, derived from UVB-B2905 solid tumors
B2905 cells (5∗105) were intradermally injected to C57B/6 WT mice. At day 14 post inoculation, fresh tumors were removed and placed on ice in 1X HBSS (w/o Ca2+ or Mg++, Bio-Lab, cat #004717237500). Tissues were dissociated according to M. Herlyn’s laboratory protocol (Krepler et al., 2017): First, tissues were minced using a cross blade and the slurry was weighted and centrifuged (220 g, 4 min, 4°C). The chopped tissues were resuspended in 10mL of warmed digest media [Collagenase IV (2,000 u/mL, gibco, cat#17104-019), 1M CaCl2, DNase I (10,000 u/mL, Roche, cat#10104159001) in HBSS] per 1g of tumor tissue, and placed in 37°C water bath. 20 min later, samples were washed with HBSS up to 50mL and centrifuged at 220 g, 4 min, 4°C. 1X TEG buffer [To make 1X TEG buffer, first, 10X TEG buffer was prepared as follows: 40mg of EGTA (ethylene glycol bis(2-aminoethyl ether)-N,N,N’N’-tetraacetic acid, Merck) and 10mg of PVA (polyvinyl alcohol, Sigma) were dissolved in 90 mL of warmed 1X PBS. 10 mL of 2.5% trypsin (Sigma) were added and pH was adjusted to pH = 7.4. This 10XfTEG buffer was diluted 1:10 in HBSS] was added at 5mL per 1g tissue, and placed at 37°C for 2 min, followed by the addition of an equal volume of cold staining media [568 mg BSA (Sigma), 57 mL H2O (Biological Industries), 5.7 mL 1M HEPES pH 7.4 (Sigma), 5.7 mL 100x PenStrep (Invitrogen) in 500 mL Leibovitz’s L15 media (Invitrogen)] to quench the trypsin and centrifugation at 220 g, 4 min, 4°C. Samples were resuspended in 25mL staining media, filtered through 40 μm cell strainer (Falcon), overlaid onto 10mL chilled Opti 1.1 solusion [to prepare Opti1.1 solution: First, 60% Optiprep (Sigma) was diluted in H2O to 40%, and then further diluted with HBSS at a ratio of 2:3] and centrifuged at 800 g for 20 min, 4°C, using low acceleration and low brake. Following separation, cells were transferred to new 50mL Falcon tube, centrifuged at 220 g, 4 min, 4°C. Cells were resuspended in Tu2% media and seeded in a 24 well plate. Cells were grown in Tu2% media for 5 passages, until all fibroblasts were removed. During passaging, cells were detached using Versen (Lonza).
Histology
For immunohistochemistry and immunofluorescence, tumors were excised at days 10-15 post inoculation as indicated, fixed in 2.5% (w/v) paraformaldehyde for 24 hours and restored in 1% paraformaldehyde until embedded in paraffin for histological analysis. Immunohistochemistry for CD8a was performed on deparaffinized and rehydrated 4-μm thick paraffin-embedded sections. Endogenous horseradish peroxidase activity was blocked by H2O2 for 30 min. Antigen retrieval was performed with Tris-EDTA in a microwave oven for 25 min. For nonspecific binding, sections were blocked with 20% normal horse serum and 0.1% triton. Following blocking treatment, slides were incubated overnight at 4°C with primary antibody (a-CD8a rat monoclonal antibody, diluted 1:50, Clone 4SM15, eBioscience). Later, sections were incubated with biotinylated anti-rat secondary antibody (Biotin anti Rat IgG (H+L), CN- 712-065-153, Jackson ImmunoResearch) and exposed to a solution of 3- 3′-diamino-benzidine tablets (Sigma), washed, and counterstained by hematoxylin (Sigma) and dehydrated. Stained sections were examined and photographed on a bright-field microscope (Eclipse Ni-U; Nikon) equipped with Plan Fluor objectives (10x; 20x; 40x; 60x) connected to a CCD camera (DS-Fi2, Nikon). For Histology quantification, stained slides were counted manually by counting the number of positive CD8a cells per fourhigh-power fields, randomly chosen, from the margin of the tumor versus the tumor core. Immunofluorescence stainings for CD3+ and FoxP3+ cells were performed on 2-μm and 4-μm paraffin sections. Sections were incubated in acetone for 7 min at −20°C and antigens were retrieved in Tris-EDTA in a microwave oven for 10 min. Additionally, for nonspecific binding sections were blocked with 20% normal horse serum and 0.1% triton for 90 min in a humidity chamber. Following blocking, treatment slides were incubated overnight at 4°C with primary antibodies [(anti-CD3+ rabbit monoclonal antibody [SP7] diluted 1:25, ab16669, ABCAM) and anti-FoxP3 rat monoclonal antibody (FJK-16 s) diluted 1:25, CN-14-5773-82, eBioscience]. Slides were then incubated with secondary antibodies (Cy2 conjugated anti-rabbit, CN- 711-225-152; and Cy3 conjugated anti-rat, CN- 712-165-153, respectively; both antibodies from Jackson ImmunoResearch). Sections were counterstained by Hoechst (Invitrogen). Stained sections were examined and photographed with a fluorescence microscope (Eclipse Ni-U; Nikon) equipped with Plan Fluor objectives (10x; 20x; 40x; 60x) connected to a color camera (DS-Ri1, Nikon) microscope. Images were analyzed using FIJI ImageJ software.
CPD detection
Non-irradiated and UVB irradiated (600J/m2) B2905 cells were subjected to immunoflorescence stain; immediately following irradiation, cells were fixed with 2.5% PFA in order to prevent any CPD repair, washed, and treated with 2N HCL for DNA denaturation, followed by re-equilibration with 0.1M Borate buffer, PH 8.5. CPD were detected via anti-CPD antibody (NMDND001, Cosmo Bio, 1:400), followed by anti-mouse Cy3 stain (Cy3 conjugated anti-mouse,715-165-151, Jackson ImmunoResearch). Stained cells were examined and photographed with a fluorescence microscope (Eclipse Ni-U; Nikon) equipped with Plan Fluor objectives (10x; 20x; 40x; 60x) connected to a color camera (DS-Ri1, Nikon) microscope.
DNA-Sequencing and analysis
Genomic DNA was extracted from cell lines using the QIAGENe DNeasy Blood & Tissue Kit. Exome capture was performed using the SureSelectXT Mouse All Exon System (Agilent Technologies, Wilmington, DE USA, catalog# 5190-4641). Mapping and variant analysis reads were mapped to the mouse genome (GRCm38, mm10) using BWA (Li and Durbin, 2010) with default parameters. On average, we generated a mean depth of 100 × to achieve exome builds with at least 90% of the exomes covered by high quality genotype calls. The Picard MarkDuplicates module was used to remove the duplicates from the data. The Genome Analysis Tool Kit (GATK-Lite) toolkit (v2.3) (McKenna et al., 2010) module IndelRealigner and BaseRecalibrator were used to preprocess the alignments. The Picard MarkDuplicates module was used to remove the duplicates from the data. The Genome Analysis Tool Kit (GATK-Lite) toolkit (v2.3) module IndelRealigner and BaseRecalibrator were used to preprocess the alignments and variant analysis. During base quality recalibration, dbSNP variants were used as known sites, according to GATK Best Practices (DePristo et al., 2011). Target-capture efficiency metrics were determined using Target region coverage calculator Version 0.0.1. The realigned and recalibrated BAM file was used as an input to UnifiedGenotyper module from the GATK-lite toolkit (v2.3). During base quality recalibration. Sorting and indexing were performed using samtools v1.8 (Li et al., 2009). Variant calls were restricted to the target regions (Agilent SureSelectXT Mouse All Exon). Polymorphisms were removed by examination of the sequencein genomic DNA from matched normal tissue (kidney). For further confidence, mouse SNP filtration was applied to the VCF files based on normal mouse spleen SNPs. Finally, somatic-mutations associated with less than 10 reads were filtered-out.
Cancer Signature analysis
Called exonic mutations and the tri-nucleotide 96 mutations context were counted to assess the genomic effect of UVB treatment in the mutational landscape of the cell lines. Deconstructsig R package was applied to obtain the signatures (∗ref in https://www.ncbi.nlm.nih.gov/pmc/articles/PMC4762164/)
Genetic heterogeneity analysis of melanoma cell lines
VCF files were converted to MAF files (v2.4) using vcf2maf. To evaluate the genetic heterogeneity of the cell lines, we look at the variant allele frequency (VAF) of the exonic mutations (Missense, silent, nonstop, and nonsense mutations, and in-frame insertion, frameshift insertion, on-frame deletion, and frameshift deletion) and defined mutations with a VAF > 0.25 as more likely to be clonal mutations and vice versa, as previously defined (Williams et al., 2016). Two-sided Mann-Whitney test with continuity correction, Fisher’s exact test, and two-sided Smirnov-Kolmogorov test were used to compared the VAF distributions between parental control and parental + UVB cell lines. All tests produced the same result.
Production and purification of membrane MHC molecules
B2905 cell pellets were collected from 2x10⁸ cells, lysed with cold lysis buffer [containing 0.25% sodium deoxycholate (Sigma), 0.2mM iodoacetamide (Sigma), 1mM EDTA (Promega), 1:300 Protease Inhibitors Cocktail (Sigma), 1mM PMSF (Sigma) and 1% octyl-β-D glucopyranoside (Sigma) in PBS] for 1 hour with gentle rotation, at 4°C. Lysates were centrifuged at 48,000 g for 60 minutes at 4°C, and then were passed through a pre-clearing column containing Protein-A Resin (A2S). MHC molecules and their bound peptides were immunoaffinity purified using the 20-8-4 and 28-14-8 antibodies against H2-Kb and H2-Db, respectively covalently bound to Protein-A Sepharose beads (Bassani-Sternberg et al., 2010, Milner et al., 2013). Affinity column was washed with 400mM NaCl, 20mM Tris–HCl followed by 20mM Tris–HCl, pH 8.0 washing steps. The MHC molecules and bound peptides were then eluted with 1% trifluoracetic acid followed by separation of the peptides from the proteins by binding the eluted fraction to disposable reversed-phase C18 columns (Harvard Apparatus). Elution of the peptides was done with 30% acetonitrile in 0.1% trifluoracetic acid (Milner et al., 2013). The eluted peptides were then cleaned using C18 stage tips as in (Rappsilber et al., 2003).
Identification of the MHC peptides
The MHC peptides were dried by vacuum centrifugation, re-solubilized with 0.1% Formic acid and resolved on capillary reversed phase chromatography on 0.075x200 mm laser-pulled capillaries, self-packed with 3μ Reprosil-Aqua C18 (Ishihama et al., 2002). Electrospray tandem mass spectrometry was performed with the Q-Exactive-Plus mass spectrometer (Thermo Scientific).
To construct the database used for peptidomics analysis, non-synonymous somatic point-mutations obtained from WES data, were used to generate a list of mutated peptides. A sliding-window approach of 9-11 amino acids in length was used, to obtain the mutated amino acid in all possible positions. The binding affinity of every mutant peptide was predicted using netMHC-4.0 (Nielsen et al., 2003). Subsequently, only neoantigens with a predicted binding affinity of < 500 nM were extracted, similar to previous studies (McGranahan et al., 2016). The MS data was analyzed by MaxQuant (Cox and Mann, 2008) version 1.5.3.8. The MS files were run against the predicted neoantigen database, in combination with the full WT mouse proteome obtained from f the Uniprot database (http://www.uniprot.org) from Apr-2017 (70946 entries).
In addition, targeted proteomics was used for the identification of neoantigens. In this case the MS instrument measures a predefined list of masses (peptides), also known as Parallel Reaction Monitoring (Lesur and Domon, 2015, Shi et al., 2016). The experiment included analysis of synthetic peptides (GenScript), which were identical in their sequence to the native peptides.
The spectra of the synthetic peptides (MaxQuant) of all identified neopeptides was compared to that of the neoantigenes identified (https://github.com/bioinf-dev/Wolf_et_al_Cell_2019/blob/master/Other/Spectra.pdf) for confirming the identity of the neoantigenes. All neopeptides identified by this targeted approach are indicated in Table S3.
Hydrophobicity calculation
Average hydrophobicity of predicted neoantigens was calculated using R software (“Peptides” library, “KyteDoolittle” scale). A bias toward hydrophobic amino acids at T cell receptor contact residues within immunogenic peptides was previously identified (Chowell et al., 2015).
RMA-S peptide binding assay
RMA-S cells were cultured until logarithmic phase. Cells were washed twice in PBS and incubated in serum-free RPMI medium for 90 minutes in 37°C. Following incubation, 2∗105 cells/well were incubated with 0.1-100 μM peptide in 37°C. 18 hours later, surface H2-Db and H2-Kb levels were assessed by FACS via APC anti-mouse H-2Kb and PE anti-mouse H-2Db antibodies (BioLegend), respectively. Analysis was done using FlowJo software (Tree Star). All peptides were purchased from GenScript.
Inference of ITH, mutation and CNV load
From the TCGA data access portal (https://portal.gdc.cancer.gov/), we downloaded level 2 SNP array and germline + somatic variant call data (∗.byallele.copynumber.data.txt, ∗.oxoG.snp.capture.tcga.vcf.) for 432 skin cutaneous melanoma tumor and matched normal samples. Across all 432 patients, we apply CHAT (Snyder et al., 2014) under default package settings to estimate tumor purity followed by estimation of cellular abundance of CNVs and somatic mutations from the SNP array and variant call data respectively. We found that the average sample purity estimated by CHAT is ∼74% with only 14 samples having purity less than 25%. However, we do not pre-filter any of these samples in our downstream survival analyses as our final conclusions remain the same even after their removal. To estimate mutation load per sample, we count the number of somatic variant calls that were classified as missense or non-sense per sample. This data was obtained from the cbioportal website (https://www.cbioportal.org). Since CHAT detects CNVs using the circular binary segmentation algorithm (Olshen et al., 2004), which essentially partitions the genome into non-overlapping sections of same copy number, we estimate CNV load per sample in a manner similar to Andor et al. (2016). To elaborate: for a tumor sample, let be the length of a segment of the genome and let be total copy number of that segment inferred by CHAT while considering the tumor purity. Let be an indicator of deviation of from normal diploid copy number of 2. Then, CNV load is defined as:
Given that tumor evolution is characterized by a series of clonal expansion events, we often find that mutations and CNVs detected from a bulk tumor sample group into clusters. The number of these clusters or clones is interpreted as the intra-tumor heterogeneity. Using CHAT, we can derive two estimates of number of clones by – clustering cellular abundances of somatic mutations (ITH1) or clustering cellular abundances of CNVs (ITH2). Both estimates convey important information of the underlying clonal structure at different resolutions. Hence, we set the overall intra-tumor heterogeneity of a sample as:
Given the limitation of a single bulk tumor sample per patient for inference, the above estimate is a lower bound and correlated with tumor purity (spearman’s rho = 0.232, p value = 2.09E-5). However, we show that our downstream results still hold after correcting for tumor purity, age and stage (see below).
TCGA Survival Analysis
To see if mutation load, CNV load and ITH are associated with overall patient survival, we stratified the TCGA patients into the following groups:
-
•
Low mutation load (≤median), high mutation load (> median)
-
•
Low cnv load (≤median), high cnv load (> median)
-
•
Low ITH (≤median), High ITH (> median)
Given a cohort of 402 patients with available clinical data, we then fit Kaplan-Meier survival curves for each group and their combinations and test if there are any significant survival differences between the groups using a Log-rank test. All survival analyses were performed using the survival package readily available for R. Due to potentially confounding effects of purity and other clinical factors, it is necessary to ascertain whether the observed associations with survival still hold after accounting for confounding factors. The three major potentially confounding factors are tumor purity, patient age and clinical stage. We hence performed a multivariate cox regression analysis in which patient age, tumor purity and clinical stage were included as additional factors. Our original conclusions do not change after running this analysis (See Table S6).
Estimating cytolytic activity from RNA-seq data
Single-end RNA Seq data from the mouse cell-line derived tumors was trimmed using Trimomatic (0.36) to filter out low quality and adaptor reads. The trimmed data was then processed using Salmon (0.9.2) to directly quantify gene expression levels (TPM). Furthermore, gene expression levels (RPKM) of the 330 melanoma patients with corresponding survival information were downloaded from the TCGA portal. Cytolytic activity (CYT) of TILs in the mouse cell-line derived tumors, and likewise in patient tumors, was estimated from the geometric mean of expression levels of GZMA and PRF113.
Phylogenetic analysis of mouse UVB and SCCs
Exome sequencing data for the UVB exposed sample (n = 1) and the individual single cell clones (n = 20), were used for joint clustering to infer the subclones present across this combined set of samples. MAF files (generated as described above) and somatic copy number alteration logR scores by segment (generated using CNVkit), were utilized as input to the SciClone clustering algorithm (Miller et al., 2014). To ensure high confidence clonal markers were used, the following variant filters were applied: i) a minimum alternative read depth of > 5 was used, ii) indels and triallelic sites were excluded, and iii) only variants present in ≥ 2 samples were retained (i.e., private mutations only in one sample were excluded). This latter criteria of filtering out private variants was implemented to minimize the impact of technical artifacts, which are known to be a potential issue in ITH analyses (Shi et al., 2018), as well as the fact that variants found only in one sample offered minimal utility in inferring the overall cross-sample phylogeny. For completeness, the proportion of private variants found in the experimental mixes used in Figure 6 is included in Table S7, and further studies with high depth error corrected sequencing will be required to accurately understand the biological role of private mutations. SciClone was run with the following parameters: copyNumberMargins = 0.5, maximumClusters = 30 and minimumDepth = −1 (variants were already pre-filtered for minimum depth of > 5 alternative reads during MAF file creation). The clustering solution from SciClone was manually reviewed, and any obviously poor quality clusters were removed (e.g., clusters defined by < 10 mutations, clusters present in every sample but with low VAF values (< 25%), duplicated clusters). Phylogenetic trees, and representative sample tumor diagrams were constructed using R package CloneEvol (Dang et al., 2017). Individual single cell clones were mapped to terminal clones/branches (from the overall clustering solution), based on the closest fitting VAF frequency.
Shannon diversity index analysis
Four malignant melanoma cohorts were analyzed, from previously published studies by Snyder et al. (anti-CTLA4 treated), Riaz et al. (anti-PD1 treated), Hugo et al. (anti-PD1 treated) and Van Allen et al. (anti-CTLA4 treated). Pyclone clustering results for the Riaz et al. cohort were obtained directly from the authors supplemental data files (https://github.com/riazn/bms038_analysis/tree/master/data), and clones defined by n ≥ 2 mutation were retained for further analysis. Pyclone clustering results for the Snyder et al. (2014) and Van Allen et al. (2015) cohorts were obtained from previously published work from McGranahan et al. (2016) (https://bitbucket.org/nmcgranahan/clonalneoantigenanalysispipeline/downloads/), with clones already having undergone quality control filtering. For Hugo et al. (2016), no previously published clustering results were available, and instead we managed to successfully process raw WES data of a subset of 22 samples for which there is available survival information on 21 samples. The processing pipeline used is as follows: we called variants for each cancer and paired normal samples using the GATK (V. 3.6) ‘HaplotypeCaller’(Li et al., 2009, McKenna et al., 2010) utility applying ‘-ERC GVCF’ mode to produce a comprehensive record of genotype likelihoods for every position in the genome regardless of whether a variant was detected at that site or not. The goal of using the GVCF mode was to capture confidence score for every site represented in a paired normal and cancer cohort for calling somatic mutation in cancer. Next, we combined the paired GVCFs from each paired cohorts using GATK’s ‘GenotypeGVCFs’ utility yielding genotype likelihood scores for every variant in cancer and the paired normal sample. Next, we used GATK’s ‘VariantRecalibrator’ utility using dbSNP VCF (v146: ftp://ftp.ncbi.nlm.nih.gov/snp/organisms/human_9606_b146_GRCh38p2/VCF) file by selecting annotation criteria of QD;MQ;MQRankSum;ReadPosRankSum;FS;SOR, followed by GATK’s ‘ApplyRecalibration’ utility with ‘SNP’ mode. Next, using GATK’s ‘VariantFiltration’ utility we selected the variants with VQSLOD ≥ 4.0. Finally, somatic mutations were defined as the loci whose genotype (1/1, 0/1, or 0/0 with ‘PL’ (Phred-scaled likelihood of the genotype) score = 0, i.e., highest confidence) in cancer is distinct from that in paired normal. The final somatic mutations were mapped on an exonic site of a transcript by ‘bcftools’ tool (V. 1.3)(Li et al., 2009) using BED file of coding region. Clustering analysis was then completed using the CHAT algorithm, as described above.
For each case, the count of mutations within each cluster (clone) as defined by Pyclone/CHAT were computed, and Shannon diversity index (SDI) was calculated using the entropy.empirical function in R package ‘Entropy’. Overall survival data was obtained from the original author’s publications, and n = 3 cases from the Riaz et al. cohort with “NE” RECIST coding were excluded, on account of death having occurred prior to disease assessment. In addition, the group of n = 10 cases from the Van Allen et al. (2015) cohort with long-term survival but no clinical benefit from anti-CTLA4 treatment were excluded, as per the original publication. All other cases with available survival data and clustering results were used for survival analysis (cases with available clustering results were those with data deposited in https://github.com/riazn/bms038_analysis/tree/master/data (Riaz et al., 2017) and https://bitbucket.org/nmcgranahan/clonalneoantigenanalysispipeline/downloads/ (Van Allen et al., 2015 and Snyder et al., 2014 cohorts), extracted on date 14/05/2019, please refer to the original publications for further details). Kaplan-Meier plots were drawn using the ggsurvplot function in R, with the low/high diversity groups being defined by having a SDI value < or ≥ to the median value in each cohort respectively. Significance values in Figure 7 were calculated using the coxph function in R, with SDI included in the model as a continuous variable, and overall survival hazard ratios are reported per unit increase in SDI score. To correct for purity, a multi-variable coxph model was used, with SDI and purity included as variables, and the significance values of each variable in the model were analyzed. Meta-analysis of significance across the two studies was calculated using the Fisher method for combinig p values.
Quantification and Statistical Analysis
Statistical analysis was performed using the Prism 8 software (GraphPad, San Diego, CA, USA) and the software environment R, using RStudio. For all statistical analysis a p value of < 0.05 was determined to be significant. All data is presented using standard error mean (SEM). P values are depicted in all figures, and selected p values with exceptional significance to the paper are also briefly described in the main text. Samples sizes (n), means and SEM are depicted in the figures and/or figure legends. Sample size values were either depiction of number of mice used for experiments, or number of patients. For the comparison of patient survival curves (Kaplan-Meier curves) the log rank test was used. For samples with distribution other than normal, or with small sample size (n < 6), the nonparametric Wilcoxon test, Mann-Whitney’s U test, and Kruskal-Wallis test were used. For samples which approximate normal distribution, Student’s t test or one-way ANOVA followed by Bonferoni’s post hoc test was used. For correlation between CYT score and the ITH ranks depicted in Figure 1, the Spearman’s Rho nonparametric test was used. For tumor growth curve, repeated-measures two-way ANOVA was used, followed by Bonferoni’s post hoc test. For the analysis of the Shannon diversity index (SDI), z-test from Cox proportional hazard mode was used with SDI tested as a continuous variable. Proportions of genomic mutation types of the different cell lines were analyzed using the Chi-Square test.
Data and Code Availability
The raw sequencing data has been made publicly deposited at https://www.ebi.ac.uk/ena. The study accession number is PRJEB25961 and the secondary accession is ERP107928. The custom codes and processed data used to generate the results of the manuscript (Mouse CD8+ T cell RNaseq data, Processed data and code used; Figures 1, 2, 3, and 7 and the peptydes ms spectra) are available in github (https://github.com/bioinf-dev/Wolf_et_al_Cell_2019)
Acknowledgments
We would like to thank S. Motola and M. Gershovis (Israel National Center for Personalized Medicine) for their help with the WES and the INCPM proteomic unit for their assistance with the proteomic analysis, Prof. Jung (Immunology Department, Weizmann Institute of Science) for the CD80/86−/− mice, Dr. Harmelin (veterinary resources, Weizmann Institute of Science) for help with pathologic assessment of histology, Dr. Bassani-Sternberg (University of Lausanne) for assistance with peptidomics analysis, Dr. McGranahan (University College London) and R. Rosenthal (Francis Crick Institute) for assistance with clonality analysis, and Dr. A. Snir-Wolf for fruitful discussions. Y.S. is supported by Israel Science Foundation grant 696/17, the European Research Council (ERC) under the European Union Horizon 2020 Research and Innovation Program (grant agreement 770854), the ERC (CoG-770854), the Melanoma Research Alliance (#622106), Fundación Ramón Areces, the Rising Tide Foundation, the Knell family, and the Hamburger family. Y.W. is supported by a Fienberg School Dean of Faculty fellowship. A.J.-S. is supported by the Cancer Research UK Cambridge Institute and the Mexican National Council of Science and Technology (CONACyT). C.S. is Royal Society Napier Research Professor. This work was supported by the Francis Crick Institute that receives its core funding from Cancer Research UK (FC001169, FC001202), the UK Medical Research Council (FC001169, FC001202), and the Wellcome Trust (FC001169, FC001202). M.L.M. is supported by a Cancer Research UK core grant (C14303/A17197). K.L. is funded by a Skills Development Fellowship from the UK Medical Research Council (MR/P014712/1). G.M., C.P.D., and E.P.G. were funded by the Intramural Research Program, NCI, NIH. E.R. is supported by NIH intramural funds.
Author Contributions
Y.W., O.B., G.B.E., S.C., S.T., and A.S. conducted in vitro and in vivo experiments. S.P., H.K., J.S.L., R.L. and E.R. performed in-depth analysis of human TCGA and immunotherapy patient data. A.J.-S., R.L., and M.L.M. analyzed WES of mouse samples. K.L. performed the phylogenetic tree analysis and provided additional bioinformatics data analysis support. C.S. performed data interpretation of mouse phylogenetic results. Y.L., E.B., R.L., and A.A. performed and analyzed mass spectrometry data. R.L. analyzed bioinformatics data. C.-P.D., E.P.-G., and G.M. provided crucial material. E.C., I.S., and E.P. performed and analyzed immunohistochemistry. L.B., T.D., S.S.S.-O., and L.E. provided technical help and advice. Y.W., O.B., E.R., and Y.S. conceived the project and wrote the manuscript. All authors contributed to the final version of the paper.
Declaration of Interests
C.S. declares the following receipt of grants/research support: Pfizer, AstraZeneca, BMS, Roche Ventana. Receipt of honoraria, consultancy, or SAB Member fees: Pfizer, Novartis, GlaxoSmithKline, MSD, BMS, Celgene, AstraZeneca, Illumina, Sarah Canon Research Institute, Genentech, Roche-Ventana, GRAIL, Medicxi Advisor for Dynamo Therapeutics. Stock shareholder: Apogen Biotechnologies, Epic Bioscience, GRAIL. Co-Founder & stock options: Achilles Therapeutics. K.L. reports speaker fees from Roche Tissue Diagnostics and patents pending on indel burden as a predictor of checkpoint inhibitor response and targeting of frameshift neoantigens for personalised immunotherapy.
Published: September 12, 2019
Footnotes
Supplemental Information can be found online at https://doi.org/10.1016/j.cell.2019.08.032.
Contributor Information
Eytan Ruppin, Email: eyruppin@gmail.com.
Yardena Samuels, Email: yardena.samuels@weizmann.ac.il.
Supplemental Information
References
- Alexandrov L.B., Nik-Zainal S., Wedge D.C., Aparicio S.A., Behjati S., Biankin A.V., Bignell G.R., Bolli N., Borg A., Børresen-Dale A.L., Australian Pancreatic Cancer Genome Initiative. ICGC Breast Cancer Consortium. ICGC MMML-Seq Consortium. ICGC PedBrain Signatures of mutational processes in human cancer. Nature. 2013;500:415–421. doi: 10.1038/nature12477. [DOI] [PMC free article] [PubMed] [Google Scholar]
- Alter G., Malenfant J.M., Altfeld M. CD107a as a functional marker for the identification of natural killer cell activity. J. Immunol. Methods. 2004;294:15–22. doi: 10.1016/j.jim.2004.08.008. [DOI] [PubMed] [Google Scholar]
- Andor N., Graham T.A., Jansen M., Xia L.C., Aktipis C.A., Petritsch C., Ji H.P., Maley C.C. Pan-cancer analysis of the extent and consequences of intratumor heterogeneity. Nat. Med. 2016;22:105–113. doi: 10.1038/nm.3984. [DOI] [PMC free article] [PubMed] [Google Scholar]
- Arce Vargas F., Furness A.J.S., Solomon I., Joshi K., Mekkaoui L., Lesko M.H., Miranda Rota E., Dahan R., Georgiou A., Sledzinska A., Melanoma TRACERx Consortium. Renal TRACERx Consortium. Lung TRACERx Consortium Fc-Optimized Anti-CD25 Depletes Tumor-Infiltrating Regulatory T Cells and Synergizes with PD-1 Blockade to Eradicate Established Tumors. Immunity. 2017;46:577–586. doi: 10.1016/j.immuni.2017.03.013. [DOI] [PMC free article] [PubMed] [Google Scholar]
- Bar-On L., Birnberg T., Kim K.W., Jung S. Dendritic cell-restricted CD80/86 deficiency results in peripheral regulatory T-cell reduction but is not associated with lymphocyte hyperactivation. Eur. J. Immunol. 2011;41:291–298. doi: 10.1002/eji.201041169. [DOI] [PubMed] [Google Scholar]
- Barber D.L., Wherry E.J., Ahmed R. Cutting edge: rapid in vivo killing by memory CD8 T cells. J. Immunol. 2003;171:27–31. doi: 10.4049/jimmunol.171.1.27. [DOI] [PubMed] [Google Scholar]
- Bassani-Sternberg M., Barnea E., Beer I., Avivi I., Katz T., Admon A. Soluble plasma HLA peptidome as a potential source for cancer biomarkers. Proc. Natl. Acad. Sci. USA. 2010;107:18769–18776. doi: 10.1073/pnas.1008501107. [DOI] [PMC free article] [PubMed] [Google Scholar]
- Bolger A.M., Lohse M., Usadel B. Trimmomatic: a flexible trimmer for Illumina sequence data. Bioinformatics. 2014;30:2114–2120. doi: 10.1093/bioinformatics/btu170. [DOI] [PMC free article] [PubMed] [Google Scholar]
- Borst J., Ahrends T., Bąbała N., Melief C.J.M., Kastenmüller W. CD4+ T cell help in cancer immunology and immunotherapy. Nat. Rev. Immunol. 2018;18:635–647. doi: 10.1038/s41577-018-0044-0. [DOI] [PubMed] [Google Scholar]
- Brown S.D., Warren R.L., Gibb E.A., Martin S.D., Spinelli J.J., Nelson B.H., Holt R.A. Neo-antigens predicted by tumor genome meta-analysis correlate with increased patient survival. Genome Res. 2014;24:743–750. doi: 10.1101/gr.165985.113. [DOI] [PMC free article] [PubMed] [Google Scholar]
- Brown J.M., Recht L., Strober S. The Promise of Targeting Macrophages in Cancer Therapy. Clin. Cancer Res. 2017;23:3241–3250. doi: 10.1158/1078-0432.CCR-16-3122. [DOI] [PMC free article] [PubMed] [Google Scholar]
- Budden T., Davey R.J., Vilain R.E., Ashton K.A., Braye S.G., Beveridge N.J., Bowden N.A. Repair of UVB-induced DNA damage is reduced in melanoma due to low XPC and global genome repair. Oncotarget. 2016;7:60940–60953. doi: 10.18632/oncotarget.10902. [DOI] [PMC free article] [PubMed] [Google Scholar]
- Cancer Genome Atlas Network Genomic Classification of Cutaneous Melanoma. Cell. 2015;161:1681–1696. doi: 10.1016/j.cell.2015.05.044. [DOI] [PMC free article] [PubMed] [Google Scholar]
- Chan T.A., Yarchoan M., Jaffee E., Swanton C., Quezada S.A., Stenzinger A., Peters S. Development of tumor mutation burden as an immunotherapy biomarker: utility for the oncology clinic. Ann. Oncol. 2019;30:44–56. doi: 10.1093/annonc/mdy495. [DOI] [PMC free article] [PubMed] [Google Scholar]
- Chen H., Weng Q.Y., Fisher D.E. UV signaling pathways within the skin. J. Invest. Dermatol. 2014;134:2080–2085. doi: 10.1038/jid.2014.161. [DOI] [PMC free article] [PubMed] [Google Scholar]
- Chihara N., Madi A., Kondo T., Zhang H., Acharya N., Singer M., Nyman J., Marjanovic N.D., Kowalczyk M.S., Wang C. Induction and transcriptional regulation of the co-inhibitory gene module in T cells. Nature. 2018;558:454–459. doi: 10.1038/s41586-018-0206-z. [DOI] [PMC free article] [PubMed] [Google Scholar]
- Chowell D., Krishna S., Becker P.D., Cocita C., Shu J., Tan X., Greenberg P.D., Klavinskis L.S., Blattman J.N., Anderson K.S. TCR contact residue hydrophobicity is a hallmark of immunogenic CD8+ T cell epitopes. Proc. Natl. Acad. Sci. USA. 2015;112:E1754–E1762. doi: 10.1073/pnas.1500973112. [DOI] [PMC free article] [PubMed] [Google Scholar]
- Cleary A.S., Leonard T.L., Gestl S.A., Gunther E.J. Tumour cell heterogeneity maintained by cooperating subclones in Wnt-driven mammary cancers. Nature. 2014;508:113–117. doi: 10.1038/nature13187. [DOI] [PMC free article] [PubMed] [Google Scholar]
- Coffelt S.B., Kersten K., Doornebal C.W., Weiden J., Vrijland K., Hau C.-S., Verstegen N.J.M., Ciampricotti M., Hawinkels L.J.A.C., Jonkers J., de Visser K.E. IL-17-producing γδ T cells and neutrophils conspire to promote breast cancer metastasis. Nature. 2015;522:345–348. doi: 10.1038/nature14282. [DOI] [PMC free article] [PubMed] [Google Scholar]
- Cox J., Mann M. MaxQuant enables high peptide identification rates, individualized p.p.b.-range mass accuracies and proteome-wide protein quantification. Nat. Biotechnol. 2008;26:1367–1372. doi: 10.1038/nbt.1511. [DOI] [PubMed] [Google Scholar]
- Dang H.X., White B.S., Foltz S.M., Miller C.A., Luo J., Fields R.C., Maher C.A. ClonEvol: clonal ordering and visualization in cancer sequencing. Ann. Oncol. 2017;28:3076–3082. doi: 10.1093/annonc/mdx517. [DOI] [PMC free article] [PubMed] [Google Scholar]
- De Fabo E.C., Noonan F.P., Fears T., Merlino G. Ultraviolet B but not ultraviolet A radiation initiates melanoma. Cancer Res. 2004;64:6372–6376. doi: 10.1158/0008-5472.CAN-04-1454. [DOI] [PubMed] [Google Scholar]
- de Mingo Pulido A., Gardner A., Hiebler S., Soliman H., Rugo H.S., Krummel M.F., Coussens L.M., Ruffell B. TIM-3 Regulates CD103(+) Dendritic Cell Function and Response to Chemotherapy in Breast Cancer. Cancer Cell. 2018;33:60–74.e6. doi: 10.1016/j.ccell.2017.11.019. [DOI] [PMC free article] [PubMed] [Google Scholar]
- DePristo M.A., Banks E., Poplin R., Garimella K.V., Maguire J.R., Hartl C., Philippakis A.A., del Angel G., Rivas M.A., Hanna M. A framework for variation discovery and genotyping using next-generation DNA sequencing data. Nat. Genet. 2011;43:491–498. doi: 10.1038/ng.806. [DOI] [PMC free article] [PubMed] [Google Scholar]
- Gejman R.S., Chang A.Y., Jones H.F., DiKun K., Hakimi A.A., Schietinger A., Scheinberg D.A. Rejection of immunogenic tumor clones is limited by clonal fraction. eLife. 2018;7:e41090. doi: 10.7554/eLife.41090. [DOI] [PMC free article] [PubMed] [Google Scholar]
- Germano G., Lamba S., Rospo G., Barault L., Magrì A., Maione F., Russo M., Crisafulli G., Bartolini A., Lerda G. Inactivation of DNA repair triggers neoantigen generation and impairs tumour growth. Nature. 2017;552:116–120. doi: 10.1038/nature24673. [DOI] [PubMed] [Google Scholar]
- Gros A., Parkhurst M.R., Tran E., Pasetto A., Robbins P.F., Ilyas S., Prickett T.D., Gartner J.J., Crystal J.S., Roberts I.M. Prospective identification of neoantigen-specific lymphocytes in the peripheral blood of melanoma patients. Nat. Med. 2016;22:433–438. doi: 10.1038/nm.4051. [DOI] [PMC free article] [PubMed] [Google Scholar]
- Gubin M.M., Zhang X., Schuster H., Caron E., Ward J.P., Noguchi T., Ivanova Y., Hundal J., Arthur C.D., Krebber W.J. Checkpoint blockade cancer immunotherapy targets tumour-specific mutant antigens. Nature. 2014;515:577–581. doi: 10.1038/nature13988. [DOI] [PMC free article] [PubMed] [Google Scholar]
- Gubin M.M., Artyomov M.N., Mardis E.R., Schreiber R.D. Tumor neoantigens: building a framework for personalized cancer immunotherapy. J. Clin. Invest. 2015;125:3413–3421. doi: 10.1172/JCI80008. [DOI] [PMC free article] [PubMed] [Google Scholar]
- Gubin M.M., Esaulova E., Ward J.P., Malkova O.N., Runci D., Wong P., Noguchi T., Arthur C.D., Meng W., Alspach E. High-Dimensional Analysis Delineates Myeloid and Lymphoid Compartment Remodeling during Successful Immune-Checkpoint Cancer Therapy. Cell. 2018;175:1014–1030.e19. doi: 10.1016/j.cell.2018.09.030. [DOI] [PMC free article] [PubMed] [Google Scholar]
- Guillerey C., Huntington N.D., Smyth M.J. Targeting natural killer cells in cancer immunotherapy. Nat. Immunol. 2016;17:1025–1036. doi: 10.1038/ni.3518. [DOI] [PubMed] [Google Scholar]
- Haabeth O.A.W., Tveita A.A., Fauskanger M., Schjesvold F., Lorvik K.B., Hofgaard P.O., Omholt H., Munthe L.A., Dembic Z., Corthay A., Bogen B. How Do CD4(+) T Cells Detect and Eliminate Tumor Cells That Either Lack or Express MHC Class II Molecules? Front. Immunol. 2014;5:174. doi: 10.3389/fimmu.2014.00174. [DOI] [PMC free article] [PubMed] [Google Scholar]
- Hausser J., Strimmer K. Entropy Inference and the James-Stein Estimator, with Application to Nonlinear Gene Association Networks. J. Mach. Learn. Res. 2009;10:1469–1484. [Google Scholar]
- Hellmann M.D., Nathanson T., Rizvi H., Creelan B.C., Sanchez-Vega F., Ahuja A., Ni A., Novik J.B., Mangarin L.M.B., Abu-Akeel M. Genomic Features of Response to Combination Immunotherapy in Patients with Advanced Non-Small-Cell Lung Cancer. Cancer Cell. 2018;33:843–852. doi: 10.1016/j.ccell.2018.03.018. [DOI] [PMC free article] [PubMed] [Google Scholar]
- Hugo W., Zaretsky J.M., Sun L., Song C., Moreno B.H., Hu-Lieskovan S., Berent-Maoz B., Pang J., Chmielowski B., Cherry G. Genomic and Transcriptomic Features of Response to Anti-PD-1 Therapy in Metastatic Melanoma. Cell. 2016;165:35–44. doi: 10.1016/j.cell.2016.02.065. [DOI] [PMC free article] [PubMed] [Google Scholar]
- Ishihama Y., Rappsilber J., Andersen J.S., Mann M. Microcolumns with self-assembled particle frits for proteomics. J. Chromatogr. A. 2002;979:233–239. doi: 10.1016/s0021-9673(02)01402-4. [DOI] [PubMed] [Google Scholar]
- Jamal-Hanjani M., Wilson G.A., McGranahan N., Birkbak N.J., Watkins T.B.K., Veeriah S., Shafi S., Johnson D.H., Mitter R., Rosenthal R., TRACERx Consortium Tracking the Evolution of Non-Small-Cell Lung Cancer. N. Engl. J. Med. 2017;376:2109–2121. doi: 10.1056/NEJMoa1616288. [DOI] [PubMed] [Google Scholar]
- Janiszewska M., Tabassum D.P., Castaño Z., Cristea S., Yamamoto K.N., Kingston N.L., Murphy K.C., Shu S., Harper N.W., Del Alcazar C.G. Subclonal cooperation drives metastasis by modulating local and systemic immune microenvironments. Nat. Cell Biol. 2019;21:879–888. doi: 10.1038/s41556-019-0346-x. [DOI] [PMC free article] [PubMed] [Google Scholar]
- Kalaora S., Barnea E., Merhavi-Shoham E., Qutob N., Teer J.K., Shimony N., Schachter J., Rosenberg S.A., Besser M.J., Admon A., Samuels Y. Use of HLA peptidomics and whole exome sequencing to identify human immunogenic neo-antigens. Oncotarget. 2016;7:5110–5117. doi: 10.18632/oncotarget.6960. [DOI] [PMC free article] [PubMed] [Google Scholar]
- Kalaora S., Wolf Y., Feferman T., Barnea E., Greenstein E., Reshef D., Tirosh I., Reuben A., Patkar S., Levy R. Combined Analysis of Antigen Presentation and T-cell Recognition Reveals Restricted Immune Responses in Melanoma. Cancer Discov. 2018;8:1366–1375. doi: 10.1158/2159-8290.CD-17-1418. [DOI] [PMC free article] [PubMed] [Google Scholar]
- Kassambara A., Kosinski M., Biecek P., Fabian S. 2017. Package ‘survminer’.https://cran.r-project.org/web/packages/survminer/survminer.pdf [Google Scholar]
- Kather J.N., Suarez-Carmona M., Charoentong P., Weis C.A., Hirsch D., Bankhead P., Horning M., Ferber D., Kel I., Herpel E. Topography of cancer-associated immune cells in human solid tumors. eLife. 2018;7 doi: 10.7554/eLife.36967. e36967. [DOI] [PMC free article] [PubMed] [Google Scholar]
- König L., Mairinger F.D., Hoffmann O., Bittner A.K., Schmid K.W., Kimmig R., Kasimir-Bauer S., Bankfalvi A. Dissimilar patterns of tumor-infiltrating immune cells at the invasive tumor front and tumor center are associated with response to neoadjuvant chemotherapy in primary breast cancer. BMC Cancer. 2019;19:120. doi: 10.1186/s12885-019-5320-2. [DOI] [PMC free article] [PubMed] [Google Scholar]
- Krepler C., Sproesser K., Brafford P., Beqiri M., Garman B., Xiao M., Shannan B., Watters A., Perego M., Zhang G. A Comprehensive Patient-Derived Xenograft Collection Representing the Heterogeneity of Melanoma. Cell Rep. 2017;21:1953–1967. doi: 10.1016/j.celrep.2017.10.021. [DOI] [PMC free article] [PubMed] [Google Scholar]
- Kurtulus S., Madi A., Escobar G., Klapholz M., Nyman J., Christian E., Pawlak M., Dionne D., Xia J., Rozenblatt-Rosen O. Checkpoint Blockade Immunotherapy Induces Dynamic Changes in PD-1(-)CD8(+) Tumor-Infiltrating T Cells. Immunity. 2019;50:181–194.e6. doi: 10.1016/j.immuni.2018.11.014. [DOI] [PMC free article] [PubMed] [Google Scholar]
- Larkin J., Chiarion-Sileni V., Gonzalez R., Grob J.J., Cowey C.L., Lao C.D., Schadendorf D., Dummer R., Smylie M., Rutkowski P. Combined Nivolumab and Ipilimumab or Monotherapy in Untreated Melanoma. N. Engl. J. Med. 2015;373:23–34. doi: 10.1056/NEJMoa1504030. [DOI] [PMC free article] [PubMed] [Google Scholar]
- Lesur A., Domon B. Advances in high-resolution accurate mass spectrometry application to targeted proteomics. Proteomics. 2015;15:880–890. doi: 10.1002/pmic.201400450. [DOI] [PubMed] [Google Scholar]
- Li H., Durbin R. Fast and accurate long-read alignment with Burrows-Wheeler transform. Bioinformatics. 2010;26:589–595. doi: 10.1093/bioinformatics/btp698. [DOI] [PMC free article] [PubMed] [Google Scholar]
- Li H., Handsaker B., Wysoker A., Fennell T., Ruan J., Homer N., Marth G., Abecasis G., Durbin R., 1000 Genome Project Data Processing Subgroup The Sequence Alignment/Map format and SAMtools. Bioinformatics. 2009;25:2078–2079. doi: 10.1093/bioinformatics/btp352. [DOI] [PMC free article] [PubMed] [Google Scholar]
- Li H., van der Leun A.M., Yofe I., Lubling Y., Gelbard-Solodkin D., van Akkooi A.C.J., van den Braber M., Rozeman E.A., Haanen J., Blank C.U. Dysfunctional CD8 T Cells Form a Proliferative, Dynamically Regulated Compartment within Human Melanoma. Cell. 2019;176:775–789.e18. doi: 10.1016/j.cell.2018.11.043. [DOI] [PMC free article] [PubMed] [Google Scholar]
- Linnemann C., van Buuren M.M., Bies L., Verdegaal E.M.E., Schotte R., Calis J.J.A., Behjati S., Velds A., Hilkmann H., Atmioui D.E. High-throughput epitope discovery reveals frequent recognition of neo-antigens by CD4+ T cells in human melanoma. Nat. Med. 2015;21:81–85. doi: 10.1038/nm.3773. [DOI] [PubMed] [Google Scholar]
- Ljunggren H.G., Stam N.J., Ohlén C., Neefjes J.J., Höglund P., Heemels M.T., Bastin J., Schumacher T.N., Townsend A., Kärre K. Empty MHC class I molecules come out in the cold. Nature. 1990;346:476–480. doi: 10.1038/346476a0. [DOI] [PubMed] [Google Scholar]
- Lladser A., Ljungberg K., Tufvesson H., Tazzari M., Roos A.K., Quest A.F., Kiessling R. Intradermal DNA electroporation induces survivin-specific CTLs, suppresses angiogenesis and confers protection against mouse melanoma. Cancer Immunol. Immunother. 2010;59:81–92. doi: 10.1007/s00262-009-0725-4. [DOI] [PMC free article] [PubMed] [Google Scholar]
- Lutz M.B., Kukutsch N., Ogilvie A.L., Rossner S., Koch F., Romani N., Schuler D. An advanced culture method for generating large quantities of highly pure dendritic cells from mouse bone marrow. J. Immunological Methods. 1999;223:77–92. doi: 10.1016/s0022-1759(98)00204-x. [DOI] [PubMed] [Google Scholar]
- Marusyk A., Tabassum D.P., Altrock P.M., Almendro V., Michor F., Polyak K. Non-cell-autonomous driving of tumour growth supports sub-clonal heterogeneity. Nature. 2014;514:54–58. doi: 10.1038/nature13556. [DOI] [PMC free article] [PubMed] [Google Scholar]
- McDonald K.A., Kawaguchi T., Qi Q., Peng X., Asaoka M., Young J., Opyrchal M., Yan L., Patnaik S., Otsuji E., Takabe K. Tumor Heterogeneity Correlates with Less Immune Response and Worse Survival in Breast Cancer Patients. Ann. Surg. Oncol. 2019;26:2191–2199. doi: 10.1245/s10434-019-07338-3. [DOI] [PMC free article] [PubMed] [Google Scholar]
- McGranahan N., Swanton C. Clonal Heterogeneity and Tumor Evolution: Past, Present, and the Future. Cell. 2017;168:613–628. doi: 10.1016/j.cell.2017.01.018. [DOI] [PubMed] [Google Scholar]
- McGranahan N., Furness A.J., Rosenthal R., Ramskov S., Lyngaa R., Saini S.K., Jamal-Hanjani M., Wilson G.A., Birkbak N.J., Hiley C.T. Clonal neoantigens elicit T cell immunoreactivity and sensitivity to immune checkpoint blockade. Science. 2016;351:1463–1469. doi: 10.1126/science.aaf1490. [DOI] [PMC free article] [PubMed] [Google Scholar]
- McKenna A., Hanna M., Banks E., Sivachenko A., Cibulskis K., Kernytsky A., Garimella K., Altshuler D., Gabriel S., Daly M., DePristo M.A. The Genome Analysis Toolkit: a MapReduce framework for analyzing next-generation DNA sequencing data. Genome Res. 2010;20:1297–1303. doi: 10.1101/gr.107524.110. [DOI] [PMC free article] [PubMed] [Google Scholar]
- Miao D., Margolis C.A., Gao W., Voss M.H., Li W., Martini D.J., Norton C., Bossé D., Wankowicz S.M., Cullen D. Genomic correlates of response to immune checkpoint therapies in clear cell renal cell carcinoma. Science. 2018;359:801–806. doi: 10.1126/science.aan5951. [DOI] [PMC free article] [PubMed] [Google Scholar]
- Miao D., Margolis C.A., Vokes N.I., Liu D., Taylor-Weiner A., Wankowicz S.M., Adeegbe D., Keliher D., Schilling B., Tracy A. Genomic correlates of response to immune checkpoint blockade in microsatellite-stable solid tumors. Nat. Genet. 2018;50:1271–1281. doi: 10.1038/s41588-018-0200-2. [DOI] [PMC free article] [PubMed] [Google Scholar]
- Miller C.A., White B.S., Dees N.D., Griffith M., Welch J.S., Griffith O.L., Vij R., Tomasson M.H., Graubert T.A., Walter M.J. SciClone: inferring clonal architecture and tracking the spatial and temporal patterns of tumor evolution. PLoS Comput. Biol. 2014;10:e1003665. doi: 10.1371/journal.pcbi.1003665. [DOI] [PMC free article] [PubMed] [Google Scholar]
- Milner E., Gutter-Kapon L., Bassani-Strenberg M., Barnea E., Beer I., Admon A. The effect of proteasome inhibition on the generation of the human leukocyte antigen (HLA) peptidome. Mol. Cell. Proteomics. 2013;12:1853–1864. doi: 10.1074/mcp.M112.026013. [DOI] [PMC free article] [PubMed] [Google Scholar]
- Milo I., Bedora-Faure M., Garcia Z., Thibaut R., Périé L., Shakhar G., Deriano L., Bousso P. The immune system profoundly restricts intratumor genetic heterogeneity. Sci. Immunol. 2018;3 doi: 10.1126/sciimmunol.aat1435. eaat1435. [DOI] [PubMed] [Google Scholar]
- Morris L.G., Riaz N., Desrichard A., Şenbabaoğlu Y., Hakimi A.A., Makarov V., Reis-Filho J.S., Chan T.A. Pan-cancer analysis of intratumor heterogeneity as a prognostic determinant of survival. Oncotarget. 2016;7:10051–10063. doi: 10.18632/oncotarget.7067. [DOI] [PMC free article] [PubMed] [Google Scholar]
- Muranski P., Boni A., Antony P.A., Cassard L., Irvine K.R., Kaiser A., Paulos C.M., Palmer D.C., Touloukian C.E., Ptak K. Tumor-specific Th17-polarized cells eradicate large established melanoma. Blood. 2008;112:362–373. doi: 10.1182/blood-2007-11-120998. [DOI] [PMC free article] [PubMed] [Google Scholar]
- Newman A.M., Liu C.L., Green M.R., Gentles A.J., Feng W., Xu Y., Hoang C.D., Diehn M., Alizadeh A.A. Robust enumeration of cell subsets from tissue expression profiles. Nat. Methods. 2015;12:453–457. doi: 10.1038/nmeth.3337. [DOI] [PMC free article] [PubMed] [Google Scholar]
- Nielsen M., Lundegaard C., Worning P., Lauemøller S.L., Lamberth K., Buus S., Brunak S., Lund O. Reliable prediction of T-cell epitopes using neural networks with novel sequence representations. Protein Sci. 2003;12:1007–1017. doi: 10.1110/ps.0239403. [DOI] [PMC free article] [PubMed] [Google Scholar]
- Olshen A.B., Venkatraman E.S., Lucito R., Wigler M. Circular binary segmentation for the analysis of array-based DNA copy number data. Biostatistics. 2004;5:557–572. doi: 10.1093/biostatistics/kxh008. [DOI] [PubMed] [Google Scholar]
- Patel S.J., Sanjana N.E., Kishton R.J., Eidizadeh A., Vodnala S.K., Cam M., Gartner J.J., Jia L., Steinberg S.M., Yamamoto T.N. Identification of essential genes for cancer immunotherapy. Nature. 2017;548:537–542. doi: 10.1038/nature23477. [DOI] [PMC free article] [PubMed] [Google Scholar]
- Patro R., Duggal G., Love M.I., Irizarry R.A., Kingsford C. Salmon provides fast and bias-aware quantification of transcript expression. Nat. Methods. 2017;14:417–419. doi: 10.1038/nmeth.4197. [DOI] [PMC free article] [PubMed] [Google Scholar]
- Porgador A., Brenner B., Vadai E., Feldman M., Eisenbach L. Immunization by gamma-IFN-treated B16-F10.9 melanoma cells protects against metastatic spread of the parental tumor. Int. J. Cancer Suppl. 1991;6:54–60. doi: 10.1002/ijc.2910470713. [DOI] [PubMed] [Google Scholar]
- Quezada S.A., Simpson T.R., Peggs K.S., Merghoub T., Vider J., Fan X., Blasberg R., Yagita H., Muranski P., Antony P.A. Tumor-reactive CD4(+) T cells develop cytotoxic activity and eradicate large established melanoma after transfer into lymphopenic hosts. J. Exp. Med. 2010;207:637–650. doi: 10.1084/jem.20091918. [DOI] [PMC free article] [PubMed] [Google Scholar]
- Rappsilber J., Ishihama Y., Mann M. Stop and go extraction tips for matrix-assisted laser desorption/ionization, nanoelectrospray, and LC/MS sample pretreatment in proteomics. Anal. Chem. 2003;753:663–670. doi: 10.1021/ac026117i. [DOI] [PubMed] [Google Scholar]
- Reuben A., Spencer C.N., Prieto P.A., Gopalakrishnan V., Reddy S.M., Miller J.P., Mao X., De Macedo M.P., Chen J., Song X. Genomic and immune heterogeneity are associated with differential responses to therapy in melanoma. NPJ Genom. Med. 2017;2:10. doi: 10.1038/s41525-017-0013-8. [DOI] [PMC free article] [PubMed] [Google Scholar]
- Riaz N., Havel J.J., Makarov V., Desrichard A., Urba W.J., Sims J.S., Hodi F.S., Martin-Algarra S., Mandal R., Sharfman W.H. Tumor and Microenvironment Evolution during Immunotherapy with Nivolumab. Cell. 2017;171:934–949.e16. doi: 10.1016/j.cell.2017.09.028. [DOI] [PMC free article] [PubMed] [Google Scholar]
- Ribas A., Wolchok J.D. Cancer immunotherapy using checkpoint blockade. Science. 2018;359:1350–1355. doi: 10.1126/science.aar4060. [DOI] [PMC free article] [PubMed] [Google Scholar]
- Rizvi N.A., Hellmann M.D., Snyder A., Kvistborg P., Makarov V., Havel J.J., Lee W., Yuan J., Wong P., Ho T.S. Cancer immunology. Mutational landscape determines sensitivity to PD-1 blockade in non-small cell lung cancer. Science. 2015;348:124–128. doi: 10.1126/science.aaa1348. [DOI] [PMC free article] [PubMed] [Google Scholar]
- Rollman E., Smith M.Z., Brooks A.G., Purcell D.F., Zuber B., Ramshaw I.A., Kent S.J. Killing kinetics of simian immunodeficiency virus-specific CD8+ T cells: implications for HIV vaccine strategies. J. Immunol. 2007;179:4571–4579. doi: 10.4049/jimmunol.179.7.4571. [DOI] [PubMed] [Google Scholar]
- Rooney M.S., Shukla S.A., Wu C.J., Getz G., Hacohen N. Molecular and genetic properties of tumors associated with local immune cytolytic activity. Cell. 2015;160:48–61. doi: 10.1016/j.cell.2014.12.033. [DOI] [PMC free article] [PubMed] [Google Scholar]
- Rosenthal R., McGranahan N., Herrero J., Taylor B.S., Swanton C. DeconstructSigs: delineating mutational processes in single tumors distinguishes DNA repair deficiencies and patterns of carcinoma evolution. Genome Biol. 2016;17:31. doi: 10.1186/s13059-016-0893-4. [DOI] [PMC free article] [PubMed] [Google Scholar]
- Rosenthal R., Cadieux E.L., Salgado R., Bakir M.A., Moore D.A., Hiley C.T., Lund T., Tanić M., Reading J.L., Joshi K., TRACERx consortium Neoantigen-directed immune escape in lung cancer evolution. Nature. 2019;567:479–485. doi: 10.1038/s41586-019-1032-7. [DOI] [PMC free article] [PubMed] [Google Scholar]
- Sade-Feldman M., Yizhak K., Bjorgaard S.L., Ray J.P., de Boer C.G., Jenkins R.W., Lieb D.J., Chen J.H., Frederick D.T., Barzily-Rokni M. Defining T Cell States Associated with Response to Checkpoint Immunotherapy in Melanoma. Cell. 2018;175:998–1013.e20. doi: 10.1016/j.cell.2018.10.038. [DOI] [PMC free article] [PubMed] [Google Scholar]
- Sahin U., Türeci Ö. Personalized vaccines for cancer immunotherapy. Science. 2018;359:1355–1360. doi: 10.1126/science.aar7112. [DOI] [PubMed] [Google Scholar]
- Samstein R.M., Lee C.-H., Shoushtari A.N., Hellmann M.D., Shen R., Janjigian Y.Y., Barron D.A., Zehir A., Jordan E.J., Omuro A. Tumor mutational load predicts survival after immunotherapy across multiple cancer types. Nat. Genet. 2019;51:202–206. doi: 10.1038/s41588-018-0312-8. [DOI] [PMC free article] [PubMed] [Google Scholar]
- Schindelin J., Arganda-Carreras I., Frise E., Kaynig V., Longair M., Pietzsch T., Preibisch S., Rueden C., Saalfeld S., Schmid B. Fiji: an open-source platform for biological-image analysis. Nat. Methods. 2012;9:676–682. doi: 10.1038/nmeth.2019. [DOI] [PMC free article] [PubMed] [Google Scholar]
- Sharma P., Hu-Lieskovan S., Wargo J.A., Ribas A. Primary, Adaptive, and Acquired Resistance to Cancer Immunotherapy. Cell. 2017;168:707–723. doi: 10.1016/j.cell.2017.01.017. [DOI] [PMC free article] [PubMed] [Google Scholar]
- Shi T., Song E., Nie S., Rodland K.D., Liu T., Qian W.J., Smith R.D. Advances in targeted proteomics and applications to biomedical research. Proteomics. 2016;16:2160–2182. doi: 10.1002/pmic.201500449. [DOI] [PMC free article] [PubMed] [Google Scholar]
- Shi W., Ng C.K.Y., Lim R.S., Jiang T., Kumar S., Li X., Wali V.B., Piscuoglio S., Gerstein M.B., Chagpar A.B. Reliability of Whole-Exome Sequencing for Assessing Intratumor Genetic Heterogeneity. Cell Rep. 2018;25:1446–1457. doi: 10.1016/j.celrep.2018.10.046. [DOI] [PMC free article] [PubMed] [Google Scholar]
- Snyder A., Makarov V., Merghoub T., Yuan J., Zaretsky J.M., Desrichard A., Walsh L.A., Postow M.A., Wong P., Ho T.S. Genetic basis for clinical response to CTLA-4 blockade in melanoma. N. Engl. J. Med. 2014;371:2189–2199. doi: 10.1056/NEJMoa1406498. [DOI] [PMC free article] [PubMed] [Google Scholar]
- Spranger S. Tumor Heterogeneity and Tumor Immunity: A Chicken-and-Egg Problem. Trends Immunol. 2016;37:349–351. doi: 10.1016/j.it.2016.04.008. [DOI] [PubMed] [Google Scholar]
- Spranger S., Luke J.J., Bao R., Zha Y., Hernandez K.M., Li Y., Gajewski A.P., Andrade J., Gajewski T.F. Density of immunogenic antigens does not explain the presence or absence of the T-cell-inflamed tumor microenvironment in melanoma. Proc. Natl. Acad. Sci. USA. 2016;113:E7759–E7768. doi: 10.1073/pnas.1609376113. [DOI] [PMC free article] [PubMed] [Google Scholar]
- Strønen E., Toebes M., Kelderman S., van Buuren M.M., Yang W., van Rooij N., Donia M., Böschen M.L., Lund-Johansen F., Olweus J., Schumacher T.N. Targeting of cancer neoantigens with donor-derived T cell receptor repertoires. Science. 2016;352:1337–1341. doi: 10.1126/science.aaf2288. [DOI] [PubMed] [Google Scholar]
- Talevich E., Shain A.H., Botton T., Bastian B.C. CNVkit: Genome-Wide Copy Number Detection and Visualization from Targeted DNA Sequencing. PLoS Comput. Biol. 2016;12:e1004873. doi: 10.1371/journal.pcbi.1004873. [DOI] [PMC free article] [PubMed] [Google Scholar]
- Tanaka A., Sakaguchi S. Regulatory T cells in cancer immunotherapy. Cell Res. 2017;27:109–118. doi: 10.1038/cr.2016.151. [DOI] [PMC free article] [PubMed] [Google Scholar]
- Therneau T.M., Grambsch P.M. Springer-Verlag; New York: 2000. Modeling Survival Data: Extending the Cox Model. [Google Scholar]
- Tran E., Turcotte S., Gros A., Robbins P.F., Lu Y.-C., Dudley M.E., Wunderlich J.R., Somerville R.P., Hogan K., Hinrichs C.S. Cancer immunotherapy based on mutation-specific CD4+ T cells in a patient with epithelial cancer. Science. 2014;344:641–645. doi: 10.1126/science.1251102. [DOI] [PMC free article] [PubMed] [Google Scholar]
- Van Allen E.M., Miao D., Schilling B., Shukla S.A., Blank C., Zimmer L., Sucker A., Hillen U., Foppen M.H.G., Goldinger S.M. Genomic correlates of response to CTLA-4 blockade in metastatic melanoma. Science. 2015;350:207–211. doi: 10.1126/science.aad0095. [DOI] [PMC free article] [PubMed] [Google Scholar]
- Veatch J.R., Lee S.M., Fitzgibbon M., Chow I.T., Jesernig B., Schmitt T., Kong Y.Y., Kargl J., Houghton A.M., Thompson J.A. Tumor-infiltrating BRAFV600E-specific CD4+ T cells correlated with complete clinical response in melanoma. J. Clin. Invest. 2018;128:1563–1568. doi: 10.1172/JCI98689. [DOI] [PMC free article] [PubMed] [Google Scholar]
- Viros A., Sanchez-Laorden B., Pedersen M., Furney S.J., Rae J., Hogan K., Ejiama S., Girotti M.R., Cook M., Dhomen N., Marais R. Ultraviolet radiation accelerates BRAF-driven melanomagenesis by targeting TP53. Nature. 2014;511:478–482. doi: 10.1038/nature13298. [DOI] [PMC free article] [PubMed] [Google Scholar]
- Wang J., Perry C.J., Meeth K., Thakral D., Damsky W., Micevic G., Kaech S., Blenman K., Bosenberg M. UV-induced somatic mutations elicit a functional T cell response in the YUMMER1.7 mouse melanoma model. Pigment Cell Melanoma Res. 2017;30:428–435. doi: 10.1111/pcmr.12591. [DOI] [PMC free article] [PubMed] [Google Scholar]
- Williams M.J., Werner B., Barnes C.P., Graham T.A., Sottoriva A. Identification of neutral tumor evolution across cancer types. Nat. Genet. 2016;48:238–244. doi: 10.1038/ng.3489. [DOI] [PMC free article] [PubMed] [Google Scholar]
- Wolf Y., Samuels Y. Cancer research in the era of immunogenomics. ESMO Open. 2018;3:e000475. doi: 10.1136/esmoopen-2018-000475. [DOI] [PMC free article] [PubMed] [Google Scholar]
- Wolf Y., Shemer A., Levy-Efrati L., Gross M., Kim J.S., Engel A., David E., Chappell-Maor L., Grozovski J., Rotkopf R. Microglial MHC class II is dispensable for experimental autoimmune encephalomyelitis and cuprizone-induced demyelination. Eur. J. Immunol. 2018;48:1308–1318. doi: 10.1002/eji.201847540. [DOI] [PubMed] [Google Scholar]
- Zanetti M. Tapping CD4 T cells for cancer immunotherapy: the choice of personalized genomics. J. Immunol. 2015;194:2049–2056. doi: 10.4049/jimmunol.1402669. [DOI] [PubMed] [Google Scholar]
Associated Data
This section collects any data citations, data availability statements, or supplementary materials included in this article.
Supplementary Materials
Data Availability Statement
The raw sequencing data has been made publicly deposited at https://www.ebi.ac.uk/ena. The study accession number is PRJEB25961 and the secondary accession is ERP107928. The custom codes and processed data used to generate the results of the manuscript (Mouse CD8+ T cell RNaseq data, Processed data and code used; Figures 1, 2, 3, and 7 and the peptydes ms spectra) are available in github (https://github.com/bioinf-dev/Wolf_et_al_Cell_2019)