

Abstract
In human electrophysiology research, the high gamma part of the power spectrum (~>60 Hz) is a relatively new area of investigation. Despite a low signal‐to‐noise ratio, evidence exists that it contains significant information about activity in local cortical networks. Here, using magnetoencephalography (MEG), we found high gamma activity when comparing data from an n‐back working memory task to resting data in a large sample of normal volunteers. Initial analysis of power spectra from 0‐back, 2‐back, and rest trials showed three frequency bands exhibiting task‐related differences: alpha, beta, and high gamma. Unlike alpha and beta, the high gamma spectrum was broad, without a peak at a single frequency. In addition, power in high gamma was highest for the 2‐back and lowest during rest, while the opposite pattern occurred in the other bands. Beamformer source localization of each of the three frequency bands revealed a distinct set of sources for high gamma. These included several regions of prefrontal cortex that exhibited greater power when both n‐back conditions were compared to rest. A subset of these regions had more power when the 2‐back was compared to 0‐back, which indicates a role in working memory performance. Our results show that high gamma will be important for understanding cortical processing during cognitive and other tasks. Furthermore, data from human intracortical recordings suggest that high gamma is the aggregate of spiking in local cortical networks, which implies that MEG could serve to bridge experimental modalities by noninvasively observing task‐related modulation of spiking rates.
Keywords: cognition, cortical synchronization, electrophysiology, healthy volunteers, magnetoencephalography, memory, rest, short term
1. INTRODUCTION
Cortical electrophysiological activity is well‐known to contain oscillations in several distinct frequency bands. The relative amplitude of these bands can be modulated during stages of sleep and alertness, as well as by sensorimotor and cognitive tasks (for a primer see Lopes da Silva, 2013). Due to its prominence in the raw electroencephalogram (EEG), the alpha rhythm (~8–12 Hz) was the first frequency band to be studied (Berger, 1929). In occipital cortex, alpha power is highest when a subject is at rest with eyes closed, and lowest when the eyes are open and the cortex is receiving visual stimulation (Klimesch, Sauseng, & Hanslmayr, 2007; Schurmann & Basar, 2001). This phenomenon of stimulation‐induced power reduction is often termed “desynchronization” because it is assumed to represent the disruption of synchronous oscillations in a large assembly of cortical neurons. Desynchronization associated with activation in a cortical region is commonly observed in a variety of brain regions and frequency bands (see Pfurtscheller & Lopes da Silva, 1999). In the beta band (~13–30 Hz), perhaps the best known example is the large desynchronization that occurs in sensorimotor cortex during voluntary movements (e.g., Gaetz, Macdonald, Cheyne, & Snead, 2010). Similar to alpha, beta desynchronization likely indicates increased cortical activity. In agreement with this notion, alpha and beta desynchronization have both been shown to correspond with increased functional magnetic resonance imaging (fMRI) blood‐oxygen‐level dependent (BOLD) signal in some cortical regions (Michels et al., 2010; Scheeringa, Koopmans, van Mourik, Jensen, & Norris, 2016).
However, not all cortical oscillations desynchronize during activation of a region. For instance, a synchronized burst of gamma activity (~40 Hz) occurs in auditory cortex after an auditory stimulus (Pantev et al., 1991). First seen in local field potential (LFP) recordings in animals (Gray, Konig, Engel, & Singer, 1989; Hughes, 1964), cortical gamma is relatively smaller in amplitude, and was discovered later than the lower frequency bands (Basar‐Eroglu, Struber, Schurmann, Stadler, & Basar, 1996; Bressler & Freeman, 1980). Gamma is easier to observe in magnetoencephalography (MEG) than EEG due to the lack of smearing and signal attenuation caused by volume conduction, and because there is less interference from superficial muscle activity at similar frequencies (Muthukumaraswamy, 2013). The availability of intracranial recordings in humans (electrocorticography [ECoG], or intracranial electroencephalography) has allowed observation of gamma at greater signal‐to‐noise ratios than possible with EEG and MEG. Some of this work has revealed activation at higher frequencies than normally considered to be part of the gamma range (~>60 Hz) (see Canolty et al., 2006; Crone, Sinai, & Korzeniewska, 2006). This high frequency activity is still being explicated, and as yet it has no set name; however, “high gamma band” is most often used. Observation of high gamma is becoming more common in EEG/MEG (e.g., Ball et al., 2008; Isabella, Ferrari, Jobst, Cheyne, & Cheyne, 2015; Long, Burke, & Kahana, 2014), and there is growing evidence that it represents a distinct new band with unique behavior and physiological origin compared to traditional gamma and other lower bands (Crone, Korzeniewska, & Franaszczuk, 2011; Uhlhaas, Pipa, Neuenschwander, Wibral, & Singer, 2011).
Here, we sought to determine if high gamma contributed to performance of an n‐back working memory task using MEG, and if so, how its response characteristics differed from traditional lower frequency bands. The data came from a large sample of normal controls collected as part of the NIMH Genetic Study of Schizophrenia (Egan et al., 2001). Our goal was to develop measures of working memory‐related modulation of cortical oscillations that could be used to determine both the source and physiological characteristics of known working memory deficits in patients (Lett, Voineskos, Kennedy, Levine, & Daskalakis, 2014). If, as suggested, high gamma has a distinct neurophysiological origin from the lower frequency bands, then discovering how it behaves during a cognitive task could lead to insight into how cognition is disrupted in disease, and provide possible new approaches for therapeutic treatment. High gamma has been seen before in cognitive experiments, including during memory tasks (for a review of intracranial findings see Lachaux, Axmacher, Mormann, Halgren, & Crone, 2012). For example, Long et al. (2014) found activation between 44 and 100 Hz during memory encoding using both intracranial and scalp EEG. In a study by Kucewicz et al. (2017), the authors employed intracranial EEG to record gamma activity (30–150 Hz) induced by delayed free‐recall memory tasks. Significantly, they found two kinds of gamma activity, one a narrow band oscillatory response, and the other a broadband signal similar to what we will show here. In MEG, high gamma is best known to occur in motor regions (see Cheyne & Ferrari, 2013). With working memory tasks, including variations on the n‐back, researchers have found traditional gamma in a variety of cortical areas (see Brookes et al., 2011; Deuker et al., 2009; Huang et al., 2018; Takei et al., 2016; Urbain, Pang, & Taylor, 2015). Such studies have often included higher frequencies in their gamma band, up to 80 Hz, but have not explicitly sought to investigate high gamma as a separate band from traditional gamma.
Obtaining a complete characterization of task‐related changes in electrophysiological activity is relatively difficult. This is partly due to coincident modulation of multiple frequency bands that can vary greatly in form and composition by location and experimental context. With the n‐back, our effort is further complicated by the continuous nature of the task, in which different components, such as stimulus, maintenance, and response, are not well separated in time. For this initial investigation, we reduced the complexity of our endeavor by analyzing the n‐back trials as a whole, and by limiting our analyses to two conditions: one with a memory component and the other without. In addition, we used a separate resting recording as a baseline in order to understand how the n‐back task modified ongoing oscillatory activity. We began by comparing mean power spectra of MEG sensor data from the two tasks (n‐back and rest), which allowed us to determine frequency bands of interest for source localization using beamformers. This revealed three main frequency bands that were modulated by the tasks: alpha, beta, and high gamma. The high gamma band was distinct from the other bands in both the form and location of task‐dependent signal change. The high gamma spectra did not peak at a specific frequency, and showed power differences over a wide frequency range (~40–150 Hz), whereas alpha and beta had narrow peaks at 10 and 20 Hz, respectively. Moreover, high gamma increased in power in response to the n‐back conditions, while alpha and beta desynchronized. Source localization using beamformers revealed a differential set of sources for high gamma, suggesting a distinct functional role for the band. Significantly, high gamma was especially active in prefrontal cortex, a critical part of the working memory network (Goldman‐Rakic, 1996) that is often associated with functional deficits in patient populations (Arnsten, 2009; Egan et al., 2001; Rajkowska, Halaris, & Selemon, 2001).
2. METHODS
2.1. Participants
A large number of normal controls completed the MEG experiment as part of the NIMH Genetic Study of Schizophrenia. Participants were kept for further analysis if they performed better than 50% correct on the 2‐back condition (n = 191, 113 female, 14 left‐handed). The mean age was 29.7 (SD 9.0).
2.2. Tasks
For each participant, a 4 min resting eyes‐closed recording was collected as the first in a battery of tasks. Participants also performed an n‐back working memory task in a block design, including six trials each of 0‐, 1‐, and 2‐back. Digits from one to four were displayed in fixed positions on a diamond pattern, with each location corresponding to a button on a response pad (see Figure 1). Eleven stimuli were displayed in each block, with an interstimulus interval of 1.8 s. Participants responded with the appropriate button press to the number seen zero, one, or two stimuli before. In the 1‐back blocks the participants waited until after the second stimulus to make the first response, and in the 2‐back, they waited until after the third stimulus. Thus, for the 2‐back, there were a total of nine button presses in each block.
Figure 1.
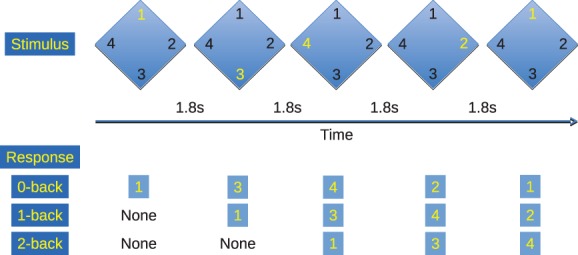
The n‐back working memory task. Numbers from one to four were presented in a diamond pattern in pseudorandom order with an interstimulus interval of 1.8 s. Participants responded on a four‐button response pad with button locations corresponding to the position of the number on the screen. Eleven stimuli were presented in each trial, and six sets of 0‐, 1‐, and 2‐back trials were presented in order [Color figure can be viewed at https://wileyonlinelibrary.com]
2.3. Data acquisition
MEG signals were recorded in a magnetically shielded room using a 275 channel whole‐head system (CTF). Data were digitized at 600 Hz after application of a 150 Hz low‐pass anti‐aliasing filter. Environmental noise was removed by synthetic third gradient balancing using a set of reference sensors (Vrba & Robinson, 2001). Head positions were digitized at the beginning and end of each task using three reference coils at the nasion and bilateral preauricular points. A structural MRI was obtained for each participant using a 3T MRI (General Electric, Milwaukee, WI).
2.4. Preprocessing
All data sets were high‐pass filtered at 0.6 Hz, and 3 Hz notch filters were applied at the power line frequency of 60 Hz and its higher harmonics. Subjects were excluded from further analysis if their data had excessive artifacts or their head movement during either task was greater than 0.5 cm. The three head coil locations were marked on each subject's MRI in order to align the MEG and MRI into a common coordinate space. The MRIs were transformed into Talairach space using AFNI's @auto_tlrc function (Cox, 1996).
2.5. Spectral analysis
In order to determine task‐related frequency bands for source analysis, mean power spectra for all MEG channels were calculated separately for the rest, 0‐back, and 2‐back conditions. For the n‐back blocks, data were taken from 5 to 21 s from trial onset, which eliminated the first two stimuli from each trial. This was done in order to equalize the number of possible responses in the two conditions because the first two stimuli required no response in the 2‐back condition. The rest condition was divided into six dummy trials in order to simulate the block design of the n‐back task. The dummy trials began at 5, 45, 85, 125, 165, and 205 s in each rest data set, and data were taken from 5 to 21 s in each trial. Preliminary analysis revealed artifacts to be present in the n‐back conditions at frequencies below 5 Hz, and therefore further analyses were restricted to frequencies above this range.
2.6. Source localization
Synthetic aperture magnetometry (SAM) was used to estimate the sources of neuromagnetic activation at frequency bands observed in the power spectra (Robinson & Vrba, 1999; Sekihara, Nagarajan, Poeppel, Marantz, & Miyashita, 2001). SAM, an adaptive beamforming technique, can be used to quantify the relative strength of neural oscillations during different experimental conditions. The procedure estimates source power at specified locations in the brain by creating an optimal spatial filter from MEG channel covariance. The data are first band‐pass filtered at a specified frequency band and then the covariance between MEG channels is calculated for time segments of experimental interest. Here, the time segments were the same as for the spectral analysis, 5–21 s in each block, and frequency bands were selected from the power spectra if they exhibited power differences between the conditions. We calculated separate estimates of signal strength for each condition (2‐back, 0‐back, and rest), and at each frequency band. The estimates of source power were calculated at 5 mm cubic voxels throughout the brain volume. Each voxel was normalized by a noise estimate based on the lowest eigenvalue from the signal covariance (see Brookes et al., 2008; Vrba & Robinson, 2001). The resulting brain volumes were converted into Z‐scores and transformed into Talairach space using AFNI software.
Statistical comparisons of the three conditions were conducted separately for each frequency band. The AFNI function 3dANOVA2 was used to perform 3 X 191 mixed effects ANOVAs (with condition as the fixed factor, and subject as the random factor). The resulting main effects of condition, as well as post hoc t tests between pairs of conditions, were thresholded at p < .001 (F(2, 188) = 6.99, t(190) = 3.33), which in all cases corresponded to an FDR q value of less than 0.05. The AFNI function 3dExtrema was used to determine the locations of peak positive and negative differences for the post hoc paired t tests. If extrema were within 3 cm of each other, the lowest amplitude point(s) was eliminated. Extrema not within 7.5 mm of a cortical Brodmann area (BA) were not reported. Effect sizes were calculated for the extrema points using Cohen's d. All cortical regions and/or BAs cited in the results are derived from AFNI's whereami function using a Talairach atlas. On occasion, the reported nearest BA does not correspond anatomically to the name of the closest brain region (e.g., gyrus/lobe) due to differences in the underlying AFNI region of interest maps.
3. RESULTS
3.1. Behavior
For all subjects, the mean percent correct for the 0‐back condition was 99.17 (SD 1.90), and 89.61 (SD 11.74) for the 2‐back. The mean reaction time in milliseconds was 502 (SD 83) for the 0‐back, and 358 (SD 182) for the 2‐back.
3.2. Spectral analysis
In order to find frequency bands that were modulated by task, we averaged the power spectra from 0‐back, 2‐back, and rest blocks across subjects (Figure 2a). Well‐defined peaks appear in the spectra at 10 Hz (alpha) and 20 Hz (beta) in all three conditions. In both bands, the rest condition has the greatest power and the 2‐back has the least. The opposite pattern occurs over a broad range of high gamma band (>40 Hz), with the 2‐back displaying greater power than the 0‐back, and the 0‐back showing greater power than rest (Figure 2b shows just the high gamma part of the spectra). The power differences in high gamma are relatively small compared to alpha and beta. In addition, the high gamma band is morphologically different than the other bands; it lacks a clear peak at a specific frequency and extends over a broad range from 40 Hz to near the edge of our acquisition filter at 150 Hz.
Figure 2.
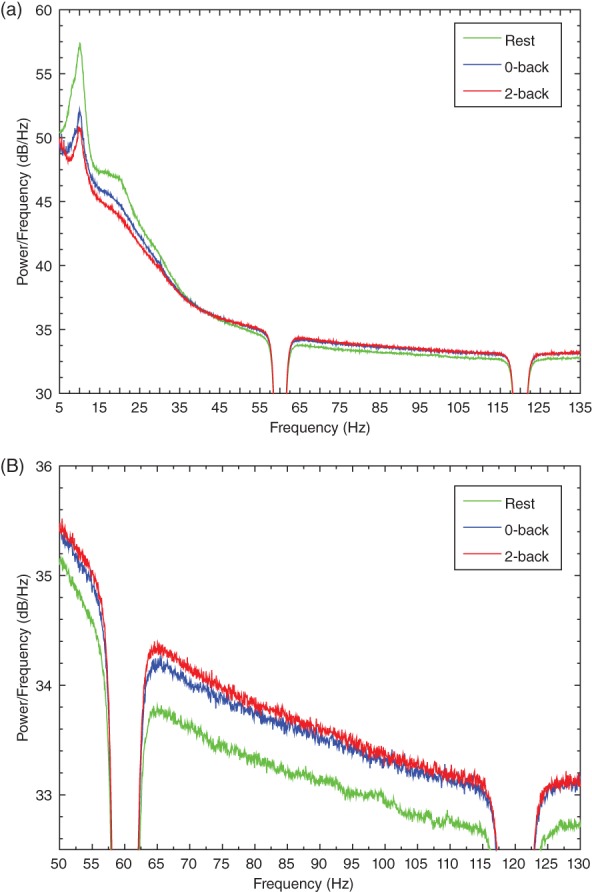
Mean power spectra from the 0‐back, 2‐back, and rest conditions. Power spectral density estimates were calculated for all MEG channels in each condition, and averaged across subjects. (a) Power is plotted for frequencies between 5 and 135 Hz. (b) The same results are shown for frequencies between 50 and 130 Hz in order to better observe the high gamma part of the spectra
3.3. Source localization
The power spectra were used to determine frequency bands of interest for beamformer source analysis of task‐related power modulations in alpha, beta, and high gamma. For alpha, we employed 8–12 Hz, and for beta, 15–25 Hz. Although the high gamma band extended further in both directions, we limited our analysis to 65–115 Hz in order to avoid the power line filters. The results for the alpha, beta, and high gamma bands are shown in Figure 3.
Figure 3.
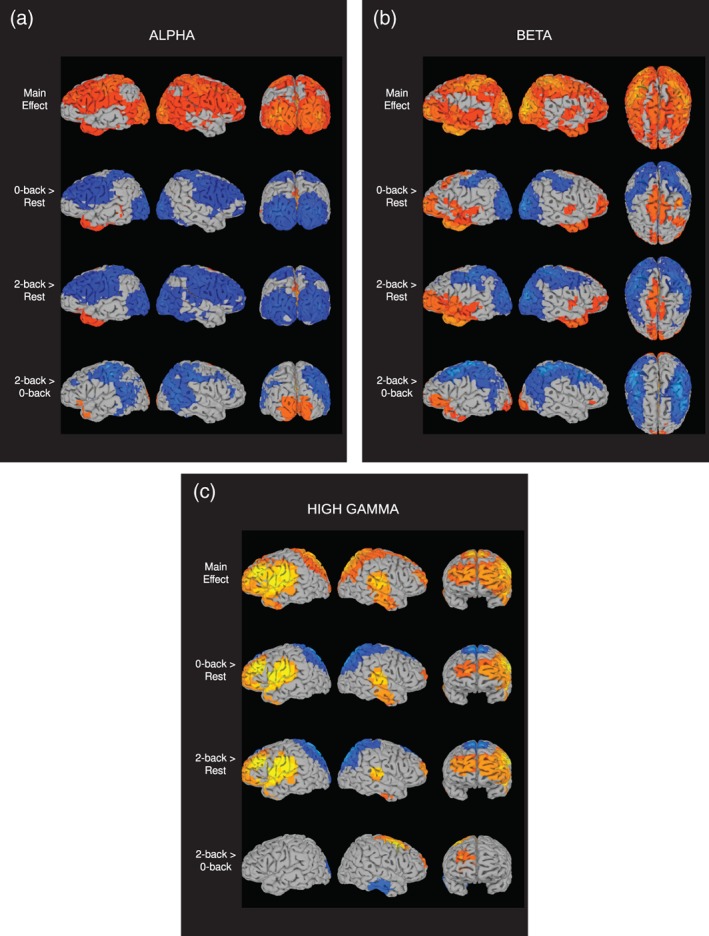
anova of beamformer source analysis for 0‐back, 2‐back, and rest conditions, conducted separately for (a) alpha, (b) beta, and (c) high gamma. SUMA (Saad & Reynolds, 2012) was used to display main effects and post hoc t tests, all thresholded at p < .001, q < .05. The first row is the main effect, presented in a red to yellow color scale, with the highest intensity in yellow. The next three rows are the post hoc tests of each pair of conditions, with red/yellow indicating positive mean power differences, and blue/light‐blue indicating negative differences
The main effects for alpha extend over a large portion of the cerebral cortex, with particular concentrations in occipital and frontal areas (Figure 3a, top row). Post hoc t tests between each pair of conditions reveal that power reduction (or desynchronization) is the primary source of the main effects (Figure 3a, bottom three rows). The contrasts of each n‐back condition to rest exhibit broad desynchronizations over similar areas as the main effect, while the contrast of 2‐back to 0‐back displays desynchronization over a smaller subset of regions, including the parietal–temporal–occipital junction and sensorimotor areas. The post hoc tests also show some locations with positive power differences (synchronizations), including posterior cingulate. Due to the widespread activation patterns seen in these tests, we sought to better delineate the areas of activation by determining local amplitude peaks in each contrast; the results are presented in Table 1. Just as in the figure, most of the alpha peaks are negative, indicating desynchronization. There is, however, a positive peak in posterior cingulate in all three contrasts, and an additional positive peak in lingual gyrus for 2‐back versus 0‐back. All three tests have negative peaks in sensorimotor cortex, and regions of temporal lobe in or near fusiform gyrus (BA 37/20). In just the n‐back comparisons to rest, negative peaks occur in occipital cortices, as well as prefrontal cortex (BA 9/10). A left insula peak is unique to 2‐back versus rest, and a peak in right angular gyrus appears only in 2‐back versus 0‐back. The effect sizes for the contrast extrema points are mostly in the medium to large range, from a low of .396 to a high of 1.537 (Table 1).
Table 1.
Alpha band extrema points for the post hoc contrasts
| 0vR | Amp | ES (d) | LPI | Regiona | BAb |
| 0.948 | 1.380 | 12, −62, 18 | R Post. Cing. | R 31 30 18 | |
| −0.206 | −.468 | 18, 48, −2 | R Medial FG | R 10 32 11 | |
| −0.227 | −.552 | 42, −38, −12 | R Fusiform | R 20 37 36 | |
| −0.261 | −.477 | −48, −22, 48 | L Postcent. G | L 2 3 1 40 4 | |
| −0.32 | −.818 | −28, 22, 28 | L Middle FG | L 9 | |
| −0.329 | −.878 | 22, 38, 28 | R Sup. FG | R 9 32 10 | |
| −0.516 | −.891 | 22, −88, 2 | R Lingual G | R 17 18 19 | |
| −0.54 | −.895 | −22, −88, 8 | L Middle OG | L 19 18 17 | |
| 2vR | Amp | ES (d) | LPI | Region | BA |
| 1.077 | 1.537 | −2, −62, 18 | L Post. Cing. | L 23 31 | |
| −0.194 | −.448 | −42, −42, −12 | L Fusiform | L 37 20 36 | |
| −0.245 | −.599 | −42, 2, 12 | L Insula | L 13 44 | |
| −0.3 | −.692 | 42, −38, −12 | R Fusiform | R 20 37 36 | |
| −0.337 | −.826 | 22, 42, 28 | R Sup. FG | R 10 9 | |
| −0.375 | −.806 | 38, −32, 58 | R Postcent. G | R 40 3 4 2 1 | |
| −0.376 | −.910 | −28, 28, 28 | L Middle FG | L 9 | |
| −0.397 | −.735 | −48, −22, 48 | L Postcent. G | L 2 3 1 40 4 | |
| −0.513 | −.811 | −28, −82, 2 | L Middle OG | L 18 19 | |
| 2v0 | Amp | ES (d) | LPI | Region | BA |
| 0.261 | .707 | 2, −42, 22 | R Post. Cing. | R 29 23 30 | |
| 0.102 | .396 | −8, −92, −2 | L Lingual G | L 17 18 | |
| −0.174 | −.583 | −52, −28, 38 | L Postcent. G | L 2 40 1 3 | |
| −0.178 | −.588 | 48, −52, −2 | R Middle TG | R 37 19 20 | |
| −0.199 | −.610 | 38, −68, 28 | R Middle TG | R 39 19 |
BA = Brodmann area.
T = temporal; F = frontal; O = occipital; P = parietal; G = gyrus; L = lobule.
BAs within 7.5 mm ordered by distance; L/R = left/right.
The spatial pattern of the beta main effect (Figure 3b) is broadly similar to alpha, with concentrations in occipital lobe and sensorimotor cortex. Differing from alpha, there is more activation in anterior prefrontal cortex and parietal lobe. The post hoc tests show that, like alpha, desynchronization is the dominant direction of signal change; however, there are more locations displaying synchronization. The local peaks of activation in the post hoc tests are shown in Table 2. Desynchronizations appear in parietal lobe in all three tests (BA 7/40). In both n‐back contrasts with rest, desynchronizations occur in occipital lobe, as well as frontal and parietal areas surrounding sensorimotor cortex. There are fewer prefrontal desynchronizations than alpha in the comparisons to rest (one peak as opposed to four); however, in the 2‐back versus 0‐back test, beta desynchronization extends further into frontal and prefrontal cortex (BA 6/8/9). Synchronizations also appear in all three post hoc tests, including posterior cingulate and prefrontal cortex (BA 10/46) in the n‐back versus rest contrasts, and lingual gyrus for 2‐back versus 0‐back. Similar to alpha, the effect sizes for the contrast peaks are in a medium to large range from −.410 to 1.293.
Table 2.
Beta band extrema points for the post hoc contrasts
| 0vR | Amp | ES (d) | LPI | Region | BA |
| 0.348 | .976 | 8, −48, 18 | R Post. Cing. | R 29 30 23 31 | |
| 0.190 | .583 | −38, 52, 8 | L Middle FG | L 10 46 | |
| −0.170 | −.635 | −2, 22, 32 | L Cingulate | L 32 24, R 32 | |
| −0.192 | −.617 | 48, −22, 42 | R Postcent. G | R 2 3 4 40 1 | |
| −0.239 | −.678 | 22, −52, 58 | R SPL | R 7 | |
| −0.251 | −.712 | −18, −52, 58 | L Precuneus | L 7 | |
| −0.257 | −.689 | −48, −28, 48 | L Postcent. G | L 2 40 1 | |
| −0.400 | −.884 | 22, −82, 2 | R Lingual G | R 17 18 19 | |
| −0.424 | −.886 | −22, −82, 2 | L Lingual G | L 17 18 19 | |
| 2vR | Amp | ES (d) | LPI | Region | BA |
| 0.475 | 1.293 | 2, −42, 18 | R Post. Cing. | R 29 30, L 29 30 | |
| 0.203 | .613 | −38, 52, 8 | L Middle FG | L 10 46 | |
| 0.138 | .418 | −52, 2, 2 | L STG | L 22 44 13 6 | |
| −0.170 | −.489 | −22, 28, 32 | L Middle FG | L 9 6 32 | |
| −0.182 | −.526 | 38, −2, 48 | R Middle FG | R 6 | |
| −0.295 | −.741 | −22, −52, 58 | L SPL | L 7 | |
| −0.333 | −.870 | −48, −28, 48 | L Postcent. G | L 2 40 1 | |
| −0.348 | −.910 | 38, −38, 52 | R IPL | R 40 3 2 5 | |
| −0.398 | −.823 | −28, −78, 8 | L Middle OG | L 18 19 30 | |
| −0.412 | −.977 | 32, −72, 18 | R Middle OG | R 19 31 | |
| 2v0 | Amp | ES (d) | LPI | Region | BA |
| 0.097 | .555 | −8, −88, −2 | L Lingual G | L 17 18 | |
| −0.085 | −.410 | 42, −48, −2 | R Middle TG | R 37 19 | |
| −0.088 | −.441 | −42, −48, −2 | L Parahipp. G | L 37 19 | |
| −0.146 | −.677 | −38, −48, 48 | L IPL | L 40 7 | |
| −0.150 | −.647 | 32, −18, 58 | R Precent. G | R 6 4 | |
| −0.176 | −.820 | −38, 8, 42 | L Middle FG | L 6 9 8 | |
| −0.201 | −.823 | 38, −48, 42 | R IPL | R 40 7 |
BA = Brodmann area; STG = superior temporal gyrus.
The high gamma activation pattern is largely distinct from the two lower bands (Figure 3c). In the main effect, occipital lobe and sensorimotor cortex activations are relatively diminished, and frontal/prefrontal cortices are more prominent. Also, regions in and around superior temporal cortex become more active. Unlike the other bands, the post hoc tests are dominated by positive differences (Table 3 shows the list of peaks). When compared to rest, the 0‐ and 2‐back conditions exhibit greater power in bilateral prefrontal cortices, especially on the left side, with a peak amplitude difference in left dorsolateral prefrontal cortex (DLPFC [BA 9]). Also in both comparisons to rest, positive peaks occur bilaterally at the intersection of superior temporal gyrus (STG) with frontal and parietal cortices. A negative peak appears in right parahippocampal gyrus in each of these contrasts as well. For the 2‐back versus 0‐back test, positive power differences occur in right premotor cortex (BA 6) and a region centered on right frontal pole (BA 10) that borders DLPFC (BA 9) and anterior cingulate (BA 32). Additionally, a negative peak is found in left lingual gyrus. The effect sizes for the contrast peaks are generally lower than for the preceding two bands, in a small to medium range from .279 to −.649.
Table 3.
High gamma extrema points for the post hoc contrasts
| 0vR | Amp | ES (d) | LPI | Region | BA |
| 0.314 | .453 | −42, 28, 28 | L Middle FG | L 9 46 45 | |
| 0.29 | .279 | −52, 2, 8 | L Precent. G | L 22 6 44 13 | |
| 0.231 | .316 | 58, −22, 12 | R STG | R 41 42 40 43 22 | |
| −0.179 | −.569 | 8, −38, 8 | R Parahipp. G | R 30 27 29 | |
| −0.268 | −.649 | 2, −72, 48 | R Precuneus | R 7, L 7 | |
| 2vR | Amp | ES (d) | LPI | Region | BA |
| 0.304 | .460 | −38, 28, 28 | L Middle FG | L 9 | |
| 0.297 | .339 | −58, −22, 18 | L Postcent. G | L 40 41 42 43 | |
| 0.225 | .309 | 58, −28, 12 | R STG | R 41 42 40 | |
| −0.178 | −.536 | 8, −38, 8 | R Parahipp. G | R 30 27 29 | |
| 2v0 | Amp | ES (d) | LPI | Region | BA |
| 0.091 | .457 | 28, 2, 42 | R Middle FG | R 6 | |
| 0.044 | .373 | 18, 48, 12 | R Medial FG | R 10 32 9 | |
| −0.045 | −.302 | −18, −78, 2 | L Lingual G | L 18 17 |
BA = Brodmann area; STG = superior temporal gyrus.
4. DISCUSSION
Our goal was to characterize the multifrequency band response to an n‐back working memory task as compared to rest. To do so, we analyzed power spectra from whole‐head MEG to determine frequency bands of interest, which revealed high gamma activation with unique behavior relative to alpha and beta bands. Alpha and beta both had clear peaks at 10 and 20 Hz, respectively, whereas the gamma band had no peak frequency and was extended over a broad range at 40 Hz and above. In addition, as task difficulty increased from rest to 0‐back to 2‐back, power reduced in the lower two bands, while power increased in the high gamma band. Source localization of the three bands showed a similar differentiation in the dominant direction of signal change. When contrasting tasks of greater to lesser difficulty, both the lower bands displayed widespread cortical power reduction (desynchronization), and the high gamma band was dominated by positive power differences (although there were power changes in the opposite direction in all bands). Major differences appeared in the regions of activation as well. In both contrasts of the n‐back conditions to rest, the lower two bands showed occipital lobe and sensorimotor cortex desynchronization, whereas relatively little activation occurred in these areas in high gamma. Alpha and beta desynchronizations were not unexpected in these locations, given that they are commonly associated with the visual stimulation and finger movements that are part of the n‐back task; additionally, occipital alpha is known to be strongest when eyes are closed as in our rest condition (see Pfurtscheller & Lopes da Silva, 1999). Regions stronger in the high gamma band included bilateral STG and surrounding areas of frontal, parietal, and temporal cortex, which had greater power when each n‐back condition was compared to rest. Compared to alpha and beta, there is a noticeable lack of sensorimotor cortex activation in high gamma, even in the contrasts with rest where there are movements in only one condition. There is, however, a positive peak in right premotor cortex (BA 6) in the comparison of 2‐back to 0‐back. This contrast was designed to have an equal number of movements in each condition, which suggests that this premotor activity is not strictly movement induced, but is instead related to higher level differences between the tasks. Interestingly, Gaetz, Liu, Zhu, Bloy, and Roberts (2013) found premotor cortical activity in the high gamma range (60–90 Hz) during a response interference task. Similar to here, high gamma was greater in the more difficult interference condition than the control condition, suggesting that premotor high gamma can differentiate between task demands.
Prefrontal activity was of particular interest given its putative role in executive functioning during working memory performance (Cohen et al., 1997; Lara & Wallis, 2015). In our analysis, we found task‐related prefrontal activation in each of the investigated frequency bands. Alpha and beta frontal activity has been seen before during working memory tasks, including the n‐back (e.g., Altamura et al., 2010; Brookes et al., 2011; Ciesielski, Ahlfors, Bedrick, Kerwin, & Hämäläinen, 2010; Heinrichs‐Graham & Wilson, 2015; Ionescu et al., 2015; Salvadore et al., 2010). Interestingly, here prefrontal extrema points in these bands mostly appeared in the n‐back contrasts with rest, and not in 2‐ versus 0‐back (Tables 1 and 2), the one exception being a peak in beta closest to left frontal BA 6, but near BA 9 and 8. This suggests that prefrontal alpha and beta were more associated with the general cognitive demands of the task irrespective of whether there was a memory component, at least in our whole‐trial analysis that did not isolate different aspects of the task. High gamma also had prefrontal peaks in both n‐back contrasts to rest, in left DLPFC (BA 9; Table 3), but in addition a prominent peak appears in the 2‐ versus 0‐back test in the right frontal pole (BA 10), at the border of DLPFC (BA 9), and anterior cingulate (BA 32). The DLPFC and the frontal pole are both known from neuroimaging studies to be involved in working memory tasks, including the n‐back (Callicott et al., 1999; Owen, McMillan, Laird, & Bullmore, 2005; Wager & Smith, 2003). Although the extrema points in the n‐back contrasts with rest were in left DLPFC, the prefrontal activation pattern in Figure 3c extends bilaterally and includes frontal pole. Interestingly, the figure also shows that when the 2‐back was directly compared to the 0‐back, the prefrontal activation was mostly limited to right frontal pole. Given that the only difference between the 2‐back and 0‐back is the memory component, this finding is potentially significant for our understanding of working memory function in the cortex. However, the frontal pole's exact role in this and other cognitive tasks is not well understood (Ramnani & Owen, 2004). Prefrontal high gamma has been seen before during memory tasks, especially in intracranial recordings (for a review see Lachaux et al., 2012). For example, it was observed during goal maintenance by Voytek et al. (2015) using ECoG. Polania, Paulus, and Nitsche (2012) found prefrontal high gamma in humans using a noninvasive recording technique (EEG). They were able to use a measure of the prefrontal high gamma activation to decode the contents of visual working memory during encoding and maintenance.
As we and others have shown, high gamma is observable with EEG/MEG (e.g., Cheyne, Bells, Ferrari, Gaetz, & Bostan, 2008; Darvas et al., 2010; Polania et al., 2012); however, due to a low signal‐to‐noise ratio, the best evidence has come from animal research, or more recently, intracranial recordings in humans (see Buzsaki & Silva, 2012; Crone et al., 2011; Uhlhaas et al., 2011). The accumulated evidence from this research points to high gamma having a unique behavioral profile and possibly a distinct neurophysiological origin compared to the lower frequency bands. In our results, this distinction is partly suggested by the differential distribution of cortical sources compared to alpha and beta, and the predominance of power increase in response to greater task difficulty (as opposed to desynchronization). However, the most obvious qualitative difference between the bands is in the power spectra. Alpha and beta display characteristics typical of oscillatory bands, with narrow bandwidths that peak at single frequencies. In contrast, the high gamma spectrum is broadband and flat, with no peak frequency. Flat and broad high gamma spectra have been seen before in intracranial recordings (Manning, Jacobs, Fried, & Kahana, 2009; Miller, Zanos, Fetz, den Nijs, & Ojemann, 2009). Our finding of a similar spectral profile to that seen intracranially suggests that we are observing the same activity with MEG. Researchers have hypothesized that these unique spectra are caused by dendritic integration of asynchronous spiking in local cortical networks (Burke, Ramayya, & Kahana, 2015; Miller, 2010) (but see Suffczynski, Crone, & Franaszczuk, 2014). If high gamma is indeed related to spiking in local networks, then its relative amplitude would be an indicator of population firing rate, as opposed to a measure of the strength of a network oscillation, which has been the traditional view for other frequency bands in electrophysiology (see again Burke et al., 2015; Miller, 2010). This would imply that the terms “synchronization” and “desynchronization,” often used to refer to relative power increase or decrease in a band, would not be appropriate for high gamma because the terms imply the existence of narrow‐band oscillations that synchronize or desynchronize across a region of cortex.
Evidence also exists that high gamma is part of an even broader band of activity that overlaps with the oscillatory bands at lower frequencies (see Miller et al., 2014). Manning et al. (2009) used depth electrodes in epilepsy patients to observe the correlation between LFP power and spiking rate. They found that broadband power changes from 2 to 150 Hz positively correlated with firing rate, while narrower bands could sometimes correlate negatively or positively depending on the location and band. Distinguishing the broadband from the overlapping oscillatory bands was easier with intracortical data because the oscillatory bands contributed less to the total signal than is typically seen in EEG/MEG. The observation that the broadband signal is relatively stronger in intracortical recordings supports the idea that it is more directly related to local network activation, and that the oscillatory bands involve synchronization across a wider region of cortex that generates a stronger signal outside the head (for supporting evidence from motor cortex see Crone, Miglioretti, Gordon, & Lesser, 1998; Miller et al., 2007). The possible correspondence of local network activation and the high gamma band in MEG suggests that the band will be important for determining the relationship between MEG activity and the hemodynamic response in fMRI. In fact, some researchers have already demonstrated a correspondence between high gamma activity and the BOLD signal using invasive recording techniques (Conner, Ellmore, Pieters, DiSano, & Tandon, 2011; Niessing et al., 2005; Schulz et al., 2004) (see also Burke et al., 2014; Uhlhaas et al., 2011).
More research is needed to determine the specific role of high gamma in cortical processing, but our results (among others) illustrate the importance of investigating the band. In addition to providing insight into normal cortical function, high gamma could prove critical for elucidating the neural basis of functional deficits in schizophrenia and other illnesses. Supporting this hypothesis, Uhlhaas and Singer (2013) cite evidence that abnormalities in high frequency oscillations occur in schizophrenia. For example, Grützner et al. (2013) found a reduction in power from 60 to 120 Hz during impaired visual processing in patients. Aberrant prefrontal function during the n‐back is known to occur in a variety of mental illnesses, including major depressive disorder (Bartova et al., 2015), bipolar disorder (Cremaschi et al., 2013), and schizophrenia (Callicott et al., 2000; Perlstein, Carter, Noll, & Cohen, 2001). Our finding of n‐back induced prefrontal high gamma suggests that studying the band could help uncover the origin of prefrontal dysfunction during the task. As our research is part of an ongoing investigation of schizophrenia, future analyses will focus on establishing the functional role of high gamma during the n‐back task and its significance for working memory performance within a clinical population.
Some limitations of our findings should be kept in mind for future investigations. First, the range of effect sizes for the high gamma extrema points (Table 3) are relatively smaller than for the other bands (Tables 1 and 2). The smaller high gamma effect sizes in some cortical regions imply that a relatively large sample size will be necessary to reliably produce significant effects in future studies. For example, the prefrontal peak in the 2‐back versus 0‐back contrast has an effect size of .373, which implies a sample size near 60 to achieve reasonable statistical power. Furthermore, we would emphasize that the results presented here are not an exhaustive survey of the brain regions and frequency bands involved the n‐back working memory task. Our intent was to localize the unique high gamma signal seen in the channel power spectra over entire n‐back trials compared to rest, and to compare and contrast its activation patterns to that of the other frequency bands exhibiting task related modulation. More in depth investigation of cortical function during the n‐back task will require analysis of transitory changes in cortical power relative to specific elements of the task, such as stimulus and response. Such analysis may uncover activation in regions and frequency bands that were modulated in a manner that produced no net effect over the entire trial, thus preventing observation with the whole‐trial analysis employed here. For high gamma, low power may make it difficult to conduct analysis at shorter timescales, but it would help elucidate its role in cortical function. If high gamma is indeed produced by spiking in local cortical networks, then MEG could be used to noninvasively observe real‐time variation in population firing rates during cognition.
ACKNOWLEDGMENTS
The authors would like to thank Stephen E. Robinson for methods development, and Judy C. Mitchell for assistance with data collection.
Carver FW, Rubinstein DY, Gerlich AH, Fradkin SI, Holroyd T, Coppola R. Prefrontal high gamma during a magnetoencephalographic working memory task. Hum Brain Mapp. 2019;40:1774–1785. 10.1002/hbm.24489
REFERENCES
- Altamura, M. , Goldberg, T. E. , Elvevag, B. , Holroyd, T. , Carver, F. W. , Weinberger, D. R. , & Coppola, R. (2010). Prefrontal cortex modulation during anticipation of working memory demands as revealed by magnetoencephalography. International Journal of Biomedical Imaging, 2010, 1–10. 10.1155/2010/840416 [DOI] [PMC free article] [PubMed] [Google Scholar]
- Arnsten, A. F. (2009). Stress signalling pathways that impair prefrontal cortex structure and function. Nature Reviews. Neuroscience, 10(6), 410–422. 10.1038/nrn2648 [DOI] [PMC free article] [PubMed] [Google Scholar]
- Ball, T. , Demandt, E. , Mutschler, I. , Neitzel, E. , Mehring, C. , Vogt, K. , … Schulze‐Bonhage, A. (2008). Movement related activity in the high gamma range of the human EEG. NeuroImage, 41(2), 302–310. 10.1016/j.neuroimage.2008.02.032 [DOI] [PubMed] [Google Scholar]
- Bartova, L. , Meyer, B. M. , Diers, K. , Rabl, U. , Scharinger, C. , Popovic, A. , … Pezawas, L. (2015). Reduced default mode network suppression during a working memory task in remitted major depression. Journal of Psychiatric Research, 64, 9–18. 10.1016/j.jpsychires.2015.02.025 [DOI] [PMC free article] [PubMed] [Google Scholar]
- Basar‐Eroglu, C. , Struber, D. , Schurmann, M. , Stadler, M. , & Basar, E. (1996). Gamma‐band responses in the brain: A short review of psychophysiological correlates and functional significance. International Journal of Psychophysiology, 24(1–2), 101–112. [DOI] [PubMed] [Google Scholar]
- Berger, H. (1929). Über das Elektrenkephalogramm des Menschen. Archiv für Psychiatrie und Nervenkrankheiten, 87, 527–570. [Google Scholar]
- Bressler, S. L. , & Freeman, W. J. (1980). Frequency analysis of olfactory system EEG in cat, rabbit, and rat. Electroencephalography and Clinical Neurophysiology, 50(1–2), 19–24. [DOI] [PubMed] [Google Scholar]
- Brookes, M. J. , Vrba, J. , Robinson, S. E. , Stevenson, C. M. , Peters, A. M. , Barnes, G. R. , … Morris, P. G. (2008). Optimising experimental design for MEG beamformer imaging. NeuroImage, 39(4), 1788–1802. 10.1016/j.neuroimage.2007.09.050 [DOI] [PubMed] [Google Scholar]
- Brookes, M. J. , Wood, J. R. , Stevenson, C. M. , Zumer, J. M. , White, T. P. , Liddle, P. F. , & Morris, P. G. (2011). Changes in brain network activity during working memory tasks: A magnetoencephalography study. NeuroImage, 55(4), 1804–1815. 10.1016/j.neuroimage.2010.10.074 [DOI] [PMC free article] [PubMed] [Google Scholar]
- Burke, J. F. , Long, N. M. , Zaghloul, K. A. , Sharan, A. D. , Sperling, M. R. , & Kahana, M. J. (2014). Human intracranial high‐frequency activity maps episodic memory formation in space and time. NeuroImage, 85(2), 834–843. 10.1016/j.neuroimage.2013.06.067 [DOI] [PMC free article] [PubMed] [Google Scholar]
- Burke, J. F. , Ramayya, A. G. , & Kahana, M. J. (2015). Human intracranial high‐frequency activity during memory processing: Neural oscillations or stochastic volatility? Current Opinion in Neurobiology, 31, 104–110. 10.1016/j.conb.2014.09.003 [DOI] [PMC free article] [PubMed] [Google Scholar]
- Buzsaki, G. , & Silva, F. L. (2012). High frequency oscillations in the intact brain. Progress in Neurobiology, 98(3), 241–249. 10.1016/j.pneurobio.2012.02.004 [DOI] [PMC free article] [PubMed] [Google Scholar]
- Callicott, J. H. , Bertolino, A. , Mattay, V. S. , Langheim, F. J. , Duyn, J. , Coppola, R. , … Weinberger, D. R. (2000). Physiological dysfunction of the dorsolateral prefrontal cortex in schizophrenia revisited. Cerebral Cortex, 10(11), 1078–1092. [DOI] [PubMed] [Google Scholar]
- Callicott, J. H. , Mattay, V. S. , Bertolino, A. , Finn, K. , Coppola, R. , Frank, J. A. , … Weinberger, D. R. (1999). Physiological characteristics of capacity constraints in working memory as revealed by functional MRI. Cerebral Cortex, 9(1), 20–26. [DOI] [PubMed] [Google Scholar]
- Canolty, R. T. , Edwards, E. , Dalal, S. S. , Soltani, M. , Nagarajan, S. S. , Kirsch, H. E. , … Knight, R. T. (2006). High gamma power is phase‐locked to theta oscillations in human neocortex. Science, 313(5793), 1626–1628. 10.1126/science.1128115 [DOI] [PMC free article] [PubMed] [Google Scholar]
- Cheyne, D. , Bells, S. , Ferrari, P. , Gaetz, W. , & Bostan, A. C. (2008). Self‐paced movements induce high‐frequency gamma oscillations in primary motor cortex. NeuroImage, 42(1), 332–342. 10.1016/j.neuroimage.2008.04.178 [DOI] [PubMed] [Google Scholar]
- Cheyne, D. , & Ferrari, P. (2013). MEG studies of motor cortex gamma oscillations: Evidence for a gamma “fingerprint” in the brain? Frontiers in Human Neuroscience, 7, 575 10.3389/fnhum.2013.00575 [DOI] [PMC free article] [PubMed] [Google Scholar]
- Ciesielski, K. T. , Ahlfors, S. P. , Bedrick, E. J. , Kerwin, A. A. , & Hämäläinen, M. S. (2010). Top‐down control of MEG alpha‐band activity in children performing categorical n‐back task. Neuropsychologia, 48(12), 3573–3579. 10.1016/j.neuropsychologia.2010.08.006 [DOI] [PMC free article] [PubMed] [Google Scholar]
- Cohen, J. D. , Perlstein, W. M. , Braver, T. S. , Nystrom, L. E. , Noll, D. C. , Jonides, J. , & Smith, E. E. (1997). Temporal dynamics of brain activation during a working memory task. Nature, 386(6625), 604–608. 10.1038/386604a0 [DOI] [PubMed] [Google Scholar]
- Conner, C. R. , Ellmore, T. M. , Pieters, T. A. , DiSano, M. A. , & Tandon, N. (2011). Variability of the relationship between electrophysiology and BOLD‐fMRI across cortical regions in humans. The Journal of Neuroscience, 31(36), 12855–12865. 10.1523/JNEUROSCI.1457-11.2011 [DOI] [PMC free article] [PubMed] [Google Scholar]
- Cox, R. W. (1996). AFNI: Software for analysis and visualization of functional magnetic resonance neuroimages. Computers and Biomedical Research, 29(3), 162–173. [DOI] [PubMed] [Google Scholar]
- Cremaschi, L. , Penzo, B. , Palazzo, M. , Dobrea, C. , Cristoffanini, M. , Dell'Osso, B. , & Altamura, A. C. (2013). Assessing working memory via N‐back task in euthymic bipolar I disorder patients: A review of functional magnetic resonance imaging studies. Neuropsychobiology, 68(2), 63–70. 10.1159/000352011 [DOI] [PubMed] [Google Scholar]
- Crone, N. E. , Korzeniewska, A. , & Franaszczuk, P. J. (2011). Cortical gamma responses: Searching high and low. International Journal of Psychophysiology, 79(1), 9–15. 10.1016/j.ijpsycho.2010.10.013 [DOI] [PMC free article] [PubMed] [Google Scholar]
- Crone, N. E. , Miglioretti, D. L. , Gordon, B. , & Lesser, R. P. (1998). Functional mapping of human sensorimotor cortex with electrocorticographic spectral analysis. II. Event‐related synchronization in the gamma band. Brain, 121(12), 2301–2315. [DOI] [PubMed] [Google Scholar]
- Crone, N. E. , Sinai, A. , & Korzeniewska, A. (2006). High‐frequency gamma oscillations and human brain mapping with electrocorticography. Progress in Brain Research, 159, 275–295. 10.1016/S0079-6123(06)59019-3 [DOI] [PubMed] [Google Scholar]
- Darvas, F. , Scherer, R. , Ojemann, J. G. , Rao, R. P. , Miller, K. J. , & Sorensen, L. B. (2010). High gamma mapping using EEG. NeuroImage, 49(1), 930–938. 10.1016/j.neuroimage.2009.08.041 [DOI] [PMC free article] [PubMed] [Google Scholar]
- Deuker, L. , Bullmore, E. T. , Smith, M. , Christensen, S. , Nathan, P. J. , Rockstroh, B. , & Bassett, D. S. (2009). Reproducibility of graph metrics of human brain functional networks. NeuroImage, 47(4), 1460–1468. 10.1016/j.neuroimage.2009.05.035 [DOI] [PubMed] [Google Scholar]
- Egan, M. F. , Goldberg, T. E. , Kolachana, B. S. , Callicott, J. H. , Mazzanti, C. M. , Straub, R. E. , … Weinberger, D. R. (2001). Effect of COMT Val108/158 Met genotype on frontal lobe function and risk for schizophrenia. Proceedings of the National Academy of Sciences of the United States of America, 98(12), 6917–6922. 10.1073/pnas.111134598 [DOI] [PMC free article] [PubMed] [Google Scholar]
- Gaetz, W. , Liu, C. , Zhu, H. , Bloy, L. , & Roberts, T. P. L. (2013). Evidence for a motor gamma‐band network governing response interference. NeuroImage, 74, 245–253. 10.1016/j.neuroimage.2013.02.013 [DOI] [PMC free article] [PubMed] [Google Scholar]
- Gaetz, W. , Macdonald, M. , Cheyne, D. , & Snead, O. C. (2010). Neuromagnetic imaging of movement‐related cortical oscillations in children and adults: Age predicts post‐movement beta rebound. NeuroImage, 51(2), 792–807. 10.1016/j.neuroimage.2010.01.077 [DOI] [PubMed] [Google Scholar]
- Goldman‐Rakic, P. S. (1996). The prefrontal landscape: Implications of functional architecture for understanding human mentation and the central executive. Philosophical Transactions of the Royal Society of London. Series B, Biological Sciences, 351(1346), 1445–1453. 10.1098/rstb.1996.0129 [DOI] [PubMed] [Google Scholar]
- Gray, C. M. , Konig, P. , Engel, A. K. , & Singer, W. (1989). Oscillatory responses in cat visual cortex exhibit inter‐columnar synchronization which reflects global stimulus properties. Nature, 338(6213), 334–337. 10.1038/338334a0 [DOI] [PubMed] [Google Scholar]
- Grützner, C. , Wibral, M. , Sun, L. , Rivolta, D. , Singer, W. , Maurer, K. , & Uhlhaas, P. J. (2013). Deficits in high‐ (>60 Hz) gamma‐band oscillations during visual processing in schizophrenia. Frontiers in Human Neuroscience, 7, 88 10.3389/fnhum.2013.00088 [DOI] [PMC free article] [PubMed] [Google Scholar]
- Heinrichs‐Graham, E. , & Wilson, T. W. (2015). Spatiotemporal oscillatory dynamics during the encoding and maintenance phases of a visual working memory task. Cortex, 69, 121–130. 10.1016/j.cortex.2015.04.022 [DOI] [PMC free article] [PubMed] [Google Scholar]
- Huang, M. X. , Nichols, S. , Robb‐Swan, A. , Angeles‐Quinto, A. , Harrington, D. L. , Drake, A. , … Baker, D. G. (2018). MEG working memory n‐back task reveals functional deficits in combat‐related mild traumatic brain injury. Cerebral Cortex, bhy075. 10.1093/cercor/bhy075 [DOI] [PubMed] [Google Scholar]
- Hughes, J. R. (1964). Responses from the visual cortex of unanesthetized monkeys. International Review of Neurobiology, 6, 99–152. [DOI] [PubMed] [Google Scholar]
- Ionescu, D. F. , Nugent, A. C. , Luckenbaugh, D. A. , Niciu, M. J. , Richards, E. M. , Zarate, C. A. , & Furey, M. L. (2015). Baseline working memory activation deficits in dimensional anxious depression as detected by magnetoencephalography. Acta Neuropsychiatria, 27(3), 143–152. 10.1017/neu.2014.46 [DOI] [PMC free article] [PubMed] [Google Scholar]
- Isabella, S. , Ferrari, P. , Jobst, C. , Cheyne, J. A. , & Cheyne, D. (2015). Complementary roles of cortical oscillations in automatic and controlled processing during rapid serial tasks. NeuroImage, 118, 268–281. 10.1016/j.neuroimage.2015.05.081 [DOI] [PubMed] [Google Scholar]
- Klimesch, W. , Sauseng, P. , & Hanslmayr, S. (2007). EEG alpha oscillations: The inhibition‐timing hypothesis. Brain Research Reviews, 53(1), 63–88. 10.1016/j.brainresrev.2006.06.003 [DOI] [PubMed] [Google Scholar]
- Kucewicz, M. T. , Berry, B. M. , Kremen, V. , Brinkmann, B. H. , Sperling, M. R. , Jobst, B. C. , … Worrell, G. A. (2017). Dissecting gamma frequency activity during human memory processing. Brain, 140(5), 1337–1350. 10.1093/brain/awx043 [DOI] [PubMed] [Google Scholar]
- Lachaux, J. P. , Axmacher, N. , Mormann, F. , Halgren, E. , & Crone, N. E. (2012). High‐frequency neural activity and human cognition: Past, present and possible future of intracranial EEG research. Progress in Neurobiology, 98(3), 279–301. 10.1016/j.pneurobio.2012.06.008 [DOI] [PMC free article] [PubMed] [Google Scholar]
- Lara, A. H. , & Wallis, J. D. (2015). The role of prefrontal cortex in working memory: A mini review. Frontiers in Systems Neuroscience, 9, 173 10.3389/fnsys.2015.00173 [DOI] [PMC free article] [PubMed] [Google Scholar]
- Lett, T. A. , Voineskos, A. N. , Kennedy, J. L. , Levine, B. , & Daskalakis, Z. J. (2014). Treating working memory deficits in schizophrenia: A review of the neurobiology. Biological Psychiatry, 75(5), 361–370. 10.1016/j.biopsych.2013.07.026 [DOI] [PubMed] [Google Scholar]
- Long, N. M. , Burke, J. F. , & Kahana, M. J. (2014). Subsequent memory effect in intracranial and scalp EEG. NeuroImage, 84, 488–494. 10.1016/j.neuroimage.2013.08.052 [DOI] [PMC free article] [PubMed] [Google Scholar]
- Lopes da Silva, F. (2013). EEG and MEG: Relevance to neuroscience. Neuron, 80(5), 1112–1128. 10.1016/j.neuron.2013.10.017 [DOI] [PubMed] [Google Scholar]
- Manning, J. R. , Jacobs, J. , Fried, I. , & Kahana, M. J. (2009). Broadband shifts in local field potential power spectra are correlated with single‐neuron spiking in humans. The Journal of Neuroscience, 29(43), 13613–13620. 10.1523/JNEUROSCI.2041-09.2009 [DOI] [PMC free article] [PubMed] [Google Scholar]
- Michels, L. , Bucher, K. , Luchinger, R. , Klaver, P. , Martin, E. , Jeanmonod, D. , & Brandeis, D. (2010). Simultaneous EEG‐fMRI during a working memory task: Modulations in low and high frequency bands. PLoS One, 5(4), e10298 10.1371/journal.pone.0010298 [DOI] [PMC free article] [PubMed] [Google Scholar]
- Miller, K. J. (2010). Broadband spectral change: Evidence for a macroscale correlate of population firing rate? The Journal of Neuroscience, 30(19), 6477–6479. 10.1523/JNEUROSCI.6401-09.2010 [DOI] [PMC free article] [PubMed] [Google Scholar]
- Miller, K. J. , Honey, C. J. , Hermes, D. , Rao, R. P. , denNijs, M. , & Ojemann, J. G. (2014). Broadband changes in the cortical surface potential track activation of functionally diverse neuronal populations. NeuroImage, 85(2), 711–720. 10.1016/j.neuroimage.2013.08.070 [DOI] [PMC free article] [PubMed] [Google Scholar]
- Miller, K. J. , Leuthardt, E. C. , Schalk, G. , Rao, R. P. , Anderson, N. R. , Moran, D. W. , … Ojemann, J. G. (2007). Spectral changes in cortical surface potentials during motor movement. The Journal of Neuroscience, 27(9), 2424–2432. 10.1523/JNEUROSCI.3886-06.2007 [DOI] [PMC free article] [PubMed] [Google Scholar]
- Miller, K. J. , Zanos, S. , Fetz, E. E. , den Nijs, M. , & Ojemann, J. G. (2009). Decoupling the cortical power spectrum reveals real‐time representation of individual finger movements in humans. The Journal of Neuroscience, 29(10), 3132–3137. 10.1523/JNEUROSCI.5506-08.2009 [DOI] [PMC free article] [PubMed] [Google Scholar]
- Muthukumaraswamy, S. D. (2013). High‐frequency brain activity and muscle artifacts in MEG/EEG: A review and recommendations. Frontiers in Human Neuroscience, 7, 138 10.3389/fnhum.2013.00138 [DOI] [PMC free article] [PubMed] [Google Scholar]
- Niessing, J. , Ebisch, B. , Schmidt, K. E. , Niessing, M. , Singer, W. , & Galuske, R. A. (2005). Hemodynamic signals correlate tightly with synchronized gamma oscillations. Science, 309(5736), 948–951. 10.1126/science.1110948 [DOI] [PubMed] [Google Scholar]
- Owen, A. M. , McMillan, K. M. , Laird, A. R. , & Bullmore, E. (2005). N‐back working memory paradigm: A meta‐analysis of normative functional neuroimaging studies. Human Brain Mapping, 25(1), 46–59. 10.1002/hbm.20131 [DOI] [PMC free article] [PubMed] [Google Scholar]
- Pantev, C. , Makeig, S. , Hoke, M. , Galambos, R. , Hampson, S. , & Gallen, C. (1991). Human auditory evoked gamma‐band magnetic fields. Proceedings of the National Academy of Sciences of the United States of America, 88(20), 8996–9000. [DOI] [PMC free article] [PubMed] [Google Scholar]
- Perlstein, W. M. , Carter, C. S. , Noll, D. C. , & Cohen, J. D. (2001). Relation of prefrontal cortex dysfunction to working memory and symptoms in schizophrenia. The American Journal of Psychiatry, 158(7), 1105–1113. 10.1176/appi.ajp.158.7.1105 [DOI] [PubMed] [Google Scholar]
- Pfurtscheller, G. , & Lopes da Silva, F. H. (1999). Event‐related EEG/MEG synchronization and desynchronization: Basic principles. Clinical Neurophysiology, 110(11), 1842–1857. [DOI] [PubMed] [Google Scholar]
- Polania, R. , Paulus, W. , & Nitsche, M. A. (2012). Noninvasively decoding the contents of visual working memory in the human prefrontal cortex within high‐gamma oscillatory patterns. Journal of Cognitive Neuroscience, 24(2), 304–314. 10.1162/jocn_a_00151 [DOI] [PubMed] [Google Scholar]
- Rajkowska, G. , Halaris, A. , & Selemon, L. D. (2001). Reductions in neuronal and glial density characterize the dorsolateral prefrontal cortex in bipolar disorder. Biological Psychiatry, 49(9), 741–752. [DOI] [PubMed] [Google Scholar]
- Ramnani, N. , & Owen, A. M. (2004). Anterior prefrontal cortex: Insights into function from anatomy and neuroimaging. Nature Reviews. Neuroscience, 5(3), 184–194. 10.1038/nrn1343 [DOI] [PubMed] [Google Scholar]
- Robinson, S. E. , & Vrba, J. (1999). Functional neuroimaging by synthetic aperture magnetometry (SAM) In Yoshimoto T., Kotani M., Kuriki S., Karibe H., & Nakasato N. (Eds.), Recent advances in biomagnetism (pp. 302–305). Tohoku, Japan: Tohoku University Press. [Google Scholar]
- Saad, Z. S. , & Reynolds, R. C. (2012). SUMA. NeuroImage, 62(2), 768–773. 10.1016/j.neuroimage.2011.09.016 [DOI] [PMC free article] [PubMed] [Google Scholar]
- Salvadore, G. , Cornwell, B. R. , Sambataro, F. , Latov, D. , Colon‐Rosario, V. , Carver, F. , … Zarate, C. A., Jr. (2010). Anterior cingulate desynchronization and functional connectivity with the amygdala during a working memory task predict rapid antidepressant response to ketamine. Neuropsychopharmacology, 35(7), 1415–1422. 10.1038/npp.2010.24 [DOI] [PMC free article] [PubMed] [Google Scholar]
- Scheeringa, R. , Koopmans, P. J. , van Mourik, T. , Jensen, O. , & Norris, D. G. (2016). The relationship between oscillatory EEG activity and the laminar‐specific BOLD signal. Proceedings of the National Academy of Sciences of the United States of America, 113(24), 6761–6766. 10.1073/pnas.1522577113 [DOI] [PMC free article] [PubMed] [Google Scholar]
- Schulz, M. , Chau, W. , Graham, S. J. , McIntosh, A. R. , Ross, B. , Ishii, R. , & Pantev, C. (2004). An integrative MEG‐fMRI study of the primary somatosensory cortex using cross‐modal correspondence analysis. NeuroImage, 22(1), 120–133. 10.1016/j.neuroimage.2003.10.049 [DOI] [PubMed] [Google Scholar]
- Schurmann, M. , & Basar, E. (2001). Functional aspects of alpha oscillations in the EEG. International Journal of Psychophysiology, 39(2–3), 151–158. [DOI] [PubMed] [Google Scholar]
- Sekihara, K. , Nagarajan, S. S. , Poeppel, D. , Marantz, A. , & Miyashita, Y. (2001). Reconstructing spatio‐temporal activities of neural sources using an MEG vector beamformer technique. IEEE Transactions on Biomedical Engineering, 48(7), 760–771. 10.1109/10.930901 [DOI] [PubMed] [Google Scholar]
- Suffczynski, P. , Crone, N. E. , & Franaszczuk, P. J. (2014). Afferent inputs to cortical fast‐spiking interneurons organize pyramidal cell network oscillations at high‐gamma frequencies (60‐200 Hz). Journal of Neurophysiology, 112(11), 3001–3011. 10.1152/jn.00844.2013 [DOI] [PMC free article] [PubMed] [Google Scholar]
- Takei, Y. , Fujihara, K. , Tagawa, M. , Hironaga, N. , Near, J. , Kasagi, M. , … Fukuda, M. (2016). The inhibition/excitation ratio related to task‐induced oscillatory modulations during a working memory task: A multimodal‐imaging study using MEG and MRS. NeuroImage, 128, 302–315. 10.1016/j.neuroimage.2015.12.057 [DOI] [PubMed] [Google Scholar]
- Uhlhaas, P. J. , Pipa, G. , Neuenschwander, S. , Wibral, M. , & Singer, W. (2011). A new look at gamma? High‐ (>60 Hz) gamma‐band activity in cortical networks: Function, mechanisms and impairment. Progress in Biophysics and Molecular Biology, 105(1–2), 14–28. 10.1016/j.pbiomolbio.2010.10.004 [DOI] [PubMed] [Google Scholar]
- Uhlhaas, P. J. , & Singer, W. (2013). High‐frequency oscillations and the neurobiology of schizophrenia. Dialogues in Clinical Neuroscience, 15(3), 301–313. [DOI] [PMC free article] [PubMed] [Google Scholar]
- Urbain, C. M. , Pang, E. W. , & Taylor, M. J. (2015). Atypical spatiotemporal signatures of working memory brain processes in autism. Translational Psychiatry, 5, e617 10.1038/tp.2015.107 [DOI] [PMC free article] [PubMed] [Google Scholar]
- Voytek, B. , Kayser, A. S. , Badre, D. , Fegen, D. , Chang, E. F. , Crone, N. E. , … D'Esposito, M. (2015). Oscillatory dynamics coordinating human frontal networks in support of goal maintenance. Nature Neuroscience, 18(9), 1318–1324. 10.1038/nn.4071 [DOI] [PMC free article] [PubMed] [Google Scholar]
- Vrba, J. , & Robinson, S. E. (2001). Signal processing in magnetoencephalography. Methods, 25(2), 249–271. 10.1006/meth.2001.1238 [DOI] [PubMed] [Google Scholar]
- Wager, T. D. , & Smith, E. E. (2003). Neuroimaging studies of working memory: A meta‐analysis. Cognitive, Affective, & Behavioral Neuroscience, 3(4), 255–274. [DOI] [PubMed] [Google Scholar]