

Abstract
The neurobiology of major depressive disorder (MDD) remains incompletely understood, and many individuals fail to respond to standard treatments. Repetitive transcranial magnetic stimulation (rTMS) of the dorsolateral prefrontal cortex (DLPFC) has emerged as a promising antidepressant therapy. However, the heterogeneity of response underscores a pressing need for biomarkers of treatment outcome. We acquired resting state functional magnetic resonance imaging (rsfMRI) data in 47 MDD individuals prior to 5–8 weeks of rTMS treatment targeted using the F3 beam approach and in 29 healthy comparison subjects. The caudate, prefrontal cortex, and thalamus showed significantly lower blood oxygenation level‐dependent (BOLD) signal power in MDD individuals at baseline. Critically, individuals who responded best to treatment were associated with lower pre‐treatment BOLD power in these regions. Additionally, functional connectivity (FC) in the default mode and affective networks was associated with treatment response. We leveraged these findings to train support vector machines (SVMs) to predict individual treatment responses, based on learned patterns of baseline FC, BOLD signal power and clinical features. Treatment response (responder vs. nonresponder) was predicted with 85–95% accuracy. Reduction in symptoms was predicted to within a mean error of ±16% (r = .68, p < .001). These preliminary findings suggest that therapeutic outcome to DLPFC‐rTMS could be predicted at a clinically meaningful level using only a small number of core neurobiological features of MDD, warranting prospective testing to ascertain generalizability. This provides a novel, transparent and physiologically plausible multivariate approach for classification of individual response to what has become the most commonly employed rTMS treatment worldwide. This study utilizes data from a larger clinical study (Australian New Zealand Clinical Trials Registry: Investigating Predictors of Response to Transcranial Magnetic Stimulation for the Treatment of Depression; ACTRN12610001071011; https://www.anzctr.org.au/Trial/Registration/TrialReview.aspx?id=336262).
Keywords: BOLD power, depression, functional connectivity, machine learning, magnetic resonance imaging, transcranial magnetic stimulation
1. INTRODUCTION
Major depressive disorder (MDD) is the leading cause of years lived with disability and remains poorly understood. As few as 11–30% of patients achieve remission with initial treatment, even after 8–12 months (Rush, 2007). Repetitive transcranial magnetic stimulation (rTMS) has emerged as an important noninvasive antidepressant approach for individuals who do not respond to first‐line behavioral and pharmacological therapies. RTMS involves focal magnetic stimulation applied external to the scalp, typically at the dorsolateral prefrontal cortex (DLPFC), and induces electrical stimulation in underlying cortical tissue. RTMS has the relatively unique capacity to directly target and modulate brain regions and networks to elicit clinical changes (Fisher, Nakamura, Bestmann, Rothwell, & Bostock, 2002; Rastogi et al., 2017). While rTMS is life‐changing for some individuals, response outcomes vary widely. Treatment is time‐intensive (>4 weeks of daily rTMS), costly (USD $4,000–12,000; McClintock et al., 2018) and often has limited availability resulting in a considerable and unnecessary burden for nonresponders (NRs) and clinics. These factors underscore the importance of developing a more complete understanding of the neurobiological signature of this condition and identifying clinically meaningful biomarkers for single‐subject prediction of treatment response to aid and accelerate treatment selection.
Although previous work in this field has identified various biomarkers of depression and treatment response, the capacity to accurately predict treatment outcomes to DLPFC‐rTMS, which is the most commonly employed and FDA approved rTMS treatment, has remained elusive. Recent studies suggest that neuroimaging markers may achieve higher predictive accuracy than clinical or demographic variables (Cash et al., 2019; Drysdale et al., 2017; Fox, Buckner, White, Greicius, & Pascual‐Leone, 2012). Neuroimaging has fundamentally advanced our understanding of the neurobiology of depression and provides the means to examine and potentially predict the regional and network‐wide effects of rTMS treatment that mediate individual treatment response. Previous research has primarily focused on abnormal connectivity within and among large‐scale functional brain networks. The default mode network (DMN) and the affective network (AN) are now considered central to the neurobiology of depression and the therapeutic effects of rTMS (Downar & Daskalakis, 2013; Kaiser, Andrews‐Hanna, Wager, & Pizzagalli, 2015; Sheline, Price, Yan, & Mintun, 2010; Tik et al., 2017). DMN abnormalities are associated with excessive internal rumination, self‐referential processing, and episodic memory retrieval and have been linked to illness duration and treatment response (Hamilton, Farmer, Fogelman, & Gotlib, 2015; Kaiser et al., 2015; Liston et al., 2014). The AN comprises the connections of the affective division (pregenual and subgenual cingulate cortex, SGC) of the anterior cingulate cortex (Sheline et al., 2010; Yu et al., 2011), and has been linked to abnormal emotional regulation and processing, disease severity and treatment response (Baeken, Duprat, Wu, De Raedt, & van Heeringen, 2017; Salomons et al., 2014; Sheline et al., 2010; Yu et al., 2011). Nonetheless, this line of research has thus far failed to reveal an individual clinically meaningful biomarker of treatment response, suggesting that such measures may comprise only one dimension of the neural dynamics mediating treatment outcome.
Functional network connectivity can be examined by temporally correlating neural activity inferred from fluctuations in the blood oxygenation level‐dependent (BOLD) signal (Zalesky, Fornito, & Bullmore, 2012). The amplitude (or power) of the BOLD signal is typically normalized and consequently obscured during analysis (Cole, Yang, Murray, Repovs, & Anticevic, 2016). However, emerging research suggests the regional oscillatory power of neural ensembles may provide complementary information to functional connectivity and may represent a vital feature of brain function influencing the integrity, communication, and integration of focal and distributed neural systems (Shine, Aburn, Breakspear, & Poldrack, 2018; Turchi et al., 2018; Yang et al., 2014; Zalesky, Fornito, Egan, Pantelis, & Bullmore, 2012). Furthermore, preliminary evidence suggests that rTMS in healthy individuals modulates BOLD power in key structures implicated in MDD (Chen et al., 2013; Dowdle, Brown, George, & Hanlon, 2018). We hypothesized that BOLD signal power would provide unique insights into the neurobiological signature of depression and facilitate the personalized prediction of treatment outcome.
While decades of MDD research have failed to pinpoint a strong univariate biomarker of treatment outcome, multivariate approaches such as machine learning (ML) enable nonlinear fusion of complex multidimensional data (i.e., multiple variables) to predict a binary or continuous outcome. Multivariate approaches can accommodate a greater degree of heterogeneity within a disorder and often outperform univariate biomarker approaches (Cao et al., 2018; Drysdale et al., 2017; Redlich et al., 2016; Reggente et al., 2018). Data‐driven feature reduction techniques have been used for ML, starting with a large number of initial features, and selecting those connectivity features with the highest predictive value. These approaches have been criticized as they can lack transparency and potentially identify spurious nonphysiological factors. An alternative recommended, and potentially highly effective approach is to employ existing domain knowledge to select a small number of robust neurobiological features and develop a classification model with inherent physiological plausibility (Mwangi, Matthews, & Steele, 2012; Passos et al., 2016). High accuracy can be achieved with a small number of features, provided that each variable contributes relatively unique and complementary predictive value.
We acquired neuroimaging data from individuals with MDD prior to DLPFC‐rTMS treatment and healthy comparison subjects (no treatment). We hypothesized that depressed individuals would display a novel topographic signature of aberrant BOLD power relative to healthy individuals. Furthermore, we hypothesized that core connectivity, amplitude, and clinical features would provide strong and complementary predictive information, enabling development of a transparent model that can classify individual treatment outcomes with high accuracy.
2. MATERIALS AND METHODS
2.1. Participants
Forty‐seven individuals with MDD (19 female, mean age 43 ± 12 years) and 29 healthy individuals (9 female, mean age 39 ± 15 years) were recruited and provided written informed consent. The protocol was approved by the Alfred Hospital, Monash and Swinburne University Research Ethics Boards (Australia), and conducted according to the principles expressed in the Declaration of Helsinki. Standard inclusion and exclusion criteria were used, as outlined in Supporting Information Methods. Following rejection for head motion, artifacts, outliers, and noncompleters (see Supporting Information Methods), the number of individuals with depression submitted to analysis for (a) baseline differences compared to healthy controls, and (b) regression analysis with treatment response, denoted in brackets, was functional connectivity analysis: 43 (36); BOLD signal power analysis: 41 (34); machine learning analysis for prediction of treatment response: 33 (Supporting Information Table S1). The demographics of the healthy and depressed groups (Supporting Information Table S1) did not differ in terms of age (χ2[37] = 43.58, p = .21) or gender ratio (χ2[1] = 0.37, p = .55). Further details are outlined in Supporting Information Methods.
2.2. Study procedure
A methodological overview is displayed in Figure 1. Depression severity was assessed using the Montgomery–Asberg depression rating scale (MADRS) at baseline, Week 1, 3 and at treatment endpoint. MDD participants received a baseline MRI scan before commencing 5–8 weeks of initially daily (5 days per week, Monday to Friday) and later titrated rTMS treatment, targeted to DLPFC using the F3 beam method as previously described (Beam et al., 2009; or equivalent F4 site, Bailey et al., 2018). After 3 weeks, responders continued left‐sided treatment whereas NRs were randomized to continue with left, right or bilateral treatment (full details in Supporting Information). HC received the MRI scan without treatment.
Figure 1.
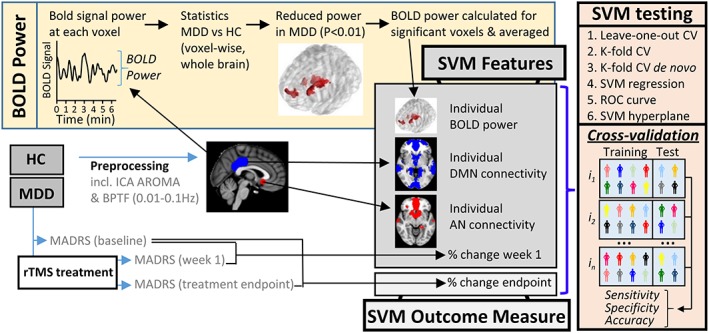
Methodology. MDD (n = 47) and HC (n = 29) were recruited and underwent MRI scanning. Following preprocessing, BOLD power was calculated at each voxel. Next, statistical comparison of MDD and HC data identified regions of significantly reduced BOLD power in the MDD group. Significant regions (p < 0.01) were binarized, generating a mask which was used to systematically calculate BOLD power for each individual and later examine predictors of rTMS treatment response. Maps of the default mode and affective network were generated by placing a seed in the posterior cingulate cortex and subgenual cingulate cortex respectively. An average group level connectivity map was then generated for each network. Individual BOLD power, AN and DMN connectivity constituted the neurobiological SVM features. MDD individuals underwent 5–8 weeks of initially daily (5 days per week, Monday to Friday) and later, titrated rTMS treatment, targeted to DLPFC using the F3 beam method as previously described (Bailey et al., 2018; Beam, Borckardt, Reeves, & George, 2009). After 3 weeks, responders continued to receive left‐sided treatment, whereas nonresponders were randomized to continue with left, right or bilateral treatment (full details in Supporting Information). Clinical severity was assessed using MADRS at baseline, Week 1, 3 and treatment endpoint. Initial clinical response at Week 1 was included as an optional SVM feature. SVM accuracy for prediction of treatment outcome was extensively interrogated using leave‐one‐out cross‐validation (CV), K‐fold CV, K‐fold CV with power and connectivity maps calculated de novo for each training sample permutation. SVM performance was additionally tested using SVM regression and the receiver operator characteristic curve. The manner in which the SVM separated R/NR was illustrated using the SVM hyperplane [Color figure can be viewed at http://wileyonlinelibrary.com]
2.3. Neuroimaging procedures
Anatomical and functional scans were acquired on a 3 T Siemens MRI scanner. Acquisition parameters and preprocessing procedures are typical and outlined in Supporting Information Methods. In short, preprocessing followed the pipeline described for ICA‐AROMA (Pruim, Mennes, van Rooij, et al., 2015), shown to improve sensitivity and specificity of fMRI analyses (Ciric et al., 2017; Parkes, Fulcher, Yucel, & Fornito, 2018; Pruim, Mennes, Buitelaar, & Beckmann, 2015; Pruim, Mennes, van Rooij, et al., 2015).
2.4. Calculation of signal power and frequency
Voxel‐wise BOLD signal power across the scan duration was calculated for each individual using a band power periodogram (0.01–0.10 Hz). Voxels displaying statistically significant differences in BOLD signal power between HC and MDD were identified by subjecting data to nonparametric testing, as outlined in section 2.6. Frequency spectra were examined using a fast Fourier transform. Signal power within the somatomotor network was also examined as a control, as further outlined in Supporting Information Methods.
2.5. Resting‐state network connectivity
FC was examined within two core networks implicated in MDD: the default mode (DMN) and affective (AN) resting‐state networks (Downar & Daskalakis, 2013). A conventional seed‐based approach was employed whereby the DMN and AN were seeded in the posterior cingulate cortex and subgenual cingulate (Liston et al., 2014; Sheline et al., 2010) respectively (Figure S1, Supporting Information Methods). Additional control analyses in the somatomotor network are outlined in Supporting Information Methods.
2.6. Statistical analyses
2.6.1. Neuroimaging analyses
Between‐group voxel‐wise differences in power and functional connectivity were nonparametrically tested in FSL Randomize (5,000 permutations) using threshold‐free cluster enhancement (Nichols & Holmes, 2002). Power differences between MDD and HC groups were conservatively thresholded at p < .01 (family‐wise error corrected). To determine the association between power and clinical outcome, a mask was first generated by binarizing the regions showing significant between‐group differences in power (p < .01). The mean power within this masked region was then systematically calculated for each individual. This measure was subjected to regression analysis with treatment outcome and utilized as a feature for machine learning (described later). Statistically significant differences between‐groups in DMN an AN functional connectivity were computed in the same manner using a threshold of p < .05 (family‐wise error corrected).
2.6.2. Regression analyses
Data were first subjected to the Shapiro–Wilk test for normality and then tested using Pearson's or Spearman's analysis for normally or non‐normally distributed data respectively. Univariate regression analysis was tested on the full dataset with all participants as well as when those with the lowest treatment response (<0% improvement) were excluded (both values are reported). This approach has been employed elsewhere and has the potential advantage of revealing latent response patterns to rTMS relative to baseline (Cash et al., 2017; Hamada, Murase, Hasan, Balaratnam, & Rothwell, 2013; Strube, Bunse, Malchow, & Hasan, 2015; Wiethoff, Hamada, & Rothwell, 2014). Additional aspects related to statistical analysis are detailed in Supporting Information Methods.
2.7. SVM learning
SVM was employed for binary classification of responders and NRs. SVM regression was employed to assess predictive accuracy relative to actual response, across the continuum of clinical responses. Feature selection was guided by priori domain knowledge of established neurobiological features related to depression and treatment response. BOLD signal power was included based on the striking differences between healthy and depressed individuals and its association with treatment outcome (Figure 2). The relevance of DMN and AN connectivity to depression is one of the most established findings in the literature (Fox et al., 2012; Greicius et al., 2007; Hamilton et al., 2015; Kaiser et al., 2015; Liston et al., 2014; Ressler & Mayberg, 2007). Clinical response at the end of Week 1 was included as an optional feature (Bailey et al., 2018); SVM accuracy was tested with and without inclusion of this feature. We considered that initial response might offer the potential for greater prediction accuracy early on in treatment (Bailey et al., 2018), while reliable prediction based on treatment outcome alone typically requires 3–4 weeks (O'Reardon et al., 2007).
Figure 2.
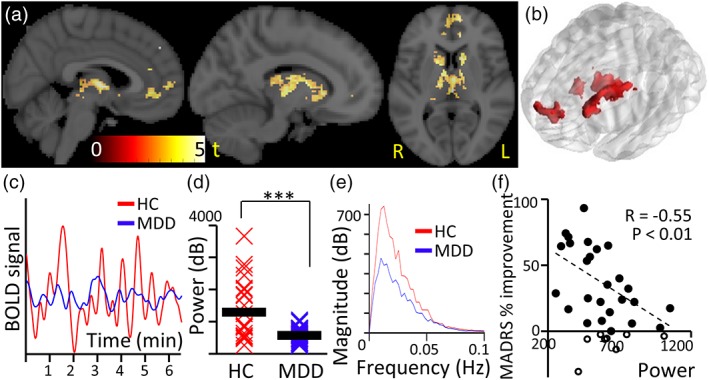
Decreased power of resting‐state BOLD fluctuations in MDD. (a) Power was reduced in MDD compared to HC (p < .01; n = 41) in areas typically associated with reward circuitry, and was not increased in any region. Areas include bilateral mPFC, bilateral caudate and bilaterally a subregion of thalamus that is known to project to prefrontal cortex. (b) Three‐dimensional view of significant clusters showing a change in BOLD signal power (p < .01; family‐wise error corrected). (c) BOLD signal showing decreased power in MDD (blue) compared to HC (red; representative participants). (d) Power for each individual averaged within regions of significantly reduced power (bandwidth 0.01–0.1 Hz) and group average (bar line; *** p < .001). (e) BOLD frequency spectra from the identified regions for MDD (blue) and HC individuals (red). (f) Negative correlation between endpoint MADRS improvement and power in the identified regions (<0% response withheld [n = 8/33]: r = −.55; p = .004; all participants: r = −.42; p = .01). Individuals with a weak clinical rTMS response (<0%) are indicated in black circles with no fill [Color figure can be viewed at http://wileyonlinelibrary.com]
SVM analyses were performed in MATLAB. The capacity of SVM to predict treatment outcome using neuroimaging and clinical features was characterized and stringently tested using a range of techniques. Each of these tests splits the dataset into training and validation samples and ascertains classification accuracy across different permutations, generating overall SVM accuracy values (Figure 1, right panel). First, performance was tested using leave‐one‐out cross‐validation. In addition, SVM regression (Chang & Lin, 2011) was utilized to determine the accuracy with which individual treatment response could be predicted on a continuous, rather than binary, scale. SVM accuracy was further tested using 12‐fold (K‐fold) cross‐validation with 10,000 permutations as recommended elsewhere (Hastie, Tibshirani, & Friedman, 2009). Next, an additional K‐fold cross‐validation approach was employed in which neuroimaging features (BOLD power and connectivity maps) were calculated de novo for each iteration of the training sample, and the model was retrained for each fold.
Treatment responders (R) were defined as patients who showed a partial or full response to treatment, quantified as a >25% change in MADRS scores. NRs were defined as individuals who demonstrated a <25% change in MADRS score. This cut‐off is used in a related ML study (Drysdale et al., 2017) and has the advantage of making the distribution of R and NR subsamples more equivalent for the purposes of ML analysis, but differs from the 50% improvement criterion which is more commonly employed, in particular in clinical studies evaluating the efficacy of rTMS. In the present scenario, this approach was beneficial for binary classification, given that the response rate was at the lower end of the normal response range observed with rTMS (30–55%). It is critical to note that our subsequent analyses demonstrated that ML accuracy was not contingent upon choice of response threshold. Furthermore, we also used SVM regression to predict a continuous measure of outcome response that was independent of any threshold. It is also worth noting that this study is not designed to assess the efficacy of rTMS, which has been addressed in many other studies and reviews (Fitzgerald, Hoy, Anderson, & Daskalakis, 2016), but rather to predict response. The data presented here is a small subset of individuals who received an MRI, derived from a much larger open‐label treatment study, and full characterization of treatment outcomes across the entire cohort is still underway and will be reported in due course.
Accuracy and stability of the model were further tested by dividing R/NR subpopulations according to the bimodal clinical outcome split (see section 3). The relative importance of each individual feature was examined by removing each feature individually and testing SVM classification performance. The SVM hyperplane was extracted to characterize the manner in which the SVM was able to separate responders and NRs. The receiver‐operating curve (ROC) and area under curve (AUC) were calculated to further examine classification performance (Supporting Information Methods).
3. RESULTS
3.1. BOLD signal power
BOLD signal power was significantly reduced in MDD compared to HC in clusters localized in medial prefrontal cortex, caudate, putamen, thalamus and anterior cingulate cortex (p < .01; Table S2, Figure 2a–d). These findings were not driven by head motion, nor baseline clinical severity (Supporting Information Results). Frequency spectra were comparable between groups in terms of frequency distribution, but not power (Figure 2e). For MDD individuals who completed treatment (n = 33; Table S1), power in these regions inversely correlated with clinical improvement, assessed by percentage change in the Montgomery–Asberg depression rating scale (MADRS) score from treatment start to endpoint (Figure 2f; <0% response withheld [n = 8/33]: r = −.55; p = .004; all participants: r = −.42; p = .01).
3.2. Resting‐state network connectivity
Within the AN, FC was significantly reduced in MDD compared to HC between the SGC seed and a cluster comprising the medial PFC (p < .05; Figure 3). This mPFC cluster was adjacent to and partially overlapping with the mPFC area found to show reduced power in MDD individuals (Figure 2a). FC of the DMN was not significantly different between the two groups. It is worth briefly noting that we did not set out to identify or confirm between‐group differences in DMN connectivity, and indeed our whole brain statistical analysis using 5,000 permutations is likely to be too stringent for such a purpose. Regression analysis demonstrated that MDD individuals with lower FC within the DMN (averaged over all DMN voxels, see Supporting Information Methods) were associated with superior clinical responses (percent change in MADRS score from pretreatment to end of treatment) when those with lowest treatment response were withheld (<0% response withheld [n = 8/35]: r = −.59, p = .001; all participants: r = −.28; p = .09; Figure S3B), and similarly for FC with the AN (<0% response withheld [n = 8/35]: r = −.40, p = .03; all participants: r = −.23, p = .17; Figure 3c). Partial correlation analysis suggested that the significant association between treatment response and FC within these two networks was not attributable to baseline clinical severity (Supporting Information Results). Moreover, baseline MADRS score was not correlated with treatment outcome (r = −.09, p = .6).
Figure 3.
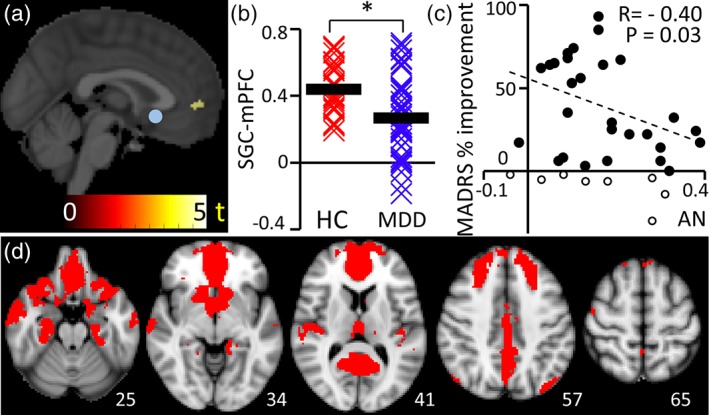
Affective network. (a) Within the AN, FC was significantly reduced in MDD compared to HC between the SGC seed (blue sphere) and a cluster comprising the medial PFC (p < .05; n = 43). (b) SGC‐mPFC connectivity is shown for each individual (asterisk represents p < .05). The MDD group showed greater heterogeneity compared to HC. (c) Spatial distribution of the affective network. (d) Connectivity within AN (Pearson's correlation coefficient, r) was associated with treatment outcome when individuals with lowest treatment response were withheld (<0% response withheld [n = 8/35]: r = −.40, p = .03; all participants: r = −.23, p = .17) [Color figure can be viewed at http://wileyonlinelibrary.com]
3.3. Individual prediction of treatment outcome using machine learning
By combining BOLD signal power, DMN and AN connectivity as well as initial clinical response at 1 week, it was possible to predict treatment outcome with high accuracy (93%), specificity (92%; i.e., proportion of negatives/NRs that are correctly classified) and sensitivity (95%; i.e., proportion of positives/responders that are correctly classified) (Figure 4b). In the absence of initial treatment response at 1 week, treatment outcome could be predicted with an accuracy of 85%, specificity of 92%, and sensitivity of 75%. The relative importance of each feature to prediction accuracy is shown in Figure 4e, showing that SVM performance was lowest when BOLD signal power was removed as a feature. SVM regression displayed a good match between observed and predicted change in MADRS score (p < .001, r = .68) with a mean error of 16.03% (Figure 4d).
Figure 4.
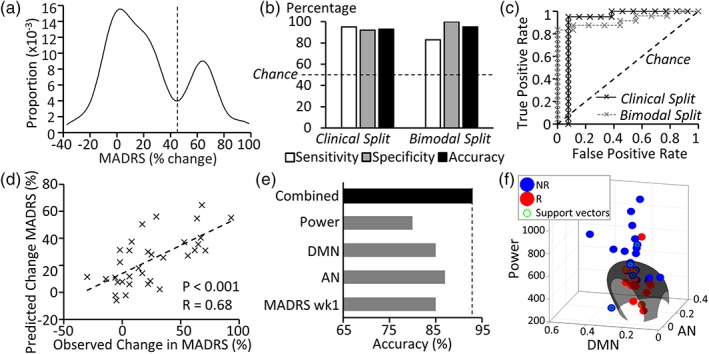
Treatment outcome prediction. (a) The cohort showed a bimodal distribution for clinical response to rTMS (% change in MADRS score). Distinct subpopulations display low and high treatment response outcomes, separated by a trough at 44.9% improvement. (b) SVM sensitivity, specificity and accuracy for binary classification of responders (R) and nonresponders (NR) was high, but varied slightly according to whether treatment response was defined according to (a) clinical outcome (>25% improvement) or (b) the trough separating subpopulations in the bimodal clinical response curve (45% improvement; n = 33). (c) Receiver operating characteristic (ROC) curves are displayed for binary classifier accuracy when R/NR were defined according to the clinical or bimodal split defined above. Both indicate performance in the “excellent” category (area under curve >0.9), although the bimodal split showed greater accuracy in identifying nonresponders. (d) SVM regression results indicated a good match between predicted and actual treatment response, although the SVM underestimated treatment outcome. (e) The relative contribution of each feature is illustrated by assessing accuracy when each is removed individually from the combined feature set. (f) The SVM hyperplane formed an elongated radial boundary encapsulating those individuals with the lowest power, DMN, and AN connectivity to classify R/NR [Color figure can be viewed at http://wileyonlinelibrary.com]
Kernel density estimation of patient response to rTMS indicated that patients showed a bimodal distribution with distinct subgroups of responders (peak at 64% reduction in MADRS score) and NRs (peak at 4% reduction in MADRS score) (Figure 4a), similar to that previously reported elsewhere (Bakker et al., 2015; Downar et al., 2014; Fitzgerald et al., 2016). This bimodal spread provides an alternative criterion to differentiate between responders and NRs, which we anticipated might have greater biological (rather than clinical) validity. When classification of R and NR was performed based on the trough in the bimodal response curve (at 45% change in MADRS score), an accuracy of 95% was achieved with a specificity of 100% and a sensitivity of 83% (Figure 4b). Figure 4f illustrates that the SVM hyperplane (based on neurobiological features alone) formed an elongated radial boundary encapsulating those individuals with the lowest power, DMN, and AN connectivity to classify and distinguish responders and NRs.
Using K‐fold instead of leave‐one‐out cross‐validation, yielded a binary classification accuracy of 90%, with a specificity of 80%, and a sensitivity of 84%. An additional K‐fold cross‐validation approach, in which power and connectivity masks were calculated de novo for each iteration of the training sample and subsequently applied to the test sample (Supporting Information Methods), performed well, particularly when data was split according to the bimodal distribution trough (sensitivity = 90%, specificity = 90%, accuracy 90%). When the clinical split was used, the SVM demonstrated high sensitivity (90%) but reduced accuracy (78%) and specificity (70%).
The ROC curve demonstrated an excellent balance between sensitivity and specificity (Figure 4c). The area under curve (AUC) was 0.91 (“excellent range”; Mandrekar, 2010) when 25% clinical improvement was used to separate N and NR and was 0.92 when the trough of the bimodal response curve was used. It is critical to note that ML performance was not contingent on the definition of response threshold.
Regardless of whether this threshold was set at 25% (clinical split, as per Drysdale et al. (2017)) or 45% (bimodal trough; Figure 4a), prediction accuracy remained at ~90% (Figure 4b,c). For consistency and clarity, we primarily refer to the results obtained using the clinical response threshold in the remainder of the text unless otherwise specified.
4. DISCUSSION
Successful prediction of individual treatment outcome has remained a long‐standing clinical goal in psychiatry, and in the case of rTMS, can be considered especially pertinent given the cost and therapeutic commitment required by patients and clinics. The heterogeneity of rTMS clinical response is clearly illustrated in the bimodal response distribution as evidenced here (Figure 4a) and elsewhere (Bakker et al., 2015; Downar et al., 2014; Fitzgerald et al., 2016), and is suggestive of the potential to distinguish distinct groups of responders and NRs. Using a sophisticated machine learning approach, and leveraging BOLD signal power as a novel neurobiological marker, together with DMN and AN connectivity and optional inclusion of initial treatment response, personalized DLPFC‐rTMS treatment outcome could be predicted with an accuracy of 85–95% for classification of binary response/nonresponse. Furthermore, individual improvement in clinical score could be determined within a mean error of ±16%.
This accuracy exceeds that achieved to date using univariate clinical or demographic features, or their integration using machine learning, and is consistent with recent evidence suggesting that neurobiological features, potentially mediating disease or treatment outcomes, can yield higher accuracy for diagnostic purposes or treatment selection in psychiatry (Drysdale et al., 2017; McGrath et al., 2013). This study is the first to establish an accurate multivariate neuroimaging biomarker for DLPFC rTMS treatment outcomes and follows on from recent influential work by Drysdale and colleagues (2017) on a different (dorsomedial PFC) target. The DLPFC is the most commonly employed clinical rTMS treatment target internationally. Beyond binary classification (Figure 4b,c), the capacity to objectively estimate the degree of clinical improvement on a single subject basis is a highly difficult feat, that was achieved using our selection of core disease‐relevant biomarkers (Figure 4d), and may assist clinicians and patients to evaluate the relative benefit of rTMS treatment. Clinical response can typically only be meaningfully evaluated after 3–4 weeks of treatment (O'Reardon et al., 2007). The capacity to predict treatment outcome with high accuracy at baseline or at the end of 1 week of treatment is very promising and preferable to administering a standard 4–8 weeks of treatment. This has the potential to help objectively direct informed patient treatment strategies, spare NRs the substantial time and expense of unsuccessful treatment and reduce rTMS wait lists.
There has been a surge of interest in the capacity of machine learning to identify diagnostic and prognostic multivariate neuroimaging biomarkers in psychiatry. The present approach represents a progressive shift away from black‐box approaches, and their associated interpretability problems, toward transparent (or explainable) machine learning. By design, the present approach directly mitigates key criticisms of machine learning including lack of transparency, the risk for data‐driven feature reduction techniques to identify spurious nonphysiological features and the potential for large feature sets (>25) to accommodate the idiosyncrasies of a data set (overfitting). The risk of overfitting is greatest in those studies in which the number of features begins to approach the number of participants in the sample, creating a tightly fit (overfit) model. The resultant feature set can therefore “slice and dice” the dataset until all features cumulatively separate responders from NRs.
Here, we employed a recommended domain‐expertise approach (Mwangi et al., 2012; Passos et al., 2016) to select robust, core disease‐relevant neurophysiological features aimed to ensure inherent biological plausibility. While the sample size is comparable to that in other recent studies (Cao et al., 2018; McGrath et al., 2013; Nouretdinov et al., 2011; Redlich et al., 2016; Reggente et al., 2018), we employed a substantially smaller feature set. The resultant ratio of features to sample size, which may be indicative of the risk of overfitting, is ~0.1 in our study, which is considerably lower than comparable recent studies in which the ratio is typically between 0.3–0.5. The SVM hyperplane clearly illustrates the highly transparent and plausible manner in which responders were separated from NRs, based on the nonlinear combination of low power, DMN, and AN connectivity features. We also demonstrate that this machine learning algorithm shows highly robust performance, characterized across a range of stringent tests designed to preclude overfitting and SVM regression indicated an authentic relationship between predicted and actual clinical outcome. Nonetheless, as with other recent high‐profile ML studies in psychiatry (Cao et al., 2018; McGrath et al., 2013; Nouretdinov et al., 2011; Redlich et al., 2016; Reggente et al., 2018), the precision, generalizability, and clinical utility of this approach will require prospective testing across heterogeneous independent cohorts. The relative simplicity of this approach and reliance on robust features is hoped to facilitate clinical application. Notably, the inadequacy of individual features for the prediction of treatment response was reiterated by the fact that relationships between individual features and treatment outcome were only articulated once participants with the lowest treatment outcome (<0% change) were omitted (e.g., AN connectivity, Figure 3c). We have reported correlations and significance in the results with and without this subset. This particular analysis is intended solely to demonstrate the limited utility of univariate biomarker approaches in this context. The critical point is that these limitations were overcome across the complete cohort when features were combined in the multivariate ML approach.
ML is beginning to firmly establish a position within the future of medical diagnosis and prognosis with a number of ML applications already FDA approved (Topol, 2019). Our findings add to a growing evidence base that signals a new era in which novel multivariate neuroimaging biomarker approaches can assist in clinical decision making in psychiatry. The present findings are supported by recent data‐driven studies predicting response to other therapies including cognitive behavioral therapy in obsessive‐compulsive disorder (Reggente et al., 2018) and electroconvulsive therapy (Redlich et al., 2016) or dorsomedial (DMPFC) rTMS in MDD (Drysdale et al., 2017). Treatment effects at DLPFC and DMPFC rTMS target sites are considered to be mediated via quite separate physiological mechanisms and benefit different MDD subtypes (Downar & Daskalakis, 2013). Together these studies may directly help to characterize the neurobiological signatures of treatment response to DLPFC and DMPFC rTMS treatment, and aid in treatment selection.
4.1. BOLD signal power
Comparison of MDD and HC datasets illustrated striking differences in BOLD signal power. BOLD signal power was then systematically quantified in areas displaying group level deficits in power and subjected to ML analysis. The regions with significantly lower BOLD signal power in MDD are implicated in reward processing, motivation, and emotional regulation, and considered to play a central role in the neurobiology of depression (Diekhof, Kaps, Falkai, & Gruber, 2012; Pizzagalli et al., 2009; Robinson, Cools, Carlisi, Sahakian, & Drevets, 2012). Of particular interest, these regions provide a strong match to the previously proposed corticostriatal pathway for rTMS effects, namely, DLPFC ➔ putamen/caudate ➔ mediodorsal thalamus ➔ hippocampus and orbital cortex (George, Ketter, & Post, 1994; Li et al., 2004). The subregion of mPFC identified in our study has repeatedly been shown to respond to TMS of DLPFC (Chen et al., 2013; Cho & Strafella, 2009; Li et al., 2004; Paus, Castro‐Alamancos, & Petrides, 2001). rTMS of DLPFC and DMPFC has also been shown to induce dopamine release in caudate nucleus and putamen (Cho et al., 2015; Strafella, Paus, Barrett, & Dagher, 2001), and modulate thalamic activity (Li et al., 2004; Speer et al., 2000) suggesting that these regions form downstream functional targets of rTMS treatment.
We found that individuals with the most aberrant (i.e., lowest) BOLD power stood to benefit most from rTMS treatment and that this was the strongest predictor of clinical outcome. Interestingly, recent work shows that TMS elicits direct, causal increases in BOLD signal power in healthy individuals in regions very similar to those identified in our study to have reduced power in depression (caudate, thalamus, and anterior cingulate cortex) (Dowdle et al., 2018). In addition, inhibitory DLPFC‐rTMS has been shown to reduce BOLD power (0.008–0.1 Hz) in mPFC (Chen et al., 2013). Moreover, the mPFC subregion amenable to BOLD power modulation by DLPFC‐rTMS (Chen et al., 2013) closely matches the region of reduced BOLD power in MDD observed here (Figure 2a,b). Together, these findings raise the intriguing possibility that modulation and normalization of BOLD signal power by excitatory rTMS may be one previously unknown mechanism by which TMS elicits its beneficial clinical effects in depression. Further investigation of this point is warranted. The data also add further weight to the argument that rTMS exerts its effects by normalization of distributed neural networks rather than solely via the focal modulation of DLPFC activity.
BOLD signal power showed a weak positive correlation with functional connectivity within the DMN, but not AN (Supporting Information Results). Critically, omitting any one of these features substantially degraded prediction performance (Figure 4e), suggesting power and connectivity each explained unique variance in treatment outcome. While signal power influences the signal to noise ratio and may influence the capacity of MRI to detect correlated activity, the amplitude of synchronized neural oscillatory activity relative to neural “noise” is one factor that may influence the capacity of networks to communicate effectively (Deco & Kringelbach, 2016). Reduced power within reward circuitry may thus potentially be one factor contributing to reward circuit hypoconnectivity in MDD (Fischer, Keller, & Etkin, 2016). Understanding the mechanistic causes of aberrant BOLD signal power in MDD may ultimately assist in elucidating the pathophysiological basis of network and behavioral dysfunction in depression. This could involve neurotransmitter abnormalities (Feyissa, Chandran, Stockmeier, & Karolewicz, 2009; Gsell et al., 2006), excitatory drive (Miller, Bruns, Ben Ammar, Mueggler, & Hall, 2017), or loss of synchrony within local neuronal ensembles (Zalesky, Fornito, Egan, et al., 2012).
4.2. Functional connectivity
The networks included as features for SVM here are two of the three networks identified as potentially important in mediating rTMS effects in a previous review (Downar & Daskalakis, 2013), namely DMN, AN and the central executive network (CEN). In a separate analysis (not included here), we found that there was no association between CEN connectivity and treatment response and thus focused solely on DMN and AN connectivity. A wealth of literature implicates the DMN and AN, but differences in methodology including study population (e.g., comorbidity with posttraumatic stress disorder; Philip et al., 2018), protocol (e.g., 4 days of accelerated intermittent Theta Burst Stimulation; Baeken et al., 2017), examination of resting state versus task‐related activity and connectivity, and examination of within network versus between‐network connectivity present limitations in succinctly summarizing these findings further in the context of rTMS response. Of particular note, our study examines within‐, rather than between‐network connectivity (Liston et al., 2014), and we have included supplementary analyses to illustrate that between‐network abnormalities do not account for the present findings. “Between‐network” abnormalities in depression are gaining increasing attention and could be included in future iterations of this approach, but in the present context would have compromised benefits pertaining to transparency, ease of application and risk of overfitting.
4.3. Limitations
Concomitant pharmacological anti‐depressant treatment is a potential confound. Nonetheless, reduced BOLD power in MDD appears unlikely to be a systematic effect of medication due to the neuroanatomical specificity of BOLD power differences, variety of antidepressant subtypes (Table S1) and association with treatment outcome. The present results were obtained using resting state scans of just under 7 min duration. While this is consistent with the majority of rsfMRI derived brain–behavior relationships to date, accuracy could potentially be improved with longer acquisition times. We also recommend taking advantage of recent advances in preprocessing techniques, as employed here, which have been shown to increase analysis sensitivity and specificity (Ciric et al., 2017; Parkes et al., 2018; Pruim, Mennes, Buitelaar, et al., 2015; Pruim, Mennes, van Rooij, et al., 2015). It is critical to note that BOLD power was not driven by group or individual differences in head motion. There were no significant differences in head motion between groups, nor was there a correlation between head motion and baseline clinical score, treatment outcome or BOLD power (detailed in Supporting Information Methods and Results). While domain‐specific knowledge was used to select a minimal set of features, thereby reducing the risk of overfitting, the size of the sample studied here is moderate and our findings require replication using an independent cohort. Finally, while sham conditions have been used to demonstrate superiority of rTMS relative to placebo (for review, see Brunoni et al., 2017), research studies such ours typically do not include sham due to the ethical difficulties involved. Individual clinical outcome may reflect the summation of both “real” and “placebo” effects. In the absence of a sham condition, the present approach therefore predicts meaningful clinical response to rTMS, without further differentiation. Conversely, the present approach also predicts nonresponse to combined “real” and “placebo” effects of rTMS, which is equally valuable.
5. CONCLUSION
Our data indicate that aberrant resting state network dynamics in depression extend beyond functional connectivity to reduced BOLD signal power, indicating this as a novel feature in the neurobiological signature of this disorder. BOLD power abnormalities were localized to areas implicated in MDD and rTMS effects and associated with treatment outcome. Together, these findings also support the notion that rTMS effects are likely to be at least partially mediated by changes at the network level. Leveraging these findings, our transparent, physiologically plausible and comparatively simple ML approach, demonstrated accuracy at a clinically meaningful level for the accurate classification of treatment outcome at a single subject level for what has become the most commonly employed rTMS treatment worldwide. Future research should prospectively test this approach across heterogeneous independent cohorts to evaluate its precision, generalizability and clinical potential for personalized treatment selection. Future studies of BOLD power may also yield critical insights into the neural mechanisms underlying depression, network abnormalities, and individual treatment response.
Supporting information
Appendix S1: Supporting Information
ACKNOWLEDGMENTS
We thank all participants, nurses, and staff involved in this study, in particular, David Elliot, Caley Sullivan, Jerome Maller, Melanie Emonson, Kate Hoy, Richard Thomson, Susan McQueen, and Bernadette Fitzgibbon. PBF has received equipment for research from Cervel Neurotech, Medtronic Ltd., MagVenture A/S, and Brainsway Ltd., and funds for research from Cervel Neurotech. A.Z. was supported by the Australian National Health and Medical Research Council (NHMRC) Senior Research Fellowship B (ID: 1136649). L.C. is supported by the Australian National Health Medical Research Council (APP1099082 and APP1138711). AK was supported by a Banting Fellowship from the Canadian Institutes of Health Research. RFHC and AB were internally funded. RA was supported by an Australian Postgraduate Award Scholarship. A.R was supported by a Queen Elizabeth II Graduate Scholarship in Science and Technology. Part of these data has been presented at ‘Society for Neuroscience’ (2018), ‘Australian Cognitive Neuroscience Society’ (2018) and the “3rd International Brain Stimulation Conference” (2019). The authors report no conflicts of interest.
Cash RFH, Cocchi L, Anderson R, et al. A multivariate neuroimaging biomarker of individual outcome to transcranial magnetic stimulation in depression. Hum Brain Mapp. 2019;40:4618–4629. 10.1002/hbm.24725
Funding information Brainsway Ltd; Cervel Neurotech; MagVenture; Medtronic Ltd; Cognitive Neuroscience Society; Society for Neuroscience; Canadian Institutes of Health Research; Medical Research Council, Grant/Award Numbers: APP1138711, APP1099082; National Health and Medical Research Council, Grant/Award Numbers: 1099082, 1136649, 1138711
DATA AVAILABILITY STATEMENT
The clinical and imaging data that support the findings of this study currently remain subject to privacy and ethical restrictions due to their clinical nature. I confirm that I have included a citation for available data in my references section unless my article type is exempt.
REFERENCES
- Baeken, C. , Duprat, R. , Wu, G. R. , De Raedt, R. , & van Heeringen, K. (2017). Subgenual anterior cingulate‐medial orbitofrontal functional connectivity in medication‐resistant major depression: A neurobiological marker for accelerated intermittent theta burst stimulation treatment? Biological Psychiatry: Cognitive Neuroscience and Neuroimaging, 2(7), 556–565. [DOI] [PubMed] [Google Scholar]
- Bailey, N. W. , Hoy, K. E. , Rogasch, N. C. , Thomson, R. H. , McQueen, S. , Elliot, D. , … Fitzgerald, P. B. (2018). Responders to rTMS for depression show increased fronto‐midline theta and theta connectivity compared to non‐responders. Brain Stimulation, 11(1), 190–203. [DOI] [PubMed] [Google Scholar]
- Bakker, N. , Shahab, S. , Giacobbe, P. , Blumberger, D. M. , Daskalakis, Z. J. , Kennedy, S. H. , & Downar, J. (2015). rTMS of the dorsomedial prefrontal cortex for major depression: Safety, tolerability, effectiveness, and outcome predictors for 10 Hz versus intermittent theta‐burst stimulation. Brain Stimulation, 8(2), 208–215. [DOI] [PubMed] [Google Scholar]
- Beam, W. , Borckardt, J. J. , Reeves, S. T. , & George, M. S. (2009). An efficient and accurate new method for locating the F3 position for prefrontal TMS applications. Brain Stimulation, 2(1), 50–54. [DOI] [PMC free article] [PubMed] [Google Scholar]
- Brunoni, A. R. , Chaimani, A. , Moffa, A. H. , Razza, L. B. , Gattaz, W. F. , Daskalakis, Z. J. , & Carvalho, A. F. (2017). Repetitive transcranial magnetic stimulation for the acute treatment of major depressive episodes: A systematic review with network meta‐analysis. JAMA Psychiatry, 74(2), 143–152. [DOI] [PubMed] [Google Scholar]
- Cao, B. , Cho, R. Y. , Chen, D. , Xiu, M. , Wang, L. , Soares, J. C. , & Zhang, X. Y. (2018). Treatment response prediction and individualized identification of first‐episode drug‐naive schizophrenia using brain functional connectivity. Molecular Psychiatry. 10.1038/s41380-018-0106-5 [DOI] [PubMed] [Google Scholar]
- Cash, R. F. H. , Dar, A. , Hui, J. , De Ruiter, L. , Baarbé, J. , Fettes, P. , … Chen, R. (2017). Influence of inter‐train interval on the plastic effects of rTMS. Brain Stimulation: Basic, Translational, and Clinical Research in Neuromodulation, 10(3), 630–636. [DOI] [PubMed] [Google Scholar]
- Cash, R. F. H. , Zalesky, A. , Thomson, R. H. , Tian, Y. , Cocchi, L. , & Fitzgerald, P. B. (2019). Subgenual functional connectivity predicts antidepressant treatment response to transcranial magnetic stimulation: Independent validation and evaluation of personalization. Biological Psychiatry, 86, e5#x2013;e7. [DOI] [PubMed] [Google Scholar]
- Chang, C.‐C. , & Lin, C.‐J. (2011). LIBSVM: A library for support vector machines. ACM Transactions on Intelligent Systems and Technology (TIST), 2(3), 27. [Google Scholar]
- Chen, A. C. , Oathes, D. J. , Chang, C. , Bradley, T. , Zhou, Z. W. , Williams, L. M. , … Etkin, A. (2013). Causal interactions between fronto‐parietal central executive and default‐mode networks in humans. Proceedings of the National Academy of Sciences of the United States of America, 110(49), 19944–19949. [DOI] [PMC free article] [PubMed] [Google Scholar]
- Cho, S. S. , Koshimori, Y. , Aminian, K. , Obeso, I. , Rusjan, P. , Lang, A. E. , … Strafella, A. P. (2015). Investing in the future: Stimulation of the medial prefrontal cortex reduces discounting of delayed rewards. Neuropsychopharmacology, 40(3), 546–553. [DOI] [PMC free article] [PubMed] [Google Scholar]
- Cho, S. S. , & Strafella, A. P. (2009). rTMS of the left dorsolateral prefrontal cortex modulates dopamine release in the ipsilateral anterior cingulate cortex and orbitofrontal cortex. PLoS One, 4(8), e6725. [DOI] [PMC free article] [PubMed] [Google Scholar]
- Ciric, R. , Wolf, D. H. , Power, J. D. , Roalf, D. R. , Baum, G. L. , Ruparel, K. , … Satterthwaite, T. D. (2017). Benchmarking of participant‐level confound regression strategies for the control of motion artifact in studies of functional connectivity. NeuroImage, 154, 174–187. [DOI] [PMC free article] [PubMed] [Google Scholar]
- Cole, M. W. , Yang, G. J. , Murray, J. D. , Repovs, G. , & Anticevic, A. (2016). Functional connectivity change as shared signal dynamics. Journal of Neuroscience Methods, 259, 22–39. [DOI] [PMC free article] [PubMed] [Google Scholar]
- Deco, G. , & Kringelbach, M. (2016). Metastability and coherence: Extending the communication through coherence hypothesis using a whole‐brain computational perspective. Trends in Neurosciences, 39(6), 432. [DOI] [PubMed] [Google Scholar]
- Diekhof, E. K. , Kaps, L. , Falkai, P. , & Gruber, O. (2012). The role of the human ventral striatum and the medial orbitofrontal cortex in the representation of reward magnitude—An activation likelihood estimation meta‐analysis of neuroimaging studies of passive reward expectancy and outcome processing. Neuropsychologia, 50(7), 1252–1266. [DOI] [PubMed] [Google Scholar]
- Dowdle, L. T. , Brown, T. R. , George, M. S. , & Hanlon, C. A. (2018). Single pulse TMS to the DLPFC, compared to a matched sham control, induces a direct, causal increase in caudate, cingulate, and thalamic BOLD signal. Brain Stimulation, 11, 789–796. [DOI] [PMC free article] [PubMed] [Google Scholar]
- Downar, J. , & Daskalakis, Z. J. (2013). New targets for rTMS in depression: A review of convergent evidence. Brain Stimulation, 6(3), 231–240. [DOI] [PubMed] [Google Scholar]
- Downar, J. , Geraci, J. , Salomons, T. V. , Dunlop, K. , Wheeler, S. , McAndrews, M. P. , … Giacobbe, P. (2014). Anhedonia and reward‐circuit connectivity distinguish nonresponders from responders to dorsomedial prefrontal repetitive transcranial magnetic stimulation in major depression. Biological Psychiatry, 76(3), 176–185. [DOI] [PubMed] [Google Scholar]
- Drysdale, A. T. , Grosenick, L. , Downar, J. , Dunlop, K. , Mansouri, F. , Meng, Y. , … Liston, C. (2017). Resting‐state connectivity biomarkers define neurophysiological subtypes of depression. Nature Medicine, 23(1), 28–38. [DOI] [PMC free article] [PubMed] [Google Scholar]
- Feyissa, A. M. , Chandran, A. , Stockmeier, C. A. , & Karolewicz, B. (2009). Reduced levels of NR2A and NR2B subunits of NMDA receptor and PSD‐95 in the prefrontal cortex in major depression. Progress in Neuro‐Psychopharmacology & Biological Psychiatry, 33(1), 70–75. [DOI] [PMC free article] [PubMed] [Google Scholar]
- Fischer, A. S. , Keller, C. J. , & Etkin, A. (2016). The clinical applicability of functional connectivity in depression: Pathways toward more targeted intervention. Biological Psychiatry: Cognitive Neuroscience and Neuroimaging, 1(3), 262–270. [DOI] [PubMed] [Google Scholar]
- Fisher, R. J. , Nakamura, Y. , Bestmann, S. , Rothwell, J. C. , & Bostock, H. (2002). Two phases of intracortical inhibition revealed by transcranial magnetic threshold tracking. Experimental Brain Research, 143(2), 240–248. [DOI] [PubMed] [Google Scholar]
- Fitzgerald, P. B. , Hoy, K. E. , Anderson, R. J. , & Daskalakis, Z. J. (2016). A study of the pattern of response to rTMS treatment in depression. Depression and Anxiety, 33(8), 746–753. [DOI] [PubMed] [Google Scholar]
- Fox, M. D. , Buckner, R. L. , White, M. P. , Greicius, M. D. , & Pascual‐Leone, A. (2012). Efficacy of transcranial magnetic stimulation targets for depression is related to intrinsic functional connectivity with the subgenual cingulate. Biological Psychiatry, 72(7), 595–603. [DOI] [PMC free article] [PubMed] [Google Scholar]
- George, M. S. , Ketter, T. A. , & Post, R. M. (1994). Prefrontal cortex dysfunction in clinical depression. Depression, 2(2), 59–72. [Google Scholar]
- Greicius, M. D. , Flores, B. H. , Menon, V. , Glover, G. H. , Solvason, H. B. , Kenna, H. , … Schatzberg, A. F. (2007). Resting‐state functional connectivity in major depression: Abnormally increased contributions from subgenual cingulate cortex and thalamus. Biological Psychiatry, 62(5), 429–437. [DOI] [PMC free article] [PubMed] [Google Scholar]
- Gsell, W. , Burke, M. , Wiedermann, D. , Bonvento, G. , Silva, A. C. , Dauphin, F. , … Schwindt, W. (2006). Differential effects of NMDA and AMPA glutamate receptors on functional magnetic resonance imaging signals and evoked neuronal activity during forepaw stimulation of the rat. The Journal of Neuroscience, 26(33), 8409–8416. [DOI] [PMC free article] [PubMed] [Google Scholar]
- Hamada, M. , Murase, N. , Hasan, A. , Balaratnam, M. , & Rothwell, J. C. (2013). The role of interneuron networks in driving human motor cortical plasticity. Cerebral Cortex, 23(7), 1593–1605. [DOI] [PubMed] [Google Scholar]
- Hamilton, J. P. , Farmer, M. , Fogelman, P. , & Gotlib, I. H. (2015). Depressive rumination, the default‐mode network, and the dark matter of clinical neuroscience. Biological Psychiatry, 78(4), 224–230. [DOI] [PMC free article] [PubMed] [Google Scholar]
- Hastie, T. , Tibshirani, R. , & Friedman, J. (2009). The elements of statistical learning (2nd ed.). New York: Springer. [Google Scholar]
- Kaiser, R. H. , Andrews‐Hanna, J. R. , Wager, T. D. , & Pizzagalli, D. A. (2015). Large‐scale network dysfunction in major depressive disorder: A meta‐analysis of resting‐state functional connectivity. JAMA Psychiatry, 72(6), 603–611. [DOI] [PMC free article] [PubMed] [Google Scholar]
- Li, X. , Nahas, Z. , Kozel, F. A. , Anderson, B. , Bohning, D. E. , & George, M. S. (2004). Acute left prefrontal transcranial magnetic stimulation in depressed patients is associated with immediately increased activity in prefrontal cortical as well as subcortical regions. Biological Psychiatry, 55(9), 882–890. [DOI] [PubMed] [Google Scholar]
- Liston, C. , Chen, A. C. , Zebley, B. D. , Drysdale, A. T. , Gordon, R. , Leuchter, B. , … Dubin, M. J. (2014). Default mode network mechanisms of transcranial magnetic stimulation in depression. Biological Psychiatry, 76(7), 517–526. [DOI] [PMC free article] [PubMed] [Google Scholar]
- Mandrekar, J. N. (2010). Receiver operating characteristic curve in diagnostic test assessment. Journal of Thoracic Oncology, 5(9), 1315–1316. [DOI] [PubMed] [Google Scholar]
- McClintock, S. M. , Reti, I. M. , Carpenter, L. L. , McDonald, W. M. , Dubin, M. , Taylor, S. F. , … American Psychiatric Association Council on Research Task Force on Novel Biomarkers and Treatments . (2018). Consensus recommendations for the clinical application of repetitive Transcranial magnetic stimulation (rTMS) in the treatment of depression. The Journal of Clinical Psychiatry, 79(1), 35–48. [DOI] [PMC free article] [PubMed] [Google Scholar]
- McGrath, C. L. , Kelley, M. E. , Holtzheimer, P. E. , Dunlop, B. W. , Craighead, W. E. , Franco, A. R. , … Mayberg, H. S. (2013). Toward a neuroimaging treatment selection biomarker for major depressive disorder. JAMA Psychiatry, 70(8), 821–829. [DOI] [PMC free article] [PubMed] [Google Scholar]
- Miller, O. H. , Bruns, A. , Ben Ammar, I. , Mueggler, T. , & Hall, B. J. (2017). Synaptic regulation of a thalamocortical circuit controls depression‐related behavior. Cell Reports, 20(8), 1867–1880. [DOI] [PubMed] [Google Scholar]
- Mwangi, B. , Matthews, K. , & Steele, J. D. (2012). Prediction of illness severity in patients with major depression using structural MR brain scans. Journal of Magnetic Resonance Imaging, 35(1), 64–71. [DOI] [PubMed] [Google Scholar]
- Nichols, T. E. , & Holmes, A. P. (2002). Nonparametric permutation tests for functional neuroimaging: A primer with examples. Human Brain Mapping, 15(1), 1–25. [DOI] [PMC free article] [PubMed] [Google Scholar]
- Nouretdinov, I. , Costafreda, S. G. , Gammerman, A. , Chervonenkis, A. , Vovk, V. , Vapnik, V. , & Fu, C. H. Y. (2011). Machine learning classification with confidence: Application of transductive conformal predictors to MRI‐based diagnostic and prognostic markers in depression. NeuroImage, 56(2), 809–813. [DOI] [PubMed] [Google Scholar]
- O'Reardon, J. P. , Solvason, H. B. , Janicak, P. G. , Sampson, S. , Isenberg, K. E. , Nahas, Z. , … Sackeim, H. A. (2007). Efficacy and safety of transcranial magnetic stimulation in the acute treatment of major depression: A multisite randomized controlled trial. Biological Psychiatry, 62(11), 1208–1216. [DOI] [PubMed] [Google Scholar]
- Parkes, L. , Fulcher, B. , Yucel, M. , & Fornito, A. (2018). An evaluation of the efficacy, reliability, and sensitivity of motion correction strategies for resting‐state functional MRI. NeuroImage, 171, 415–436. [DOI] [PubMed] [Google Scholar]
- Passos, I. C. , Mwangi, B. , Cao, B. , Hamilton, J. E. , Wu, M. J. , Zhang, X. Y. , … Soares, J. C. (2016). Identifying a clinical signature of suicidality among patients with mood disorders: A pilot study using a machine learning approach. Journal of Affective Disorders, 193, 109–116. [DOI] [PMC free article] [PubMed] [Google Scholar]
- Paus, T. , Castro‐Alamancos, M. A. , & Petrides, M. (2001). Cortico‐cortical connectivity of the human mid‐dorsolateral frontal cortex and its modulation by repetitive transcranial magnetic stimulation. The European Journal of Neuroscience, 14(8), 1405–1411. [DOI] [PubMed] [Google Scholar]
- Philip, N. S. , Barredo, J. , van 't Wout‐Frank, M. , Tyrka, A. R. , Price, L. H. , & Carpenter, L. L. (2018). Network mechanisms of clinical response to transcranial magnetic stimulation in posttraumatic stress disorder and major depressive disorder. Biological Psychiatry, 83(3), 263–272. [DOI] [PMC free article] [PubMed] [Google Scholar]
- Pizzagalli, D. A. , Holmes, A. J. , Dillon, D. G. , Goetz, E. L. , Birk, J. L. , Bogdan, R. , … Fava, M. (2009). Reduced caudate and nucleus accumbens response to rewards in unmedicated individuals with major depressive disorder. The American Journal of Psychiatry, 166(6), 702–710. [DOI] [PMC free article] [PubMed] [Google Scholar]
- Pruim, R. H. , Mennes, M. , Buitelaar, J. K. , & Beckmann, C. F. (2015). Evaluation of ICA‐AROMA and alternative strategies for motion artifact removal in resting state fMRI. NeuroImage, 112, 278–287. [DOI] [PubMed] [Google Scholar]
- Pruim, R. H. , Mennes, M. , van Rooij, D. , Llera, A. , Buitelaar, J. K. , & Beckmann, C. F. (2015). ICA‐AROMA: A robust ICA‐based strategy for removing motion artifacts from fMRI data. NeuroImage, 112, 267–277. [DOI] [PubMed] [Google Scholar]
- Rastogi, A. , Cash, R. , Dunlop, K. , Vesia, M. , Kucyi, A. , Ghahremani, A. , … Chen, R. (2017). Modulation of cognitive cerebello‐cerebral functional connectivity by lateral cerebellar continuous theta burst stimulation. NeuroImage, 158, 48–57. [DOI] [PubMed] [Google Scholar]
- Redlich, R. , Opel, N. , Grotegerd, D. , Dohm, K. , Zaremba, D. , Burger, C. , … Dannlowski, U. (2016). Prediction of individual response to electroconvulsive therapy via machine learning on structural magnetic resonance imaging data. JAMA Psychiatry, 73(6), 557–564. [DOI] [PubMed] [Google Scholar]
- Reggente, N. , Moody, T. D. , Morfini, F. , Sheen, C. , Rissman, J. , O'Neill, J. , & Feusner, J. D. (2018). Multivariate resting‐state functional connectivity predicts response to cognitive behavioral therapy in obsessive‐compulsive disorder. Proceedings of the National Academy of Sciences of the United States of America, 115(9), 2222–2227. [DOI] [PMC free article] [PubMed] [Google Scholar]
- Ressler, K. J. , & Mayberg, H. S. (2007). Targeting abnormal neural circuits in mood and anxiety disorders: From the laboratory to the clinic. Nature Neuroscience, 10(9), 1116–1124. [DOI] [PMC free article] [PubMed] [Google Scholar]
- Robinson, O. J. , Cools, R. , Carlisi, C. O. , Sahakian, B. J. , & Drevets, W. C. (2012). Ventral striatum response during reward and punishment reversal learning in unmedicated major depressive disorder. The American Journal of Psychiatry, 169(2), 152–159. [DOI] [PMC free article] [PubMed] [Google Scholar]
- Rush, A. J. (2007). Limitations in efficacy of antidepressant monotherapy. The Journal of Clinical Psychiatry, 68(Suppl 10), 8–10. [PubMed] [Google Scholar]
- Salomons, T. V. , Dunlop, K. , Kennedy, S. H. , Flint, A. , Geraci, J. , Giacobbe, P. , & Downar, J. (2014). Resting‐state cortico‐thalamic‐striatal connectivity predicts response to dorsomedial prefrontal rTMS in major depressive disorder. Neuropsychopharmacology, 39(2), 488–498. [DOI] [PMC free article] [PubMed] [Google Scholar]
- Sheline, Y. I. , Price, J. L. , Yan, Z. , & Mintun, M. A. (2010). Resting‐state functional MRI in depression unmasks increased connectivity between networks via the dorsal nexus. Proceedings of the National Academy of Sciences of the United States of America, 107(24), 11020–11025. [DOI] [PMC free article] [PubMed] [Google Scholar]
- Shine, J. M. , Aburn, M. J. , Breakspear, M. , & Poldrack, R. A. (2018). The modulation of neural gain facilitates a transition between functional segregation and integration in the brain. eLife, 7, e31130. [DOI] [PMC free article] [PubMed] [Google Scholar]
- Speer, A. M. , Kimbrell, T. A. , Wassermann, E. M. , Repella, J. D. , Willis, M. W. , Herscovitch, P. , & Post, R. M. (2000). Opposite effects of high and low frequency rTMS on regional brain activity in depressed patients. Biological Psychiatry, 48(12), 1133–1141. [DOI] [PubMed] [Google Scholar]
- Strafella, A. P. , Paus, T. , Barrett, J. , & Dagher, A. (2001). Repetitive transcranial magnetic stimulation of the human prefrontal cortex induces dopamine release in the caudate nucleus. The Journal of Neuroscience, 21(15), RC157. [DOI] [PMC free article] [PubMed] [Google Scholar]
- Strube, W. , Bunse, T. , Malchow, B. , & Hasan, A. (2015). Efficacy and interindividual variability in motor‐cortex plasticity following anodal tDCS and paired‐associative stimulation. Neural Plasticity, 2015, 530423. [DOI] [PMC free article] [PubMed] [Google Scholar]
- Tik, M. , Hoffmann, A. , Sladky, R. , Tomova, L. , Hummer, A. , Navarro de Lara, L. , … Windischberger, C. (2017). Towards understanding rTMS mechanism of action: Stimulation of the DLPFC causes network‐specific increase in functional connectivity. NeuroImage, 162, 289–296. [DOI] [PubMed] [Google Scholar]
- Topol, E. J. (2019). High‐performance medicine: The convergence of human and artificial intelligence. Nature Medicine, 25(1), 44–56. [DOI] [PubMed] [Google Scholar]
- Turchi, J. , Chang, C. , Ye, F. Q. , Russ, B. E. , Yu, D. K. , Cortes, C. R. , … Leopold, D. A. (2018). The basal forebrain regulates global resting‐state fMRI fluctuations. Neuron, 97(4), 940–952 e944. [DOI] [PMC free article] [PubMed] [Google Scholar]
- Wiethoff, S. , Hamada, M. , & Rothwell, J. C. (2014). Variability in response to transcranial direct current stimulation of the motor cortex. Brain Stimulation, 7(3), 468–475. [DOI] [PubMed] [Google Scholar]
- Yang, G. J. , Murray, J. D. , Repovs, G. , Cole, M. W. , Savic, A. , Glasser, M. F. , … Anticevic, A. (2014). Altered global brain signal in schizophrenia. Proceedings of the National Academy of Sciences of the United States of America, 111(20), 7438–7443. [DOI] [PMC free article] [PubMed] [Google Scholar]
- Yu, C. , Zhou, Y. , Liu, Y. , Jiang, T. , Dong, H. , Zhang, Y. , & Walter, M. (2011). Functional segregation of the human cingulate cortex is confirmed by functional connectivity based neuroanatomical parcellation. NeuroImage, 54(4), 2571–2581. [DOI] [PubMed] [Google Scholar]
- Zalesky, A. , Fornito, A. , & Bullmore, E. (2012). On the use of correlation as a measure of network connectivity. NeuroImage, 60(4), 2096–2106. [DOI] [PubMed] [Google Scholar]
- Zalesky, A. , Fornito, A. , Egan, G. F. , Pantelis, C. , & Bullmore, E. T. (2012). The relationship between regional and inter‐regional functional connectivity deficits in schizophrenia. Human Brain Mapping, 33(11), 2535–2549. [DOI] [PMC free article] [PubMed] [Google Scholar]
Associated Data
This section collects any data citations, data availability statements, or supplementary materials included in this article.
Supplementary Materials
Appendix S1: Supporting Information
Data Availability Statement
The clinical and imaging data that support the findings of this study currently remain subject to privacy and ethical restrictions due to their clinical nature. I confirm that I have included a citation for available data in my references section unless my article type is exempt.