

Abstract
Which temporal features that can characterize different brain states (i.e., consciousness or unconsciousness) is a fundamental question in the neuroscience of consciousness. Using resting‐state functional magnetic resonance imaging (rs‐fMRI), we investigated the spatial patterns of two temporal features: the long‐range temporal correlations (LRTCs), measured by power‐law exponent (PLE), and temporal variability, measured by standard deviation (SD) during wakefulness and anesthetic‐induced unconsciousness. We found that both PLE and SD showed global reductions across the whole brain during anesthetic state comparing to wakefulness. Importantly, the relationship between PLE and SD was altered in anesthetic state, in terms of a spatial “decoupling.” This decoupling was mainly driven by a spatial pattern alteration of the PLE, rather than the SD, in the anesthetic state. Our results suggest differential physiological grounds of PLE and SD and highlight the functional importance of the topographical organization of LRTCs in maintaining an optimal spatiotemporal configuration of the neural dynamics during normal level of consciousness. The central role of the spatial distribution of LRTCs, reflecting temporo‐spatial nestedness, may support the recently introduced temporo‐spatial theory of consciousness (TTC).
Keywords: anesthesia, consciousness, long‐range temporal correlations, resting‐state fMRI, temporal variability
1. INTRODUCTION
The human brain exhibits a complex temporal organization (Buzsáki & Draguhn, 2004). Tremendous efforts have been made to reveal the neural basis (He, 2014) and functional relevance (He, 2011; Huang et al., 2015, 2016) of the brain's temporal and spatial features through resting‐state functional magnetic resonance imaging (rs‐fMRI). Several rs‐fMRI studies focused on the temporal variability that describes the change in the amplitude of activity fluctuations (He, 2011; Huang et al., 2014b; Tagliazucchi et al., 2013; Zou et al., 2008). Temporal variability can be measured through either the time domain, by standard deviation (SD) (Huang et al., 2014b, 2016), or the frequency domain, through amplitude of low‐frequency fluctuations (ALFF) (Zou et al., 2008, 2010). The alteration in temporal variability has been observed in aging (Garrett, Kovacevic, McIntosh, & Grady, 2010, 2011), unconscious state (Huang et al., 2014a, 2014b, 2016; Lei, Wang, Yuan, & Chen, 2015; Tagliazucchi et al., 2016, 2013), and psychiatric disorders (Martino et al., 2016). Furthermore, temporal variability in two subfrequency ranges, Slow‐5 (0.01–0.027 Hz) and Slow‐4 (0.027–0.073 Hz), revealed distinct alterations in disorder of consciousness (Huang et al., 2014a) and psychiatric disorders (Martino et al., 2016; Yu et al., 2014).
In addition to the temporal variability, another temporal feature, long‐range temporal correlations (LRTCs) has been introduced in fMRI studies (He, Zempel, Snyder, & Raichle, 2010). The LRTCs implies the temporal memory of brain activity in long time scales. Previous findings demonstrated that the BOLD‐fMRI signals follow a power‐law distribution; therefore, it is scale‐free or scale‐invariant as expressed by (where P is the power, f is the frequency, and is called the power‐law exponent (PLE)) (He, 2011). LRTCs can be measured in frequency domain by the power relationships across different frequencies with the power‐law exponent (PLE), or in the time domain (Bullmore et al., 2001) with the Hurst exponent (Hurst, 1951). Additionally, previous findings demonstrated that LRTCs varied between brain networks (He, 2011) and modulated stimulus‐evoked activity (Huang et al., 2016). The degree of LRTCs was reported to be reduced during altered states of consciousness such as during sleep and anesthesia (Tagliazucchi et al., 2016, 2013). The hierarchy of LRTCs across different brain areas reflects the temporo‐spatial nestedness of brain activity, which has been postulated as a core mechanism of consciousness in the recently introduced temporo‐spatial theory of consciousness (TTC) (Northoff & Huang, 2017).
In addition to their temporal nature, temporal variability and LRTCs show specific spatial organizations across regions with for instance the default mode network exhibiting the highest values in both measures (He, 2011; Tagliazucchi et al., 2013). Theoretically, they can be independent of each other (Tagliazucchi et al., 2013), while empirically, a positive correlation between LRTCs and temporal variability was observed across regions in awake resting state (He, 2011). Temporal variability and LRTCs yielded analogous alternations with reductions in anesthetic‐induced loss of consciousness (Huang et al., 2016; Tagliazucchi et al., 2016), but showed different patterns in sleep (Tagliazucchi et al., 2013). However, whether these alternations lead to disruptions in the spatial organizations of LRTCs and temporal variability remains unknown. That is critical for the understanding of their neurophysiological aspects, that is, whether they reveal similar aspects of functionality for neural activity. In other words, to what extent they are anatomically determined and/or relevant for the functional states, that is, level of consciousness.
The question for the relationship between temporal variability and LRTCs may carry major implications. If temporal variability and LRTCs differ in representing distinct functional aspects of neural activity, their relationship could change during different neural dynamic states, that is, awake and anesthetic. Empirically, one could conceive different models of the relationship between LRTCs (measured by PLE) and temporal variability (measured by SD) as illustrated in Figure 1. If the PLE and SD remain independent of each other (Figure 1a,b), it is expected that they would not correlate with each other, that is, differences noticed in one's measure would not be accompanied by reciprocal differences in the other's measures (Figure 1a,b). Alternatively, PLE and SD could correlate and thus be closely related with each other—such correlation could either be positive or negative (Figure 1c,d). Moreover, one would expect that if PLE and SD are closely related to and dependent on each other as a general neuronal phenomenon, then their relationship would remain independent during different neural dynamic states, that is, awake and anesthetic states.
Figure 1.
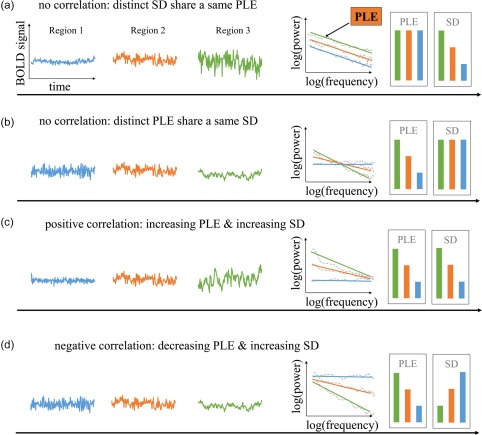
Schematic illustration of two temporal features across brain regions: the LRTCs (measured by power‐law exponent (PLE)) and the temporal variability (measured by standard deviation (SD)) and their possible relationships. Left three columns represent the time course from three different regions. The fourth column describes the power spectrum of the time courses in log scale. Dashed line indicates their power in frequency and the solid line indicates the fitting line. The slope is defined as power‐law exponent. The two right columns illustrate the value of PLE and SD for each region. Four possible relationships are presented here: (a) SD is independent of PLE, distinct SD share a same PLE. (b) Or conversely, distinct PLE share a same SD. (c) They positively correlate with each other: the higher PLE, the higher variability. (d)They negatively correlate with each other [Color figure can be viewed at http://wileyonlinelibrary.com]
In our study, we explored the relationship between PLE and SD in awake state and general anesthesia using two different anesthetic agents (propofol and sevoflurane), which display different molecular mechanism but both modulate excitatory‐inhibitory balance in general (Franks, 2006; Hales & Lambert, 1991; Hemmings et al., 2005; Krasowski & Harrison, 1999; Tomlin, Jenkins, Lieb, & Franks, 1998). We used the propofol group (n = 14) as main results with the sevoflurane group (n = 6) served for replication. We first found global reductions in both PLE and SD during propofol‐induced anesthetic state when compared to the awake state. Furthermore, we observed lack of spatial correlation (across brain regions) between SD and PLE in propofol‐induced anesthetic state which corresponds to the model in Figure 1a. While in the awake state, a positive correlation of the two was observed, corresponding to Figure 1c. Most importantly, we demonstrated that the decoupling between PLE and SD was due to a disrupted spatial pattern of PLE distribution with a preserved spatial pattern of SD distribution in propofol‐induced anesthetic state. These results highlight the functional importance of the topographical organization of the temporal structure, that is, LRTCs in our brain for maintaining an optimal spatiotemporal configuration of the neural dynamics and potentially, a normal level of consciousness.
2. METHODS
2.1. Subjects
Twenty subjects undergoing elective transsphenoidal approach for resection of pituitary microadenoma were included in this study (male/female: 11/9; age: 26–62 years). The pituitary microadenomas were diagnosed by their size (<10 mm in diameter without sella expansion) based on radiological examinations and plasma endocrinal indicators. These patients were classified as ASA (American Society of Anesthesiologists) physical status I or II grade. They had no history of craniotomy, cerebral neuropathy, or vital organ dysfunction. This study was approved by the Ethics Committee of the Huashan Hospital, Fudan University. Written informed consent was obtained from all subjects before the study.
2.2. Protocol
Fourteen subjects received intravenous propofol anesthesia and six subjects received inhalational sevoflurane anesthesia. We defined the general anesthesia state by behavioral measurements: no response to verbal command (“strongly squeeze my hand!”) corresponding to Ramsay score of 5–6 (Ramsay, Savege, Simpson, & Goodwin, 1974) and OAA/S score of 1 (Chernik et al., 1990). In addition, no subject reported any recall of the events in the postoperative follow‐up; therefore, all subjects were considered unconscious during anesthetic drug administration.
For the propofol group, we achieved a 3.0–5.0 μg/mL plasma concentration by using a target‐controlled infusion (TCI) based on Marsh model. After the patients lost response to a verbal command, remifentanil (1.0 μg/kg) and succinylcholine (1 mg/kg) were administrated to facilitate endotracheal intubation. We then maintained the TCI propofol at a stable effect‐site concentration (4.0 μg/mL) which reliably induced an unconscious state in the subjects. For the sevoflurane group, 8% sevoflurane in 100% oxygen was administered to the patients, adjusting the gas flow to 6 L/min, combined with remifentanil (1.0 μg/kg) and succinylcholine (1.0 mg/kg). This was maintained with 2.6% (1.3 MAC) ETsevo in 100% oxygen, and a fresh gas flow at 2.0 L/min. The concentration of sevoflurane used was reported to successfully maintain a loss of consciousness in anesthetized patients (Katoh & Ikeda, 1998). As there is a quick elimination of the analgesic remifentanil and the depolarized neuromuscular relaxant succinylcholine from plasma, the anesthetic effects on the brain are considered to be solely pertaining to propofol and sevoflurane. During the anesthetic state, subjects were given intermittent positive pressure ventilation, with tidal volume at 8–10 mL/kg, respiratory rate at 10–12 beats per minute, and PetCO2 (end tidal partial pressure of CO2) at 35–37 mmHg.
2.3. fMRI data acquisition
Two 8 min resting‐state runs, one in awake and one in anesthetic state, were acquired using fMRI. The subjects were then asked to wear earplugs, take a comfortable supine position, and try to relax with their eyes closed during the scanning session and were instructed to not move their head during the MRI session. Eye‐tracking during fMRI was not available, but offline postscan recordings ensured that subjects could comply with this instruction. The patients were instructed to try not to concentrate on anything in particular. After the awake scans, subjects were given the anesthetic agents in addition to full hydration with hydroxyethyl starch to avoid hypotension. The resting‐state fMRI scans were acquired after anesthesia was maintained for at least 15 min which suggests anesthetic levels are stabilized. High‐resolution anatomical images were acquired in both states for each subject.
In this study, we used an intraoperative Siemens 3 T scanner (Siemens MAGNETOM, Germany) with a standard head coil to acquire gradient‐echo EPI images of the whole brain (number of slice = 25, TR/TE = 2,000/30 ms, slice thickness = 6 mm, field of view (FOV)=192 mm, flip angle = 90°, image matrix: 64 × 64).
2.4. fMRI data preprocessing
Preprocessing steps were implemented in Analysis of Functional NeuroImages (AFNI) software (Cox, 1996). We discarded the first six volumes in each scanning using the AFNI command “3dTcat.” The functional images from each scan were then slice‐timing corrected (via AFNI's 3dTshift), aligned to the fifth volume using AFNI's “3dvolreg,” transformed into Talaraich space (Talairach & Tournoux, 1988) using and resampled to 3 × 3 × 3 mm3 using AFNI's “adwarp,” and then spatially smoothed with a 6‐mm full width at half maximum Gaussian blur (AFNI's “3dmerge”). Linear trends were removed from the scans. Six head motion parameters were estimated and visually inspected. Head motion was smaller than translation or ± rotation for all subjects. Time series for six estimated parameters of head motion and mean time series from the white matter (WM) and cerebrospinal fluid (CSF) were regressed out from grey matter. To minimize partial volume effects with gray matter, the WM and CSF masks were eroded by one voxel (Chai, Castanon, Ongur, & Whitfield‐Gabrieli, 2012).
2.5. Power‐law exponent (PLE) calculation
The fMRI signal time course from each voxel was analyzed for the resting‐state scan of each subject. The normalized spectrum of the fMRI signal was computed using the Welch method (Welch, 1967). We used the MATLAB function pwelch with its default parameters (Gruber, 1997; Stoica & Moses, 1997; Welch, 1967). This function estimated the power spectral density of the input signal vector X using Welch's averaged modified periodogram method of spectral estimation. Time series were divided into eight segments of equal lengths, each with 50% overlap. Each segment was windowed by a Hamming window with the equivalent length as the segment. The power‐law exponent (PLE) for each voxel was calculated as the linear slope of power spectrum within 0.01–0.1 Hz under logarithmic scale. This frequency range, which had been applied in previous studies on LRTCs (He, 2011; Tagliazucchi et al., 2013), was chosen based on previous reports entailing that low frequency fluctuations of the BOLD signal encoded the most functionally relevant information (Biswal, Zerrin Yetkin, Haughton, & Hyde, 1995; Fox & Raichle, 2007; Huang et al., 2014a; Zhang & Raichle, 2010).
2.6. Goodness of fit
Given that the estimation of PLE involves a linear fit, it is important to report whether the goodness of fit is altered across the two states. Goodness of fit was measured as residuals (r) between data and the fitting curve. Difference of r was tested by paired t test between awake and anesthetic states (Tagliazucchi et al., 2013). No difference was found for residuals (r) across two states, suggesting the two states are at the same range for goodness of fit.
2.7. Standard deviation (SD) of BOLD signal in standard frequency (0.01–0.1 HZ) and two subfrequencies (Slow‐5: 0.01–0.027 HZ and Slow‐4: 0.027–0.073 HZ)
The standard deviation (SD) of blood oxygenation level‐dependent (BOLD) signal describes the temporal variability of brain activity across time within voxel (Garrett et al., 2010, 2011). To match the frequency range of PLE, we calculated SD at the standard frequency range (0.01–0.1 Hz) (Buzsáki & Draguhn, 2004; Zuo et al., 2010). To test frequency specificity, the SD of two subfrequencies ranges (Slow‐5: 0.01–0.027 Hz and Slow‐4: 0.027–0.073 Hz) were calculated.
2.8. Global mean of PLE and SD in standard, Slow‐5, and Slow‐4 frequency range
Mean value of PLE (mPLE) was calculated by averaging PLE across all voxels within grey matter. The same calculation was performed on SD (mSD). Paired t tests for global mean of PLE and SD were performed (N = 14). To test frequency specificity, the mean SDs in Slow‐5 and Slow‐4 bands were calculated and two‐by‐two ANOVA (factor: frequency: Slow‐5 vs Slow‐4; factor state: awake, anesthesia) analysis was performed to test statistical significance.
2.9. Voxel‐wise difference of whole‐brain PLE and SD
The PLE and SD were tested in paired t‐tests respectively by AFNI's “3dttest++,” to determine the differences between awake (n = 14) and anesthetic (n = 14) states. All t tests results were converted to z‐scores and mapped with a threshold at a P value < .01 after AlphaSim correction in AFNI with a minimal cluster size of 50 voxels.
2.10. Topographical similarity between PLE and SD
To examine whether the coupling between PLE and SD is state dependent, we calculated the spatial correlation coefficients between PLE and SD (across voxels in the gray matter) in awake and anesthetic state separately. The individual correlation coefficient was transformed into Fishers' Z, and group analysis (awake vs anesthetic states) was performed using paired t test.
2.11. Similarity of spatial pattern between anesthetic and awake state
A voxel‐based correlation between awake and anesthetic state was performed on PLE and SD in gray matter for each subject. Individual Pearson correlation value was transformed into Fisher's Z. The resulted spatial correlation coefficient was tested against zero using one sample t test.
Additionally, to test the spatial similarity of SD in Slow‐5 and Slow‐4 frequency ranges, voxel based correlation between SD in Slow‐5 and SD in Slow‐4 was performed in awake and anesthetic state separately. Paired t test was then performed to test the difference of spatial similarity between states.
2.12. Intersubject spatial correlation between anesthetic and awake state for PLE and SD
To test whether the subjects share a similar or distinct spatial pattern of PLE and SD in the anesthetic state, we performed intersubject spatial correlation for PLE and SD in both awake and anesthetic state. The correlation was performed across subjects for PLE and SD in awake and anesthetic, respectively.
2.13. Replicating in sevoflurane‐induced general anesthesia
For replication, we applied the same measurements on sevoflurane‐induced general anesthetic group (n = 6). The subject‐based PLE and SD were tested by paired t test. The voxel‐based correlation between PLE and SD in each state for each subject was calculated and paired t test was performed. Finally, the spatial similarity for PLE and SD were also calculated.
2.14. Control analyses for global signal, gender, age, and head motion on PLE and SD across state
To test the robustness of current findings, we examined the potential effects of global signal regression, gender, age, and head motion. Spatial difference maps of PLE and SD across states were compared before and after global signal regression, and before and after gender and age regressions.
For the issue of head motion effect, we first calculated frame‐wise Euclidean norm (square root of the sum squares) of the six‐dimension motion derivatives using AFNI program 1d_tool.py. The PLE and SD for enorm time series were calculated with the identical procedure as calculated for BOLD signal, and then paired t tests were performed. The correlation between PLE and SD for head motion was calculated separately. The subject‐based correlation for PLE (SD) between BOLD signal and head motion was calculated. Finally, the group difference for PLE and SD of BOLD signal was checked after regressing PLE and SD of head motion.
3. RESULTS
3.1. Global reduction of power‐law exponent (PLE) in anesthetic state
We estimated the PLE values for all gray matter voxels in the awake and propofol‐induced anesthetic state. A global reduction of PLE across the whole brain was clearly seen in the anesthetic state when compared with the awaken state (Figure 2a). This was further visualized by plotting the normalized power spectrum averaged across the gray matter voxels, and averaged across subjects in awake (PLE = 0.73) and anesthetic state (PLE = −0.01) (Figure 2b). Paired sample t tests showed that the global mean of PLE (mPLE) was significantly decreased in propofol‐induced anesthetic state (n = 14, t = 9.6, p = 2.8 × 10⁻⁷, Cohen's d = 2.57) (Figure 2c). The reduction pattern of PLE were consistent with previous findings reported during sleep (Lei et al., 2015; Tagliazucchi et al., 2013) and anesthetic states (Tagliazucchi et al., 2016). Goodness of fit was tested between two states and no significant difference was found.
Figure 2.
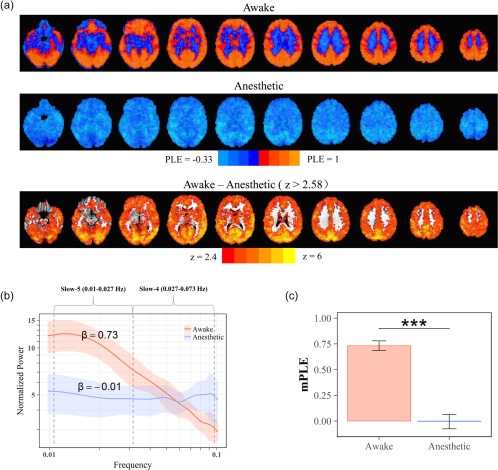
The global PLE reduction in propofol‐induced anesthetic state. (a) Spatial maps of PLE in awake (top) and anesthetic (middle) state. Voxel‐wise group comparison of the PLE showed significant decrease in whole brain (threshold at p < 0.01) (bottom). (b) Normalized power spectrum of resting‐state brain activity within the grey matter across subjects (mean: deep color line; ±1 SD: light color range). Slow‐5 is defined as 0.01–0.027 Hz and Slow‐4 is defined as 0.027–0.073 Hz. The power‐law exponent (PLE), β, was defined as the slope of a linear regression of log‐power on log‐frequency corresponding to the straight‐line regime. (c) Group comparison of PLE mean value (mPLE) showed significant reduction during anesthetic state [Color figure can be viewed at http://wileyonlinelibrary.com]
3.2. Global reduction of SD in anesthetic state
A significant reduction of the SD was observed across widespread regions in the propofol‐induced anesthetic state (Figure 3a, top). The mean SD of the entire brain was significantly reduced in the anesthetic state comparing to the awake state (n = 14, t = 3.1, p = .008, Cohen's d = 0.83) (Figure 3b).
Figure 3.
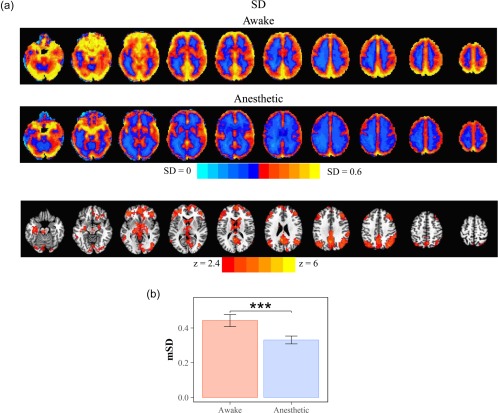
Reduced SD in propofol‐induced anesthetic state. (a) Spatial maps of SD in awake (top) and anesthetic (middle) state. Voxel‐wise group comparison of the SD showed significant decrease in wide‐spread brain regions (threshold at p < .01) (bottom). (b) Group comparison of mean of SD (mSD) [Color figure can be viewed at http://wileyonlinelibrary.com]
3.3. Decoupling of PLE and SD in anesthetic state
To test whether the relationship between PLE and SD is state‐dependent, we measured the correlation between PLE and SD in the awake and propofol‐induced anesthetic state. We observed a higher correlation coefficient (fisher's z = 0.27) between PLE and SD in the awake state when compared to anesthetic state (fisher's z = −0.01). The paired t test between the two states confirmed the decoupling between PLE and SD (n = 14, t = 5.07, p = .0002, Cohen's d = 1.36) in the anesthetic state (Figure 4c), which suggested that the relationship between PLE and SD was state‐dependent.
Figure 4.
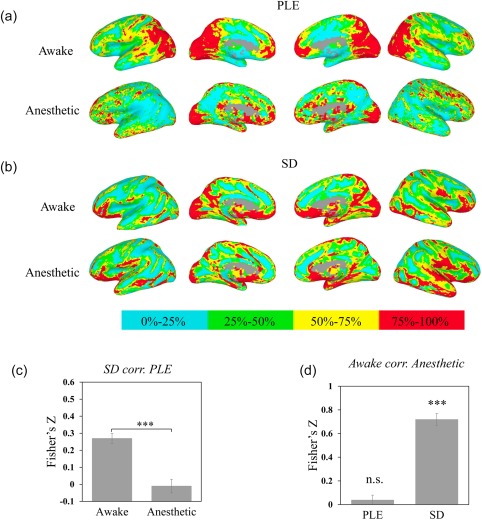
Spatial pattern across awake and propofol‐induced anesthetic state for PLE and SD. Values were ranked and converted into four percentage bins (indicated by color bar) to visualize spatial pattern of PLE and SD. (a) Spatial maps of PLE in awake (top) and anesthetic (bottom). (b) Spatial maps of SD in awake (top) and anesthetic (bottom). (c) Comparison of correlation between PLE and SD in awake and anesthetic state revealed the PLE and SD decoupled in anesthetic state. The correlation was calculated for each subject first with Fisher's Z transformation, and performed in group level with paired t test. (d) Whole‐brain voxel‐based correlation between awake and anesthetic for PLE, SD. The results of spatial correlations indicated the spatial pattern of PLE was more disrupted in anesthetic state when compared to the spatial patterns of SD. *p < .05, **p < .01, ***p < .005 [Color figure can be viewed at http://wileyonlinelibrary.com]
3.4. Spatial similarity of PLE and SD in awake and anesthetic state
The lack of correlation between PLE and SD in the anesthetic state may correspond to an altered spatial pattern of both measures in the two states, that is, awake and anesthetic. To test this hypothesis, we quantitatively examined the similarity of spatial pattern for PLE/SD between awake and anesthetic states across grey matter voxels.
Results indicated a distinct spatial pattern of PLE with lack of correlation in PLE's spatial distribution between awake and anesthetic state (one sample t test against 0: n = 14, t = 0.97, p = .35, Cohen's d = 0.26) (Figure 4a,d), while the spatial structure was more preserved for SD (Figure 4b). Spatial correlation of SD between awake and anesthetic states was fairly high (one sample t test: n = 14, t = 14.5, p = 2.1 × 10⁻⁹, Cohen's d = 3.87) (Figure 4d).
Taken together, the spatial correlations observed indicate a different pattern of spatial structure reduction between PLE and SD. This suggested that the altered spatial pattern in PLE in the awake and anesthetic states accounted for the decoupling between PLE and SD in the anesthetic state.
3.5. Intersubject spatial correlation of PLE and SD
The altered spatial pattern of PLE in the anesthetic state can lead to an “anesthetic spatial pattern” which differs from the awake state or a random spatial pattern which means a stable “anesthetic spatial pattern” does not existed. To test these two possibilities, we performed an intersubject spatial correlation of PLE and SD in the awake and anesthetic state (Figure 5).
Figure 5.
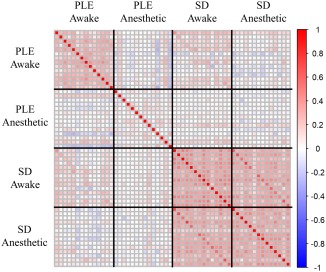
Intersubject spatial correlation between PLE and SD in both awake and propofol‐induced anesthetic states. The spatial correlation was calculated by voxel‐based correlation between each subject's PLE and SD. Each row and column represent one subject. The intersubject spatial correlation revealed that the spatial pattern of PLE in anesthetic state was disrupted across subjects, while the spatial pattern of SD was relatively similar across subjects in different conscious states [Color figure can be viewed at http://wileyonlinelibrary.com]
We found that the spatial pattern of SD was less affected by the state when compared with the spatial pattern of PLE. The intersubject spatial pattern of SD in the awake state (SDawake corr. SDawake) was the most stable (mean of fisher's z: z = 0.43) and was slightly reduced in the anesthetic state (SDanesthetic corr. SDanesthetic: z = 0.37). Additionally, spatial correlation of SD between the anesthetic and awake states revealed a correlation (SDAnesthetic corr. SDAwake: z = 0.38) similar to the correlation seen in the anesthetic state. These results revealed that a similar spatial pattern of SD was shared across subjects in both awake and anesthetic states.
In contrast, the intersubject PLE spatial pattern was disrupted in the anesthetic state. The spatial correlation of PLE was much higher in the awake state (PLEawake corr. PLEawake: z = 0.28) when compared to the anesthetic state (PLEanesthetic corr. PLEanesthetic: z = 0.06). The results suggested a random spatial pattern of PLE in the anesthetic state.
3.6. Frequency specificity of Slow‐5 and Slow‐4
The reduced PLE and SD values observed in the anesthetic state could suggest more reduction of SD in low frequencies than high frequencies, which was often described as frequency specificity of SD in previous studies (Han et al., 2011; Huang et al., 2014b, 2016). The frequency specificity of SD was investigated during loss of consciousness (Huang et al., 2014b, 2016) and psychiatric disorders (Han et al., 2011; Yu et al., 2014). However, whether that is the relationship between frequency bands or the specificity frequency correlates more with the state remains unknown. For this purpose, we investigated the spatial pattern of two subfrequencies within the standard frequency, that is, the Slow‐5 (0.01–0.027 Hz) and Slow‐4 (0.027–0.078 Hz), which was widely used in previous studies (Han et al., 2011; Zuo et al., 2010).
We first applied a two‐by‐two ANOVA (factor frequency: Slow‐5 vs Slow‐4; factor state: awake, anesthesia) and confirmed the state related frequency specificity. The main effects of the state and frequency as well as the interaction effect were observed (F state = 17.09, p = .001, F frequency = 111, p = 6.8 × 10⁻¹¹, F state*frequency = 18.9, p = .00019) (Figure 6c), suggesting that the SD of Slow‐5 was reduced more in the anesthetic state when compared with the SD of Slow‐4. Additionally, the correlation between the difference of PLE ( PLE as defined in above session) and difference of SD ( Slow‐5 and Slow‐4) revealed that reduction of PLE correlated more with the reduction of SD in Slow‐5 when compared with Slow‐4 (n = 14, t = 10.2, p = 1.4 × 10⁻⁷, Cohen's d = 3.6) (Figure 6d).
Figure 6.
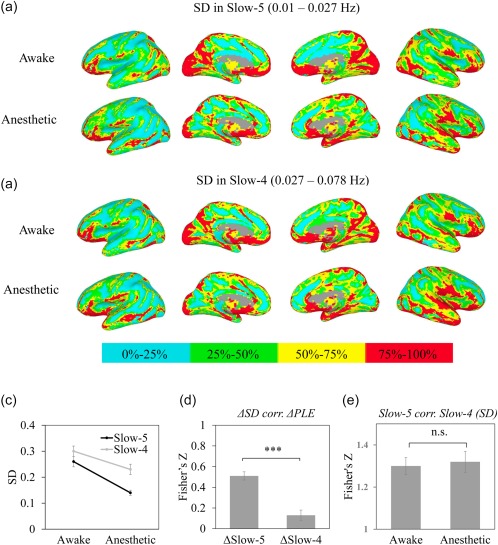
Spatial pattern across awake and propofol‐induced anesthetic state for PLE and SD in Slow‐5 (a) and Slow‐4 (b). Values were ranked and converted into four percentage bins (indicated by color bar) to visualize spatial pattern of SD in Slow‐5 and Slow‐4. (c) ANOVA analysis revealed mean effects of state and frequency, as well as its interaction effect, which confirmed a frequency specificity of SD. (d) Correlation between the difference of PLE ( PLE) and the difference of SD ( SD) in Slow‐5 ( Slow‐5) and Slow‐4 ( Slow‐4). The reduction of PLE correlated more with reduction of Slow‐5. (e) Correlation between SD in Slow‐5 and Slow‐4 in awake and anesthetic state. The high correlation coefficients and no difference between awake and anesthetic state suggested a state independent relationship between Slow‐5 and Slow‐4. *p < .05, **p < .01, ***P < .005 [Color figure can be viewed at http://wileyonlinelibrary.com]
However, the voxel‐wise correlations of SD between Slow‐5 and Slow‐4 were still high in both awake and anesthetic state (Figure 6a,b,e). Paired t test revealed no difference in voxel‐wise correlation between awake and anesthetic state, suggesting a similar spatial pattern between Slow‐5 and Slow‐4 independent of states.
3.7. Replication in sevoflurane‐induced general anesthesia
To determine whether the above observations by propofol anesthesia can be generalized to other anesthetics, we applied the same measurements in an additional sevoflurane‐induced anesthetic group (n = 6). Similar to the results in the propofol‐induced anesthetic group, global reduction of PLE and SD were observed (PLE: n = 6, t = 2.8, p = .036, Cohen's d = 1.16; SD: n = 6, t = 7.1, p = .0009, Cohen's d = 2.9). As seen in the propofol group, we observed a tendency of decoupling between PLE and SD in the sevoflurane‐induced anesthetic group, albeit did not reach statistical significance due to limited number of subjects (n = 6, t = 1.45, p = .2, Cohen's d = 0.59). More importantly, similar to propofol‐induced anesthetic state, the spatial structure of PLE was disrupted (n = 6, t = 1.88, p = .11, Cohen's d = 0.77) whereas the spatial structure of SD remained intact (n = 6, t = 13.5, p = 3.9 × 10⁻⁵, Cohen's d = 5.53).
3.8. The effects of global signal, gender, age and head motion on PLE and SD across states
We first checked whether the effects of gender, age, and global signal would affect the spatial pattern of PLE and SD. This was achieved by comparing the spatial significant maps before and after gender, age, and global signal regression. The spatial maps of PLE (Supporting Information, Figure s1) and SD (Supporting Information, Figure s2) were largely identical before and after regression, respectively.
Another concern was the head motion, which may affect the PLE and SD calculations for BOLD signals. We thereby calculated the PLE and SD for the head motion Euclidean norm time series. Comparing to anesthetic state, the PLE of head motion was larger in awake state (t = 4.2, p = .001), but the SD of head motion showed no difference (t = 1.3, p = .22). The correlations between PLE and SD for head motion in awake and anesthetic state showed opposite patterns, with a positive correlation in awake state (r = .53, p = .051) and a negative correlation in anesthetic state (r = −.24, p = .41). No correlation was observed between BOLD signal and head motion in PLE or SD in awake state (PLE: r = .02, p = .95; SD: r = .26, p = .37), whereas significant correlations of those were seen in anesthetic state (PLE: r = .51, p = .06; SD: r = .68, p = .007). Finally, after regressing out the PLE and SD of head motion, the PLE and SD of BOLD signal remained significant different for awake vs. anesthetic states (PLE: t = 2.36, p = .035; SD: t = 2.45, p = .029). Together, these results made it rather unlikely that our main findings were due to head motion.
4. DISCUSSION
We investigated the LRTCs and temporal variability by resting‐state fMRI in subjects during both awake and anesthetic states. Our results demonstrate that (a) both LRTCs (as indexed by PLE) and temporal variability (as measured by SD) displayed a global decrease across the whole brain in anesthetic state, which is consistent with previous observations (Huang et al., 2016; Tagliazucchi et al., 2016); (b) PLE and SD decoupled from each other in the anesthetic state; (c) PLE spatial pattern no longer correlated between awake and anesthetic states, while positive correlation was preserved for SD. Our results suggest that PLE and SD have different physiological grounds with specifically scale‐free activity (as measured by PLE), which indexes temporo‐spatial nestedness (Northoff & Huang, 2017), showing special relevance for maintaining level of consciousness.
4.1. Role of PLE and SD in anesthesia and consciousness
Our findings show for the first time differential roles of PLE and SD for the level/state of consciousness. First and foremost, the loss of consciousness observed in the anesthetic state seems to be characterized by the reduction in both PLE and SD measures which is in accordance with previous results (Tagliazucchi et al., 2016). Our findings extend previous findings by showing that the spatial pattern of specifically PLE changes during anesthetic states, whereas that is not the case in SD (Figure 7).
Figure 7.
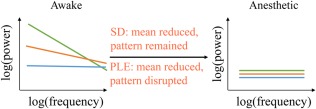
Schematic illustrations of how the PLE and SD reduced in anesthetic. In awake state, regions with higher SD reveal higher PLE. SD reduces with pattern unchanged while PLE reduces and becomes homogeneous across the whole brain [Color figure can be viewed at http://wileyonlinelibrary.com]
The PLE characterizes the relationship between different timescales of brain regions, a critical local feature that describes the relevance of the temporal hierarchy of different timescales for integrating information (Chaudhuri, Knoblauch, Gariel, Kennedy, & Wang, 2015). Due to their higher PLE indexing stronger power in slow frequencies, the prefrontal and other association cortices generate slower dynamics when compared with primary sensory cortex (Chaudhuri et al., 2015; Hasson, Yang, Vallines, Heeger, & Rubin, 2008). Hence, the spatial organization of various cortical regions and networks can be characterized by different timescales which amounts to a hierarchy of timescales (Chaudhuri et al., 2015; Murray et al., 2014).
We here extended previous results by showing the hierarchical timescales are not only defined by their anatomic structure, but altered across states (Figures 4d and 5). The disrupted spatial organization of PLE during the anesthetic state may correspond to disruption in information integration across different time scales, which leads to the breakdown of information processing in unconscious state. In other words, the PLE and its spatial pattern refer to what is described as “nestedness,” that is, temporo‐spatial nestedness that may serve as neural predisposition of consciousness (Northoff, 2013; Northoff & Heiss, 2015).
Taken together, our findings demonstrate for the first time that such hierarchy of time scales and their spatial relationship across the various cortical regions is crucially important for the level/state of consciousness. In the awake state, we observed a close spatial coupling (across brain regions) between the temporal structure (as indexed by PLE) and temporal variability (as indexed by SD). Our correlation findings in both intra‐ and intersubject results demonstrate that such temporo‐spatial coupling is central for the state/level of consciousness as the spatial distribution of temporal hierarchy (as indexed by voxel‐based correlation of PLE) is lost in anesthesia.
The timescales of the brain activity can also be described by SD in slow and fast frequencies. We therefore tested the spatial similarity of SD of Slow‐5 and Slow‐4 (Figure 6). Despite the fact that Slow‐5 provides a significantly larger contribution to PLE than Slow‐4 (Figure 2b), the change in PLE's spatial pattern during anesthetic state was not accompanied by the changes in the relationship between Slow‐5 and Slow‐4. This suggests that instead of having a major role for a single frequency band, it is the temporal structure itself, that is, the organization of neural activity as indexed in PLE, that is central for the level/state of consciousness.
Our results thus support differential roles of temporal variability and nestedness in level/state of consciousness. A certain level of temporal nestedness may provide the structure which—as suggested by our data—are central for maintaining the level/state of consciousness. In contrast, temporal variability itself may take on a different role as its spatial structure was preserved during anesthesia. Tentatively, one may hypothesize that temporal nestedness provides a necessary condition of possible consciousness, that is, a neural predisposition of consciousness (NPC: Northoff, 2013; Northoff & Huang, 2017), which is mediated by the brain's spontaneous activity. Whereas temporal variability may rather be a sufficient neural condition, a neural correlate of consciousness (NCC) (Crick & Koch, 2003). However, to show that, one may need to investigate task‐evoked activity which we did not do in this study. Future studies may therefore combine the measurement of resting state activity PLE with temporal variability during task‐evoked activity.
4.2. Beyond drug‐specific effects: Reduction of LRTCs and temporal variability in the anesthetic state
We observed that the anesthetic state correlated with a global reduction of PLE as well as of SD. This is consistent with a recent study on propofol‐induced anesthetic state (Tagliazucchi et al., 2016). We thus confirm previous results and extend the existing evidence by demonstrating similar global reductions in both propofol‐induced and sevoflurane‐induced loss of consciousness. Therefore, we suggest that reduction in PLE and SD is not a drug‐specific effect but is rather related to the modulation of state of consciousness through a common underlying yet unclear physiological mechanism.
Given that both propofol and sevoflurane modulate the excitatory‐inhibitory balance across the whole brain (Franks, 2006; Hales & Lambert, 1991; Hemmings et al., 2005; Krasowski & Harrison, 1999; Tomlin et al., 1998), we suggest that the excitatory‐inhibitory balance may play an essential role in determining the PLE values. In line with our study, a neural modeling study reports the important role of excitatory‐inhibitory balance in modulating the timescales of firing rate (Chaudhuri et al., 2015). However, given the different origins of signals across modalities, further studies are warranted for revealing the direct relationship between excitatory‐inhibitory balance for fMRI signal through both empirical and theoretical approaches.
4.3. Methodological issues
As simultaneous recording for other physiological signal like the cardiac and respiration rates was not performed in this study, we cannot exclude the potential influence of these signals on LRTCs and temporal variability measures. Nevertheless, a study investigating neuronal mechanisms of propofol‐induced anesthesia reports that reduction of LRTCs and temporal variability are unlikely to be due to these physiological signals (Tagliazucchi et al., 2016).
Another limitation is the frequency range used to investigate the LRTCs and the temporal variability. LRTCs implies scale free, therefore a frequency range above 0.1 Hz would also worth investigating. In this study, we choose to investigate LRTCs and temporal variability within the 0.01–0.1 Hz range, given that the neural function has been extensively investigated within this range. Also, neural signal below 0.1 Hz fitted better to power‐law function as revealed by previous fMRI studies (He, 2011), which indicates less artificial noise within this range. Furthermore, the practical concern of the frequency of respiration, which operating at a frequency above 0.1 Hz is another reason for which we limit our investigation to frequencies below 0.1 Hz.
5. CONCLUSIONS
We here investigate state‐dependent alteration of LRTCs and temporal variability and their relationship during awake and anesthetic states. Our results reveal a global reduction of both LRTCs and temporal variability in the anesthetic state. Additionally, to our knowledge, this is the first report of a state‐dependent relationship between LRTCs and temporal variability. Both variables correlate with each other in the awake state, whereas that is no longer the case in anesthetic state as evidenced by the divergence of their spatial patterns. Taken together, our results suggest that PLE and SD are different and, at least in part, independent measures which is in line with their underlying theoretical mathematical models. Moreover, our results hint upon a special relevance of spatiotemporal structure, that is, temporo‐spatial nestedness as indexed by scale‐free activity, for the level/state of consciousness. Our data thus support the recent hypothesis of temporo‐spatial nestedness being a core mechanism of consciousness, that is, a neural predisposition of consciousness (NPC) as suggested in the temporo‐spatial theory of consciousness (Northoff & Huang, 2017).
Supporting information
Additional Supporting Information may be found online in the supporting information tab for this article.
Supporting Information
ACKNOWLEDGMENTS
We thank Binke Yuan for suggestions on data analyses. This research was supported by the Medical Guidance Supporting Project from Shanghai Municipal Science and Technology Committee (to Jun Zhang, No. 17411961400), the EJLB‐Michael Smith Foundation, the Canada Institute of Health Research (CIHR), the Hope of Depression Foundation (HDRF), and the Start‐up Research Grant in Hangzhou Normal University (to Georg Northoff). We declare no conflict of interest for all authors.
Zhang J, Huang Z, Chen Y, et al. Breakdown in the temporal and spatial organization of spontaneous brain activity during general anesthesia. Hum Brain Mapp. 2018;39:2035–2046. 10.1002/hbm.23984
Contributor Information
Zirui Huang, Email: Dr.Zirui.Huang@gmail.com.
Jun Zhang, Email: snapzhang@aliyun.com.
REFERENCES
- Biswal, B. , Zerrin Yetkin, F. , Haughton, V. M. , & Hyde, J. S. (1995). Functional connectivity in the motor cortex of resting human brain using echo‐planar MRI. Magnetic Resonance in Medicine, 34, 537–541. [DOI] [PubMed] [Google Scholar]
- Bullmore, E. , Long, C. , Suckling, J. , Fadili, J. , Calvert, G. , Zelaya, F. , … Brammer, M. (2001). Colored noise and computational inference in neurophysiological (fMRI) time series analysis: Resampling methods in time and wavelet domains. Human Brain Mapping, 12, 61–78. [DOI] [PMC free article] [PubMed] [Google Scholar]
- Buzsáki, G. , & Draguhn, A. (2004). Neuronal oscillations in cortical networks. Science (New York, N.Y.), 304, 1926–1929. [DOI] [PubMed] [Google Scholar]
- Chai, X. J. , Castanon, A. N. , Ongur, D. , & Whitfield‐Gabrieli, S. (2012). Anticorrelations in resting state networks without global signal regression. NeuroImage, 59, 1420–1428. [DOI] [PMC free article] [PubMed] [Google Scholar]
- Chaudhuri, R. , Knoblauch, K. , Gariel, M. A. , Kennedy, H. , & Wang, X. J. (2015). A large‐scale circuit mechanism for hierarchical dynamical processing in the primate cortex. Neuron, 88, 419–431. [DOI] [PMC free article] [PubMed] [Google Scholar]
- Chernik, D. A. , Gillings, D. , Laine, H. , Hendler, J. , Silver, J. M. , Davidson, A. B. , … Siegel, J. L. (1990). Validity and reliability of the Observer's Assessment of Alertness/Sedation Scale: Study with intravenous midazolam. Journal of Clinical Psychopharmacology, 10, 244–251. [PubMed] [Google Scholar]
- Cox, R. W. (1996). AFNI: Software for analysis and visualization of functional magnetic resonance neuroimages. Computers and Biomedical Research, 29, 162–173. [DOI] [PubMed] [Google Scholar]
- Crick, F. , & Koch, C. (2003). A framework for consciousness. Nature Neuroscience, 6, 119–126. [DOI] [PubMed] [Google Scholar]
- Fox, M. D. , & Raichle, M. E. (2007). Spontaneous fluctuations in brain activity observed with functional magnetic resonance imaging. Nature Reviews Neuroscience, 8, 700–711. [DOI] [PubMed] [Google Scholar]
- Franks, N. P. (2006). Molecular targets underlying general anaesthesia. British Journal of Pharmacology, 147(Suppl 1), S72–S81. [DOI] [PMC free article] [PubMed] [Google Scholar]
- Garrett, D. D. , Kovacevic, N. , McIntosh, A. R. , & Grady, C. L. (2010). Blood oxygen level‐dependent signal variability is more than just noise. Journal of Neuroscience, 30, 4914–4921. [DOI] [PMC free article] [PubMed] [Google Scholar]
- Garrett, D. D. , Kovacevic, N. , McIntosh, A. R. , & Grady, C. L. (2011). The importance of being variable. Journal of Neuroscience, 31, 4496–4503. [DOI] [PMC free article] [PubMed] [Google Scholar]
- Gruber, M. H. J. (1997). Statistical digital signal processing and modeling. Technometrics, 39, 335–336. [Google Scholar]
- Hales, T. G. , & Lambert, J. J. (1991). The actions of propofol on inhibitory amino acid receptors of bovine adrenomedullary chromaffin cells and rodent central neurones. British Journal of Pharmacology, 104, 619–628. [DOI] [PMC free article] [PubMed] [Google Scholar]
- Han, Y. , Wang, J. , Zhao, Z. , Min, B. , Lu, J. , Li, K. , … Jia, J. (2011). Frequency‐dependent changes in the amplitude of low‐frequency fluctuations in amnestic mild cognitive impairment: A resting‐state fMRI study. NeuroImage, 55, 287–295. [DOI] [PubMed] [Google Scholar]
- Hasson, U. , Yang, E. , Vallines, I. , Heeger, D. J. , & Rubin, N. (2008). A hierarchy of temporal receptive windows in human cortex. Journal of Neuroscience, 28, 2539–2550. [DOI] [PMC free article] [PubMed] [Google Scholar]
- He, B. J. (2011). Scale‐free properties of the functional magnetic resonance imaging signal during rest and task. Journal of Neuroscience, 31, 13786–13795. [DOI] [PMC free article] [PubMed] [Google Scholar]
- He, B. J. (2014). Scale‐free brain activity: Past, present, and future. Trends in Cognitive Sciences, 18, 480–487. [DOI] [PMC free article] [PubMed] [Google Scholar]
- He, B. J. , Zempel, J. M. , Snyder, A. Z. , & Raichle, M. E. (2010). The temporal structures and functional significance of scale‐free brain activity. Neuron, 66, 353–369. [DOI] [PMC free article] [PubMed] [Google Scholar]
- Hemmings, H. C., Jr. , Akabas, M. H. , Goldstein, P. A. , Trudell, J. R. , Orser, B. A. , & Harrison, N. L. (2005). Emerging molecular mechanisms of general anesthetic action. Trends in Pharmacological Sciences, 26(10), 503. [DOI] [PubMed] [Google Scholar]
- Huang, Z. , Dai, R. , Wu, X. , Yang, Z. , Liu, D. , Hu, J. , … Northoff, G. (2014a). The self and its resting state in consciousness: An investigation of the vegetative state. Human Brain Mapping, 35, 1997–2008. [DOI] [PMC free article] [PubMed] [Google Scholar]
- Huang, Z. , Wang, Z. , Zhang, J. , Dai, R. , Wu, J. , Li, Y. , … Northoff, G. (2014b). Altered temporal variance and neural synchronization of spontaneous brain activity in anesthesia. Human Brain Mapping, 35, 5368–5378. [DOI] [PMC free article] [PubMed] [Google Scholar]
- Huang, Z. , Zhang, J. , Longtin, A. , Dumont, G. , Duncan, N. W. , Pokorny, J. , … Weng, X. (2015). Is there a nonadditive interaction between spontaneous and evoked activity? Phase‐dependence and its relation to the temporal structure of scale‐free brain activity. Cerebral Cortex, bhv288. [DOI] [PubMed] [Google Scholar]
- Huang, Z. , Zhang, J. , Wu, J. , Qin, P. , Wu, X. , Wang, Z. , … Northoff, G. (2016). Decoupled temporal variability and signal synchronization of spontaneous brain activity in loss of consciousness: An fMRI study in anesthesia. NeuroImage, 124, 693–703. [DOI] [PubMed] [Google Scholar]
- Hurst, H. E. (1951). Long‐term storage capacity of reservoirs. Transactions of the American Society of Civil Engineers, 116, 770–808. [Google Scholar]
- Katoh, T. , & Ikeda, K. (1998). The effects of fentanyl on sevoflurane requirements for loss of consciousness and skin incision. Anesthesiology, 88, 18–24. [DOI] [PubMed] [Google Scholar]
- Krasowski, M. D. , & Harrison, N. L. (1999). General anaesthetic actions on ligand‐gated ion channels. Cellular and Molecular Life Sciences, 55, 1278–1303. [DOI] [PMC free article] [PubMed] [Google Scholar]
- Lei, X. , Wang, Y. , Yuan, H. , & Chen, A. (2015). Brain scale‐free properties in awake rest and NREM sleep: A simultaneous EEG/fMRI study. Brain Topography, 28, 292–304. [DOI] [PubMed] [Google Scholar]
- Martino, M. , Magioncalda, P. , Huang, Z. , Conio, B. , Piaggio, N. , Duncan, N. W. , … Northoff, G. (2016). Contrasting variability patterns in the default mode and sensorimotor networks balance in bipolar depression and mania. Proceedings of the National Academy of Sciences of the United States of America, 113, 4824–4829. [DOI] [PMC free article] [PubMed] [Google Scholar]
- Murray, J. D. , Bernacchia, A. , Freedman, D. J. , Romo, R. , Wallis, J. D. , Cai, X. , … Lee, D. (2014). A hierarchy of intrinsic timescales across primate cortex. Nature Neuroscience, 17, 1661–1663. [DOI] [PMC free article] [PubMed] [Google Scholar]
- Northoff, G. (2013). Unlocking the brain: Volume 2: Consciousness. Oxford University Press. [Google Scholar]
- Northoff, G. , & Heiss, W.‐D. (2015). Why is the distinction between neural predispositions, prerequisites, and correlates of the level of consciousness clinically relevant? Stroke, 46, 1147–1151. [DOI] [PubMed] [Google Scholar]
- Northoff, G. , & Huang, Z. (2017). How do the brain's time and space mediate consciousness and its different dimensions? Temporo‐spatial theory of consciousness (TTC). Neuroscience & Biobehavioral Reviews, 80, 630–645. [DOI] [PubMed] [Google Scholar]
- Ramsay, M. A. , Savege, T. M. , Simpson, B. R. , & Goodwin, R. (1974). Controlled sedation with alphaxalone‐alphadolone. British Medical Journal, 2, 656–659. [DOI] [PMC free article] [PubMed] [Google Scholar]
- Stoica, P. , & Moses, R. L. (1997). Introduction to spectral analysis. Prentice Hall Upper Saddle River. [Google Scholar]
- Tagliazucchi, E. , Chialvo, D. R. , Siniatchkin, M. , Amico, E. , Brichant, J. F. , Bonhomme, V. , … Laureys, S. (2016). Large‐scale signatures of unconsciousness are consistent with a departure from critical dynamics. Journal of the Royal Society, Interface, 13, 20151027. [DOI] [PMC free article] [PubMed] [Google Scholar]
- Tagliazucchi, E. , von Wegner, F. , Morzelewski, A. , Brodbeck, V. , Jahnke, K. , & Laufs, H. (2013). Breakdown of long‐range temporal dependence in default mode and attention networks during deep sleep. Proceedings of the National Academy of Sciences of the United States of America, 110, 15419–15424. [DOI] [PMC free article] [PubMed] [Google Scholar]
- Talairach, J. , & Tournoux, P. (1988). Co‐planar stereotaxic atlas of the human brain. 3‐Dimensional proportional system: an approach to cerebral imaging.
- Tomlin, S. L. , Jenkins, A. , Lieb, W. R. , & Franks, N. P. (1998). Stereoselective effects of etomidate optical isomers on gamma‐aminobutyric acid type A receptors and animals. Anesthesiology, 88, 708–717. [DOI] [PubMed] [Google Scholar]
- Welch, P. D. (1967). The use of fast Fourier transform for the estimation of power spectra: A method based on time averaging over short, modified periodograms. IEEE Transactions on Audio and Electroacoustics, 15, 70–73. [Google Scholar]
- Yu, R. , Chien, Y. L. , Wang, H. L. S. , Liu, C. M. , Liu, C. C. , Hwang, T. J. , … Tseng, W. Y. I. (2014). Frequency‐specific alternations in the amplitude of low‐frequency fluctuations in schizophrenia. Human Brain Mapping, 35, 627–637. [DOI] [PMC free article] [PubMed] [Google Scholar]
- Zhang, D. , & Raichle, M. E. (2010). Disease and the brain's dark energy. Nature Reviews. Neurology, 6, 15–28. [DOI] [PubMed] [Google Scholar]
- Zou, Q. H. , Zhu, C. Z. , Yang, Y. , Zuo, X. N. , Long, X. Y. , Cao, Q. J. , … Zang, Y. F. (2008). An improved approach to detection of amplitude of low‐frequency fluctuation (ALFF) for resting‐state fMRI: Fractional ALFF. Journal of Neuroscience Methods, 172, 137–141. [DOI] [PMC free article] [PubMed] [Google Scholar]
- Zuo, X. N. , Di Martino, A. , Kelly, C. , Shehzad, Z. E. , Gee, D. G. , Klein, D. F. , … Milham, M. P. (2010). The oscillating brain: Complex and reliable. NeuroImage, 49, 1432–1445. [DOI] [PMC free article] [PubMed] [Google Scholar]
Associated Data
This section collects any data citations, data availability statements, or supplementary materials included in this article.
Supplementary Materials
Additional Supporting Information may be found online in the supporting information tab for this article.
Supporting Information