

Abstract
Recent studies have demonstrated resting‐state abnormalities in midline regions in vegetative state/unresponsive wakefulness syndrome and minimally conscious state patients. However, the functional implications of these resting‐state abnormalities remain unclear. Recent findings in healthy subjects have revealed a close overlap between the neural substrate of self‐referential processing and the resting‐state activity in cortical midline regions. As such, we investigated task‐related neural activity during active self‐referential processing and various measures of resting‐state activity in 11 patients with disorders of consciousness (DOC) and 12 healthy control subjects. Overall, the results revealed that DOC patients exhibited task‐specific signal changes in anterior and posterior midline regions, including the perigenual anterior cingulate cortex (PACC) and posterior cingulate cortex (PCC). However, the degree of signal change was significantly lower in DOC patients compared with that in healthy subjects. Moreover, reduced signal differentiation in the PACC predicted the degree of consciousness in DOC patients. Importantly, the same midline regions (PACC and PCC) in DOC patients also exhibited severe abnormalities in the measures of resting‐state activity, that is functional connectivity and the amplitude of low‐frequency fluctuations. Taken together, our results provide the first evidence of neural abnormalities in both the self‐referential processing and the resting state in midline regions in DOC patients. This novel finding has important implications for clinical utility and general understanding of the relationship between the self, the resting state, and consciousness. Hum Brain Mapp 35:1997–2008, 2014. © 2013 Wiley Periodicals, Inc.
Keywords: coma, vegetative state, minimally conscious state, fMRI, self‐referential processing, resting state, disorders of consciousness, functional connectivity, low‐frequency fluctuations, cortical midline regions
Abbreviations
- BOLD
blood–oxygen‐level dependent
- CRS‐R
Coma Recovery Scale‐Revised
- fMRI
functional magnetic resonance imaging
INTRODUCTION
Elucidating the neural correlates of consciousness has long been an important area of research interest for cognitive neuroscientists [Block, 2005; Boly et al., 2008; Crick and Koch, 1998; Hohwy, 2009; Tononi, 2005; Tononi and Koch, 2008]. Examining patients with disorders of consciousness (DOC) provides an opportunity to investigate consciousness at different levels (for a review, see Laureys and Schiff, 2011), for example in a state of coma, vegetative state (VS; also referred to as unresponsive wakefulness syndrome; UWS), and minimally conscious state (MCS) [Laureys et al., 2010]. These patients are defined by a loss or severe deficit in consciousness, as measured by awareness of the environment and the self [Laureys, 2005; Laureys et al., 2007]. DOC patients have been reported to exhibit neural alterations in the resting state, particularly in cortical midline structures, indicating abnormally low functional connectivity (FC) [Boly et al., 2009; Cauda et al., 2009; Vanhaudenhuyse et al., 2010] and effective connectivity [Rosanova et al., 2012]. Interestingly, this deficit in resting‐state FC is reported to be directly proportional to the degree of consciousness [Vanhaudenhuyse et al., 2010]. These data suggest severe resting‐state abnormalities in the VS. However, the temporal dynamics of resting‐state activity, such as the amplitude of low‐frequency fluctuations (ALFF) [Kannurpatti and Biswal, 2008; Zang et al., 2007] and standard deviation (SD) of neural activity changes across time [Garrett et al., 2011], remain to be thoroughly investigated. Importantly, the functional implications of abnormalities in the resting state remain unclear.
Studies in healthy subjects have indicated that midline regions involved in the resting state strongly overlap with regions recruited during self‐referential processing [D'Argembeau et al., 2005; Qin and Northoff, 2011; Schneider et al., 2008; Whitfield‐Gabrieli et al., 2011]. Although several studies have investigated passive listening to subjects' own name during EEG and functional magnetic resonance imaging (fMRI) recording [Qin et al., 2008, 2010], an active task‐requirement and a proper control condition (non‐self‐referential) is necessary to test for proper neural processing in the resting‐state network, and the associated neuronal recruitment and modulation. This is particularly important, given recent reports that some DOC patients exhibit retained cognitive capacity, such as initiating mental imagery [Bardin et al., 2011, 2012; Cruse et al., 2011, 2012; Goldfine et al., 2011; Monti et al., 2010; Owen et al., 2006]. However, it is currently unclear how these findings relate to self‐referential processing, resting‐state activity, and consciousness in DOC patients.
The aim of this study was to investigate active self‐referential processing and resting‐state activity in DOC patients. Specifically, we hypothesized (i) that the neural response to self‐referential stimuli in the midline regions would be present though abnormally reduced in DOC patients; based on the findings of Qin et al. (2010) and Vanhaudenhuyse et al. (2010), we expected a particularly strong link between neural responses in midline brain regions and the level of consciousness, and (ii) that the abnormal brain responses while processing self‐referential tasks may be related to impairments not only in the spatial domain but also with temporal abnormalities in neuronal measures of resting state activity, for example lower ALFF and SD within the midline regions.
As such, we conducted an active self‐referential processing paradigm. We first validated the paradigm in healthy participants to identify brain regions associated with self‐referential processing, and conducted several control and validation analyses to confirm active task participation in DOC patients. This allowed us to test abnormal signal changes for DOC patients compared with healthy participants. Next, we examined the correlation between the neural activity changes and the level of consciousness. ALFF, FC, and SD in the resting state were further investigated using whole‐brain and region of interest analysis, focusing on the regions exhibiting abnormal activity during the self‐referential task. We also tested whether stimulus‐induced activity could be predicted by the resting‐state activity.
MATERIALS AND METHODS
Participants and Patients
Experiments were performed in 12 healthy control subjects (four females, 23–30 years old) and 11 patients (six VS and five MCS). Table 1 summarizes the demographic and clinical characteristics of the patients. The Ethics Committees of Shanghai Huashan Hospital approved the study, and written informed consent was obtained from the healthy volunteers and from the patients' legal representatives. The patients with DOC were selected as a convenience sample. For each patient, clinical examination was repeatedly performed using standardized CRS‐R assessments [Giacino et al., 2004] on the day of scanning, and every 3 weeks after scanning.
Table 1.
Clinical and demographic characteristics and the CRS‐R scores of the DOC patients
| On the day of fMRI scanning | Follow‐up accessment | ||||||||||||
|---|---|---|---|---|---|---|---|---|---|---|---|---|---|
| Patient | Age/gender | Etiology of injury | Time of fMRI (days after insult) | Auditory Scale | Visual Scale | Motor Scale | Oromotor/Verbal Scale | Communication Scale | Arousal Scale | Total Score | Months after scan | Total score | Diagnosis |
| VS1 | 37/M | TBI | 301 | 1—Auditory startle | 1—Visual startle | 2—Flexion withdrawal | 0—None | 0—None | 2—Eye opening without stimulation | 6 | 5.5 | 6 | VS |
| VS2 | 51/M | TBI | 100 | 1—Auditory startle | 0—None | 2—Flexion withdrawal | 0—None | 0—None | 1—Eye opening with stimulation | 4 | 4.5 | 7 | VS |
| VS3 | 23/M | HIE | 244 | 0—None | 0—None | 2—Flexion withdrawal | 1—Oral reflexive | 0—None | 1—Eye opening with stimulation | 4 | 4.5 | 7 | VS |
| VS4 | 48/M | SIH | 78 | 1—Auditory startle | 1—Visual startle | 2—Flexion withdrawal | 0—None | 0—None | 2—Eye opening without stimulation | 6 | 2 | 8 | VS |
| VS5 | 58/M | TBI | 83 | 1—Auditory startle | 1—Visual startle | 2—Flexion withdrawal | 1—Oral reflexive | 0—None | 2—Eye opening without stimulation | 7 | 2 | 10 | MCS |
| VS6 | 8/M | Drowning, post‐CPR | 65 | 1—Auditory startle | 1—Visual startle | 2—Flexion withdrawal | 1—Oral reflexive | 0—None | 2—Eye opening without stimulation | 7 | 2 | 8 | MCS |
| MCS1 | 78/M | TBI | 211 | 1—Auditory startle | 2—Fixation | 2—Flexion withdrawal | 1—Oral reflexive | 0—None | 1—Eye opening with stimulation | 7 | 4.5 | 9 | MCS |
| MCS2 | 47/M | SIHHemophilia | 79 | 2—Localization to sound | 2—Fixation | 2—Flexion withdrawal | 1—Oral reflexive | 0—None | 2—Eye opening without stimulation | 9 | 2 | 11 | MCS |
| MCS3 | 66/M | HIH | 280 | 2—Localization to sound | 3—Pursuit eye movements | 2—Flexion withdrawal | 1—Oral reflexive | 0—None | 2—Eye opening without stimulation | 10 | 2 | 23 | EMCS |
| MCS4 (MCS+) | 30/M | TBI | 26 | 1—Auditory startle | 1—Visual startle | 5—Automatic motor response | 1—Oral reflexive | 1—Nonfunctional | 3—Attention | 12 | 2 | 23 | EMCS |
| MCS5 | 39/F | TBI | 36 | 2—Localization to sound | 3—Pursuit eye movements | 3—Localization to pain | 1—Oral reflexive | 0—None | 2—Eye opening without stimulation | 11 | 2 | 12 | MCS |
Note: The MCS+ describes high‐level behavioral responses (i.e., command following, intelligible verbalizations, or nonfunctional communication) (Bruno et al., 2011).
Abbreviations: VS, vegetative state; MCS, minimally conscious state; EMCS, emergence of the minimally conscious state; CRS‐R, Coma Recovery Scale‐Revised; TBI, traumatic brain injury; HIE, hypoxic ischaemic encephalopathy, SIH, spontaneous intracerebral hemorrhage; HIH, hypertensive intracerebral hemorrhage.
Interview for Healthy Volunteers and Patients' Family Members
A questionnaire was used to collect subject's self‐referential (autobiographical) information, such as hobbies, birthdays, and places visited. Based on the questionnaire results, 20 self‐referential questions (e.g., “Have you been to Beijing?”) were selected by the interviewer. Twenty nonself‐referential questions (simple‐fact) were selected from a large question set based on judgments from 20 additional participants about the clarity of the questions and certainty of their answers (e.g., “Is one minute 60 seconds?”). All of the questions contained 5–12 Chinese characters. Half of the questions expected a “Yes” response and the other half expected a “No” response. All questions were presented to the patients' family members to check whether they believed the patients could answer them without any doubt, ambiguity, or confusion. The family members were asked to identify any questions they thought might be unclear for patients, and to suggest more suitable questions. At the end of the interview, the family members were required to read all 40 questions aloud. Each of the questions was digitally recorded into an audio clip lasting for 2 s, and was presented four times in different fMRI scan sessions (except for patient VS6 who was an 8‐year‐old boy whose father deemed the nonself‐referential questions to be too difficult for him to answer, and hence the nonself‐referential questions were replaced by self‐referential questions). All the questions for healthy volunteers were read aloud and recorded (as described above) by an experimenter speaking in Mandarin.
fMRI Scan Procedure
During the fMRI scan, a resting‐state fMRI scan lasting for 6 min was first performed, followed by four fMRI runs for an “active auditory question task.” The task used an event‐related design (Supporting Information Fig. S2). For each run, 20 self‐referential and 20 nonself‐referential questions (40 trials in total) were delivered in a pseudo‐random order. Each audio clip was presented in 2 s and followed by a variable silent period (8, 10, and 12 s) of delay. All subjects were instructed to silently answer the questions and fixate on a central cross on a computer screen throughout the whole experiment. Patients' heads were padded with spongy cushions to keep their visual field directed toward the screen. All stimuli were programmed using E‐Prime (Psychology Software Tools, Pittsburgh, PA) and delivered via an audiovisual stimulus presentation system designed for an MRI environment. The volume of the headphones was adjusted to the comfort level of the normal subjects. For patients, the volume was set at the comfort level of one of the researchers.
Data Acquisition
A Siemens 3T scanner (except for Subject 1 and VS1, who were scanned on a 3T GE scanner) with a standard head coil was used to acquire gradient‐echo EPI images of the whole brain (33 slices, repetition time/echo time [TR/TE] = 2,000/30 ms, slice thickness = 5 mm, field of view = 210 mm, flip angle = 90°, image matrix: 64 × 64). In total, 180 scans (6 min) were acquired in the resting run, and 244 scans (8 min 8 s) were acquired in each of the task runs. In addition, high‐resolution anatomical images were acquired for all the subjects and patients.
Data Analysis
General linear model analysis for the auditory question task
Preprocessing steps were implemented in AFNI (Cox, 1996; http://afni.nimh.nih.gov/afni). The functional images from each run were aligned (head motion correction), slice timing corrected, temporally standardized, spatially smoothed (6 mm), and transformed into Talaraich space [Talairach and Tournoux, 1988], and linear trends were removed. The issue of motion artifacts was addressed rigorously, as minor group differences in motion have been shown to artifactually create between group differences [Power et al., 2012, Van Dijk et al., 2012]. For this reason, the magnitude of head motion at each time point for six parameters (three for shift and three for rotation) was obtained for each fMRI run and each subject. The averaged head motion parameter and SD for shift and rotation were then calculated [Zang et al., 2007]. Runs with head motion (shift or rotation) exceeding +4 SDs were excluded from further analysis. Using this criterion, one run for the auditory question task (four runs) was excluded from further analysis for patients VS1, VS5, VS6, MCS2, and MCS4, and all of patient MCS5's data were excluded. The task runs were then concatenated. Further, the number of “outliers” for the data at each time point was calculated to tag the outliers of global signal intensity and motion. The head motion above 0.5 mm per‐TR, and TRs with outliers more than 10% were to be censored for the following first‐level general linear model (GLM) analysis. The above motion/artifact rejection procedures significantly reduced the group differences in motion (Supporting Information Fig. S1).
Individual‐subject GLM analyses were conducted with two regressors representing the “self‐referential” (denoted with “self”) and “nonself‐referential” (denoted with “nonself”) conditions, respectively. With the estimated regression coefficients (betas), we examined four contrasts between conditions, namely “self versus Baseline,” “nonself versus Baseline,” “self versus nonself,” and “(self + nonself) versus Baseline.” For the healthy subjects, group‐level random‐effect analyses were conducted to generate activation maps corresponding to the four contrasts. Two‐sample t‐tests were used to examine the group‐level differences between healthy subjects and patients on each of the above contrasts with age as a covariate (irrelevant factor) to control potential aging effects. All resulting t‐maps were thresholded at a corrected P‐value of 0.05 (multiple‐comparison error was corrected using Monte Carlo simulation).
Resting‐state analysis
The same preprocessing steps for the task runs were applied to the resting‐state data. The data were then filtered with a band‐pass filter reserving signals between 0.01 and 0.1 Hz, which is thought to reflect mainly neuronal fluctuations [Biswal et al., 1995; Fox and Raichle, 2007; Zhang and Raichle, 2010]. We also focused on two separate bands within the range of 0.01–0.1 Hz: Slow‐5 (0.01–0.027 Hz) and Slow‐4 (0.027–0.073 Hz) [Buzsaki and Draguhn, 2004; Han et al., 2011; Hoptman et al., 2010; Zuo et al., 2010]. For a given voxel, we calculated the averaged square root of the power spectrum to yield a measure of the amplitude of ALFFs [Zang et al., 2007; Zuo et al., 2010] for each frequency range (i.e., 0.01–0.1 Hz, Slow‐5 and Slow‐4), respectively. The ALFF of each voxel was further divided by the global mean value to reduce the potential global effects of variability across participants [Han et al., 2011; Zang et al., 2007]. The resulting ALFF maps for each subject were tested in two‐sample t‐tests (with age and motion as irrelevant factors) to examine the group differences between healthy subjects and patients for each frequency band. The SDs of the resting state's BOLD signal changes were also compared between groups for each frequency range as the BOLD signal variability has been suggested as an indicator of cognitive deficit [Garrett et al., 2011].
FC was computed between the averaged time series of a given seed region and all voxels in the brain for the above frequency ranges (i.e., 0.01–0.1 Hz, Slow‐5 and Slow‐4), respectively. The estimated head motion and the mean time series from the white mater and the cerebrospinal fluid were used as covariates in the correlation computation [Fox et al., 2005; Saad et al., 2012]. The FC maps from individual subjects were then transformed to the Fisher's Z for group‐level t‐tests with age and motion as irrelevant factors.
The resting‐state measures (i.e., ALFF, FC, and SD) for each patient were correlated with their signal changes (self vs. nonself) during the task by a voxel‐based Pearson correlation analysis. All the aforementioned voxel‐based results were thresholded at corrected P < 0.05.
RESULTS
Behavioral Data
The data from longitudinal behavioral assessments (CRS‐R) are summarized in Table 1. Patients VS5 and VS6 exhibited clinical improvement and were classified as MCS 2 months after the fMRI study. Patients MCS3 and MCS4 recovered 2 months after the fMRI, and were able to repeatedly follow a command to move and verbally answer to their names.
fMRI Results
Self‐referential processing
To validate the paradigm, we first tested it in healthy group for the midline regions (Supporting Information Figs. S3 and S4) and then tested the participation of the healthy subjects and patients (Supporting Information Fig. S5), as well as signal changes in the auditory cortex (Supporting Information Fig. S6) and language‐related regions (e.g., the Broca's and Wernicke's areas) (Supporting Information Figs. S7 and S8). We also excluded the possible major anatomical deficits particularly with cortical midline structures in the DOC patients (Supporting Information Fig. S9). After the abovementioned validation, we compared the two groups for the self versus nonself contrast with age as an irrelevant factor. The contrast revealed significant activation differences in the perigenual anterior cingulate cortex (PACC) and posterior cingulate cortex (PCC) (Fig. 1 and Supporting Information Table S1). To exclude the potential motion artifacts for minor group comparison [Van Dijk et al., 2012], we checked our data by adding the motion parameters as a nuisance regressor. We found the results still hold (Supporting Information Fig. S10), indicating the rigorously motion/artifact rejection during data analysis had mostly exclude motion as a confounding factor for group analysis. These results were further confirmed by analyzing the regions of interests (ROIs) defined by the healthy group's result (Supporting Information Fig. S3). In DOC patients, only the PCC exhibited significant activation. The observed activation in MCS patients was greater than that in VS patients (Fig. 1; also for individual results, see Supporting Information Fig. S11). As the PACC and PCC are core regions of the midline structures, they were defined as ROIs for future analyses.
Figure 1.
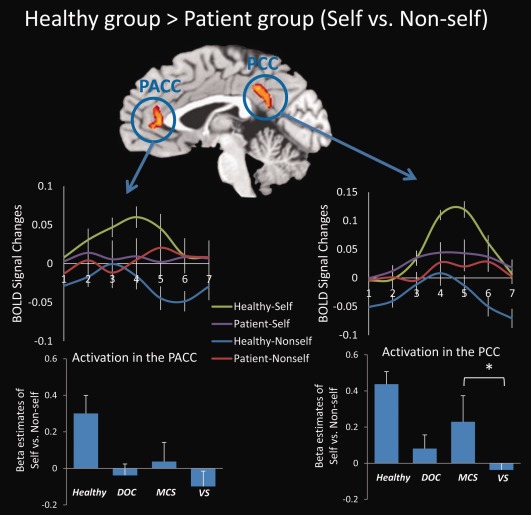
Brain regions exhibiting significantly greater activation in healthy subjects compared with DOC patients during self‐ versus nonself‐referential tasks. Significant activation differences in the PACC and PCC were observed for healthy group > patient group (self vs. nonself). The results were thresholded at corrected P < 0.05. The BOLD curves were extracted from the PACC and the PCC ROIs for each subject for an averaged trial with a 12‐s (six time points) time window (from 1 to 7 time points on the horizontal axis) (mean ± S.E.). The onset of the stimulus begins at the time point 2. The bar graphs depict the β estimates of the “self vs. nonself” for the ROIs (mean ± S.E.) in healthy subjects (n = 12), DOC group (n = 9), MCS subgroup (n = 4), and VS/UWS subgroup (n = 5). The MCS subgroup showed stronger activation in the PCC as compared with the VS/UWS subgroup (P = 0.046). No analyses were conducted between healthy and patient groups to exclude the “double‐dipping” problem. *P < 0.05.
To investigate the relationship between the neural response and the level of consciousness in DOC patients, we correlated the signal changes (β estimates) from the contrast “self versus nonself” with total CRS‐R scores, using a cross‐subject Spearman correlation analysis of abnormal ROIs (i.e., PACC and PCC). As a result, significant positive correlations were observed in the PACC (r 2 = 0.66, P = 0.004) (Fig. 2, and Supporting Information Fig. S12). The larger the signal changes in the PACC during the self‐referential compared with the nonself‐referential condition, the higher the degree of consciousness in DOC patients. We did not observe significant correlations with CRS‐R total scores in either the PCC or the MPFC (defined by the healthy group results). It is important to note that two MCS patients (MCS3 and MCS4) with the highest signal changes in the PACC recovered 2 months after the fMRI, indicating its predict value (Fig. 2).
Figure 2.
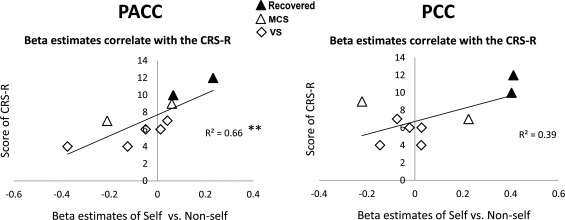
Correlation between signal changes (self vs. nonself) and level of consciousness measured by the CRS‐R total scores. A significant positive correlation was observed in the PACC (r 2 = 0.66, P = 0.004, Spearman correlation), whereas no correlation was observed in the PCC. **P < 0.01. The correlation in the PACC was further confirmed by excluding maximum and minimum values (Supporting Information Fig. S12). Note that two MCS patients (MCS3 and MCS4) with the highest signal changes in the PACC recovered 2 months after the fMRI, indicating its predict value. The 2‐month changes of the CRS‐R total scores for the two patients are from 10 to 23 (MCS3), and from 12 to 23 (MCS4).
To examine whether the BOLD signal changes in the PACC is task‐specific (the neural correlates of self‐consciousness) or task‐unspecific (potentially a general metabolic/functional deficit), respectively, we also included the auditory cortex, Wernicke's and Broca's areas as control regions for the above correlation analysis. As a result, significant positive correlation between signal changes (self vs. nonself) and level of consciousness was observed only in the PACC (Supporting Information Fig. S13). On the contrary, the auditory cortex shows significant positive correlation only between signal changes (self + nonself vs. baseline) and level of consciousness, and the Wernicke's and Broca's areas showed marginal significance. Taken together, this dissociation demonstrated the regional and task specificity of the PACC.
Resting state
For the whole‐brain analysis, reduced ALFF and FC were observed in the midline regions including the PACC, MPFC, and PCC in the DOC patient group compared with those of the healthy group (with age included as an irrelevant factor) (Fig. 3). The midline regions identified during the self‐referential task (i.e., PACC and PCC) overlapped with the ones obtained from the group difference of ALFF and FC in the resting state (Fig. 3). We analyzed the SDs of resting‐state activity as a relatively analogous measure, revealing similar results (Supporting Information Fig. S14). This finding further confirmed the ALFF results.
Figure 3.
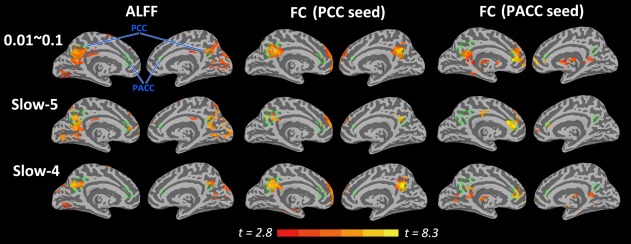
The inflated cortical surfaces showing the whole‐brain analysis for healthy group > DOC patient group for the ALFF and FC in the resting state. The green lines indicate the border of the two ROIs (i.e., PACC and PCC) identified during the self‐referential task, which are mapped onto the resulting t‐maps of the resting‐state measures (ALFF and FC). Note that the ROIs in the task overlap with the abnormal regions detected by the ALFF and FC in the resting state. For FC, the PACC and PCC were chosen as seed regions. All t‐maps were thresholded at corrected P < 0.05. The color bar shows voxel‐wise t‐value.
A significant positive correlation between the β estimates of self versus nonself during the task and ALFFs (0.01–0.1 Hz) in the resting state was found in the precuneus (closely adjacent to the PCC and cuneus) in the DOC patient group (Fig. 4). This result was further confirmed by an ROI approach (r = 0.72, P = 0.028), and a correlation analysis between self versus nonself and SDs (Supporting Information Fig. S15). No correlations were observed between the self versus nonself contrast and the FC.
Figure 4.
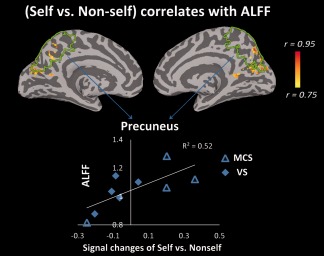
Correlation between signal changes (self vs. nonself) during the task and ALFFs in the resting state for the DOC patient group. Using a voxel‐based correlation analysis, a significant positive correlation between the β estimates of self versus nonself during the task and ALFFs of the resting state was observed in the precuneus, which is closely adjacent to the PCC and cuneus. The correlation map was thresholded at corrected P < 0.05. The color bar shows voxel‐wise r‐value. This result was further confirmed using an ROI approach (r = 0.72, P = 0.028, Pearson correlation), in which the precuneus was anatomically defined (indicated by the green lines).
As self‐referential processing in the midline structures has been reported to strongly overlap with high resting‐state activity in these regions [D'Argembeau et al., 2005; Qin and Northoff, 2011; Schneider et al., 2008; Whitfield‐Gabrieli et al., 2011], we investigated the resting state separately in our sample. We first examined ALFF in our ROIs (i.e., PACC and PCC). The results revealed that ALFF among DOC patients was significantly lower in Slow‐5 (P = 0.005) in the PACC, and lower in both Slow‐5 (P = 0.016) and Slow‐4 (P < 0.001) in the PCC of DOC patients compared with that in the healthy group (Fig. 5; also for ALFF spectrum, see Supporting Information Fig. S16). It should be noted that ALFF in the MCS group was higher in Slow‐5 (P = 0.045) in the PCC, compared with that in the VS group. These results were further confirmed by analyzing the ROIs defined by the healthy group's result (Supporting Information Fig. S17). These findings suggest a reduction in ALFF in the midline regions in DOC patients.
Figure 5.
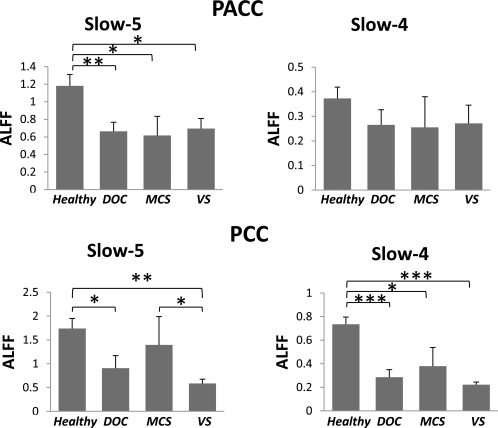
Comparison of the mean ALFFs in the resting state between healthy and patient groups. ALFFs (mean ± S.E.) in the healthy group (n = 12), DOC group (n = 10), MCS subgroup (n = 4), and VS/UWS subgroup (n = 6) were compared. *P < 0.05, **P < 0.01, and ***P < 0.001.
In addition to ALFF, we also investigated FC within the abnormal frequency bands in midline regions. FC between ROIs in the midline (i.e., PACC‐to‐PCC) was compared between healthy subjects and patients in Slow‐5 and Slow‐4. The results revealed that the patient group exhibited significantly reduced FC of PACC‐to‐PCC compared with the healthy group in Slow‐4 (P = 0.015) (Fig. 6). A similar result was observed when the frequency band was filtered to 0.01–0.1 Hz (P = 0.013) (Fig. 6). The MCS group also exhibited stronger FC in the range of 0.01–0.1Hz than the VS group (P = 0.049). To further test our findings, the FC of PACC‐to‐PCC and MPFC‐to‐PCC (ROIs defined by the control group's results) was also compared between groups in the same manner. The results again revealed significantly reduced FC in the patient group in both PACC‐to‐PCC and MPFC‐to‐PCC connectivity (Supporting Information Fig. S18).
Figure 6.
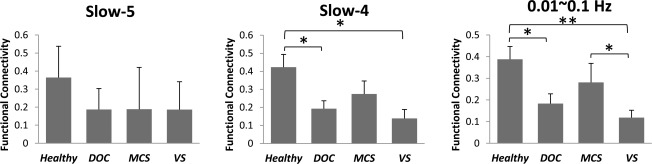
Comparison of the FC (PACC‐to‐PCC) in the resting state between healthy and patient groups. FC (mean ± S.E.) in the healthy group (n = 12), DOC group (n = 10), MCS subgroup (n = 4), and VS/UWS subgroup (n = 6) was compared. *P < 0.05, **P < 0.01, and ***P < 0.001.
DISCUSSION
The current results revealed that, at the group level, DOC patients exhibit reduced cortical responses compared with healthy controls during active self‐referential processing in anterior and posterior midline regions. The magnitude of cortical responses in the anterior midline regions (e.g., PACC) was significantly correlated with DOC patients' degree of consciousness. The PACC also showed regional and task specificity, indicating its crucial role as the neural correlates of self‐consciousness. The same midline regions displayed major resting‐state abnormalities as manifested by reduced ALFF, FC, and SD of signal changes. In addition, the results revealed that ALFF (and SD) in the precuneus during the resting state predicted signal changes in the same region during the self‐referential task in DOC patients. Taken together, these novel findings demonstrate a close relationship between the self, the resting state, and the consciousness in anterior and posterior cortical midline structures in DOC patients. Importantly, these results extend current knowledge about the neural correlates of DOC and our understanding of the relationship between the consciousness and the self.
In healthy volunteers, our paradigm elicited stronger signal changes in the MPFC, PACC, and PCC while answering self‐referential compared with nonself‐referential questions. This finding is in accordance with the previous studies of the neural correlates of the self in healthy subjects [Northoff and Bermpohl, 2004; Northoff and Panksepp, 2008; Northoff et al., 2006 a meta‐analysis; Sajonz et al., 2010; Whitfield‐Gabrieli et al., 2011].
For DOC patients, although the results revealed task‐specific signal changes, the magnitude of differentiation between different types of task‐related signal changes (e.g., self‐ and nonself‐referential) was significantly reduced, particularly in midline regions. This finding is in accordance with a previous fMRI study in which DOC patients' passively listened to their own names, revealing analogous signal reductions [Qin et al., 2010]. The present results significantly extend these previous findings, by introducing an active task component. Our results also support the notion that a minority of DOC patients may be able to perform active cognitive elaboration of content, such as motor imagery or spatial navigation [Bardin et al., 2012; Monti et al., 2010; Owen et al., 2006]. This study extends this notion beyond mental imagery, demonstrating that DOC patients are also able to refer to specific content, such as questions about themselves.
The results also revealed that MCS patients exhibited greater signal differentiation between self‐ and nonself‐referential questions compared with VS patients. This finding was confirmed by a significant correlation between signal changes in the PACC and the degree of consciousness as measured by the CRS‐R, such that greater differences in signal changes between self‐ and nonself‐referential tasks in the PACC were correlated with a higher degree of patients' consciousness. Importantly, this correlation was not observed in other regions such as the PCC, auditory cortex, Wernicke's and Broca's areas, whereas the auditory cortex shows significant positive correlation between signal changes (self + nonself vs. baseline) and level of consciousness, and the Werniche's and Broca's areas also showed a correlation tendency. Taken together, this dissociation demonstrated the regional and task specificity of the PACC, which plays a crucial role as the neural correlates of self‐consciousness, rather than potentially a general functional deficit as observed in the auditory cortex, Wernicke's and Broca's areas which is in a task unspecific manner (self + nonself vs. baseline).
Self‐referential activity in the PACC may thus “drive” the degree of consciousness in noncommunicative patients. These results confirm and extend the findings of a previous report of a relatively analogous correlation between consciousness and midline activity during processing of DOC patients' own names under passive conditions [Qin et al., 2010]. The current results also have clinical relevance tentatively, as two patients with the highest signal changes in the PACC recovered 2 months after the fMRI by our follow‐up behavioral study. The finding that midline neural activity during self‐referential processing specifically, rather than merely general cognitive processing [Coleman et al., 2007, 2009], may serve as a predictive marker of consciousness.
In addition to self‐referential abnormalities, we also observed deficits in various resting‐state measures in the midline regions in DOC patients. Specifically, we found that ALFF, FC, and SDs within midline regions, including the PACC, MPFC, and PCC, differed between DOC patients and healthy subjects. As predicted for midline FC, our results confirmed a previous finding reported by Vanhaudenhuyse et al. (2010), and are in accordance with a more recent EEG‐TMS study, reporting a deficit of cortical effective connectivity in patients with DOC [Rosanova et al., 2012]. Specifically, the current results revealed that the resting‐state FC of the MPFC/PACC‐to‐PCC was significantly lower for the patient group compared with the control group. In addition, we extended the previous findings by showing other important measures of resting‐state activity, that is ALFF [Kannurpatti and Biswal, 2008; Zang et al., 2007] and SD [Garrett et al., 2011] were also abnormal in DOC patients. Finally, we observed a particularly strong link between task‐induced signal changes (self vs. nonself) and resting‐state activity (ALFF and SD) in the precuneus in the patient group. This suggests that greater ALFF (or SD) in the resting state may be correlated with greater differentiation between self and nonself.
The whole‐brain and ROI analysis indicated that resting‐state abnormalities occurred in regions similar to those showing reduced signal differentiation during self‐ and nonself‐referential tasks. This suggests a close relationship between resting‐state abnormalities and reduced task‐related signal differentiation in midline regions in DOC patients. Such neural overlap extends previous observations of the close relationship between self and rest in healthy subjects [D'Argembeau et al., 2005; Qin and Northoff, 2011; Schneider et al., 2008; Whitfield‐Gabrieli et al., 2011]. The reduced ALFF, FC, and SD that we observed suggest a decreased propensity of resting‐state activity to exhibit neural activity changes during self‐referential tasks. In turn, this may lead to decreased differentiation of neural responses to different stimuli and tasks, as observed in this study. However, future studies are needed to specifically investigate the neuronal mechanisms underlying the neuronal propensity in the resting‐state to stimulus‐ or task‐related activity changes in both healthy and DOC subjects. These studies may elucidate the neural underpinnings of the resting‐state itself [He and Raichle, 2009], and its neuronal reactivity may predispose the subsequent association of stimuli and task with consciousness [Northoff, 2013a,b].
Given the small sample size in this study, our preliminary results warrant larger‐scale (multicenter) longitudinal studies in future. In addition, as the age of DOC patients in our study ranged from 8 to 78, it was difficult to recruit a closely age‐matched healthy control group. However, age was used as a covariate (irrelevant factor) for each group comparison (t‐test) in our statistical analyses. Moreover, a previous study reported that self‐referencing in elderly individuals elicited a pattern of activity similar to that observed among young people, involving a network of cortical midline regions [Gutchess et al., 2007]. Taken together with these findings, this suggests that our group comparison results were unlikely to be owing to aging effects.
CONCLUSIONS
Our findings indicate that DOC patients may show a residual level of self‐referential processing in anterior and posterior midline regions, including the PACC and the PCC, though the degree of signal differentiation between self‐ and nonself‐referential tasks was significantly diminished compared with that of healthy control subjects. The significant positive correlation that we observed between signal changes in the PACC and the level/degree of consciousness suggests that the anterior midline regions (i.e., PACC) play an important role in the neural substrate of consciousness, which is of high clinical relevance. Furthermore, our findings suggest that task‐related abnormalities in midline regions may be closely related to deficits in spatial (i.e., FC) and temporal (i.e., ALFF) measures of resting‐state activity. Decreased neuronal reactivity in midline regions is in accordance with the task‐related decrease in signal differentiation that we observed. Taken together with the previous findings, the current results have important implications for the clinical utility of self‐referential and resting‐state measures as predictive markers, and for understanding the neural basis of the self and consciousness, in general.
Supporting information
Supplementary Information
ACKNOWLEDGMENT
The authors thank Dr. Pengmin Qing for his comments. The authors declare no conflict of interests for all authors.
REFERENCES
- Bardin JC, Fins JJ, Katz DI, Hersh J, Heier LA, Tabelow K, Dyke JP, Ballon DJ, Schiff ND, Voss HU (2011): Dissociations between behavioural and functional magnetic resonance imaging‐based evaluations of cognitive function after brain injury. Brain 134:769–782. [DOI] [PMC free article] [PubMed] [Google Scholar]
- Bardin JC, Schiff ND, Voss HU (2012): Pattern classification of volitional functional magnetic resonance imaging responses in patients with severe brain injury. Arch Neurol 69:176–181. [DOI] [PubMed] [Google Scholar]
- Biswal B, Yetkin FZ, Haughton VM, Hyde JS (1995): Functional connectivity in the motor cortex of resting human brain using echo‐planar MRI. Magn Reson Med 34:537–541. [DOI] [PubMed] [Google Scholar]
- Block N (2005): Two neural correlates of consciousness. Trends Cogn Sci 9:46–52. [DOI] [PubMed] [Google Scholar]
- Boly M, Phillips C, Tshibanda L, Vanhaudenhuyse A, Schabus M, Dang‐Vu TT, Moonen G, Hustinx R, Maquet P, Laureys S (2008): Intrinsic brain activity in altered states of consciousness. Ann N Y Acad Sci 1129:119–129. [DOI] [PMC free article] [PubMed] [Google Scholar]
- Boly M, Tshibanda L, Vanhaudenhuyse A, Noirhomme Q, Schnakers C, Ledoux D, Boveroux P, Garweg C, Lambermont B, Phillips C, Luxen A, Moonen G, Bassetti C, Maquet P, Laureys S (2009): Functional connectivity in the default network during resting state is preserved in a vegetative but not in a brain dead patient. Hum Brain Mapp 30:2393–2400. [DOI] [PMC free article] [PubMed] [Google Scholar]
- Bruno MA, Vanhaudenhuyse A, Thibaut A, Moonen G, Laureys S (2011): From unresponsive wakefulness to minimally conscious PLUS and functional locked‐in syndromes: Recent advances in our understanding of disorders of consciousness. J Neurol 258:1373–1384. [DOI] [PubMed] [Google Scholar]
- Buzsaki G, Draguhn A (2004): Neuronal oscillations in cortical networks. Science 304:1926–1929. [DOI] [PubMed] [Google Scholar]
- Cauda F, Micon BM, Sacco K, Duca S, D'Agata F, Geminiani G, Canavero S (2009): Disrupted intrinsic functional connectivity in the vegetative state. J Neurol Neurosurg Psychiatry 80:429–431. [DOI] [PubMed] [Google Scholar]
- Coleman MR, Rodd JM, Davis MH, Johnsrude IS, Menon DK, Pickard JD, Owen AM (2007): Do vegetative patients retain aspects of language comprehension? Evidence from fMRI. Brain 130:2494–2507. [DOI] [PubMed] [Google Scholar]
- Coleman MR, Bekinschtein T, Monti MM, Owen AM, Pickard JD (2009): A multimodal approach to the assessment of patients with disorders of consciousness. Prog Brain Res 177:231–248. [DOI] [PubMed] [Google Scholar]
- Cox RW (1996): AFNI: Software for analysis and visualization of functional magnetic resonance neuroimages. Comput Biomed Res 29:162–173. [DOI] [PubMed] [Google Scholar]
- Crick F, Koch C (1998): Consciousness and neuroscience. Cereb Cortex 8:97–107. [DOI] [PubMed] [Google Scholar]
- Cruse D, Chennu S, Chatelle C, Bekinschtein TA, Fernández‐Espejo D, Pickard JD, Laureys S, Owen AM (2011): Bedside detection of awareness in the vegetative state: A cohort study. Lancet 378:2088–2094. [DOI] [PubMed] [Google Scholar]
- Cruse D, Chennu S, Chatelle C, Fernández‐Espejo D, Bekinschtein TA, Pickard JD, Laureys S, Owen AM (2012): Relationship between etiology and covert cognition in the minimally conscious state. Neurology 78:816–822. [DOI] [PMC free article] [PubMed] [Google Scholar]
- D'Argembeau A, Collette F, Van der Linden M, Laureys S, Del Fiore G, Degueldre C, Luxen A, Salmon E (2005): Self‐referential reflective activity and its relationship with rest: A PET study. Neuroimage 25:616–624. [DOI] [PubMed] [Google Scholar]
- Fox MD, Raichle ME (2007): Spontaneous fluctuations in brain activity observed with functional magnetic resonance imaging. Nat Rev Neurosci 8:700–711. [DOI] [PubMed] [Google Scholar]
- Fox MD, Snyder AZ, Vincent JL, Corbetta M, Van Essen DC, Raichle ME (2005): The human brain is intrinsically organized into dynamic, anticorrelated functional networks. Proc Natl Acad Sci USA 102:9673–9678. [DOI] [PMC free article] [PubMed] [Google Scholar]
- Garrett DD, Kovacevic N, McIntosh AR, Grady CL (2011): The importance of being variable. J Neurosci 31:4496–4503. [DOI] [PMC free article] [PubMed] [Google Scholar]
- Giacino JT, Kalmar K, Whyte J (2004): The JFK Coma Recovery Scale‐Revised: Measurement characteristics and diagnostic utility. Arch Phys Med Rehabil 85:2020–2029. [DOI] [PubMed] [Google Scholar]
- Goldfine AM, Victor JD, Conte MM, Bardin JC, Schiff ND (2011): Determination of awareness in patients with severe brain injury using EEG power spectral analysis. Clin Neurophysiol 122:2157–2168. [DOI] [PMC free article] [PubMed] [Google Scholar]
- Gutchess AH, Kensinger EA, Schacter DL (2007): Aging, self‐referencing, and medial prefrontal cortex. Soc Neurosci 2:117–133. [DOI] [PubMed] [Google Scholar]
- Han Y, Wang J, Zhao Z, Min B, Lu J, Li K, He Y, Jia J (2011): Frequency‐dependent changes in the amplitude of low‐frequency fluctuations in amnestic mild cognitive impairment: A resting‐state fMRI study. Neuroimage 55:287–295. [DOI] [PubMed] [Google Scholar]
- He BJ, Raichle ME (2009): The fMRI signal, slow cortical potential and consciousness. Trends Cogn Sci 13:302–309. [DOI] [PMC free article] [PubMed] [Google Scholar]
- Hohwy J (2009): The neural correlates of consciousness: New experimental approaches needed?. Conscious Cogn 18:428–438. [DOI] [PubMed] [Google Scholar]
- Hoptman MJ, Zuo XN, Butler PD, Javitt DC, D'Angelo D, Mauro CJ, Milham MP (2010): Amplitude of low‐frequency oscillations in schizophrenia: A resting state fMRI study. Schizophr Res 117:13–20. [DOI] [PMC free article] [PubMed] [Google Scholar]
- Kannurpatti SS, Biswal BB (2008): Detection and scaling of task‐induced fMRI‐BOLD response using resting state fluctuations. Neuroimage 40:1567–1574. [DOI] [PMC free article] [PubMed] [Google Scholar]
- Laureys S (2005): The neural correlate of (un) awareness: Lessons from the vegetative state. Trends Cogn Sci 9:556–559. [DOI] [PubMed] [Google Scholar]
- Laureys S, Schiff ND (2011): Coma and consciousness: Paradigms (re)framed by neuroimaging. Neuroimage 61:478–491. [DOI] [PubMed] [Google Scholar]
- Laureys S, Perrin F, Brédart S (2007): Self‐consciousness in non‐communicative patients. Conscious Cogn 16:722–741. [DOI] [PubMed] [Google Scholar]
- Laureys S, Celesia GG, Cohadon F, Lavrijsen J, León‐Carrión J, Sannita WG, Sazbon L, Schmutzhard E, von Wild KR, Zeman A, Dolce G (2010): Unresponsive wakefulness syndrome: A new name for the vegetative state or apallic syndrome. Biomed Chromatogr Med 8:68. [DOI] [PMC free article] [PubMed] [Google Scholar]
- Monti MM, Vanhaudenhuyse A, Coleman MR, Boly M, Pickard JD, Tshibanda L, Owen AM, Laureys S (2010): Willful modulation of brain activity in disorders of consciousness. N Engl J Med 362:579–589. [DOI] [PubMed] [Google Scholar]
- Northoff G (2013a): Unlocking the Brain, Vol. I: Coding. New York: Oxford University Press; (in press). [Google Scholar]
- Northoff G (2013b): Unlocking the Brain, Vol. II: Consciousness. New York: Oxford University Press; (in press). [Google Scholar]
- Northoff G, Bermpohl F (2004): Cortical midline structures and the self. Trends Cogn Sci 8:102–107. [DOI] [PubMed] [Google Scholar]
- Northoff G, Panksepp J (2008): The trans‐species concept of self and the subcortical‐cortical midline system. Trends Cogn Sci 12:259–264. [DOI] [PubMed] [Google Scholar]
- Northoff G, Heinzel A, de Greck M, Bermpohl F, Dobrowolny H, Panksepp J (2006): Self‐referential processing in our brain—A meta‐analysis of imaging studies on the self. Neuroimage 31:440–457. [DOI] [PubMed] [Google Scholar]
- Owen AM, Coleman MR, Boly M, Davis MH, Laureys S, Pickard JD (2006): Detecting awareness in the vegetative state. Science 313:1402. [DOI] [PubMed] [Google Scholar]
- Power JD, Barnes KA, Snyder AZ, Schlaggar BL, Petersen SE (2012): Spurious but systematic correlations in functional connectivity MRI networks arise from subject motion. Neuroimage 59:2142–2154. [DOI] [PMC free article] [PubMed] [Google Scholar]
- Qin P, Northoff G (2011): How is our self related to midline regions and the default‐mode network? Neuroimage 57:1221–1233. [DOI] [PubMed] [Google Scholar]
- Qin P, Di H, Yan X, Yu S, Yu D, Laureys S, Weng X (2008): Mismatch negativity to the patient's own name in chronic disorders of consciousness. Neurosci Lett 448:24–28. [DOI] [PubMed] [Google Scholar]
- Qin P, Di H, Liu Y, Yu S, Gong Q, Duncan N, Weng X, Laureys S, Northoff G (2010): Anterior cingulate activity and the self in disorders of consciousness. Hum Brain Mapp 31:1993–2002. [DOI] [PMC free article] [PubMed] [Google Scholar]
- Rosanova M, Gosseries O, Casarotto S, Boly M, Casali AG, Bruno MA, Mariotti M, Boveroux P, Tononi G, Laureys S, Massimini M (2012): Recovery of cortical effective connectivity and recovery of consciousness in vegetative patients. Brain 135:1308–1320. [DOI] [PMC free article] [PubMed] [Google Scholar]
- Saad ZS, Gotts SJ, Murphy K, Chen G, Jo HJ, Martin A, Cox RW (2012): Trouble at rest: How correlation patterns and group differences become distorted after global signal regression. Brain Connect 2:25–32. [DOI] [PMC free article] [PubMed] [Google Scholar]
- Sajonz B, Kahnt T, Margulies DS, Park SQ, Wittmann A, Stoy M, Ströhle A, Heinz A, Northoff G, Bermpohl F (2010): Delineating self‐referential processing from episodic memory retrieval: Common and dissociable networks. Neuroimage 50:1606–1617. [DOI] [PubMed] [Google Scholar]
- Schneider F, Bermpohl F, Heinzel A, Rotte M, Walter M, Tempelmann C, Wiebking C, Dobrowolny H, Heinze HJ, Northoff G (2008): The resting brain and our self: Self‐relatedness modulates resting state neural activity in cortical midline structures. Neuroscience 157:120–131. [DOI] [PubMed] [Google Scholar]
- Talairach J, Tournoux P (1988): Co‐planar stereotaxic atlas of the human brain. New York: Thieme Medical Publishers. [Google Scholar]
- Tononi G (2005): Consciousness, information integration, and the brain. Prog Brain Res 150:109–126. [DOI] [PubMed] [Google Scholar]
- Tononi G, Koch C (2008): The neural correlates of consciousness: An update. Ann N Y Acad Sci 1124:239–261. [DOI] [PubMed] [Google Scholar]
- Van Dijk KR, Sabuncu MR, Buckner RL (2012): The influence of head motion on intrinsic functional connectivity MRI. Neuroimage 59:431–438. [DOI] [PMC free article] [PubMed] [Google Scholar]
- Vanhaudenhuyse A, Noirhomme Q, Tshibanda LJ, Bruno MA, Boveroux P, Schnakers C, Soddu A, Perlbarg V, Ledoux D, Brichant JF, Moonen G, Maquet P, Greicius MD, Laureys S, Boly M (2010): Default network connectivity reflects the level of consciousness in non‐communicative brain‐damaged patients. Brain 133:161–171. [DOI] [PMC free article] [PubMed] [Google Scholar]
- Whitfield‐Gabrieli S, Moran JM, Nieto‐Castañón A, Triantafyllou C, Saxe R, Gabrieli JD (2011): Associations and dissociations between default and self‐reference networks in the human brain. Neuroimage 55:225–232. [DOI] [PubMed] [Google Scholar]
- Zang YF, He Y, Zhu CZ, Cao QJ, Sui MQ, Liang M, Tian LX, Jiang TZ, Wang YF (2007): Altered baseline brain activity in children with ADHD revealed by resting‐state functional MRI. Brain Dev 29:83–91. [DOI] [PubMed] [Google Scholar]
- Zhang DY, Raichle ME (2010): Disease and the brain's dark energy. Nat Rev Neurol 6:15–28. [DOI] [PubMed] [Google Scholar]
- Zuo XN, Di Martino A, Kelly C, Shehzad ZE, Gee DG, Klein DF, Castellanos FX, Biswal BB, Milham MP (2010): The oscillating brain: Complex and reliable. Neuroimage 49:1432–1445. [DOI] [PMC free article] [PubMed] [Google Scholar]
Associated Data
This section collects any data citations, data availability statements, or supplementary materials included in this article.
Supplementary Materials
Supplementary Information