

Abstract
Cognition involves coordinated activity across distributed neuronal networks. Neuronal activity during learning triggers cortical plasticity that allows for reorganization of the neuronal network and integration of new information. Animal studies have shown post‐learning reactivation of learning‐elicited neuronal network activity during subsequent sleep, supporting consolidation of the reorganization. However, no previous studies, to our knowledge, have demonstrated reactivation of specific learning‐elicited long‐range functional connectivity during sleep in humans. We here show reactivation of learning‐induced long‐range synchronization of magnetoencephalography power fluctuations in human sleep. Visuomotor learning elicited a specific profile of long‐range cortico‐cortical synchronization of slow (0.1 Hz) fluctuations in beta band (12–30 Hz) power. The parieto‐occipital part of this synchronization profile reappeared in delta band (1–3.5 Hz) power fluctuations during subsequent sleep, but not during the intervening wakefulness period. Individual differences in the reactivated synchronization predicted postsleep performance improvement. The presleep resting‐state synchronization profile was not reactivated during sleep. The findings demonstrate reactivation of long‐range coordination of neuronal activity in humans, more specifically of reactivation of coupling of infra‐slow fluctuations in oscillatory power. The spatiotemporal profile of delta power fluctuations during sleep may subserve memory consolidation by echoing coordinated activation elicited by prior learning. Hum Brain Mapp, 36:67–84, 2015. © 2014 Wiley Periodicals, Inc.
Keywords: learning, memory, plasticity, neuronal network reorganization, oscillations, reactivation, sleep, magnetoencephalography
INTRODUCTION
Behavior and cognition require the integration of multiple sources of information. Because the brain is functionally specialized, this integration can only arise through interregional communication [Varela et al., 2001]. Synchronization of oscillatory activity over long ranges has been proposed to support such communication [Jensen et al., 2007; Palva and Palva, 2012a,b.; Senkowski et al., 2008]. The coactivation of neuronal ensembles through oscillatory synchronization could strengthen their connections and induce Hebbian‐like learning [Cohen et al., 2011]. Sleep has been proposed as a suitable time window for unperturbed reactivation of long‐range synchronization and thus promotes the consolidation of distributed memory traces [Diekelmann and Born, 2010; Rasch and Born, 2007]. In support of this hypothesis, numerous animal studies have demonstrated reactivation of task‐induced synchronization of neuronal activity during subsequent sleep, both within and between brain areas [Dave and Margoliash, 2000; Hoffman and McNaughton, 2002a; Ji and Wilson, 2007; Johnson et al., 2010; Peyrache et al., 2009; Wilson and McNaughton, 1994].
Even though such reactivation of learning‐elicited long‐range synchronization during sleep is commonly regarded as a key mechanism underlying the favorable effect of sleep on learning in humans [Born et al., 2006; Clemens et al., 2007; Hoffman and McNaughton, 2002b], there is little experimental support for its existence in humans. Learning‐induced regional brain activation elicits the same regions to show, during subsequent sleep, enhanced electroencephalography (EEG) oscillatory power in the delta band (1–4 Hz) [Huber et al., 2004; Kattler et al., 1994] and higher regional blood flow, meausured with positron emission tomography (PET) [Peigneux et al., 2004]. However, these studies did not address whether coupling of activation over distant brain areas reoccurred during subsequent sleep. Learning was also shown to enhance coherence between distant EEG electrodes during subsequent sleep [Cantero et al., 2002; Mölle et al., 2004], but these studies did not disambiguate whether there was a nonspecific generalized increase in coherence or, as required to support the hypothesis, a specific spatial profile of increased coherence mirroring the long‐range synchronization that was induced by the task.
In this study, we set up to investigate whether long‐range coupling between distant brain areas induced by learning a novel task would result in the reactivation of the coupling between the same areas during sleep. In this context, long‐range synchronization of oscillatory activity might play a key role, as it might support the communication within a network of distributed brain regions [Palva and Palva, 2012a; Senkowski et al., 2008]. To elicit reliable long‐range synchronization of oscillatory activity in humans, this study used a visuomotor task. These tasks reliably elicit interregional synchronization, prominently in the beta frequency range (12–30 Hz) [Babiloni et al., 2006; Bassett et al., 2006; Classen et al., 1998; Kilner et al., 2004; Roelfsema et al., 1997; Witham et al., 2011]. Of the different methods to quantify long‐range synchronization, power–power correlation (PPC) [Bruns, 2004; de Pasquale et al., 2010; Hipp et al., 2012; Quilichini et al., 2010; Volgushev et al., 2011] have appeared to be more robust than phase‐based measures, such as phase‐locked index and coherence, especially for infra‐slow fluctuations [Brookes et al., 2011; de Pasquale et al., 2010], for analysis across frequency bands [Mazaheri et al., 2010, 2009] and in the presence of bidirectional coupling with variable phase relationship [Bruns et al., 2000].
Given these considerations, we here applied a visuomotor task to induce long‐range synchronization, quantified the specific spatial profile of PPCs in magnetoencephalography (MEG) oscillations and evaluated whether this profile of PPCs was reactivated during subsequent sleep. The approach demonstrated reactivation of specific, learning‐induced long‐range oscillatory coupling of oscillations during sleep in humans.
METHODS
Participants
Twelve healthy participants (six male, age range 19–27 years; 11 right‐handed), with normal or corrected‐to‐normal vision and no history of neurological disorder, took part in this study after given written informed consent. The protocol was according to the Declaration of Helsinki and was approved by the medical ethics committee of the VU University Medical Center, Amsterdam, The Netherlands.
Procedure
Participants were instructed to restrict their sleep to a maximum of 5 h the night before each session. A limit of 5 h was chosen as a compromise so that a low level of sleepiness would facilitate sleep during the MEG recordings, without jeopardizing the learning abilities, which have been observed to be reduced after complete sleep deprivation [Chee and Chuah, 2008; Drummond et al., 2000; Yoo et al., 2007]. During the experiment, they lay in a supine position. Head movements were restrained by foam pads. Brain activity was continuously recorded using MEG in the early afternoon while participants performed a mirror‐tracing (MT) task, based on previous findings [Balslev et al., 2004; Milner, 1962]. Periods of tracing were interleaved with periods of rest to obtain a wake resting‐state baseline control period within the same time‐frame as the MT task. Afterward, participants were given a period of up to 80 min for resting wakefulness and sleep (Fig. 1A). The MT task was repeated after the sleep period to assess whether individual differences in performance changes were associated with individual differences in brain activity. On a different day, in counterbalanced order, participants performed a control task, the face‐name association (FNA) task, again followed by a period of resting wakefulness and sleep. Stimuli were presented using E‐Prime 1.1 (Psychology Software Tools, Pittsburgh, PA).
Figure 1.
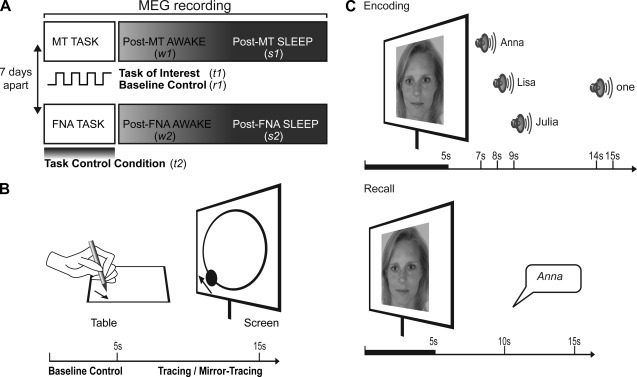
(A) MEG signal was acquired with 151 axial gradiometers while participants performed either the MT task or the task control condition, a FNA task and were subsequently asked to sleep while remaining in supine position for 80 min. Analyses were performed over the duration of the tasks, over the first 15 min of wakefulness and over the first 15 min after the onset of NREM Stage 2 sleep. In a counter‐balanced order, the procedure was repeated for the other task after 7 days. The numbers in italics indicate the periods that were analyzed: t1 was the MT task, r2 was the resting‐state baseline of the MT task, t2 was the FNA task, w1 and w2 were the periods of wakefulness following the MT task and the FNA task, respectively, and s1 and s2 were the sleep periods following the MT task and the FNA task respectively. (B) The task of interest was the MT task: Participants had to trace the outline of a projected circle as fast and accurately as possible by moving a pen on a graphics tablet to control the position of a projected dot. In half of the trials, the location of the dot was mirrored about the y‐axis. Participants were asked to rest during 5 s baseline periods alternating with tracing. This period was subsequently used to test that the activation was specific to task execution and was not present during the baseline resting‐state control condition. (C) The task control condition was the FNA task: During the encoding phase, participants observed 34 faces, each presented for 5 s. Two seconds after the disappearance of each face, three possible names and finally the number (1, 2, or 3) of the name to be remembered were given. During the recall phase, participants had to name each presented face.
MT Task and Resting‐State Baseline
During the MT task, participants used their left hand to move a pen on a digitizing tablet to control the location of a dot projected on the screen (Fig. 1B). They were instructed to move the dot along the outline of a projected circle as accurately and as fast as possible. The task included five blocks of 12 trials, each trial consisting of 5 s of resting baseline and 10 s of tracing. Trials alternated between normal tracing and mirror tracing, during which the coordinates of the dot relative to the pen location on the tablet were mirrored about the vertical axis. The alternation forced the participants to adapt the mapping between visual information and motor response at the beginning of each block. Because of this alternation and because the task was performed with the nondominant hand, the MT task was highly engaging and demanding, and the challenges associated with a successful task execution were expected to induce motor learning for both the normal and mirror tracing. All 10 s tracing periods were aggregated to determine the long‐range synchronization specifically elicited by the task while all 5 s periods in between were aggregated to provide a resting baseline control period within the same timeframe.
Control Task
The topographic profile of long‐range synchronization of power fluctuations that was specifically elicited by the MT task, that is, not general to the performance of any task, was obtained by comparing it with the profile elicited by a similarly demanding task known to involve different cortical areas. To accomplish this, participants performed a FNA control task (Fig. 1C) on a different day, in balanced order. The FNA task consisted of alternating phases of learning and recall [Takashima et al., 2006; Zeineh et al., 2003]. During the learning phase, one of the 34 faces appeared on the screen for 5 s, followed by an audio replay of three recorded names and after 5 more seconds, an auditory cue (one, two, or three) indicating which of the three names should be remembered. During the recall phase, the faces were presented one by one, and participants had to state the associated name. A selective reminding procedure was used to maximize memory encoding [Buschke, 1973]: the subsequent learning phases presented only those FNAs that were not remembered during the previous recall phase, until all associations had once been recalled correctly.
MEG Recording and Preprocessing
During all periods of task performance, baseline resting state, subsequent wake, and sleep, MEG signals were recorded with a whole‐head 151‐sensor axial gradiometer system (CTF Systems, Port Coquitlam, Canada) in a magnetically shielded room. Data were low‐pass filtered (anti‐aliasing filter cutoff at 80 Hz), sampled at 250 Hz, and stored digitally for off‐line data analysis. MEG data were quantitatively analyzed using FieldTrip [Oostenveld et al., 2011], a toolbox for the analysis of electrophysiological data based on MATLAB 7.9 (MathWorks, Natick, MA). Major artifacts (e.g., due to movement) were rejected manually, and independent component analysis (ICA) was used to remove artifact‐related components resulting from heart beats, eye movements, and eye blinks [Jung et al., 2000]. MEG recordings during the sleep opportunity window were also subjected to qualitative sleep stage scoring according to standard criteria [Rechtschaffen and Kales, 1968], performed by a qualified sleep clinician based on the MEG traces.
Overview of Analysis Procedures
We here explain the analysis procedures applied to investigate reactivation of task‐elicited long‐range coupling during subsequent resting wakefulness and sleep. First, PPCs were calculated between all sensor pairs to quantify the profile of synchronization of slow fluctuations in power. This procedure was performed to obtain, for each participant, seven separate profiles of PPCs, that is, for (t1) the MT task; (r1) resting‐state control baseline within the same timeframe of the MT task; (w1) post‐MT wakefulness; (s1) post‐MT sleep; (t2) FNA task; (w2) post‐FNA wakefulness; (s2) post‐FNA sleep (Fig. 1). Second, based on the statistical parameter mapping of t‐statistics, sensor pairs were identified with high PPCs expressed consistently over subjects selectively during one of these seven periods (e.g., MT task) but not during a corresponding reference period (e.g., FNA task). This procedure was applied to obtain the profiles of synchronization that were specific and consistent to (i) MT task versus FNA task (t1 > t2 selected pairs); (ii) resting‐state control baseline within the same timeframe of the MT task versus FNA task (r1 > t2 selected pairs); (iii) post‐MT wakefulness versus post‐FNA wakefulness (w1 > w2 selected pairs); (iv) post‐MT sleep versus post‐FNA sleep (s1 > s2 selected pairs).
Third, using nonparametric permutation analysis, we evaluated whether the sensor pairs with consistent high PPCs specific to the MT task (t1 > t2 selected pairs), were represented beyond chance level in the sensor pairs with consistent high PPCs specific to the post‐MT sleep period (s1 > s2 selected pairs). The null hypothesis was the independence of the t1 > t2 selected pairs and the s1 > s2 selected pairs.
The same approach was followed to evaluate overlap between sensor pairs that show consistent high PPCs specifically during the MT task (t1 > t2 selected pairs) and those that show consistent high PPCs specifically during the post‐MT wake period (w1 > w2 selected pairs). The null hypothesis was then independence of the t1 > t2 selection and the w1 > w2 selected pairs. In addition, we tested whether the coupling and recoupling were specific to sleep or could be secondary to the mere passage of time, and therefore prevalent during sleep, but not yet during presleep wakefulness.
A final permutation analysis evaluated possible confounds of reactivation during sleep of nonspecific prior synchronization, that is, not related to the actual learning of mirror tracing. The analysis furthermore evaluated whether the coupling observed in the t1 > t2 contrast was the result of increased coupling during the MT task rather than the result of a decrease in coupling during the control task. This analysis evaluated whether the sensor pairs with consistent high PPCs specific to the resting‐state control baseline within the same timeframe of the MT task (r1 > t2 selected pairs) exceeded chance level in the sensor pairs with consistent high PPCs specific to the post‐MT sleep period (s1 > s2 selected pairs). The null hypothesis was the independence of the r1 > t2 selected pairs and the s1 > s2 selected pairs.
Fourth, two approaches were taken to characterize the topography and underlying sources of the sensor pairs found to be reactivated in the analyses described above. The first approach investigated the degree of clustering in the spatial profile of the reactivated pairs at the sensor level. The second approach aimed to identify coupling between underlying cortical areas by application of ICA and source localization. This approach investigated whether indeed coupling and recoupling of independent cortical sources could underlie the coupling and recoupling of sensor‐pair clusters.
Finally, we evaluated the functional relevance of the coupling and recoupling to the individual differences in the improvement of task performance over the sleep period. The analysis procedures will be explained in detail below.
Beta Band PPCs During MT Task and FNA Task
Long‐range synchronization of slow fluctuations in the power of oscillations within specific frequency bands was calculated using PPC. MEG signals were divided in segments of 10 s, based on de Pasquale et al., [2010] and Liu et al., [2010]. A Hanning taper was applied to each segment to avoid an edge artifact. For each segment, the power spectrum was computed with the function fft in MATLAB and averaged over the beta band (12–30 Hz), because visuomotor tasks reliably induce long‐range coupling synchronization prominently in the beta frequency range [Babiloni et al., 2006; Bassett et al., 2006; Brovelli et al., 2004; Classen et al., 1998; Kilner et al., 2004; Witham et al., 2011]. Application of the planar gradient enhances the interpretation of the topography because the maximal signal on the computed planar gradient is above the sources that generate it [Hämäläinen and Ilmoniemi, 1993]. The power spectrum at each sensor was computed by summing the power spectra of the horizontal and vertical components of the planar gradient which were estimated from the magnetic fields of the axial sensor and its neighboring sensors [Bastiaansen and Knösche, 2000]. This procedure generates virtual planar sensors from the original axial sensors; for convenience, we will refer to the virtual planar sensors simply as sensors. Computing the Pearson's correlation of the power spectra between pairs of planar sensors resulted, for each subject and for both the MT task and the FNA task, in an N by M matrix, where N is the number of channels and M is the number of 10 s segments. For each matrix, correlation coefficients between channels were calculated to quantify the association between their slow fluctuations in power. Of the resulting symmetric N by N matrix of beta band PPC coefficients between all sensor pairs, the upper triangular part was used for further analysis and will be referred to as Ti,j where i is the subject index and j the index of the task (MT and FNA tasks; Fig. 2A,B).
Figure 2.
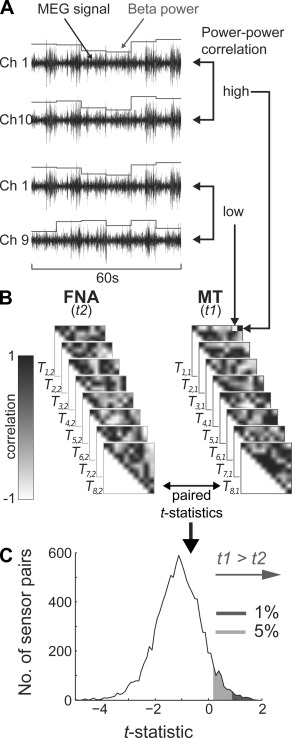
(A) Selection of sensor pairs with MT task‐specific power–power correlation. For each subject and task, the power spectral density of the planar gradient in the beta band (12–30 Hz) was calculated in 10 s epochs [de Pasquale et al., 2010], resulting in time series of power fluctuations. For illustration purposes, the MEG signal is already band‐pass filtered in the beta band. Correlations between power fluctuations PPC of two sensors can be high (e.g., between Channels 1 and 10) or low (e.g., between Channels 1 and 9). (B) Selection of the sensor pairs that correlated most specifically and consistently across subjects during the MT task (t1) by comparison with the task control condition (t2), as quantified using within‐subject paired t‐statistics. The higher the t‐statistics, the more specific and consistent the sensor pair shows correlated power fluctuations during the MT Task (t1 > t2). The PPC coefficients are stored in the Ti,j matrix, where i is the subject index and j is the task index. (C) Selection of sensor pairs with MT task‐specific power–power correlation. Distribution of the t‐statistics over all sensor pairs, obtained by comparing the two tasks (mean = −1.12, s.d. = 0.87). Sensor pairs with t‐statistics that lie in the upper 1% (red) and 5% (orange) of the distribution are most specifically correlated during the MT task (t1 > t2 selected pairs). Figure 3A shows their positions onto a topographical projection of the head. The same procedure was followed to determine the sensor pairs with the most specific post‐MT versus post‐FNA wake PPC (w1 > w2 selected pairs) and post‐MT versus post‐FNA sleep PPC (s1 > s2 selected pairs) in the frequency bands of beta, slow oscillation (0.5–1 Hz), delta (1–3.5 Hz), or sigma band (11–17 Hz).
Selection of PPCs Specific to the MT Task versus FNA Task
We subsequently identified the sensor pairs that, consistent over subjects, showed the most specific high correlations during the MT task (t1) as compared to the FNA task control condition (t2). For each sensor pair( n,n ) of the T matrix, we calculated a paired t‐statistic by comparing Ti,1 (the beta band PPC values for the MT task) against Ti,2 (the beta band PPC values for the FNA task control condition), as shown in Figure 2B. A high t‐statistic indicates that the sensor pair shows a consistently higher PPC across participants during the MT task relative to the FNA task control condition. We then selected the sensor pairs with the highest 5% t‐statistics to represent the t1 > t2 selection of pairs between which the beta band power fluctuations correlated most specifically and consistently during the MT task (Fig. 2C). This comparative procedure enables the detection of task‐selective long‐range coupling, because it eliminates spuriously high correlations due to sensor proximity and volume‐conduction, for which both tasks are equally sensitive. Because this analysis is only warranted if there are no differences in absolute power between conditions, we first confirmed that the power spectrum in the frequency bands of interest was not different between the MT condition and the FNA control condition.
Selection of PPCs Specific to Post‐MT Wake and Sleep
We followed the same procedure as described in the two paragraphs above to independently define the sensor pairs that were most strongly and consistently correlated during the post‐MT wake versus post‐FNA wake periods, and once more to define the sensor pairs that were most selectively and consistently correlated during the post‐MT sleep versus post‐FNA sleep periods. For the post‐task wake and sleep periods, selective coupling was evaluated in frequency bands selected a priori, based on consistent findings in the literature: not only in the beta band but also in the slow oscillation (0.5–1 Hz), delta (1–3.5 Hz), and sigma (where sleep spindle activity is concentrated: 11–17 Hz) bands. Slow oscillations and delta activity are the most characteristic signature of nonrapid eye movement (NREM) sleep [Achermann and Borbély, 1997; Amzica and Steriade, 1995; Amzica and Steriade, 1998; Steriade and McCarley, 2005] and are thought to facilitate memory consolidation [Diekelmann and Born, 2010; Poe et al., 2010; Van Der Werf et al., 2009]. Sleep spindles might play a similar role in memory consolidation [De Gennaro and Ferrara, 2003; Fogel and Smith, 2011] by boosting interregional synchronization [Andrillon et al., 2011; Bonjean et al., 2012; Mölle et al., 2004].
Statistical Analysis of Reactivation of Task‐Specific Connections During Sleep
The hypothesis that task‐elicited long‐range coupling was reactivated during subsequent sleep was evaluated by testing whether the sensor pairs identified to show high beta PPC specifically and consistently elicited by the MT task of interest versus the control FNA task (t1 > t2 selected pairs), were represented above chance among the sensor pairs identified to show high PPC specifically and consistently during post‐MT sleep versus post‐FNA sleep (s1 > s2 selected pairs). Similarly to the procedure described above to select the t1 > t2 pairs from the matrices Ti,j, we selected the s1 > s2 pairs from the matrices Si,j, where Si,1 are the PPC values for the post‐MT sleep and Si,2 are the PPC values for the post‐FNA sleep. The hypothesis of reactivation of MT task‐induced long‐range coupling of power fluctuations was formally tested using a nonparametric permutation analysis on the amount of overlap between the MT‐task specific sensor pairs and the post‐MT sleep specific sensor pairs.
The post‐MT sleep‐specific sensor pairs for each individual were defined by comparing the person's post‐MT period versus post‐FNA period PPC matrices. An N by N PPC matrix, called Si,j, was calculated for each subject i and for the two conditions j (s1 = post‐MT sleep and s2 = post‐FNA sleep). Similarly to the matrix T mentioned above, the matrix S was constructed from the PPC values during the post‐task sleep periods. If there was no task‐induced reactivation of the coupling in the post‐MT sleep period, then the labeling of the post‐MT sleep or post‐FNA sleep would be arbitrary and, therefore, the matrices Si,1 and Si,2 completely exchangeable [Nichols and Holmes, 2002]. The alternative hypothesis was that the topography of sensor pairs specific to the post‐MT sleep was above‐chance similar to, that is,overlapped with, the topography specific to the MT task. In a permutation approach to obtain a reference distribution to test for significance of the number of co‐occurring pairs, the labels (post‐MT sleep vs post‐FNA sleep) of Si,1 and Si,2 were systematically swapped for each i subject to create a surrogate topography, and for each permutation we computed the amount of overlap between the MT‐task specific sensor pairs and the sensor pairs obtained from the surrogate topography of the post‐task sleep. Based on the amount of overlap between the MT‐task specific sensor pairs and the surrogate topographies, we constructed a reference distribution of the number of overlapping sensor pairs. The amount of actual overlap between the MT‐task specific sensor pairs and the observed post‐MT sleep specific sensor pairs was tested against this reference distribution. Swapping the two conditions (post‐MT sleep and post‐FNA sleep) within eight subjects yielded 256 possible permutations. This approach resulted in a reference distribution for the probability of any number of recoupling of sensor pairs to occur in the post‐MT sleep period. Results were considered significant when the observed number of overlapping sensor pairs, which is the overlap of t1 > t2 selected pairs with s1 > s2 selected pairs, exceeded 95% of the reference distribution.
Reactivation of Task‐Specific Connections During Wakefulness
To investigate whether reactivation was present during post‐task wakefulness as well, rather than specific to post‐task sleep, we first identified the sensor pairs that showed high beta PPC specifically and consistently elicited by the task of interest versus the control task (t1 > t2 selected pairs). We then tested whether they were represented above chance among the sensor pairs identified to show high PPC specifically and consistently during post‐MT wakefulness versus post‐FNA wakefulness (w1 > w2 selected pairs). The same procedure as explained in the previous paragraph was applied to evaluate reactivation during subsequent wakefulness (w1 > w2 selected pairs). For this statistical analysis, instead of the matrix S, we used the matrix Wi,1 with the PPC values obtained from the post‐MT wakefulness period (w1) and the matrix Wi,2 with the PPC values obtained from the post‐FNA wakefulness period (w2). Based on the matrix T (with the PPC values of the tasks) and the matrix W (with the PPC values of the wakefulness periods), we created a reference distribution and tested whether the observed number of overlapping sensors of the t1 > t2 selected pairs with the w1 > w2 selected pairs exceeded 95% of the reference distribution.
Reactivation with Passage of Time
An ancillary analysis was performed with the same permutation reference distribution approach as explained above to disambiguate whether the long‐range reactivation was specifically linked to the occurrence of sleep or was merely due to the passage of time after the execution of the task, which is on average longer for sleep than for wakefulness. To investigate this alternative explanation, we selected an equivalent 15‐min time window between 60 and 75 min after the beginning of the task (indicated by * in Fig. 4A). This window was chosen because the median and mean of the NREM Stage 2 midpoint after the beginning of the task were within that range (68.3 min and 71.8 min, respectively) and because exactly four participants were asleep and four participants were awake. We then tested whether the task‐induced long‐range connections were reactivated in this hybrid period, consisting of sleep and wakefulness.
Figure 4.
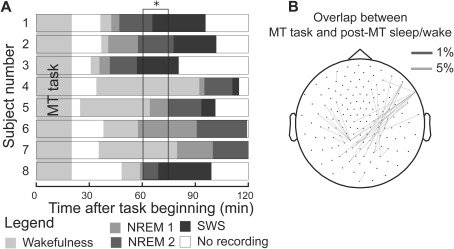
The sleep onset and duration of sleep stages were variable across participants and the passage of time alone does not account for the observed long‐range reactivation. (A) Duration of the wakefulness and sleep periods for each subject, during the MT task and post‐MT wakefulness and sleep. Participants performed the task in the MEG and they were invited to fall asleep. The post‐MT wakefulness includes the first 15 min after the beginning of the dim‐lit recordings while post‐MT sleep includes the first 15 min after the onset of NREM Stage 2. There was considerable variability in the beginning of the recording after the task and even more variability in sleep onset time. (B) The long‐range reactivation was state‐specific. The same statistical analysis on the 60–75 min time window [indicated by * in (A)], which is centered around the median sleep midpoint from the beginning of the task (68.3 min) and includes four participants who were awake and four who were asleep, does not show significant reactivation of long‐range connection in the delta band (number of sensor pairs: 32, P‐value = 0.18).
Reactivation of Resting‐State Baseline Coupling
The definition of long‐range synchronization specific to the MT task was based on the selection of the sensor pairs which were most strongly and consistently correlated during the MT task (in the period t1) as compared to the task control condition (in the period t2). An ancillary analysis was done to substantiate that sleep reactivated synchronization specifically elicited by the MT task and that results could not be confounded by nonspecific prior synchronization or desynchronization during the control task. Because the MT task consisted of periods of 10 s of tracing or MT task execution alternating with periods of 5 s of resting‐state baseline, we could perform the same analysis as before, but in this case we used the baseline control period (i.e., the period r1) instead of the MT task execution period. Accordingly, we selected the sensor pairs that were more selectively coupled during the baseline control period (r1) as compared to the task control period (t2), and tested whether the so‐obtained profile of synchronization, which was not MT task‐specific, was reactivated during sleep. This hypothesis was tested following the same procedure explained above and evaluated whether the sensor pairs with consistent high PPCs specific to the resting‐state control baseline within the same timeframe of the MT task (r1 > t2 selected pairs), were represented as well beyond chance level in the sensor pairs with consistent high PPCs specific to the post‐MT sleep period (s1 > s2 selected pairs). The null hypothesis here is independence of the r1 > t2 selection and the s1 > s2 selected pairs. As compared to the analysis on reactivation MT‐task specific synchronization, we replaced only Ti,1 with the PPC values obtained from the baseline control period (r1) instead of task execution (t1), while the Ti,2 still contained the PPC values from the task control period (t2). The matrix S contained the PPC values of the post‐task period (s1 and s2).
Connections Between Clusters at the Sensor Level
After observing that task‐specific long‐range synchronization is specifically reactivated during sleep, we further investigated the spatial localization of the connections at the sensor level and at the source level. We argued that, if the reactivated sensor pairs reflect distant cortical areas specifically activated by the task, the pairs would not be randomly distributed but would occur between clusters of sensors overlying the cortical areas involved. To exclude that the connectivity was spuriously related to differences in power between conditions [Schoffelen and Gross, 2009], we tested whether there was a difference in power within the frequency bands of interest between the MT condition and the FNA control condition, and between the post‐MT condition and the post‐FNA condition.
To investigate whether the reactivated sensor pairs indeed occurred in clusters, the following procedure was applied. The sensors that were connected to at least two other MT‐task specific and post‐MT sleep specific sensors were considered the main nodes of the reactivated coupling. Nodes that were less than 4‐cm apart were considered neighboring sensors. Neighboring sensors (i.e., within a distance of 4 cm from each other) were grouped into separate clusters. The connected‐component clustering algorithm was computed with bwlabeln in MATLAB. The coupling profile between clusters A and B was defined as the number of reactivated sensor pairs (i.e., sensor pairs that were most strongly activated during the MT task and most strongly reactivated during post‐MT sleep, as in Fig. 3B) between the sensors in cluster A and the sensors in cluster B.
Figure 3.
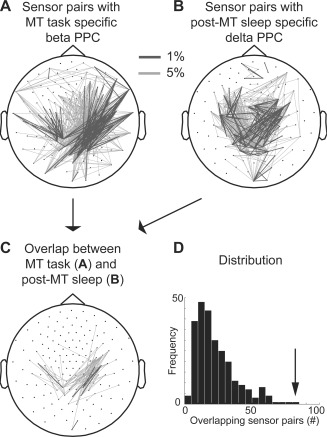
Reactivation of task‐related power–power correlations during sleep. (A) Topography of the sensor pairs with the most selective and consistent highly correlated beta band power fluctuations during the execution of MT task as compared to the task control condition (t1 > t2 selected pairs). Black lines and gray lines indicate the 1% and 5% most specific sensor pairs, respectively. (B) Topography of the sensor pairs with the most selective and consistent highly correlated delta power fluctuations during post‐MT sleep but not during sleep following the control task (s1 > s2 selected pairs). (C) Topography of the sensor pairs that show both MT task‐specific correlated beta band power fluctuations (A) and post‐MT sleep‐specific correlated delta power fluctuations (B). (D) A nonparametric permutation test showed that the number of 82 overlapping sensor pairs in (C) is more than expected by chance. The reference probability distribution was obtained by permuting the post‐MT sleep and post‐FNA sleep labels and counting the number of resulting overlapping pairs for each of the 256 (= 28) permutations. The null hypothesis could be rejected because the observed number fell in the highest 0.4% of the reference probability distribution (arrow, P‐value < 0.004).
Source Estimation
We considered that coupling between distant sensor clusters at the sensor level does not necessarily reflect synchronization between separate cortical areas, but might as well result from a single source. This possible confounding could arise from the field spread effect of the single source to multiple sensors which can be quite apart in space [Schoffelen and Gross, 2009]. Only if this possibility can be excluded and two separate sources can be demonstrated, can the conclusion of coupling of distant cortical be supported.
To address this question, we applied ICA to evaluate whether there existed two independent sources that (i) could account for the topography of sensor clusters and (ii) coupled their power fluctuations specifically during the MT versus FNA task (t1 > t2) and post‐MT sleep versus post‐FNA sleep (s1 > s2) but not during post‐MT versus post‐FNA wakefulness (w1 > w2).
ICA blindly unmixes the signal measured at the sensor level into maximally independent time series of activity of underlying sources [Makeig et al., 2004]. ICA on all temporally concatenated MEG data of both days from all the participants should be able to identify components with sufficient statistical independence over the whole recording duration—including both tasks and subsequent wake and sleep periods—while showing selective correlated power fluctuations during both the MT task and post‐MT sleep. In this way, we reproduced the sensor level approach described above [Brookes et al., 2011].
The criterion (i) was achieved by selecting the 10 components whose topography best matched the location of one of the two sensor clusters. For criterion (ii), we analyzed the time series of these components using the same procedure used at the sensor level: beta activity was calculated on the 10 s interval and we calculated PPC values between the components, resulting in a C by C matrix of correlation coefficients, where C is the number of components. Using a paired t‐test for each of the three comparisons (t1 > t2, w1 > w2, s1 > s2), we identified component pairs that (i) showed significantly high correlation of beta power fluctuations during the MT task as compared to the FNA task, (ii) a significantly high correlation of delta power fluctuations during the post‐MT sleep as compared to the post‐FNA sleep, and (iii) no significantly different correlation of delta power fluctuations during the post‐MT wakefulness as compared to the post‐FNA wakefulness. The probability that a component pair was highly correlated during the task period and the sleep period, but not during the intervening period of wakefulness, considering the tests as independent, is the product of the P‐values of the t‐test of MT task–FNA task comparison (t1 > t2) and the t‐test of the post‐MT–post‐FNA sleep comparison (s1 > s2), multiplied by the inverse probability (1 − P‐value) of the t‐test of the post‐MT–post‐FNA wakefulness comparison (w1 > w2). The P‐value belonging to each component is here multiplied by the number of all the component pairs (10 × 10) to obtain a Bonferroni corrected P‐value.
To localize the brain regions of the component pairs that show higher synchronization during task execution and sleep but not during wakefulness, we applied a source reconstruction algorithm, standardized low resolution brain electromagnetic tomography (sLORETA) [Pascual‐Marqui, 2002], to the topography of each significant component. In sLORETA, the forward model consists of a three‐shell spherical head model, and, for increased accuracy, the solution space is limited to the cortical gray matter, defined by 6239 voxels at 5 mm spatial resolution, reconstructed from the MNI152 template. Based on these parameters, sLORETA calculates the source activity of the components with low localization bias using regularized minimum norm estimates under the assumption of spatial smoothness [Pascual‐Marqui, 2002]. Subsequently, the solutions estimated with sLORETA are projected onto a template brain.
Correlation Between Coupling Strength and Performance Improvement
To investigate the functional relevance of the activation and reactivation of coupling of power fluctuations, we investigated whether individual differences in coupling and reactivation strength of the sensor pairs specific to both MT task and post‐MT sleep were associated with individual differences in the performance improvement attained over the sleep period. Performance on the MT task was quantified as the tracked distance averaged over the six trials of normal tracing and six trials of mirror tracing in each of the five blocks per session. To minimize outliers, the distance tracked, originally measured in radians, was log‐transformed. For the MT task before sleep and for the MT task after sleep separately, we used the best block of six trials of each tracking direction. Changes in performance was computed by summing the log of the ratio of the best block of normal tracing after sleep and the best block of normal tracing before sleep with the log of the ratio of the best block of mirror tracing after sleep and the best block of mirror tracing before sleep. A t‐test was used to evaluate whether the change in performance was significantly different from zero.
We then correlated the interindividual differences in performance change with the subject‐specific coupling strength. The coupling strength was computed by adding the PPC coefficients during the MT task and during the post‐MT sleep and subtracting the PPC coefficients during the control task (FNA task) and during the post‐FNA sleep. These values were averaged over the sensor pairs that showed significant reactivation (as in Fig. 3C).
RESULTS
Sleep Duration
Eight out of 12 participants reached NREM Stage 2 sleep on both days and were included in the analysis. Five participants reached NREM Stage 3–4 on both days and only two reached rapid eye movement (REM) sleep on both days. Table 1 shows the average duration of each sleep stage. Because only NREM Stage 2 was of sufficient duration for a reliable estimate of the PPC and we considered eight participants the minimum number of data points for our statistical procedure, we limited the analyses to NREM Stage 2. On average 36.00 min (s.d. 6.74) after the beginning of the MT task, post‐task wake and sleep recordings commenced. NREM Stage 2 onset was reached on average 71.84 min after the beginning of the task, with a large interindividual variability (s.d. 22.86). Figure 4 shows the distribution of the occurrence of the various sleep stages over time.
Table 1.
Summary of sleep stages for the 8 participants included in the analysis for the two conditions.
| Stages | |||||
|---|---|---|---|---|---|
| Awake | NREM 1 | NREM 2 | NREM3–4 | REM | |
| Post‐MT | |||||
| Participants | 8 | 4 | 8 | 5 | 2 |
| Minutes | 26.31 ± 22.12 | 23.75 ±14.88 | 19.88 ±4.70 | 27.40 ±19.46 | 20.50 ± 20.03 |
| Post‐FNA | |||||
| Participants | 8 | 6 | 8 | 7 | 3 |
| Minutes | 25.50 ±19.78 | 15.08 ± 7.48 | 17.50 ± 15.68 | 15.29 ± 18.50 | 4.83 ±10.06 |
For each condition, the table reports the number of participants and the number of minutes (average ± standard deviation) in each stage.
Reactivation of Task‐Specific Connections During Sleep
After having defined the sensor pairs that showed specific and consistent high beta band PPC during the MT task (Fig. 2C), we tested whether these sensor pairs were represented above chance among the sensor pairs that were independently identified to show specific and consistent high PPC the post‐MT sleep period. A nonparametric permutation test showed that sensor pairs with pronounced correlated beta band power fluctuations during the MT task (Fig. 3A) overlapped beyond chance level with the sensor pairs with pronounced correlated delta power fluctuations during post‐MT sleep (Fig. 3B,C, respectively, P‐value = 0.004). In fact, the number of sensor pairs that showed specific and consistent high beta band PPC during MT and also showed specific and consistent high delta PPC during sleep was the extreme value of the reference distribution obtained through nonparametric permutation (Fig. 3D, where P‐value = 0.004 = 1/28). The reactivation of coupling during sleep was specific for the delta band and could not be demonstrated in the slow oscillation (P‐value = 0.29), sigma (P‐value = 0.34), or beta (P‐value = 0.06) band.
No Significant Reactivation of Task‐Specific Connections During Wakefulness
The same test was applied to evaluate reactivation during the post‐MT wakefulness period. Sensor pairs with pronounced correlated beta band power fluctuations during the MT task were not represented above chance among the sensor pairs that were independently identified to show specific and consistent high PPC during post‐MT wake in any frequency band (slow oscillation band P‐value = 0.47, delta band P‐value = 0.94, sigma band P‐value = 0.07 and beta band P‐value = 0.08).
Significantly More Reactivation During Sleep Than During Wake
After demonstrating that MT task‐specific coupling reactivation reached significance during subsequent sleep (period s1) but not during subsequent wakefulness (period w1), we tested directly whether the degree of reactivation of long‐range coupling during sleep was larger than during wakefulness. This hypothesis was tested using a similar rationale and procedure of the permutation analysis described above. In testing this interaction, the null hypothesis is that the labeling of post‐MT wakefulness and post‐MT sleep is arbitrary and the coupling profiles observed during post‐MT wakefulness and post‐MT sleep could be swapped. Therefore, we created the reference distribution based on the null hypothesis by swapping the PPC matrix Bi,1 calculated during post‐MT wakefulness (periods w1 > w2) with the PPC matrix Bi,1 calculated during post‐MT sleep (periods s1 > s2) and calculating the amount of overlap between the MT‐task specific sensor pairs and the surrogate matrices. The observed value of overlap between MT‐task specific sensor pairs and post‐MT sleep specific sensor pairs was compared against this reference distribution. Sensor pairs that were coupled in the beta band during task execution were significantly more likely to be coupled again in the delta band during sleep, as compared to during wakefulness (P‐value = 0.004).
No Significant Differences in Power
Measures of inter‐regional connectivity in MEG and EEG can be affected by field spread effects [Schoffelen and Gross, 2009]. In particular, changes in power between conditions might erroneously be interpreted as changes in connectivity. Therefore, to ascertain that the reactivation of coupling observed in this study does not derive from differences in power, we compared the amount of power between the MT and FNA control conditions during the task period (t1 > t2) in the beta band and during sleep (s1 > s2) in the delta band.
First, there was no significant difference in the power averaged over all the sensors in the beta band (MT task: 11.121 ± 5.400 fT2; FNA control task: 14.297 ± 9.777 fT2; paired t‐test, d.f. = 7, P‐value = 0.09). During the post‐task sleep period, the power in the delta band, which shows a reactivation of long‐range coupling, was not different between the post‐MT sleep and the post‐FNA sleep (post‐MT sleep: 273.857 ± 271.331 fT2; post‐FNA sleep: 339.118 ± 212.404 fT2; paired t‐test, d.f. = 7, P‐value = 0.43). In addition, there were no differences in power between post‐MT sleep and post‐FNA sleep in the other frequency of interest (in the slow oscillation band, post‐MT sleep: 1073.272 ± 1569.844 fT2; post‐FNA sleep: 940.368 ± 655.355 fT2; paired t‐test, d.f. = 7, P‐value = 0.75; in the sigma band, post‐MT sleep: 23.455 ± 7.587 fT2; post‐FNA sleep: 28.539 ± 12.990 fT2; paired t‐test, d.f. = 7, P‐value = 0.12).
Second, we compared the differences in power specifically in those sensors that showed significant reactivation during sleep. This additional control was included because it is conceivable that power changes were limited only to a subset of sensors, and only these sensors with higher power would show high coupling during the task and sleep periods. Even after averaging over this subset of sensors only, there was still no significant difference in the power in the beta band between the tasks (MT task: 10.963 ± 6.879 fT2; FNA control task: 17.313 ± 14.883 fT2; paired t‐test, d.f. = 7, P‐value = 0.07). Similarly, during the post‐task sleep period, the power in any frequency band of interest, including delta, was not different between the post‐MT sleep and the post‐FNA sleep (in the slow oscillation band, post‐MT sleep: 846.915 ± 1207.187 fT2; post‐FNA sleep: 999.756 ± 798.168 fT2; paired t‐test, d.f. = 7, P‐value = 0.56; in the delta band, post‐MT sleep: 240.758 ± 236.705 fT2; post‐FNA sleep: 351.075 ± 244.426 fT2; paired t‐test, d.f. = 7, P‐value = 0.15; in the sigma band, post‐MT sleep: 20.844 ± 7.484 fT2; post‐FNA sleep: 29.606 ± 16.184 fT2; paired t‐test, d.f. = 7, P‐value = 0.07).
Overall, these results show that there was no difference in power in the frequency bands of interest between the MT and FNA control conditions, either during task execution or during sleep. This observation suggests that the observed pattern of reactivation cannot be explained by field spread effects alone.
More Reactivation During Sleep Than During Wakefulness is Unlikely Secondary to Mere Passage of Time
It is important to note that the periods of wakefulness occurred between the execution of the task and the sleep periods. An additional analysis was, therefore, performed to evaluate the possibility that the suggested stronger reactivation during sleep than during wakefulness could be attributed to wake versus sleep differences in time elapsed since the onset of the task. We assessed the amount of reactivation occurring in a time window in which half of the participants were asleep and half were awake (Fig. 4A). The same permutation approach as described above was now applied on this hybrid time window and showed no significant reactivation of long‐range synchronization (delta band P‐value = 0.18, Fig. 4B; beta band P‐value = 0.75). These results strengthen the interpretation that reactivation did not simply emerge with a delay after performing the task but was specifically promoted by the presence of NREM sleep.
No Sleep Reactivation of Resting‐State Baseline Coupling
It is of importance to investigate whether the reactivation is specific to the coupling induced by the execution of the task and not to coupling that is unrelated to the task or to uncoupling in the control task. We, therefore, tested whether sensor pairs showing coupling specifically in the resting‐state control baseline within the same timeframe of the MT task (r1 > t2 selected pairs) were above‐chance level represented in the sensor pairs showing coupling specifically post‐MT sleep (s1 > s2 selected pairs). Sensor pairs with pronounced correlated beta band power fluctuations during the resting‐state control baseline period were not represented above chance among the sensor pairs that were independently identified to show post‐MT sleep‐specific high PPC in the delta band (P‐value = 0.41).
Clustered Rather Than Randomly Distributed Sensor Pair Reactivation
The sensor pairs that showed both MT task‐specificity and post‐MT sleep‐specificity were not randomly distributed across the cortex but appeared neatly grouped in pairs connecting two main clusters in the parietal and occipital cortex (Fig. 3C). An automatic clustering algorithm indeed identified two distinct clusters: one cluster consisting of 16 sensors over the left occipital cortex and a second cluster of nine sensors over the right parietal cortex (Fig. 5A). Fifty‐four out of the reactivated 82 sensor pairs occurred between these two clusters; 22 sensor pairs between the occipital cluster and other sensors (mostly located contralaterally to the parietal cortex); two sensor pairs between the parietal cluster and other sensors and only four sensor pairs did not involve the two main clusters.
Figure 5.
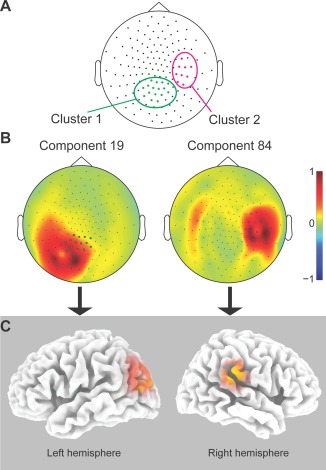
Estimated location of the two of the four sources that are highly coupled during the MT task and post‐MT sleep, but not during post‐MT wakefulness. (A) Sensors which formed at least two MT task‐specific and post‐MT sleep‐specific sensor pairs, as in Figure 3C, clustered in two groups. (B) Topographic projection of the two components that selectively showed high PPC during the MT task in the beta band (P‐value = 0.01) and high PPC during post‐MT sleep in the delta band (P‐value = 0.01). (C) Indicative cortical sources of the two components, estimated using sLORETA. Component 19 is maximally localized on the left occipital cortex while component 84 centers on the right parietal cortex. [Color figure can be viewed in the online issue, which is available at http://wileyonlinelibrary.com.]
Source Estimation
Because coupling at the sensor level does not always reflect coupling between sources, we applied ICA to evaluate whether we could identify two separate sources that (i) could account for the two separate clusters at the sensor level; (ii) selectively showed beta band power correlations during the MT task versus FNA control task; and (iii) selectively showed delta power correlations during post‐MT sleep but not during post‐MT wake. These criteria were fulfilled by four independent components (Fig. 5A). The topographical projection of one component (component 19) matched the topography of the cluster over the occipital cortex, whereas three components (components 84, 8, and 22) matched the topography of the cluster over the parietal cortex. These components showed selectively high PPC in three pairs (component pairs 19–84: corrected P‐value = 0.006; 19–8: P‐value < 0.001; 19–22: P‐value = 0.002). Their beta band power fluctuations correlated significantly stronger during the MT task than during the FNA task (component pairs 19–84: P‐value = 0.01; 19–8: P‐value = 0.01; 19–22: P‐value = 0.004), while their delta power fluctuations correlated significantly stronger during post‐MT sleep compared to post‐FNA sleep (component pairs 19–84: P‐value = 0.01; 19–8: P‐value = 0.01; 19–22: P‐value = 0.01). None of these component pairs showed higher PPC during post MT wake as compared to post FNA wake in any power band (all P‐values > 0.18). For each pair of components, one was localized on the lateral occipital cortex and the other on the parietal cortex (respectively, component 19 and 84, the most representative component pairs, whose cortical projections are shown in Fig. 5C).
Correlation Between Coupling Strength and Performance Improvement
We investigated whether performance on the MT task was improved after sleep and whether this improvement correlated with the coupling strength in power fluctuations during task execution and sleep. Changes in performance were measured as the ratio in distance tracked during the best blocks of normal tracing and mirror tracing before and after sleep (Table 2); this ratio was significantly larger than zero (t‐test, d.f. = 7, P‐value = 0.05), indicating that participants on average improved their performance after the sleep period.
Table 2.
Performance on the MT task of the best block of six trials before and after sleep (measured in log of radians) for the individual subjects S 1‐–8.
| Participants | |||||||||
|---|---|---|---|---|---|---|---|---|---|
| Tracing | S 1 | S 2 | S 3 | S 4 | S 5 | S 6 | S 7 | S 8 | |
| Before sleep | Normal | 4.804 | 3.512 | 3.965 | 4.675 | 4.211 | 4.961 | 3.950 | 4.821 |
| Mirror | 5.017 | 3.410 | 3.791 | 4.460 | 4.052 | 4.784 | 3.704 | 4.445 | |
| After sleep | Normal | 4.737 | 3.810 | 4.637 | 4.842 | 4.228 | 5.101 | 4.135 | 5.254 |
| Mirror | 4.508 | 3.574 | 4.508 | 4.744 | 4.344 | 5.071 | 3.888 | 4.689 | |
| Post‐/Pre‐improvement | −0.121 | 0.129 | 0.330 | 0.097 | 0.074 | 0.086 | 0.094 | 0.139 | |
The improvement in performance was computed by summing the log of the ratio of the performance during normal tracing after sleep and the performance of normal tracing before sleep with the log of the ratio of the performance of mirror tracing after sleep and the performance of mirror tracing before sleep, that is, log(post‐sleep normal/pre‐sleep normal) + log(post‐sleep mirror/pre‐sleep mirror).
Individual differences in the performance improvement over sleep correlated with the individual differences in the strength of the specific activation and reactivation during the task and sleep (r = 0.73, P‐value = 0.04), quantified as the average of the PPC values over the sensor pairs that showed significant reactivation. The correlation was also significant if we considered distance tracked during the MT period separately (r = 0.76, P‐value = 0.03, Fig. 6) but not during normal tracing (r = 0.58, P‐value = 0.13). In addition, the correlation was significant at the source level, as the improvement in performance correlated with the strength of the coupling between one of the three independent component pairs (components 19–8: r = 0.81, P‐value = 0.01).
Figure 6.
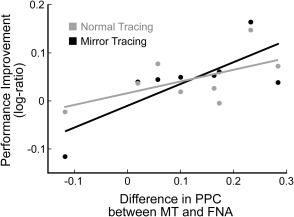
The coupling strength of the PPC during the MT task and post‐MT sleep, relative to the PPC in the FNA control period, correlated with the improvement in performance of the MT task after sleep (r = 0.73, P‐value = 0.04). The figure shows the correlation between coupling strength and the performance improvement separately for the normal tracing period and the mirror tracing period. The values on the x‐axis represent the difference in PPC coefficients between the MT and the FNA conditions while values on the y‐axis indicate the log‐ratio between the distance traced before and after sleep (i.e., a positive value indicates a larger distance traced after sleep). Each dot represents one participant during the normal tracing and the mirror tracing tasks, with the lines of best fit superimposed. While the correlation did not reach significance for the normal tracing period (in gray, r = 0.58, P‐value = 0.13), it was significant for the MT period, which was the more demanding part of the MT task (in black, r = 0.76, P‐value = 0.03).
Discussion
The present findings provide evidence for the reactivation of specific, learning‐induced long‐range coupling of neuronal network activity during subsequent sleep in humans. Cortical areas that coordinate their beta power fluctuations during visuomotor performance coordinate their delta power fluctuations during subsequent sleep. Long‐range functional connectivity between distant brain areas has been so far only reported in animal studies [Hoffman and McNaughton, 2002a; Johnson et al., 2010]. Reactivation of distributed neuronal networks is thought to be of key importance in memory consolidation, in particular for tasks that require the integration of information from separate systems [Dang‐Vu et al., 2010], such as the MT task used in this experiment [Fogel et al., 2007]. The spatiotemporal pattern of delta power fluctuations in the 0.1‐Hz range during sleep contains traces of cortico‐cortical coupling induced by performing a task during prior wakefulness. Coupling of oscillatory activity has been proposed as a mechanism by means of which distant cortical areas optimize information exchange during wakefulness. Our findings suggest that this principle could hold as well for sleep, whereas the preferred frequency band can be state‐specific.
A leading hypothesis on the role of sleep in memory consolidation is that it allows for unperturbed reactivation of learning‐induced memory traces by means of long‐range synchronization across distant cortical areas [Diekelmann and Born, 2010; Hoffman and McNaughton, 2002b; Rasch and Born, 2007]. However, to our knowledge, no single previous study in humans has shown reactivation of long‐range synchronization during sleep. Previous work using tetrodes and microelectrode arrays to record multiple individual neurons in rat and macaque has convincingly demonstrated hippocampal‐neocortical and cortico‐cortical interactions to be replayed during sleep [Benchenane et al., 2010; Hoffman and McNaughton, 2002a; Peyrache et al., 2009]. Unlike the animal work, previous studies in humans have either reported only local changes in trained brain areas during sleep [Huber et al., 2006, 2004; Kattler et al., 1994] or a nonspecific increase in coherence [Cantero et al., 2002; Mölle et al., 2004]. Mölle et al., [2004] have shown that learning elicited increased long‐range coherence during subsequent sleep and that individual differences in coherence were associated with individual differences in memory retention. However, that study did not disambiguate whether there was a nonspecific generalized increase in coherence or a specific spatial profile of increased coherence mirroring the long‐range synchronization that was induced by prior learning. This study demonstrates topographically specific reactivation of long‐range synchronization, reflecting the network activated during the learning experience that preceded sleep.
This specificity addresses the concern that the reactivation might be a confound introduced by differences in baseline brain activity or unspecific fluctuations in brain state. The strength of the current design lies in the within‐subjects, counterbalanced comparison and in the selection of the most task‐specific sensor pairs. This procedure minimizes any risk of systematic bias or confounding factors, such as intraindividual and interindividual variations in global brain state or large differences in engagement, learning effort, and fatigue. To keep these factors constant, the experimental design requires two similarly demanding tasks, each of which is known to tax a different and specific brain network. In addition, the level of fatigue before the learning session was controlled by asking participants to sleep no more than 5 h on the night before the experiment. Although complete sleep deprivation has been shown to affect learning abilities [Chee and Chuah, 2008; Drummond et al., 2000; Yoo et al., 2007], we expected that the requirement of the modest sleep deprivation would represent a sensible compromise necessary to favor sleep in the MEG setting and to control for the degree of sleepiness across participants and conditions. We, moreover, confirmed task‐specificity by excluding reactivation on the PPC profile that occurred during a resting‐state control baseline obtained within the very same timeframe as the MT task.
Reactivation during sleep of coordinated neuronal activity induced during prior wakefulness has, in animal studies, been operationalized in term of correlated fluctuations of neuronal firing between individual neurons across distant locations in the brain [Benchenane et al., 2010; Hoffman and McNaughton, 2002a], a method that is not feasible in healthy humans. The present findings indicate that the study of reactivation of coordinated neuronal activity is also feasible in humans, as it occurs at the level of long‐range coupling of fluctuations in the power of local field potential oscillations. Future studies should investigate the intriguing and multifaceted relation between coupling of power fluctuations, as reported in our study, the correlation of neuronal firing quantified with single‐unit recordings [Hoffman and McNaughton, 2002a; Ji and Wilson, 2007; Louie and Wilson, 2001], and the concurrence and phase relationship of sleep‐related elements, such as K‐complexes and spindles [Battaglia et al., 2004; Johnson et al., 2010; Peyrache et al., 2009].
An intriguing finding is the state‐dependence of the frequency band in which this long‐range coupling occurs. During task execution, the learning experience induces long‐range coupling in beta band power fluctuations between specific cortical areas. During subsequent sleep, the long‐range coupling between the same specific cortical areas is reactivated, but now in delta band power fluctuations. One possible interpretation for this phenomenon is that, because beta is the dominant frequency during wakefulness and task execution, while delta is the dominant frequency during NREM sleep, coupling of oscillations may best shown within these frequency domains. This interpretation is accompanied by the hypotheses that long‐range synchronization in the beta and delta frequency bands might play different roles. Beta band synchronization allows for fast spreading of information [Brovelli et al., 2004; Kopell et al., 2000], which is required to respond appropriately to external stimuli during wakefulness. During NREM sleep, delta activity is particularly apt at boosting synchronized firing rate and activity over large parts of the cortex [Chem et al., 1999; Fujisawa and Buzsáki, 2011]. Long‐range coupling of neuronal membrane potentials is favored selectively by the slow oscillations typical of deep sleep [Volgushev et al., 2011]. This synchronized activity has been proposed to strengthen the coupling between regions and to be involved in memory consolidation [Diekelmann and Born, 2010; Paller and Voss, 2004]. Future work is needed to investigate the peculiar properties of the synchronization across multiple frequency bands.
The literature on reactivation does not unequivocally define a single dedicated time‐window or sleep stage during which reactivation exclusively occurs. In fact, previous studies have reported reactivation during light sleep [van Dongen et al., 2011], during NREM Stage 2 and slow wave sleep [Huber et al., 2004; Ji and Wilson, 2007; Mölle et al., 2004; Peigneux et al., 2004; Peyrache et al., 2011; Wilson and McNaughton, 1994], during REM sleep [Louie and Wilson, 2001; Maquet et al., 2000; Peigneux et al., 2003], and even during wakefulness [Foster and Wilson, 2006; Moisello et al., 2013]. In this study, reactivation was demonstrated during NREM Stage 2 and slow wave sleep, in agreement with most of the literature [reviewed in Walker, 2005]. Our analysis could not demonstrate significant task‐specific reactivation during the subsequent wakefulness, either in the beta band (a frequency band typical of attentive wakefulness) or in the delta band (where reactivation eventually occurred during sleep). However, trends were observed, and statistical power considerations do not rule out the possibility of less pronounced reactivation during wakefulness.
Subjects differed with respect to the time passed before falling asleep after completion of the task (Fig. 4A). This resulted in a considerable variation in sleep‐wake states across participants over time: at almost any time point after the task some participants were awake while others were asleep. This variability allowed for an ancillary analysis that strengthens the interpretation that reactivation did not occur after a certain delay, but was specifically promoted by NREM sleep. In fact, the amount of reactivation in the time window centered around the median NREM sleep midpoint of 68.3 min after the beginning of the task, when four participants were asleep and four were awake, was not significant (Fig. 4B).
There are several indications that the reactivation in long‐range coupling observed in this study is specific to the MT task. First, source modeling of the reactivation indicated that the coupling occurred between the parietal cortex and lateral visual cortex (Fig. 5C). These areas have direct anatomical connections [Seltzer and Pandya, 1994] and are both active during visuomotor tasks [Balslev et al., 2004; Siegel et al., 2008]. Second, the individual variability in the coupling strength correlates with the changes in performance on the MT task. This study was optimized to detect long‐range coupling of power fluctuations specific to a procedural task while the FNA task was strictly used as a reference task requiring comparable effort. The use of a task control condition allowed us to extract task‐specific long‐range coupling rather than nonspecific activation. In addition to the use of such an active control, we showed that reactivation did not occur for resting‐state activity extracted from the baseline control period in the MT task. Together, these control conditions allow us to identify task‐specific long‐range coupling rather than nonspecific activation.
It might be argued that suppression of the so‐called mu rhythm, an event‐related desynchronization (ERD) occurring during the execution of motor tasks [Pfurtscheller and Lopes da Silva, 1999; Pfurtscheller et al., 1997], could be a potential confounding factor of the coupling of beta power. However, the characteristic frequency band of the mu rhythm is around 8–13 Hz, lower than the frequency band of interest of our study, which was 12–30 Hz. An ERD has also been observed around 20 Hz in association with motor activity [Pfurtscheller and Lopes da Silva, 1999]. However, this ERD, being circumscribed to motor regions [Pfurtscheller and Neuper, 1997; Pfurtscheller et al., 1994], has a topography that does not overlap with the areas that reactivated their coupling, as shown on the scalp (Fig. 3C) and at the source level (Fig. 5C). In addition, both the mu rhythm and motor‐related beta ERD present themselves as a decrease in power within a brain region, while the analysis procedure in our study was designed to ignore localized changes within one single region and to quantify the long‐range coupling power fluctuations between distant brain regions.
Analysis of long‐range coupling in EEG and MEG can be affected by field spread effects. For example, a local change in power between conditions might give rise to spuriously high coupling between brain regions [Schoffelen and Gross, 2009]. This is particularly important in the case of sleep studies, which have indicated local higher slow wave power during NREM sleep after learning [Huber et al., 2004; Kattler et al., 1994]. However, we can rule out that power confounded the observed reactivation of coupling as there was no significant difference in power between the MT task and the FNA control task, and between the post‐MT periods and the post‐FNA sleep periods in the frequency bands of interest, either when power was averaged over all the electrodes or only those that were involved in the recoupling during sleep. This observation indicates that the reactivation of the coupling was not secondary to overall changes in power.
Another issue to be discussed is the use of ICA to identify sources that show coupling during the MT task and the recoupling during the post‐MT sleep period. ICA aims at identifying sources with maximally independent time‐series, which may seem to conflict with the aim to identify coupled sources. This seeming contradiction was not actually occurring because we concatenated periods during which we expected significant coupling (MT task and post‐MT sleep) and periods during which we expected no significant coupling (post‐MT wakefulness and all the periods in the FNA condition).
A further aspect that requires careful consideration is individual differences in the location of the gradiometers relative to the brain regions. It should be noted, however, that this variability decreases the signal to noise ratio but does not introduce false sources. The successful outcome of the source estimation procedure indicates that, despite the individual variability in the mapping between brain areas and sensor locations, that is, smearing the signal over larger areas, ICA was able to identify the areas which showed significant coupling.
Conclusions
Our findings provide evidence that task‐induced long‐range synchronization between distant areas in a neuronal network can be reactivated during subsequent sleep in humans. Whereas animal studies have shown reactivation of coupling between distant single neurons, the present findings suggest that the principle may hold at the system level in the human brain, and at the level of coupling of slow fluctuations in oscillatory power, although noninvasive approaches lack the spatial resolution to unambiguously determine whether the exact some neuronal assemblies were reactivated. They, moreover, suggest specificity in the long‐range coupling of neuronal membrane potentials that is favored selectively by the slow oscillations typical of deep sleep [Volgushev et al., 2011], because it contains information of prior wakefulness with relevance for memory consolidation.
Abbreviations
- EEG
electroencephalography
- ERD
event‐related desynchronization
- FNA
face‐name association
- ICA
independent component analysis
- MEG
magnetoencephalography
- MT
mirror‐tracing
- NREM
nonrapid eye movement
- PET
positron emission tomography
- PPC
power–power correlation
- REM
rapid eye movement
- sLORETA
standardized low resolution brain electromagnetic tomography
ACKNOWLEDGMENTS
We thank C. J. Stam and the MEG center of the VU University Medical Center for the support with the MEG recording; D. Balslev for the E‐Prime script of the mirror tracing task; E. van der Helm, F. Buma and M. Schoonheim for their help with data acquisition; J. Vis for the sleep scoring. The authors have no potential conflict of interest to disclose.
REFERENCES
- Achermann P, Borbély AA (1997): Low‐frequency (< 1 Hz) oscillations in the human sleep electroencephalogram. Neuroscience 81:213–222. [DOI] [PubMed] [Google Scholar]
- Amzica F, Steriade M (1995): Short‐ and long‐range neuronal synchronization of the slow (< 1 Hz) cortical oscillation. J Neurophysiol 73:20–38. [DOI] [PubMed] [Google Scholar]
- Amzica F, Steriade M (1998): Electrophysiological correlates of sleep delta waves. Electroencephalogr Clin Neurophysiol 107:69–83. [DOI] [PubMed] [Google Scholar]
- Andrillon T, Nir Y, Staba RJ, Ferrarelli F, Cirelli C, Tononi G, Fried I (2011): Sleep spindles in humans: Insights from intracranial EEG and unit recordings. J Neurosci 31:17821–17834. [DOI] [PMC free article] [PubMed] [Google Scholar]
- Babiloni C, Brancucci A, Vecchio F, Arendt‐Nielsen L, Chen ACN, Rossini PM (2006): Anticipation of somatosensory and motor events increases centro‐parietal functional coupling: An EEG coherence study. Clin Neurophysiol 117:1000–1008. [DOI] [PubMed] [Google Scholar]
- Balslev D, Christensen LOD, Lee J‐H, Law I, Paulson OB, Miall RC (2004): Enhanced accuracy in novel mirror drawing after repetitive transcranial magnetic stimulation‐induced proprioceptive deafferentation. J Neurosci 24:9698–9702. [DOI] [PMC free article] [PubMed] [Google Scholar]
- Bassett DS, Meyer‐Lindenberg A, Achard S, Duke T, Bullmore E (2006): Adaptive reconfiguration of fractal small‐world human brain functional networks. Proc Natl Acad Sci USA 103:19518–19523. [DOI] [PMC free article] [PubMed] [Google Scholar]
- Bastiaansen MC, Knösche TR (2000): Tangential derivative mapping of axial MEG applied to event‐related desynchronization research. Clin Neurophysiol 111:1300–1305. [DOI] [PubMed] [Google Scholar]
- Battaglia FP, Sutherland GR, McNaughton BL (2004): Hippocampal sharp wave bursts coincide with neocortical “up‐state” transitions. Learn Mem 11:697–704. [DOI] [PMC free article] [PubMed] [Google Scholar]
- Benchenane K, Peyrache A, Khamassi M, Tierney PL, Gioanni Y, Battaglia FP, Wiener SI (2010): Coherent theta oscillations and reorganization of spike timing in the hippocampal‐ prefrontal network upon learning. Neuron 66:921–936. [DOI] [PubMed] [Google Scholar]
- Bonjean M, Baker T, Bazhenov M, Cash S, Halgren E, Sejnowski T (2012): Interactions between core and matrix thalamocortical projections in human sleep spindle synchronization. J Neurosci 32:5250–5263. [DOI] [PMC free article] [PubMed] [Google Scholar]
- Born J, Rasch B, Gais S (2006): Sleep to remember. Neuroscientist 12:410–424. [DOI] [PubMed] [Google Scholar]
- Brookes MJ, Woolrich M, Luckhoo H, Price D, Hale JR, Stephenson MC, Barnes GR, Smith SM, Morris PG (2011): Investigating the electrophysiological basis of resting state networks using magnetoencephalography. Proc Natl Acad Sci USA 108:16783–16788. [DOI] [PMC free article] [PubMed] [Google Scholar]
- Brovelli A, Ding M, Ledberg A, Chen Y, Nakamura R, Bressler SL (2004): Beta oscillations in a large‐scale sensorimotor cortical network: Directional influences revealed by Granger causality. Proc Natl Acad Sci USA 101:9849–9854. [DOI] [PMC free article] [PubMed] [Google Scholar]
- Bruns A (2004): Fourier‐, Hilbert‐ and wavelet‐based signal analysis: Are they really different approaches? J Neurosci Methods 137:321–332. [DOI] [PubMed] [Google Scholar]
- Bruns A, Eckhorn R, Jokeit H, Ebner A (2000): Amplitude envelope correlation detects coupling among incoherent brain signals. Neuroreport 11:1509–1514. [PubMed] [Google Scholar]
- Buschke H (1973): Selective reminding for analysis of memory and learning. J Verbal Learn Verbal Behav 12:543–550. [Google Scholar]
- Cantero JL, Atienza M, Salas RM, Dominguez‐Marin E (2002): Effects of prolonged waking‐auditory stimulation on electroencephalogram synchronization and cortical coherence during subsequent slow‐wave sleep. J Neurosci 22:4702–4708. [DOI] [PMC free article] [PubMed] [Google Scholar]
- Chee MWL, Chuah LYM (2008): Functional neuroimaging insights into how sleep and sleep deprivation affect memory and cognition. Curr Opin Neurol 21:417–423. [DOI] [PubMed] [Google Scholar]
- Chem JB, Neurobiol O, Steriade M (1999): Coherent oscillations and short‐term plasticity in corticothalamic networks. Trends Neurosci 22:337–345. [DOI] [PubMed] [Google Scholar]
- Classen J, Gerloff C, Honda M, Hallett M (1998): Integrative visuomotor behavior is associated with interregionally coherent oscillations in the human brain. J Neurophysiol 79:1567–1573. [DOI] [PubMed] [Google Scholar]
- Clemens Z, Mölle M, Eross L, Barsi P, Halász P, Born J (2007): Temporal coupling of parahippocampal ripples, sleep spindles and slow oscillations in humans. Brain 130:2868–2878. [DOI] [PubMed] [Google Scholar]
- Cohen MX, Wilmes K, van de Vijver I (2011): Cortical electrophysiological network dynamics of feedback learning. Trends Cogn Sci 15:558–566. [DOI] [PubMed] [Google Scholar]
- Dang‐Vu TT, Schabus M, Desseilles M, Sterpenich V, Bonjean M, Maquet P (2010): Functional neuroimaging insights into the physiology of human sleep. Sleep 33:1589–1603. [DOI] [PMC free article] [PubMed] [Google Scholar]
- Dave AS, Margoliash D (2000): Song replay during sleep and computational rules for sensorimotor vocal learning. Science 290:812–816. [DOI] [PubMed] [Google Scholar]
- De Gennaro L, Ferrara M (2003): Sleep spindles: An overview. Sleep Med Rev 7:423–440. [DOI] [PubMed] [Google Scholar]
- de Pasquale F, Della Penna S, Snyder AZ, Lewis C, Mantini D, Marzetti L, Belardinelli P, Ciancetta L, Pizzella V, Romani GL, Corbetta M (2010): Temporal dynamics of spontaneous MEG activity in brain networks. Proc Natl Acad Sci USA 107:6040–6045. [DOI] [PMC free article] [PubMed] [Google Scholar]
- Diekelmann S, Born J (2010): The memory function of sleep. Nat Rev Neurosci 11:114–126. [DOI] [PubMed] [Google Scholar]
- Drummond SP, Brown GG, Gillin JC, Stricker JL, Wong EC, Buxton RB (2000): Altered brain response to verbal learning following sleep deprivation. Nature 403:655–657. [DOI] [PubMed] [Google Scholar]
- Fogel SM, Smith CT (2011): The function of the sleep spindle: A physiological index of intelligence and a mechanism for sleep‐dependent memory consolidation. Neurosci Biobehav Rev 35:1154–1165. [DOI] [PubMed] [Google Scholar]
- Fogel SM, Smith CT, Cote KA (2007): Dissociable learning‐dependent changes in REM and non‐REM sleep in declarative and procedural memory systems. Behav Brain Res 180:48–61. [DOI] [PubMed] [Google Scholar]
- Foster DJ, Wilson MA (2006): Reverse replay of behavioural sequences in hippocampal place cells during the awake state. Nature 440:680–683. [DOI] [PubMed] [Google Scholar]
- Fujisawa S, Buzsáki G (2011): A 4 Hz oscillation adaptively synchronizes prefrontal, VTA, and hippocampal activities. Neuron 72:153–165. [DOI] [PMC free article] [PubMed] [Google Scholar]
- Hämäläinen M, Ilmoniemi R (1993): Magnetoencephalography ‐ theory, instrumentation, and applications to noninvasive studies of the working human brain. Rev Mod Phys 65:413–497. [Google Scholar]
- Hipp JF, Hawellek DJ, Corbetta M, Siegel M, Engel AK (2012): Large‐scale cortical correlation structure of spontaneous oscillatory activity. Nat Neurosci 15:884–890. [DOI] [PMC free article] [PubMed] [Google Scholar]
- Hoffman KL, McNaughton BL (2002a): Coordinated reactivation of distributed memory traces in primate neocortex. Science 297:2070–2073. [DOI] [PubMed] [Google Scholar]
- Hoffman KL, McNaughton BL (2002b): Sleep on it: Cortical reorganization after‐the‐fact. Trends Neurosci 25:1–2. [DOI] [PubMed] [Google Scholar]
- Huber R, Ghilardi MF, Massimini M, Ferrarelli F, Riedner BA, Peterson MJ, Tononi G (2006): Arm immobilization causes cortical plastic changes and locally decreases sleep slow wave activity. Nat Neurosci 9:1169–1176. [DOI] [PubMed] [Google Scholar]
- Huber R, Ghilardi MF, Massimini M, Tononi G (2004): Local sleep and learning. Nature 430:78–81. [DOI] [PubMed] [Google Scholar]
- Jensen O, Kaiser J, Lachaux J‐P (2007): Human gamma‐frequency oscillations associated with attention and memory. Trends Neurosci 30:317–324. [DOI] [PubMed] [Google Scholar]
- Ji D, Wilson MA (2007): Coordinated memory replay in the visual cortex and hippocampus during sleep. Nat Neurosci 10:100–107. [DOI] [PubMed] [Google Scholar]
- Johnson LA, Euston DR, Tatsuno M, McNaughton BL (2010): Stored‐trace reactivation in rat prefrontal cortex is correlated with down‐to‐up state fluctuation density. J Neurosci 30:2650–2661. [DOI] [PMC free article] [PubMed] [Google Scholar]
- Jung TP, Makeig S, Humphries C, Lee TW, McKeown MJ, Iragui V, Sejnowski TJ (2000): Removing electroencephalographic artifacts by blind source separation. Psychophysiology 37:163–178. [PubMed] [Google Scholar]
- Kattler H, Dijk DJ, Borbély AA (1994): Effect of unilateral somatosensory stimulation prior to sleep on the sleep EEG in humans. J Sleep Res 3:159–164. [DOI] [PubMed] [Google Scholar]
- Kilner JM, Paulignan Y, Boussaoud D (2004): Functional connectivity during real vs imagined visuomotor tasks: An EEG study. Neuroreport 15:637–642. [DOI] [PubMed] [Google Scholar]
- Kopell N, Ermentrout GB, Whittington M a, Traub RD (2000): Gamma rhythms and beta rhythms have different synchronization properties. Proc Natl Acad Sci USA 97:1867–1872. [DOI] [PMC free article] [PubMed] [Google Scholar]
- Liu Z, Fukunaga M, de Zwart J a, Duyn JH (2010): Large‐scale spontaneous fluctuations and correlations in brain electrical activity observed with magnetoencephalography. Neuroimage 51:102–111. [DOI] [PMC free article] [PubMed] [Google Scholar]
- Louie K, Wilson MA (2001): Temporally structured replay of awake hippocampal ensemble activity during rapid eye movement sleep. Neuron 29:145–156. [DOI] [PubMed] [Google Scholar]
- Makeig S, Delorme A, Westerfield M, Jung T‐P, Townsend J, Courchesne E, Sejnowski TJ (2004): Electroencephalographic brain dynamics following manually responded visual targets. PLoS Biol 2:e176. [DOI] [PMC free article] [PubMed] [Google Scholar]
- Maquet P, Laureys S, Peigneux P, Fuchs S, Petiau C, Phillips C, Aerts J, Del Fiore G, Degueldre C, Meulemans T, Luxen A, Franck G, Van Der Linden M, Smith C, Cleeremans A (2000): Experience‐dependent changes in cerebral activation during human REM sleep. Nat Neurosci 3:831–836. [DOI] [PubMed] [Google Scholar]
- Mazaheri A, Coffey‐Corina S, Mangun GR, Bekker EM, Berry AS, Corbett BA (2010): Functional disconnection of frontal cortex and visual cortex in attention‐deficit/hyperactivity disorder. Biol Psychiatry 67:617–623. [DOI] [PubMed] [Google Scholar]
- Mazaheri A, Nieuwenhuis ILC, van Dijk H, Jensen O (2009): Prestimulus alpha and mu activity predicts failure to inhibit motor responses. Hum Brain Mapp 30:1791–1800. [DOI] [PMC free article] [PubMed] [Google Scholar]
- Milner B (1962): Les troubles de la memoire accompagnant des lesions hippocampiques bilaterales In: Physiol. l'hippocampe. Paris: C.N.C.R. pp 257–272. [Google Scholar]
- Moisello C, Meziane HB, Kelly S, Perfetti B, Kvint S, Voutsinas N, Blanco D, Quartarone A, Tononi G, Ghilardi MF (2013): Neural activations during visual sequence learning leave a trace in post‐training spontaneous EEG. PLoS One 8:e65882. [DOI] [PMC free article] [PubMed] [Google Scholar]
- Mölle M, Marshall L, Gais S, Born J (2004): Learning increases human electroencephalographic coherence during subsequent slow sleep oscillations. Proc Natl Acad Sci USA 101:13963–13968. [DOI] [PMC free article] [PubMed] [Google Scholar]
- Nichols TE, Holmes AP (2002): Nonparametric permutation tests for functional neuroimaging: A primer with examples. Hum Brain Mapp 15:1–25. [DOI] [PMC free article] [PubMed] [Google Scholar]
- Oostenveld R, Fries P, Maris E, Schoffelen J‐M (2011): FieldTrip: Open source software for advanced analysis of MEG, EEG, and invasive electrophysiological data. Comput Intell Neurosci 2011:156869. [DOI] [PMC free article] [PubMed] [Google Scholar]
- Paller KA, Voss JL (2004): Memory reactivation and consolidation during sleep. Learn Mem 11:664–670. [DOI] [PMC free article] [PubMed] [Google Scholar]
- Palva JM, Palva S (2012a): Infra‐slow fluctuations in electrophysiological recordings, blood‐oxygenation‐level‐dependent signals, and psychophysical time series. Neuroimage 62:2201–2211. [DOI] [PubMed] [Google Scholar]
- Palva S, Palva JM (2012b): Discovering oscillatory interaction networks with M/EEG: Challenges and breakthroughs. Trends Cogn Sci 16:219–230. [DOI] [PubMed] [Google Scholar]
- Pascual‐Marqui RD (2002): Standardized low‐resolution brain electromagnetic tomography (sLORETA): Technical details. Methods Find Exp Clin Pharmacol 24(Suppl D):5–12. [PubMed] [Google Scholar]
- Peigneux P, Laureys S, Fuchs S, Destrebecqz A, Collette F, Delbeuck X, Phillips C, Aerts J, Del Fiore G, Degueldre C, Luxen A, Cleeremans A, Maquet P (2003): Learned material content and acquisition level modulate cerebral reactivation during posttraining rapid‐eye‐movements sleep. Neuroimage 20:125–134. [DOI] [PubMed] [Google Scholar]
- Peigneux P, Laureys S, Fuchs S, Collette F, Perrin F, Reggers J, Phillips C, Degueldre C, Del Fiore G, Aerts J, Luxen A, Maquet P (2004): Are spatial memories strengthened in the human hippocampus during slow wave sleep? Neuron 44:535–545. [DOI] [PubMed] [Google Scholar]
- Peyrache A, Khamassi M, Benchenane K, Wiener SI, Battaglia FP (2009): Replay of rule‐learning related neural patterns in the prefrontal cortex during sleep. Nat Neurosci 12:919–926. [DOI] [PubMed] [Google Scholar]
- Peyrache A, Battaglia FP, Destexhe A (2011): Inhibition recruitment in prefrontal cortex during sleep spindles and gating of hippocampal inputs. Proc Natl Acad Sci USA 108:17207–17212. [DOI] [PMC free article] [PubMed] [Google Scholar]
- Pfurtscheller G, Lopes da Silva FH (1999): Event‐related EEG/MEG synchronization and desynchronization: Basic principles. Clin Neurophysiol 110:1842–1857. [DOI] [PubMed] [Google Scholar]
- Pfurtscheller G, Neuper C (1997): Motor imagery activates primary sensorimotor area in humans. Neurosci Lett 239:65–68. [DOI] [PubMed] [Google Scholar]
- Pfurtscheller G, Pregenzer M, Neuper C (1994): Visualization of sensorimotor areas involved in preparation for hand movement based on classification of mu and central beta rhythms in single EEG trials in man. Neurosci Lett 181:43–46. [DOI] [PubMed] [Google Scholar]
- Pfurtscheller G, Neuper C, Andrew C, Edlinger G (1997): Foot and hand area mu rhythms. Int J Psychophysiol 26:121–135. [DOI] [PubMed] [Google Scholar]
- Poe GR, Walsh CM, Bjorness TE (2010): Cognitive neuroscience of sleep. Prog Brain Res 185:1–19. [DOI] [PMC free article] [PubMed] [Google Scholar]
- Quilichini P, Sirota A, Buzsáki G (2010): Intrinsic circuit organization and theta‐gamma oscillation dynamics in the entorhinal cortex of the rat. J Neurosci 30:11128–11142. [DOI] [PMC free article] [PubMed] [Google Scholar]
- Rasch B, Born J (2007): Maintaining memories by reactivation. Curr Opin Neurobiol 17:698–703. [DOI] [PubMed] [Google Scholar]
- Rechtschaffen A, Kales A, editors (1968): A manual of standardized terminology, techniques and scoring system for sleep stages of human subjects. Los Angeles, CA: BIS/BRI, UCLA. [DOI] [PubMed] [Google Scholar]
- Roelfsema PR, Engel AK, König P, Singer W (1997): Visuomotor integration is associated with zero time‐lag synchronization among cortical areas. Nature 385:157–161. [DOI] [PubMed] [Google Scholar]
- Schoffelen J‐M, Gross J (2009): Source connectivity analysis with MEG and EEG. Hum Brain Mapp 30:1857–1865. [DOI] [PMC free article] [PubMed] [Google Scholar]
- Seltzer B, Pandya DN (1994): Parietal, temporal, and occipital projections to cortex of the superior temporal sulcus in the rhesus monkey: A retrograde tracer study. J Comp Neurol 343:445–463. [DOI] [PubMed] [Google Scholar]
- Senkowski D, Schneider TR, Foxe JJ, Engel AK (2008): Crossmodal binding through neural coherence: Implications for multisensory processing. Trends Neurosci 31:401–409. [DOI] [PubMed] [Google Scholar]
- Siegel M, Donner TH, Oostenveld R, Fries P, Engel AK (2008): Neuronal synchronization along the dorsal visual pathway reflects the focus of spatial attention. Neuron 60:709–719. [DOI] [PubMed] [Google Scholar]
- Steriade M, McCarley RW (2005): Brainstem control of wakefulness and sleep 2nd ed New York: Plenum Press. [Google Scholar]
- Takashima A, Petersson KM, Rutters F, Tendolkar I, Jensen O, Zwarts MJ, McNaughton BL, Fernández G (2006): Declarative memory consolidation in humans: A prospective functional magnetic resonance imaging study. Proc Natl Acad Sci USA 103:756–761. [DOI] [PMC free article] [PubMed] [Google Scholar]
- Van Der Werf YD, Altena E, Schoonheim MM, Sanz‐Arigita EJ, Vis JC, De Rijke W, Van Someren EJW (2009): Sleep benefits subsequent hippocampal functioning. Nat Neurosci 12:122–123. [DOI] [PubMed] [Google Scholar]
- van Dongen EV, Takashima A, Barth M, Fernández G (2011): Functional connectivity during light sleep is correlated with memory performance for face‐location associations. Neuroimage 57:262–270. [DOI] [PubMed] [Google Scholar]
- Varela F, Lachaux J‐P, Rodriguez E, Martinerie J (2001): The brainweb: Phase synchronization and large‐scale integration. Nat Rev Neurosci 2:229–239. [DOI] [PubMed] [Google Scholar]
- Volgushev M, Chauvette S, Timofeev I (2011): Long‐range correlation of the membrane potential in neocortical neurons during slow oscillation. Prog Brain Res 193:181–199. [DOI] [PMC free article] [PubMed] [Google Scholar]
- Walker MP (2005): A refined model of sleep and the time course of memory formation. Behav Brain Sci 28:51–64; discussion 64–104. [DOI] [PubMed] [Google Scholar]
- Wilson MA, McNaughton BL (1994): Reactivation of hippocampal ensemble memories during sleep. Science 265:676–679. [DOI] [PubMed] [Google Scholar]
- Witham CL, Riddle CN, Baker MR, Baker SN (2011): Contributions of descending and ascending pathways to corticomuscular coherence in humans. J Physiol 589:3789–3800. [DOI] [PMC free article] [PubMed] [Google Scholar]
- Yoo S‐S, Hu PT, Gujar N, Jolesz FA, Walker MP (2007): A deficit in the ability to form new human memories without sleep. Nat Neurosci 10:385–392. [DOI] [PubMed] [Google Scholar]
- Zeineh MM, Engel S, Thompson PM, Bookheimer SY (2003): Dynamics of the hippocampus during encoding and retrieval of face‐name pairs. Science 299:577–580. [DOI] [PubMed] [Google Scholar]