

Abstract
The term leuko‐araiosis (LA) describes a common chronic affection of the cerebral white matter (WM) in the elderly due to small vessel disease with variable clinical correlates. To explore whether severity of LA entails some adaptive reorganization in the cerebral cortex we evaluated with functional MRI (fMRI) the cortical activation pattern during a simple motor task in 60 subjects with mild cognitive impairment and moderate or severe (moderate‐to‐severe LA group, n = 46) and mild (mild LA group, n = 14) LA extension on visual rating. The microstructural damage associated with LA was measured on diffusion tensor data by computation of the mean diffusivity (MD) of the cerebral WM and by applying tract based spatial statistics (TBSS). Subjects were examined with fMRI during continuous tapping of the right dominant hand with task performance measurement. Moderate‐to‐severe LA group showed hyperactivation of left primary sensorimotor cortex (SM1) and right cerebellum. Regression analyses using the individual median of WM MD as explanatory variable revealed a posterior shift of activation within the left SM1 and hyperactivation of the left SMA and paracentral lobule and of the bilateral cerebellar crus. These data indicate that brain activation is modulated by increasing severity of LA with a local remapping within the SM1 and increased activity in ipsilateral nonprimary sensorimotor cortex and bilateral cerebellum. These potentially adaptive changes as well lack of contralateral cerebral hemisphere hyperactivation are in line with sparing of the U fibers and brainstem and cerebellar WM tracts and the emerging microstructual damage of the corpus callosum revealed by TBSS with increasing severity of LA. Hum Brain Mapp 35:819–830, 2014. © Wiley Periodicals, Inc.
Keywords: leuko‐araiosis, functional MRI, motor function, diffusion tensor
INTRODUCTION
The term leuko‐araiosis (LA) describes a common condition of the elderly characterized by diffuse damage of the cerebral white matter (WM) presumably due to small vessel disease, which is associated with variable disability and increased mortality [Inzitari et al., 2009]. Conventional T2 weighted and FLAIR images demonstrate LA as areas of high signal intensity with variable extension that constitutes the basis to rate LA with visual scales [De Carli et al., 2005; Fazekas et al., 1987; Pantoni et al., 2005]. Diffusion weighted and diffusion tensor imaging (DTI) are preferable to visual scales for quantification of LA since they are sensitive to the microstructural damage of both the visually normal and abnormal appearing WM [Della Nave et al., 2007; Maillard et al., 2011; Mascalchi et al., 2002a, 2002b; O'Sullivan et al., 2001, 2004; Otsuka et al., 2012].
Functional MR Imaging (fMRI) is contributing significant advances in the knowledge of the brain physiology of motor function of the hand in healthy subjects [Davare et al., 2011] and its physiopathology in patients with different neurological diseases, including stroke [Johansen‐Berg, 2007; Johansen‐Berg et al., 2002; Pineiro et al., 2001] and inherited WM diseases of vascular origin such as cerebral autosomal dominant arteriopathy with subcortical infarcts and leukoencephalopathy (CADASIL) [Reddy et al., 2002] and Fabry disease [Gavazzi et al., 2006]. In particular, fMRI during hand motor tasks in poststroke patients revealed three main phenomena associated with motor adaptive reorganization: (1) local remapping within the activated primary sensorimotor (SM1) cortex with a posterior or ventral shift in the location of the activation in the primary motor cortex; (2) increased activity in ipsilateral nonprimary sensorimotor areas, including the precentral motor cortex, supplementary motor areas (SMA), and posterior parietal regions; (3) increased activity in the undamaged contralateral cerebral hemisphere [Johansen‐Berg, 2007; Johansen‐Berg et al., 2002; Pineiro et al., 2001]. These features were partially replicated in patients with CADASIL or Fabry disease examined with fMRI during hand motor tasks [Gavazzi et al., 2006; Reddy et al., 2002].
Despite the high prevalence of LA and its impact on disability and mortality [Inzitari et al., 2009] and the need to identify possible effective interventions for the clinical consequences of LA, so far the cortical functional activity has been little explored with fMRI in subjects with LA [Sun et al., 2011; Tadic et al., 2010]. In particular, it has not been established if the WM damage entails some motor adaptive reorganization in the cerebral cortex. This could account for the mild and generally late clinical motor deficits observed predominantly as a gait disturbance in subjects with LA despite its sometimes considerable extension [Brickman et al., 2011; List et al., 2011, in press; Otsuka et al., 2012; Pantoni, 2010; Zheng et al., 2011].
We hypothesized that the slowly progressing process underlying LA could modify brain activation pattern and considered, for fMRI investigation, a simple motor task of the dominant hand taking into account that hand function is typically spared in subjects with LA (LADIS study group, 2011). This aspect is crucial for application of fMRI to individuals who may present behavioral deficits as a consequence of their neurological disease [Johansen‐Berg, 2007; Price et al., 2006]. To assess our hypothesis, we examined a cohort of elderly subjects with varying degree of LA at visual assessment who were screened for a longitudinal study of vascular mild cognitive impairment (MCI) [Poggesi et al., 2012]. In particular, we first explored if the subjects with moderate or severe LA extension (moderate‐to‐severe LA group) showed a different activation pattern during the hand task as compared to the subjects with mild LA (mild LA group) and, second, if severity of LA as measured in DTI would modulate brain activation according to a dose‐response linear model.
For such purposes, we used a right hand tapping which was monitored with a custom built MR‐compatible device enabling on‐line control of the subject's performance [Diciotti et al., 2007]. The burden of LA was assessed by visual rating [Pantoni et al., 2005] but also by measuring the severity of the microstructural damage associated with LA from DTI with computation of the mean diffusivity (MD) and fractional anisotropy (FA) of the global WM of the cerebral hemispheres [Della Nave et al., 2007] and with regional analysis of the MD and FA maps using tract‐based spatial statistics (TBSS) [Smith et al., 2007].
MATERIALS AND METHODS
Participants
For the present investigation we considered 84 consecutive right‐handed subjects with evidence of MCI and mild, moderate or severe extension of LA on conventional MR examination (see below) who were screened for a longitudinal ongoing study named vascular mild cognitive impairment (VMCI) Tuscany study that is aimed to identify possible determinants of transition from MCI to dementia in subjects with LA [Poggesi et al., 2012].
To be included in the VMCI Tuscany study, the subjects had to satisfy the following criteria: (1) presence of MCI, defined according to Winblad et al. [ 2002], and (2) evidence on MRI of LA of moderate to severe degrees (score 2 or 3) according to the modified version of the Fazekas scale [Pantoni et al., 2005]. In particular, they should be judged as both not normal and not fulfilling diagnostic criteria for dementia (DSM IV, ICD 10). Moreover, they should have preserved basic activities of daily living or minimal impairment in complex instrumental functions in combination with evidence of cognitive decline, measured either by self and/or informant report in conjunction with deficits on objective cognitive tasks, and/or evidence of decline over time on objective neuropsychological tests [Winblad et al., 2004]. Moreover, they had to score grade 2 or 3 LA on a 0–3 visual scale on FLAIR T2 weighted images as rated by a single observer (L.P.) with 15 years of experience who was blind to the clinical and functional data. Grade 2 (moderate changes) entails single hyperintense lesions 10–20 mm, and hyperintense areas linked by no more than “connecting bridges” >20 mm in any diameter. Grade 3 (severe changes) entails both single and confluent hyperintense areas of ≥ 20 mm in any diameter [Pantoni et al., 2005]. A total of 63 subjects satisfied the two above criteria to be included in the Tuscany VMCI study and constituted the moderate‐to‐severe LA group. They underwent a thorough clinical, neuropsychological, and laboratory assessment [Poggesi et al., 2012] along with a dedicated MRI study.
For the purpose of the present investigation, we included 21 additional subjects screened for the VMCI study who satisfied criteria for MCI but had mild (grade 1) LA at visual assessment (and were accordingly excluded from the VMCI study). Grade 1 entails single lesions <10 mm and/or areas of “grouped” lesions <20 mm in any diameter [Pantoni et al., 2005]. They constituted the mild LA group of the present investigation and underwent the same MRI study of the moderate‐to‐severe LA group.
Each subject provided a written informed consent, and the study was approved by local ethical committees. Subjects with cortical infarcts and other causes of WM lesions (multiple sclerosis, history of brain irradiation, etc.) were excluded from the moderate‐to‐severe and mild LA groups as well subjects who could not give an informed consent to undergo MRI.
Hand lateralization was defined according to Edinburgh handedness scale [Oldfield, 1991].
MR Examination
The subjects were examined on a clinical 1.5 T system (Intera, Philips Medical System, Best, The Netherlands) with 33 mT/m gradients capability and a head coil with SENSE technology.
After scout, the examination protocol included a sagittal T1 weighted 3D T1‐weighted turbo gradient echo sequence [repetition time (TR) = 8.1 ms, echo time (TE) = 3.7 ms, flip angle = 8°, inversion time (TI) = 764 ms, field of view (FOV) = 256 mm, matrix size = 256 × 256, 160 contiguous slices, slice thickness = 1 mm, number of excitations (NEX) = 1] axial FLAIR sequence (TR = 11,000 ms, TE = 140 ms, TI = 2800 ms, FOV = 230 mm, matrix size = 320 × 216, contiguous slices, slice thickness = 5 mm, NEX = 2) and axial single‐shot echo planar imaging sequence [(TR = 9394 ms, TE = 89 ms, FOV = 256 mm, matrix size = 128 × 128, 50 slices, slice thickness = 3 mm, no gap, NEX = 3; diffusion sensitizing gradients applied along 15 noncollinear directions using b value of 0 (b0 image) and 1000 s/mm2)] for DTI.
For the fMRI experiments we used a T2* weighted echo planar imaging sequence [TR = 3.0 s, TE = 50 ms, flip angle = 90°, FOV 240 × 240 mm, matrix 64 × 64, SENSE acceleration factor = 1, 2 dummy volumes] exploiting the BOLD effect. Twenty‐four contiguous axial 6 mm thick images were acquired parallel to the bi‐commissural plane using the in‐scanner image intensity equalizing algorithm (i.e., Constant Level AppeaRance, CLEAR). Using a block design, where six periods of activation were alternated with six periods of rest, each block lasting 30 s, the total acquisition time for each task was about 6 min.
The subject was requested to perform the hand tapping task continuously at a self‐paced frequency without visual feedback. Also force was freely chosen by the subject but he/she was requested to maintain the two variables as constant as possible during the experiment. After checking the capability of the subject to perform the tasks and a brief training outside the magnet, the subject performed a shame trial within the magnet with the monitoring device on before starting fMRI acquisitions. The device measures the force and frequency exerted by the subject in pressing an air‐filled rubber bulb with the last four fingers and its characteristics were previously described [Diciotti et al., 2007; Ginestroni et al., 2012]. It enables to visualize in real time the subject's behavior and to measure off‐line the frequency and the force exerted.
The task was externally paced using spoken words “go” and “stop” to initiate and terminate active blocks and the subjects were instructed to keep their eyes closed during fMRI acquisition.
3D T1‐weighted turbo gradient echo scans were used to facilitate anatomical localization of the functional data after registration.
Data Analyses
Behavioral features
In real‐time, each force signal was inspected for possible gross errors including hand‐tapping interruption during active phases or hand‐tapping during resting phases. The force signals were recorded by a PC and processed by software analysis in order to extract quantitative parameters, which describe the motor performance [Diciotti et al., 2007]. To this end, the task was analyzed in terms of strength and frequency of flexion‐extension of the last four fingers of the hand. For each parameter, the mean value and the coefficient of variation (CV) throughout the task were computed. Tasks performed with frequency or force CVs greater than 25% were assumed to be executed in an irregular way and were discarded from further analyses [Diciotti et al., 2007]. For each trial, the force signal was also examined to determine a possible fatigue phenomena, defined as a reduction of 40% or more of the force exerted to press the bulb within each active block or between active blocks [Liu et al., 2005].
The difference between moderate‐to‐severe and mild LA group for all the behavioral features was assessed with a Mann–Whitney U test (significance value P < 0.05).
Custom T1 template construction
Individual morphological alterations can significantly impact the accuracy of registration to a standard brain template. Since substantial brain atrophy is common in subjects with LA [O'Sullivan et al., 2008], in order to improve coregistration of the fMRI data, we built a custom T1 template, which was bootstrapped from the T1‐weighted images of all the final 60 subjects (46 moderate‐to‐severe LA and 14 mild LA patients) (see below) using the ANTs package [Avants et al., 2011] following the procedure in [Avants et al., 2010]. Briefly, coregistrations of individual brain images were iteratively refined to create a group average, which is often referred to as an optimal average template. In particular, the algorithm works within the diffeomorphic space towards building an average shape and appearance brain by reducing dependence on the topological idiosyncrasy of any individual brain. Within the ANTs package, the SyN tool is called to nonlinearly coregister all brain images to one another in an iterative manner for subsequent intensity averaging. The procedure is repeated recursively, thereby iteratively refining the coregistration of the constituent images. Five global iterations were used to build the final template in this study.
Diffusion‐Weighted Image processing
Diffusion‐weighted images were corrected for head motion and eddy current distortions using FDT (FMRIB's Diffusion Toolbox 2.0), part of FSL 4.1.9 [Smith et al., 2004] after which brain tissue was segmented using BET [Smith, 2002]. The b‐matrix was reoriented by applying the rotational part of the affine transformation employed in the eddy‐correction step [Leemans and Jones, 2009]. A tensor model was fitted to the raw data using a constrained nonlinear least squares procedure implemented in the software package CAMINO [Cook et al., 2006], and residual nonpositive definite tensors (in isolated regions where the nonlinear algorithm failed to converge, mainly located at the edge of the brain) were removed by tensor interpolation in the log‐euclidean domain [Arsigny et al., 2006]. FA and MD were then computed from the estimated tensor field.
Analysis of microstructural damage of the cerebral WM
The segmentation method employed to obtain cerebral WM masks for computation of the median individual value of MD and FA in cerebral WM was previously detailed [De Stefano et al., 2006]. Briefly, WM segmentation on T1‐weighted images was carried out using FAST 4 [Zhang et al., 2001], part of FSL [Smith et al., 2004]. To reduce partial volume effects, a preliminary WM mask was obtained by retaining only those voxels, which had a tissue class probability equal or above 0.75. A standard space WM mask made on MNI152 average normal brain was then applied to the coregistered WM mask on the T1 native image space, in order to retain identical cerebral regions across subjects. WM masks were then superimposed, after coregistration between the T1 and b0 image using affine transformation with 12 degrees of freedom [Jenkinson and Smith, 2001], to the MD and FA maps. Finally, the median of the MD and FA distribution in the cerebral WM masks were calculated and their correlation assessed with the r Pearson coefficient.
TBSS
Voxelwise statistical analysis of FA and MD data was carried out using TBSS [Smith et al., 2006], also part of FSL, which involves: (a) nonlinear registration of every FA image to every other one; (b) identification of the “most representative image” as the one which requires the least warping to align every other image to it; (c) affine alignment of this target image into MNI152 space; (d) transformation of every other image into MNI space by combining the single nonlinear transforms into the target image with the affine transform into MNI space; (e) creation of a mean FA image, and (f) thinning to create a mean FA skeleton that represents the centers of all tracts common to the group. Each subject's aligned FA data was then projected onto this skeleton, and previously computed warps were successively applied to MD images, thereby transforming all images into MNI space for subsequent skeletonization as above. Resulting data was then fed into voxelwise cross‐subject statistics. The latter included full correction for multiple comparisons over space using permutation‐based nonparametric inference within the framework of the general linear model (GLM) (10,000 permutations). P‐values were calculated and corrected for multiple comparisons using the “2D” parameter settings with threshold‐free cluster enhancement (TFCE), thereby avoiding the use of an arbitrary threshold for the initial cluster‐formation [Smith and Nichols, 2009] and were considered significant for P < 0.05. In the model, all subjects (n = 60) were considered as a single population, and a nonparametric one‐sample t‐test was employed in order to test for significant correlation of the modified Fazekas scale value with voxelwise skeletonized FA and MD values. The design matrix included globally demeaned age and gender terms as covariates of no interest. To perform spatial localization of the significant clusters, we overlaid the corresponding statistical maps with the automated anatomical labeling (AAL) atlas [Tzourio‐Mazoyer et al., 2002].
fMRI
Functional data related to the motor task were analyzed using FEAT (FMRI Expert Analysis Tool), also part of FSL. The following prestatistics processing were applied to the 120 scans: motion correction using MCFLIRT [Jenkinson et al., 2002], nonbrain removal using BET [Smith, 2002], spatial smoothing using a 8 mm full width at half maximum (FWHM) Gaussian kernel, grand‐mean intensity normalization of the entire 4D data set by a single multiplicative factor and high‐pass temporal filtering.
Preliminarily, we assessed in all subjects possible occurrence of head motion unrelated or related to the task execution. In particular, the subjects were excluded from further analyses if absolute head displacement was greater than 3 mm in more than 5 acquisition volumes or if the correlation between movement parameters and task regressors was greater than 0.5 [Gountouna et al., 2010]. The FMRIB's improved linear model [Woolrich et al., 2001] was adopted for statistical analysis in order to determine the activation maps of signal changes between active versus rest periods.
Single‐subject cluster analysis was performed on voxels having Z (Gaussianized T) > 7 and a (cluster‐based corrected) significance threshold of P = 0.001 [Worsley, 2001]. Registration of EPI functional images to the individual high resolution T1‐weighted image was carried out using affine transformation with 12 degrees of freedom [Jenkinson and Smith, 2001]. The individual high‐resolution T1‐weighted images were coregistered to the custom T1‐weighted template using an affine transformation. Finally, the custom template was coregistered to the standard‐space montreal neurological institute (MNI) 152 Brain using an affine transformation.
Within‐group analysis was carried out using one‐sample t‐test to assess the differences between the active and passive blocks in the moderate‐to‐severe LA group and in the mild LA group, respectively, and a mixed effects model using FLAME (FMRIB's Local Analysis of Mixed Effects) [Beckmann et al., 2003; Woolrich, 2008; Woolrich et al., 2004]. Since frequency of both tasks and the force of hand tapping can modulate brain activation [Dai et al., 2001; Deiber et al., 1999; Schlaug et al., 1996] and LA is associated with aging [Rovaris et al., 2003], we inserted frequency, force and age as covariate variables within the GLM matrix. The Z‐statistical maps derived from the within‐group analysis underwent a cluster thresholding with a Z threshold of 6 for the mild LA group and 9 for the moderate‐to‐severe LA group, to partially compensate for the different statistical power inherent to the unbalanced sample size of mild LA and moderate‐to‐severe LA patients. Despite these two cluster thresholding are arbitrary, they were just utilized to preliminary visualize the brain activation pattern during the task. A cluster P threshold of 0.001 [Worsley, 2001] was then applied.
To assess possible differences in BOLD activation pattern between moderate‐to‐severe and mild LA patients, a between‐group analysis was carried out using unpaired t‐test and a fixed effects model by forcing the random effects variance to zero in FLAME [Beckmann et al., 2003; Woolrich et al., 2004]. The resulting Z (Gaussianized T/F) statistic images were thresholded using clusters determined by Z > 10, and a (corrected) cluster significance threshold of P = 0.001 [Worsley, 2001].
Finally, in order to evaluate a possible relationship between changes of cortical activation and LA severity, a linear regression analysis was carried out using one‐sample t‐test and a fixed effects model with the median of MD of the cerebral WM as further explanatory variable.
GLM contrasts for investigating both positive and negative correlation between brain activation and MD were set. Z (Gaussianized T/F) statistic images related to median MD value explanatory variable were thresholded using clusters determined by Z > 8.5 and a (corrected) cluster significance threshold of P = 0.001 [Worsley, 2001]. Also in this analysis we inserted frequency, force, and age as covariate variables.
All group analyses were performed in the custom T1‐weighted template space and the resulting thresholded Z statistic images were transformed into MNI space by applying the affine transform obtained between T1‐weighted template space and MNI space. To achieve spatial localization of the significant clusters of activation identified at the group analyses, we overlaid the corresponding activation maps with the AAL atlas [Tzourio‐Mazoyer et al., 2002].
All the investigators involved in gathering and analyzing the behavioral, DTI, T1‐weighted, and fMRI data were blind to the results concerning the severity of the WM damage on the visual scale.
RESULTS
Two subjects of the moderate‐to‐severe LA group and two of the mild LA group were unable to correctly perform the task in the magnet (frequency CV >25% or gross errors in task execution such as hand‐tapping during periods of rest or no movement during periods of activation) and were excluded from further analyses. Fifteen additional subjects of the moderate‐to‐severe LA group and 4 additional subjects of the mild LA group were excluded from further analyses because of head motion unrelated or in‐phase with the task.
The fMRI and DTI data were ultimately analyzed in 46 subjects belonging to the moderate‐to‐severe LA group (19 women and 27 men; mean age 74.7 ± 7.1 years; age range 60.1–88.2; 24 with 2 visual score and 22 with 3 visual score) and 14 subjects of the mild LA group (8 women and 6 men; mean age 76.0 ± 6.8 years; age range 63.8–87.7). Differences for gender (χ2 test) and age (Mann–Whitney test) between the moderate‐to‐severe and mild LA groups were not significant (P = 0.64 and P = 0.46, respectively).
Behavioral
Table 1 details the features of hand‐tapping execution as measured by the device in the 60 final subjects. All behavioral parameters were not statistically different between the moderate‐to‐severe and mild LA group.
Table 1.
Behavioral data describing the performance of the motor task during fMRI in 46 subjects with MCI and moderate or severe LA and 14 subjects with MCI and mild LA
| Frequency (Hz) | Frequency CV (%) | Force (N) | Force CV (%) | |
|---|---|---|---|---|
| Moderate‐to‐severe LA group | 0.69 ± 0.27(0.27, 1.44) | 9.6 ± 2.8(4.6, 19.8) | 28.5 ± 2.2(23.2, 32.3) | 3.7 ± 1.3(1.4, 7.2) |
| Mild LA group | 0.63 ± 0.21(0.33, 1.08) | 10.7 ± 3.6(5.1, 16.2) | 27.9 ± 3.8(20.6, 32.6) | 3.7 ± 1.6(1.8, 6.5) |
Mean ± standard deviation (minimum value, maximum value) data are reported.
CV, coefficient of variation.
Microstructural Damage of the Cerebral WM
In the whole sample of subjects the median of the cerebral WM MD (7.5 · 10‐4 ± 3.2 · 10‐5 mm2/s, range 7.0 · 10‐4 to 8.3 · 10‐4 mm2/s) significantly correlated (P < 0.001) with the median of the cerebral WM FA (0.29 ± 0.02, range 0.24–0.33) (Pearson r = ‐0.83).
The regression TBSS analysis revealed that with increasing severity of LA visual extension an increase of MD and decrease of FA involved the long WM tracts of the cerebral hemispheres with relative sparing of the U fibers (Fig. 1 and Supporting Information Fig. 1). Similar changes were observed in transcallosal fibers, whereas the WM tracts in the brainstem and cerebellum were essentially preserved but for a small cluster of increased MD in the right cerebral peduncle. The increase of the MD was generally more extensive than the decrease of FA.
Figure 1.
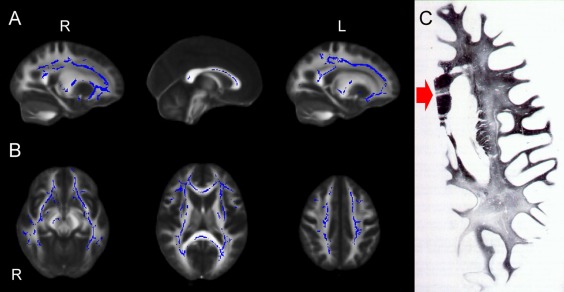
(A–C) Sagittal (A) and axial (B) view of the results of voxel‐based analysis of MD maps by using TBSS. Blue shows regions where MD correlates significantly with LA visual score. All results are adjusted for age and gender. Permutation‐based nonparametric inference (10,000 permutations) including full correction for multiple comparison over space was performed using threshold‐free cluster enhancement (TFCE). An increased MD of the long cerebral WM tracts and of the transcallosal fibers with relative sparing of the U fibers is observed with increasing LA visual score. The WM tracts in the brainstem and cerebellum are essentially preserved except for a small cluster of increased MD in the right cerebral peduncle. (C) Woelke stain for myelin in a case of Binswanger's disease shows diffuse discoloration of the left cerebral white matter with relative sparing of the U fibers. Note the linear discoloration in the genu of the corpus callosum (red arrow) consistent with selective trancallosal tract degeneration (reprinted with permission from Mascalchi et al. Can J Neurol Sci 1989;16:214–218).
fMRI
Within‐group analyses
During right hand tapping, both moderate‐to‐severe and mild LA group showed activation in the left precentral and postcentral gyrus corresponding to the SM1 cortex, bilateral SMA, left thalamus, and bilateral cerebellum (lobule 5 and 4) more pronounced in the right (Supporting Information Fig. 2).
Figure 2.
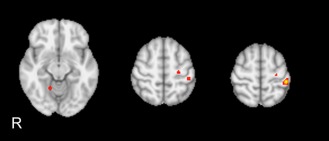
Between‐group statistical activation map. The moderate‐to‐severe LA group shows significant (Z > 10, P = 0.001 corrected) hyperactivation of left precentral and postcentral gyrus and right cerebellar lobule 5 as compared to mild LA group. No area of hypoactivation was observed in the moderate‐to‐severe LA group.
Between‐group
Moderate‐to‐severe LA group showed hyperactivation of left precentral and postcentral gyrus and right cerebellar lobule 5 as compared to mild LA group (Fig. 2 and Table 2). No area of hypoactivation was observed in the moderate‐to‐severe LA group.
Table 2.
Extent and maximum Z score of clusters of hyperactivation in the moderate‐to‐severe LA group as compared to the mild LA group revealed by between‐group analysis using unpaired t‐test (Z > 10, P = 0.001 corrected)
| AAL anatomical area | Cluster extent (voxels) | Z max | Z max x (mm) | Z max y (mm) | Z max z (mm) |
|---|---|---|---|---|---|
| Cortical | |||||
| L Postcentral | 152 | 15.5 | −44 | −32 | 60 |
| L Precentral | 43 | 11.8 | −26 | −20 | 56 |
| Subcortical | |||||
| R Cerebellum_4_5 | 25 | 12.1 | 16 | −52 | −14 |
L, left; R, right; AAL, Automated Anatomical Labeling.
Coordinates are expressed in MNI standard space. Only AAL areas including 20 or more adjacent activated voxels that were statistically significant were considered.
Regression analyses
Using the individual median of WM MD as explanatory variable we observed four areas of activation, which increased significantly with increasing MD that were located in the left pre and postcentral gyrus (co‐ordinates of the center of mass of the maximum Z‐scores: x = ‐20, y = ‐28, z = 66) extending to the left SMA and left paracentral lobule, respectively, and bilateral cerebellar crus. A single area of significantly increased activation with decreasing MD was observed in the left precentral gyrus (co‐ordinates of the center of mass of the maximum Z‐score: x = ‐40, y = ‐14, z = 56) (Fig. 3, Table 3). The combination of the two above phenomena in the SM1 realizes a posterior shift of the activation in the motor area with increasing severity of microstructural damage associated with LA.
Figure 3.
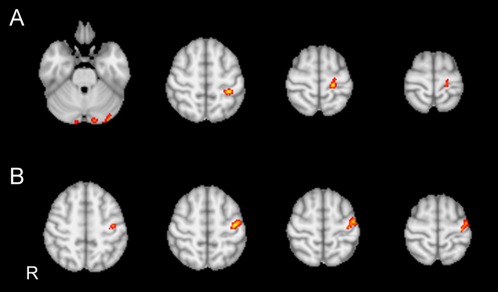
(A, B) Regression analyses in 60 subjects obtained by introducing median of the WM MD as a further explanatory variable in the GLM design matrix. (A) Activation significantly (Z > 8.5, P = 0.001 corrected) increases with increasing MD in the left pre‐ and postcentral gyrus extending to the left SMA and left paracentral lobule, respectively, and in the bilateral cerebellar crus. (B) Activation increases with decreasing MD in a single circumscribed area in left precentral gyrus.
Table 3.
Extent and maximum Z score of significant clusters of activation (Z > 8.5, P = 0.001 corrected) revealed by regression analyses in 60 subjects with MCI obtained by introducing median of the WM MD as a further explanatory variable in the GLM design matrix
| AAL anatomical area | Cluster extent (voxels) | Z max | Z max x (mm) | Z max y (mm) | Z max z (mm) |
|---|---|---|---|---|---|
| Increase of activation with increasing MD | |||||
| Cortical | |||||
| L Postcentral | 167 | 12.6 | −20 | −28 | 66 |
| L Precentral | 96 | 11.9 | −16 | −14 | 78 |
| Subcortical | |||||
| L Cerebellum Crus1 | 147 | 10.7 | −12 | −86 | −24 |
| R Cerebellum Crus2 | 31 | 10.3 | 12 | −92 | −30 |
| Increase of activation with decreasing MD | |||||
| Cortical | |||||
| L Precentral | 342 | 12.9 | −40 | −14 | 56 |
L, left; R, right; AAL, Automated Anatomical Labeling.
Coordinates are expressed in MNI standard space. Only AAL areas including 20 or more adjacent activated voxels that were statistically significant were considered.
DISCUSSION
The present fMRI investigation indicates that, in elderly subjects with MCI and varying extension of LA, activation of the brain during right hand tapping is modulated by the burden of the damage of the cerebral WM as measured using visual scale or DTI.
Only two fMRI studies are available in subjects with LA [Sun et al., 2011; Tadic et al., 2010]. Tadic et al. [ 2010] performed a fMRI study combined with simultaneous urodynamic monitoring, whereas Sun et al. [ 2011] utilized resting state fMRI to evaluate functional connectivity in two groups of patients with subcortical ischemic vascular disease with or without MCI. In both studies cortical areas of decreased and increased BOLD effects were observed which were variably combined with extension or distribution of LA changes.
Our investigation differs from the two above fMRI studies for four main methodological aspects. First, we fulfilled the fundamental assumption for task‐related fMRI [Johansen‐Berg, 2007; Price et al., 2006]. In fact, by using a dedicated device, we verified that subjects with moderate or severe LA performed the task in the same way as subjects with mild LA did. Moreover, by inserting frequency and force of hand tapping as covariates in the statistical model, we could explore the impact of LA on the brain activation pattern independently from such confounding behavioral variables [Dai et al. 2001; Deiber et al., 1999; Diciotti et al., 2010; Lutz et al., 2005; Schlaug et al., 1996]. Also the effect of age on brain activation was accounted for by inserting it as a covariate in the statistical model. This setting is remarkably different from that in the study of Tadic et al. [ 2010] in which women with LA were recruited on the base of the urinary disturbance that was the subject of the fMRI investigation and no covariates were mentioned in the statistical model.
Second, to avoid interference of brain atrophy on localization of fMRI data we created a study specific custom T1 template for coregistration of fMRI data.
Third, using DTI metrics as MD and FA, we measured the global microstructural damage of the cerebral WM associated with LA, namely the one visually detectable and the one visually undetectable. As compared to visual assessment, the median value of MD or FA is both more sensitive to the disease burden [Della Nave et al., 2007; Maillard et al., 2011; Mascalchi et al., 2002a, b; O'Sullivan et al., 2001, 2004] and intrinsically more suitable for a correlation analysis with the changes of the activation pattern revealed by task fMRI because of its larger dynamic range. As in previous investigations [Della Nave et al., 2007; O'Sullivan et al., 2001, 2004; Otsuka et al., 2012], in our sample of subjects with variable extension of LA areas of WM exhibiting increased MD substantially corresponded to area of decreased FA.
Fourth, we investigated the WM tracts microstructural damage associated with LA using TBSS, which was performed according to the most accurate and computationally intensive procedure currently available (mutual coregistration of all subjects) and followed by nonparametric statistics, which was run using double the amount of permutations (10,000) usually employed in the literature. To the best of our knowledge, so far this type of analysis was performed in subjects with LA in only one recent study [Otsuka et al., 2012]. TBSS revealed that, with increasing extension of LA on visual assessment, a substantially symmetric damage of the long WM tracts in terms of increased MD and decreased FA emerged. It is noteworthy that the distribution of this tract damage matched that of the WM damage reported in pathological cases of extreme LA featuring subcortical arteriosclerotic encephalopathy or Binswanger's disease [Mascalchi et al., 1989] as exemplified in Figure 1. This uncommon condition is in fact characterized by symmetric involvement of the long WM tracts of the cerebral hemispheres and by relative sparing of both the U fibers and of the WM of the brainstem and cerebellum. Intriguingly, because of the type of vascular supply similar to that of the cerebral cortex [Moody et al., 1988], the corpus callosum is typically spared by the T2 signal changes underlying LA [Della Nave et al., 2007; Otsuka et al., 2012], but its bulk is decreased [Moretti et al., 2005; Otsuka et al., 2012] and callosal fibers exhibit decreased FA or increased MD as a result of transcallosal degeneration in patients with severe LA [Della Nave et al., 2007; Otsuka et al., 2012].
The hand tapping task we utilized consists of a flexo‐extension of the last four fingers of the supine right dominant hand (inserted in a cotton glove) against a weak resistance represented by an air filled rubber bulb. The adhesion of the hand to the bulb is guaranteed by a velcro strip and there is no visual control of the task by the subject. For these reasons the task, on the one hand, cannot be assimilated to a grasp or an hand‐grip task and, on the other hand, it presumably explores some somatosensory information related to both the glove and the air filled rubber bulb.
As a matter of fact, fMRI data in healthy subjects examined with this task and this device revealed activation of the left SM1 and adjacent lateral and parieto‐temporal cortex, of the SMA and adjacent cingulum, bilaterally, of the left thalamus and of the cerebellar hemispheres more marked on the right side [Cosottini et al., 2012; Ginestroni et al., 2012; Tessa et al., 2010].
This pattern is substantially in agreement with the general organization of the motor system [Rizzolatti and Luppino, 2001], which was predominantly explored with anatomical investigation and with neurophysiological and fMRI studies of hand grasping in humans and primates [Davare et al., 2011]. This entails subdivision of the cortical motor areas into two main components termed posterior motor areas containing the primary motor cortex and anterior motor areas [Rizzolatti and Luppino, 2001]. The posterior motor areas receive their main cortical input from the parietal lobe (“parieto‐dependent” motor areas). In contrast, the anterior motor areas receive their main cortical connections from the prefrontal cortex (“prefronto‐dependent” motor areas). Moreover, the parieto‐dependent areas are connected with the primary motor area and are linked among them in a precise somatotopic manner, while the prefronto‐dependent areas do not send fiber to the primary motor area, but have diffuse connections with the other motor areas [Rizzolatti and Luppino, 2001]. Finally, the parieto‐dependent motor areas send direct projections to the spinal cord, while the prefronto‐dependent do not.
In consideration of the type of task we utilized outlined above and the results of the present study, particular attention deserves the recent demonstration in humans of short fronto‐parietal U tracts (central sulcus connections) that realize direct connections between postcentral and precentral motor cortex and are predominantly left lateralized. This direct connection between primary sensory and motor cortex is assumed to function as an additional pathway for modulatory somatosensory inputs during execution of movement that is alternative to the indirect main connection to the primary motor cortex via the ventrolateral thalamic nucleus [Catani et al., 2012].
fMRI in our elderly subjects with MCI and mild or moderate‐severe LA showed a brain activation pattern during right hand tapping which was qualitatively similar to the one reported above [Cosottini et al., 2012; Ginestroni et al., 2012; Tessa et al., 2010].
However, brain activation was modulated by the severity of LA as assessed both visually or using DTI metrics taking into account the microstructural damage of the cerebral WM associated with LA.
Three phenomena were observed: (1) local remapping within the SM1 cortex, (2) increased activation in nonprimary ipsilateral sensorimotor areas, and (3) increased activation in the cerebellum.
The posterior shift of the activation in the left SM1 with increasing severity of the microstructural damage associated with LA is in line with similar observations in poststroke patients [Johansen‐Berg, 2007]. Also the hyperactivation of nonprimary ipsilateral sensorimotor areas including SMA and paracentral lobule was reported in post‐stroke patients [Johansen‐Berg, 2007] and in CADASIL [Reddy et al., 2002] and Fabry disease [Gavazzi et al., 2006].
The most remarkable difference between the data of the present study and the fMRI results obtained with hand motor tasks in both patients who had suffered from stroke and patients with CADASIL or Fabry disease is the lack in our series of hyperactivation of motor and somatosensory areas of the contralateral cerebral hemisphere, namely ipsilateral to the moving hand. In our opinion, this might reflect the symmetric distribution of LA and, especially, the involvement of the major commissural structure of the human brain, namely the corpus callosum as revealed by TBSS in our study. Involvement of the corpus callosum was recently emphasized in patients with LA as a major determinant of disability [Della Nave et al., 2007; Otsuka et al., 2012]. Moreover, patients with agenesis of the corpus callosum do not show any overactivations in the hemisphere ipsilateral to a moved hand consistent with the hypothesis that loss of callosal afferents would lead to decreased ipsilateral sensorimotor activation [Reddy et al., 2000]. On the contrary, intriguingly, U fibers such those documented by Catani et al. [ 2012] were shown to be substantially unaffected in our TBSS analysis and are typically spared in pathological cases of severe LA featuring pathological description of subcortical arteriosclerotic encephalopathy [Mascalchi et al., 1989] (Fig. 1). In our opinion, this may account for the ipsilaterality of the functional changes observed in the cortical sensorimotor areas with increasing microstructural damage associated with LA.
Our study revealed regional hyperactivation of the cerebellum with increasing severity of LA as assessed both visually or using DTI. In particular, between group analysis showed hyperactivation of the right cerebellar lobule 5 that has somatosensory and motor function [Stoodley and Schmahmann, 2009], whereas regression analysis indicated hyperactivation of the bilateral cerebellar crus that are involved in executive functions [Stoodley and Schmahmann, 2009]. These functional changes of the cerebellum are in line with absence of WM tract damage in the brainstem or cerebellum as revealed by TBSS.
The local remapping of the motor areas and the areas of increased cortical activation in the ipsilateral cerebral cortex and cerebellum may have an adaptive role and contribute to counterbalance the WM damage in LA by limiting or delaying the clinical deficit [List et al., 2011, in press; Sun et al. 2011]. However, alternatively, as it was hypothesized for poststroke patients [Johansen‐Berg, 2007], they could reflect abnormal attentive or somatosensory control of movement in subjects with moderate or extensive LA. In our opinion, in consideration of these potential confounders in the interpretation of altered patterns of activity, the hypothesis that the functional changes we observed represent adaptive plasticity deserves further investigations. The longitudinal nature of the Tuscany VMCI study could help to establish what type of functional relevance the observed changes have.
We recognize two main limitations of our investigation. We explored functional changes associated with LA using the BOLD effect, which can be affected by the small vessel disease underlying LA [D'Esposito et al., 2003].
The subcortical WM damage is assumed to be responsible of cognitive impairment in subjects with LA through a disconnection mechanism [Lamar et al., 2008; O'Sullivan et al., 2004] particularly involving the transcallosal fibers [Otsuka et al., 2012]. Although the cognitive profile of the subjects recruited in the VMCI study is being intensively investigated, the design of the present fMRI investigation, and in particular, adoption of a simple motor task, hindered evaluation of possible functional correlates of the cognitive impairment in our sample of subjects.
CONCLUSION
Our study indicates that activation of the brain during right hand tapping is modulated by increasing severity of LA in elderly subjects with MCI. Local remapping within the primary motor cortex and increased activity in nonprimary ipsilateral sensorimotor cortex presumably reflect relative sparing of the short intra‐hemispheric WM tracts, whereas lack of controlateral cerebral hemisphere hyperactivation might be because of compromise of the corpus callosum observed with increasing severity of LA.
Supporting information
Supplementary Figure 1 A, B. Sagittal (A) and axial (B) view of the results of voxel‐based analysis of FA maps by using TBSS. Red shows regions where FA decrease correlates significantly with the LA visual score. All results are adjusted for age and gender. Permutation‐based nonparametric inference (10,000 permutations) including full correction for multiple comparison over space was performed using threshold‐free cluster enhancement (TFCE). A decrease in FA in the long cerebral WM tracts and in the transcallosal fibres with relative sparing of the U fibres is observed with increasing LA visual score. The WM tracts in the brainstem and cerebellum are essentially preserved except for a small cluster of decreased FA in the left cerebral peduncle.
Supplementary Figure 2 A, B. Within‐group statistical activation map for (A) mild LA (Z>6, p=0.001 corrected) and (B) moderate‐to‐severe LA (Z>9, p=0.001 corrected) group. For both moderate‐to‐severe and mild LA group, the map shows activation in the left precentral and postcentral gyrus corresponding to the SM1 cortex, bilateral SMA, left thalamus and bilateral cerebellum (lobule 5 and 4) more pronounced on the right.
The Vascular Mild Cognitive Impairment in Tuscany (VMCI‐Tuscany) investigators: University of Florence: (Coordinating Center): Domenico Inzitari (Study coordinator), Rosanna Abbate, Manuela Bandinelli, Maria Boddi, Francesca Cesari, Laura Ciolli, Mirella Coppo, Alessandra Del Bene, Stefano Diciotti, Andrea Ginestroni, Betti Giusti, Anna Maria Gori, Mario Mascalchi, Serena Nannucci, Leonardo Pantoni, Marco Pasi, Francesca Pescini, Anna Poggesi, Giovanni Pracucci, Emilia Salvadori, Raffaella Valenti.
University of Pisa: Ubaldo Bonucelli, Paolo Cecchi, Alberto Chiti, Mirco Cosottini, Giovanni Orlandi, Cristina Pagni, Gabriele Siciliano, Gloria Tognoni.
University of Siena: Antonio Federico, Nicola De Stefano, Maria Teresa Dotti, Patrizia Formichi, Claudia Gambetti, Antonio Giorgio, Francesca Rossi, Laura Stromillo, Enza Zicari.
Tuscany Region: Arezzo (Paolo Zolo, Alessandro Tiezzi); Empoli (Elisabetta Bertini, Stefania Brotini, Leonello Guidi, Maria Lombardi, Stefania Mugnai, Antonella Notarelli); Florence (Laura Bracco, Massimo Cadelo, Renzo Cisbani, Luciano Gabbani, Guido Gori, Lorella Lambertucci, Luca Massacesi, Enrico Mossello, Marco Paganini, Maristella Piccininni, Francesco Pinto, Claudia Pozzi, Sandro Sorbi, Gaetano Zaccara); Grosseto (Tiziano Borgogni, Mario Mancuso, Roberto Marconi); Lucca (Monica Mazzoni, Marco Vista); Livorno (Giuseppe Meucci, Giovanna Bellini); Massa Carrara (Luciano Gabrielli); Pisa (Cristina Frittelli, Renato Galli, Gianna Gambaccini); Pistoia (Stefano Bartolini, Carlo Biagini, Veronica Caleri, Paola Vanni); Prato (Donatella Calvani, Carla Giorgi, Stefano Magnolfi, Pasquale Palumbo, Carlo Valente); Siena (Alessandro Rossi, Rossana Tassi, Stefania Boschi); Viareggio (Filippo Baldacci).
REFERENCES
- Arsigny V, Fillard P, Pennec X, Ayache N (2006): Log‐euclidean metrics for fast and simple calculus on diffusion tensors. Magn Reson Med 56:411–421. [DOI] [PubMed] [Google Scholar]
- Avants BB, Yushkevich P, Pluta J, Minkoff D, Korczykowski M, Detre J, Gee JC (2010): The optimal template effect in hippocampus studies of diseased populations. NeuroImage 49:2457–2466. [DOI] [PMC free article] [PubMed] [Google Scholar]
- Avants BB, Tustison NJ, Song G, Cook PA, Klein A, Gee JC (2011): A reproducible evaluation of ANTs similarity metric performance in brain image registration. NeuroImage 54:2033–2044. [DOI] [PMC free article] [PubMed] [Google Scholar]
- Beckmann C, Jenkinson M, Smith SM (2003): General multi‐level linear modelling for group analysis in FMRI. NeuroImage 20:1052–1063. [DOI] [PubMed] [Google Scholar]
- Brickman AM, Siedlecki KL, Muraskin J, Manly JJ, Luchsinger JA, Yeung LK, Brown TR, De Carli C, Stern Y (2011): White matter hyperintensities and cognition: Testing the reserve hypothesis. Neurobiol Aging 32:1588–1598. [DOI] [PMC free article] [PubMed] [Google Scholar]
- Catani M, Dell'Acqua F, Vergani F, Malik F, Hodge H, Roy P, Valabregue R, de Schotten TM, (2012): Short frontal lobe connections of the human brain. Cortex 48:273–291. [DOI] [PubMed] [Google Scholar]
- Cook PA, Bai Y, Nedjati‐Gilani S, Seunarine KK, Hall MG, Parker GJ, DC Alexander. (2006): Camino: Open‐Source Diffusion‐MRI Reconstruction and Processing. 14th Scientific Meeting of the International Society for Magnetic Resonance in Medicine. Seattle, WA, USA.
- Cosottini M, Pesaresi I, Piazza S, Diciotti S, Cecchi P, Fabbri S, Carlesi C, Mascalchi M, Siciliano G (2012): Structural and functional evaluation of cortical motor areas in amyotrophic lateral sclerosis. Exp Neurol 234:169–180. [DOI] [PubMed] [Google Scholar]
- Dai TH, Liu JZ, Sahgal V, Brown RW, Yue GH (2001): Relationship between muscle output and functional MRI‐measured brain activation. Exp Brain Res 140:290–300. [DOI] [PubMed] [Google Scholar]
- Davare M, Kraskov A, Rothwell JC, Lemon RN (2011): Interactions between areas of the cortical grasping network. Curr Opin Neurobiol 21:565–570. [DOI] [PMC free article] [PubMed] [Google Scholar]
- De Carli C, Fletcher E, Ramey V, Harvey D, Jagust WJ (2005): Anatomical mapping of white matter hyperintensities (WMH): exploring the relationships between periventricular WMH, deep WMH, and total WMH burden. Stroke 36:50–55. [DOI] [PMC free article] [PubMed] [Google Scholar]
- Deiber MP, Honda M, Ibanez V, Sadato N, Hallet M (1999): Mesial motor areas in self‐initiated versus externally triggered movements examined with fMRI: Effect of movement type and rate. J Neurophysiol 81:3065–3077. [DOI] [PubMed] [Google Scholar]
- Della Nave R, Foresti S, Pratesi A, Ginestroni A, Inzitari M, Salvadori E, Giannelli M, Diciotti S, Inzitari D, Mascalchi M (2007): Whole‐brain histogram and voxel‐based analyses of diffusion tensor imaging in patients with leukoaraiosis. Correlation with motor and cognitive impairment. AJNR Am J Neuroradiol 28:1313–1319. [DOI] [PMC free article] [PubMed] [Google Scholar]
- D'Esposito M, Deouell LY, Gazzaley A (2003): Alterations in the BOLD fMRI signal with ageing and disease: a challenge for neuroimaging. Nat Rev Neurosci 4:863–872. [DOI] [PubMed] [Google Scholar]
- DeStefano N, Battaglini M, Stromillo ML, Zipoli V, Bartolozzi ML, Guidi L, Siracusa G, Portaccio E, Giorgio A, Sorbi S, Federico A, Amato MP (2006): Brain damage as detected by magnetization transfer imaging is less pronounced in benign than in early relapsing multiple sclerosis. Brain 129:2008–2016. [DOI] [PubMed] [Google Scholar]
- Diciotti S, Gavazzi C, Della Nave R, Boni E, Ginestroni A, Paoli L, Cecchi P, De Stefano N, Mascalchi M (2007): Self‐paced frequency of a simple motor task and brain activation. A fMRI study at 1.5T in healthy subjects using an on‐line monitor device. NeuroImage 38:402–412. [DOI] [PubMed] [Google Scholar]
- Diciotti S, Cecchi P, Ginestroni A, Mazzoni LN, Pesaresi I, Lombardo S, Boni E, Cosottini M, Soricelli A, De Stefano N, Mascalchi M (2010): MR‐compatible device for monitoring hand tracing and writing tasks in fMRI with an application to healthy subjects. Conc Magn Reson A 36A:139–152. [Google Scholar]
- Fazekas F, Chawluk JB, Alavi A, Hurtig HI, Zimmerman RA (1987): MR signal abnormalities at 1.5T in Alzheimer's dementia and normal aging. AJNR Am J Neuroradiol 8:421–426. [DOI] [PubMed] [Google Scholar]
- Gavazzi C, Borsini W, Guerrini L, Della Nave R, Rocca M, Tessa C, Buchner S, Belli G, Filippi M, Villari N, Mascalchi M (2006): Subcortical damage and cortical functional changes in males and females with Fabry disease. A multi‐faceted MR study. Radiology 241:492–500. [DOI] [PubMed] [Google Scholar]
- Ginestroni A, Diciotti S, Cecchi P, Pesaresi I, Tessa C, Giannelli M, Della Nave R, Salvatore E, Salvi F, Dotti MT, Piacentini S, Soricelli A, Cosottini M, De Stefano N, Mascalchi M (2012): Neurodegeneration in Friedreich's ataxia is associated with a mixed activation pattern of the brain. A fMRI study. Hum Brain Mapp 33:1780–1791. [DOI] [PMC free article] [PubMed] [Google Scholar]
- Gountouna VE, Job DE, McIntosh AM, Moorhead TW, Lymer GK, Whalley HC, Hall J, Waiter GD, Brennan D, McGonigle DJ, Ahearn TS, Cavanagh J, Condon B, Hadley DM, Marshall I, Murray AD, Steele JD, Wardlaw JM, Lawrie SM. (2010): Functional magnetic resonance imaging (fMRI) reproducibility and variance components across visits and scanning sites with a finger tapping task. NeuroImage 49:552–560. [DOI] [PubMed] [Google Scholar]
- Inzitari D, Pracucci G, Poggesi A, Carlucci G, Barkhof F, Chabriat H, Erkinjutti T, Fazekas F, Ferro JM, Hennerici M, Langhorne P, O'Brien J, Scheltens P, Visser MC, Wahlund WO, Waldemar G, Wallin A, Pantoni L; LADIS Study Group (2009): Changes in white matter as determinant of global functional decline in older independent outpatients: three year follow up of LADIS (leukoaraiosis and disability) study cohort. BMJ 339:b2477. [DOI] [PMC free article] [PubMed] [Google Scholar]
- Jenkinson M, Smith S (2001): A global optimisation method for robust affine registration of brain images. Med Image Anal 5:143–156. [DOI] [PubMed] [Google Scholar]
- Jenkinson M, Bannister P, Brady M, Smith S (2002): Improved optimisation for the robust and accurate linear registration and motion correction of brain images. NeuroImage 17:825–841. [DOI] [PubMed] [Google Scholar]
- Johansen‐Berg H (2007): Functional imaging of stroke recovery: What have we learnt and where do we go from here?Intern J Stroke 2:7–16. [DOI] [PubMed] [Google Scholar]
- Johansen‐Berg H, Dawes H, Guy C, Smith SM, Wade DT, Matthews PM (2002): Correlation between motor improvements and altered fMRI activity after rehabilitative therapy. Brain 125:2731–2742. [DOI] [PubMed] [Google Scholar]
- LADIS study group (2011): 2001–2011: A decade of the LADIS (Leukoaraiosis And DISability) study: What have we learned about white matter changes and small‐vessel disease?Cerebrov Dis 32:577–588. [DOI] [PubMed] [Google Scholar]
- Lamar M, Catani M, Price CC, Heilman KM, Libon DJ (2008): The impact of region‐specific leukoaraiosis on working memory deficits in dementia. Neuropsychologia 46:2597–2601. [DOI] [PubMed] [Google Scholar]
- Leemans A, Jones DK (2009): The B‐matrix must be rotated when correcting for subject motion in DTI data. Magn Reson Med 61:1336–1349. [DOI] [PubMed] [Google Scholar]
- List J, Duning T, Meinzer M, Kurten J, Schirmacher A, Deppe M, Evers S, Young P, Floel A (2011): Enhanced rapid‐onset cortical plasticity in CADASIL as a possible mechanism of preserved cognition. Cerebral Cortex 21:2774–2787. [DOI] [PubMed] [Google Scholar]
- List J, Duning T, Meinzer M, Kurten J, Deppe M, Wilbers E,0000. Floel A: Cortical plasticity is preserved in nondemented older individuals with severe ischemic small vessel disease (in press). Doi: 10.1002/hbm.22003. [DOI] [PMC free article] [PubMed]
- Liu JZ, Zhang L, Yao B, Sahgal V, Yue GH (2005): Fatigue induced by intermittent maximal voluntary contractions is associated with significant losses in muscle output but limited reductions in functional MRI‐measured brain activation level. Brain Res 1050:44–54. [DOI] [PubMed] [Google Scholar]
- Lutz K, Koeneke S, Wustenberg T, Jancke L (2005): Asymmetry of cortical activation during maximum and convenient tapping speed. Neurosci Lett 373:61–66. [DOI] [PubMed] [Google Scholar]
- Maillard P, Fletcher E, Harvey D, Carmichael O, Reed B, Mungas D, DeCarli C (2011): White matter hyperintensity penumbra. Stroke 42:1917–1922. [DOI] [PMC free article] [PubMed] [Google Scholar]
- Mascalchi M, Inzitari D, Dal Pozzo G, Taverni N, Abbamondi AL (1989): Computed tomography, magnetic resonance imaging and pathological correlations in a case of Binswanger's disease. Can J Neurol Sci 16:214–218. [DOI] [PubMed] [Google Scholar]
- Mascalchi M, Tessa C, Moretti M, Della Nave R, Boddi V, Martini S, Inzitari D, Villari N (2002a): Whole brain apparent diffusion coefficient histrogram. A new tool for evaluation of leukoaraiosis. J Magn Reson Imaging 15:144–148. [DOI] [PubMed] [Google Scholar]
- Mascalchi M, Moretti M, Della Nave R, Lolli F, Tessa C, Carlucci G, Bartolini L, Pracucci G, Pantoni L, Filippi M, Inzitari D (2002b): Longitudinal evaluation of leuko‐araiosis with whole brain ADC histograms. Neurology 59:938–940. [DOI] [PubMed] [Google Scholar]
- Moody MD, Bell MA, Challa VR (1988): The corpus callosum, a unique white matter tract: anatomic features that may explain sparing in Binswanger disease and resistance to flow of fluid masses. AJNR Am J Neuroradiol 9:1051–1059. [PMC free article] [PubMed] [Google Scholar]
- Moretti M, Carlucci G, Di Carlo A, Fonda C, Prieto M, Mugnai S, Bracco L, Piccini C, Pracucci G, Inzitari D (2005): Corpus callosum atrophy is associated with gait disorders in patients with leukoaraiois. Neurol Sci 26:61–66. [DOI] [PubMed] [Google Scholar]
- Oldfield RC (1991): The assessment and analysis of handedness: The Edinburgh inventory. Neuropsychologia 9:97–113. [DOI] [PubMed] [Google Scholar]
- O'Sullivan M, Summers PE, Jones DK, Jarosz JM, Williams SCR, Markus HS (2001): Normal‐appearing white matter in ischemic leukoaraiosis: A diffusion tensor MRI study. Neurology 57:2307–2310. [DOI] [PubMed] [Google Scholar]
- O'Sullivan M, Morris RG, Huckstep B, Jones DK, Williams SCR, Markus HS (2004): Diffusion tensor MRI correlates with executive dysfunction in patients with ischaemic leukoaraiosis. J Neurol Neurosurg Psychiatry 75:441–447. [DOI] [PMC free article] [PubMed] [Google Scholar]
- O'Sullivan M, Jouvent E, Saemann PG, Mangin JF, Viswanathan A, Gschwendtner A, Bracoud L, Pachai C, Chabriat H, Dichgans M (2008): Measurement of brain atrophy in subcortical vascular disease: A comparison of different approaches and the impact of ischaemic lesions. NeuroImage 43:312–320. [DOI] [PubMed] [Google Scholar]
- Otsuka Y, Yamauchi H, Sawamoto N, Iseki K, Tomimoto H, Fukuyama H (2012): Diffuse tract damage in the hemispheric deep white matter may correlate with global cognitive impairment and callosal atrophy in patients with extensive leukoaraiosis. AJNR Am J Neuroradiol 33:726–732. [DOI] [PMC free article] [PubMed] [Google Scholar]
- Pantoni L (2010): Cerebral small vessel disease: From pathogenesis and clinical characteristics to therapeutic challenges. Lancet Neurol 9:689–701. [DOI] [PubMed] [Google Scholar]
- Pantoni L, Basile AM, Pracucci G, Asplund K, Bogousslavsky J, Chabriat H, Erkinjuntti T, Fazekas F, Ferro JM, Hennerici M, O'brien J, Scheltens P, Visser MC, Wahlund LO, Waldemar G, Wallin A, Inzitari D (2005): Impact of age‐related cerebral white matter changes on the transition to disability—The LADIS study: Rationale, design and methodology. Neuroepidemiology 24:51–62. [DOI] [PubMed] [Google Scholar]
- Pineiro R, Pendlebury S, Johansen‐Berg H, Matthews PM (2001): Functional MRI detects posterior shifts in primary sensorimotor cortex activation after stroke evidence of local adaptive reorganization? Stroke 32:1134–1139. [DOI] [PubMed] [Google Scholar]
- Poggesi A, Salvadori E, Pantoni L, Pracucci G, Chiti A, Ciolli L, Del Bene A, De Stefano N, Diciotti S, Dotti MT, Ginestroni A, Giusti B, Gori AM, Nannucci S, Orlandi G, Pescini F, Valenti R, Abbate R, Mascalchi M, Murri L, Federico A, Inzitari D; on behalf of the VMCI‐Tuscany Study Group (2012): Risk and determinants of dementia in patients with mild cognitive impairment and brain subcortical vascular changes: a study of clinical, neuro‐imaging and biological markers. The VMCI‐Tuscany Study: Rationale, design and methodology. Int Alzheimer's Dis 2012: 608013. [DOI] [PMC free article] [PubMed] [Google Scholar]
- Price CJ, Crinion J, Friston KJ (2006): Design and analysis of fMRI studies with neurologically impaired patients. J Magn Reson Imaging 23:816–826. [DOI] [PubMed] [Google Scholar]
- Reddy H, Lassonde M, Bemasconi N, Bemasconi A, Matthews PM, Andermann F, Amold DL (2000): An fMRI study of the lateralization of motor cortex activation in acallosal patients. Neuroreport 11:2409–2413. [DOI] [PubMed] [Google Scholar]
- Reddy H, De Stefano N, Mortilla M, Federico A, Matthews PM (2002): Functional reorganization of motor cortex increases with greater axonal injury from CADASIL. Stroke 33:502–508. [DOI] [PubMed] [Google Scholar]
- Rizzolatti G, Luppino G (2001): The cortical motor system. Neuron 31:889–901. [DOI] [PubMed] [Google Scholar]
- Rovaris M, Iannucci G, Cercignani M, Sormani MP, De Stefano N, Gerevini S, Comi G, Filippi M (2003): Age‐related changes in conventional, magnetization transfer, and diffusion‐tensor MR imaging findings: Study with whole‐brain tissue histogram analysis. Radiology 227:731–738. [DOI] [PubMed] [Google Scholar]
- Schlaug G, Sanes JN, Thangaraj V, Darby DG, Jäncke L, Edelman RR, Warach S (1996): Cerebral activation covaries with movement rate. NeuroReport 7:879–883. [DOI] [PubMed] [Google Scholar]
- Smith S (2002): Fast robust automated brain extraction. Hum Brain Mapp 17:143–155. [DOI] [PMC free article] [PubMed] [Google Scholar]
- Smith SM, Nichols TE (2009): Threshold‐free cluster enhancement: Addressing problems of smoothing, threshold dependence and localisation in cluster inference. NeuroImage 44:83–98. [DOI] [PubMed] [Google Scholar]
- Smith S, Jenkinson M, Woolrich MW, Beckmann CF, Behrens TE, Johansen‐Berg H, Bannister PR, De Luca M, Drobnjak I, Flitnet DE, Niazy RK, Saunders J, Vickers J, Zhang Y, De Stefano N, Brady JM, Matthews PM (2004): Advances in functional and structural MR image analysis and implementation as FSL. NeuroImage 23 ( Suppl 1):S208–S219. [DOI] [PubMed] [Google Scholar]
- Smith SM, Jenkinson M, Johansen‐Berg H, Rueckert D, Nichols TE, Mackay CE, Watkins KE, Ciccarelli O, Cader MZ, Matthews PM, Behrens TE (2006): Tract‐based spatial statistics: voxelwise analysis of multi‐subject diffusion data. NeuroImage 31:1487–1505. [DOI] [PubMed] [Google Scholar]
- Smith SM, Johansen‐Berg H, Jenkinson M, Rueckert D, Nichols TE, Miller KL, Robson MD, Jones DK, Klein JC, Bartsch AJ, Behrens TE (2007): Acquisition and voxelwise analysis of multi‐subject diffusion data with tract‐based spatial statistics. Nat Protoc 3:499–503. [DOI] [PubMed] [Google Scholar]
- Stoodley CJ, Schmahmann JD (2009): Functional topography in the human cerebellum: A meta‐analysis of neuroimaging studies. NeuroImage 44:489–501. [DOI] [PubMed] [Google Scholar]
- Sun YW, Qin LD, Zhou Y, Xu Q, Qian LJ, Tao J, Xu JR (2011): Abnormal functional connectivity in patients with vascular cognitive impairment, no dementia: A resting‐state functional magnetic resonance imaging study. Behav Brain Res 223:388–394. [DOI] [PubMed] [Google Scholar]
- Tadic SD, Griffiths D, Murrin A, Schaefer W, Aizenstein HJ, Resnick NM (2010): Brain activity during bladder filling is related to white matter structural changes in older women with urinary incontinence. NeuroImage 51:1294–1302. [DOI] [PMC free article] [PubMed] [Google Scholar]
- Tessa C, Lucetti C, Diciotti S, Baldacci F, Paoli L, Cecchi P, Giannelli M, Ginestroni A, Del Dotto P, Ceravolo R, Vignali C, Bonuccelli U, Mascalchi M (2010): Decreased and increased cortical activation coexist in de novo Parkinson's disease. Exp Neurol 224:299–306. [DOI] [PubMed] [Google Scholar]
- Tzourio‐Mazoyer N, Landeau B, Papathanassiou D, Crivello F, Etard O, Delcroix N, Mazoyer B, Joliot M (2002): Automated anatomical labeling of activations in SPM using a macroscopic anatomical parcellation of the MNI MRI single‐subject brain. NeuroImage 15:273–289. [DOI] [PubMed] [Google Scholar]
- Winblad B, Palmer K, Kivipelto M, Jelic V, Fratiglioni L, Wahlund LO, Nordberg A, Bäckman L, Albert M, Almkvist O, Arai H, Basun H, Blennow K, de Leon M, DeCarli C, Erkinjuntti T, Giacobini E, Graff C, Hardy J, Jack C, Jorm A, Ritchie K, van Duijn C, Visser P, Petersen RC (2004): Mild cognitive impairment—Beyond controversies, towards a consensus: Report of the International Working Group on mild cognitive impairment. J Intern Med 256:240–246. [DOI] [PubMed] [Google Scholar]
- Woolrich MW (2008): Robust group analysis using outlier inference. NeuroImage 41:286–301. [DOI] [PubMed] [Google Scholar]
- Woolrich W, Ripley BD, Brady JM, Smith SM (2001): Temporal autocorrelation in univariate linear modelling of fMRI data. NeuroImage 14:1370–1386. [DOI] [PubMed] [Google Scholar]
- Woolrich MW, Behrens TEJ, Beckmann CF, Jenkinson M, Smith SM (2004): Multilevel linear modelling for fMRI group analysis using Bayesian inference. NeuroImage 21:1732–1747. [DOI] [PubMed] [Google Scholar]
- Worsley KJ (2001). Statistical analysis of activation images In: Jezzard P, Matthews PM, Smith SM, editors.Functional MRI: An Introduction to Methods. Oxford:Oxford University Press. [Google Scholar]
- Zhang Y, Brady M, Smith S (2001): Segmentation of brain MR images through a hidden Markov random field model and the expectation maximization algorithm. IEEE Trans Med Imaging 20:45–57. [DOI] [PubMed] [Google Scholar]
- Zheng JJ, Delbaere K, Close JC, Sachdev PS, Lord SR (2011): Impact of white matter lesions on physical functioning and fall risk in older people: A systematic review. Stroke 42:2086–2090. [DOI] [PubMed] [Google Scholar]
Associated Data
This section collects any data citations, data availability statements, or supplementary materials included in this article.
Supplementary Materials
Supplementary Figure 1 A, B. Sagittal (A) and axial (B) view of the results of voxel‐based analysis of FA maps by using TBSS. Red shows regions where FA decrease correlates significantly with the LA visual score. All results are adjusted for age and gender. Permutation‐based nonparametric inference (10,000 permutations) including full correction for multiple comparison over space was performed using threshold‐free cluster enhancement (TFCE). A decrease in FA in the long cerebral WM tracts and in the transcallosal fibres with relative sparing of the U fibres is observed with increasing LA visual score. The WM tracts in the brainstem and cerebellum are essentially preserved except for a small cluster of decreased FA in the left cerebral peduncle.
Supplementary Figure 2 A, B. Within‐group statistical activation map for (A) mild LA (Z>6, p=0.001 corrected) and (B) moderate‐to‐severe LA (Z>9, p=0.001 corrected) group. For both moderate‐to‐severe and mild LA group, the map shows activation in the left precentral and postcentral gyrus corresponding to the SM1 cortex, bilateral SMA, left thalamus and bilateral cerebellum (lobule 5 and 4) more pronounced on the right.