

Abstract
Theory and experimental evidence suggest that complex living systems function close to the boundary of chaos, with erroneous organization to an improper dynamical range (too stiff or chaotic) underlying system‐wide dysregulation and disease. We hypothesized that erroneous organization might therefore also characterize paranoid schizophrenia, via optimization abnormalities in the prefrontal‐limbic circuit regulating emotion. To test this, we acquired fMRI scans from 35 subjects (N = 9 patients with paranoid schizophrenia and N = 26 healthy controls), while they viewed affect‐valent stimuli. To quantify dynamic regulation, we analyzed the power spectrum scale invariance (PSSI) of fMRI time‐courses and computed the geometry of time‐delay (Poincaré) maps, a measure of variability. Patients and controls showed distinct PSSI in two clusters (k 1: Z = 4.3215, P = 0.00002 and k 2: Z = 3.9441, P = 0.00008), localized to the orbitofrontal/medial prefrontal cortex (Brodmann Area 10), represented by β close to white noise in patients (β ≈ 0) and in the pink noise range in controls (β ≈ −1). Interpreting the meaning of PSSI differences, the Poincaré maps indicated less variability in patients than controls (Z = −1.9437, P = 0.05 for k 1; Z = −2.5099, P = 0.01 for k 2). That the dynamics identified Brodmann Area 10 is consistent with previous schizophrenia research, which implicates this area in deficits of working memory, executive functioning, emotional regulation and underlying biological abnormalities in synaptic (glutamatergic) transmission. Our results additionally cohere with a large body of work finding pink noise to be the normal range of central function at the synaptic, cellular, and small network levels, and suggest that patients show less supple responsivity of this region. Hum Brain Mapp, 2011. © 2011 Wiley‐Liss, Inc.
Keywords: schizophrenia, fMRI, limbic, Brodmann Area 10, prefrontal cortex, orbitofrontal cortex, medial prefrontal cortex
INTRODUCTION
Optimization is a common problem faced by complex living systems, over the full course of their development and at all spatial and temporal levels. Biological systems are required to maintain a dynamic range of functioning that provides sensitivity to a variety of different inputs—and will thus tend to organize at the critical point where dynamics are supple enough to respond to the external environment, yet stable enough to maintain homeostasis [Buzsáki, 2006; Kauffman, 1993]. It has been hypothesized in this light that improper optimization could lead to an overall dysregulated system, performing in a too stiff or too chaotic behavior range [Glass, 2001]. Over the past few decades, the preference for this critical balance between chaos and order has been witnessed—derived by theory and confirmed by experiments—in various networks, such as the cardiac [Kresh and Izrailtyan, 1998], endocrine [Prank et al., 1996], and central nervous [Kitzbichler et al., 2009; Worrell et al., 2002] systems, as well as at microscopic levels in mitochondria [Aon et al., 2004] and in synaptic dynamics [Levina et al., 2007].
Since nonlinear methods have proved to be so successful diagnostically for both cardiac [Guzzetti et al., 2005; Laitio et al., 2004; Peng et al., 1993; Tulppo et al., 2005] and other [Kernohan et al., 2003; Reimondo et al., 2003] physiological contexts, it seems likely that dynamic network methods may also be suited towards addressing the complex neural system‐wide processing. Technical progress of both neuroimaging and mathematical methods over the past two decades has made it increasingly possible to approach the dynamic architecture of the brain as an evolving nonlinear system [Gottschalk et al., 1995; Paulus et al., 1996]. Yet, despite the widespread use of heart rate variability analyses to measure autonomic dysregulation in psychiatric disorders [Cohen et al., 1998, 1999; Servant et al., 2009], applications of these computational techniques have not yet been directed, at least to our knowledge, towards understanding the network‐wide neural disregulations allegedly present in such conditions.
The irregularity, or “deterministic noise” of various network oscillations can be captured by Fourier analysis, using the power spectral density of the signal. Power spectrum scale invariance (PSSI) is a classical measure used to express the mean square fluctuations at any particular frequency, and how they vary with frequency; ignoring the temporal variation of the signal, it provides a quantitative assessment of the power relationship between its frequencies. Scale‐invariance means that there is no preferred temporal scale, and that the power spectrum density of the signal follows the power law:
where β is the scaling exponent. Estimating the β value for a time series provides a measure of whether the data are purely random or have underlying trends. A number of studies have already analyzed neural activation in the frequency domain and investigated correlations of different frequency bands across the brain [Cordes et al., 2001; Duff et al., 2008; Mitra and Pesaran, 1999; Mitra et al., 1997]. Frequency analyses have successfully identified synchronization patterns in the brain [Kopell et al., 2000], as well as diurnal rhythms [Achermann and Kunz, 1999], and have found, using MEG, rhythm preferences in schizophrenia [Vierling‐Claassen et al., 2008].
In this study, we investigated here whether schizophrenia patients and controls showed distinct patterns of neural regulation, measured with PSSI, in response to an emotional task known to elicit a limbic response. We chose emotional stimuli because a convergence of data, both neurobiological and behavioral, supports the idea that dysregulation of emotional arousal constitutes a common element within the heterogeneity of signs and symptoms present in schizophrenia (for example: hyper‐arousal associated with paranoid symptoms [Williams et al., 2004], hypo‐arousal associated with negative symptoms [Merrin and Floyd, 1996], and cognitive deficits secondary to both hyper and hypo‐arousal [Mujica‐Parodi et al., 2002]). From a control systems perspective, this suggests an imbalance, or dysregulation, between the two primary components of a prefrontal‐limbic negative feed‐back loop: the excitatory component, which includes the amygdala [Floresco and Tse, 2007; LeDoux, 2003], and the inhibitory component provided primarily by prefrontal regions [Phelps et al., 2004; Rosenkranz et al., 2003]. Although a large pre‐existing literature suggests prefrontal deficits in schizophrenia [Ragland et al., 2009; Yoon et al., 2008], we chose not to make a priori assumptions with respect to structural localization to avoid biasing the analysis. Instead, we performed an exploratory voxel‐wise analysis over the entire brain, using the PSSI method to quantify control system regulation, to determine whether dynamic features of the time‐courses would independently lead to prefrontal localization.
We have previously shown that schizophrenia patients show reduced heart rate variability [Mujica‐Parodi et al., 2005], and that autonomic dysregulation is coupled with prefrontal‐limbic dysregulation [Tolkunov et al., 2010]. Thus, we hypothesize here that patients diagnosed with DSM‐IV paranoid schizophrenia would show diminished neural responsivity, characterized by significant changes in the power scale invariant behavior of node(s) specific to the prefrontal‐limbic circuit.
MATERIALS AND METHODS
Subjects
For this study, we tested N = 37 adult human subjects. Of these, N = 11 were patients diagnosed with DSM‐IV paranoid schizophrenia recruited from the Stony Brook University Hospital's Psychiatric Adult Inpatient, Outpatient, and Day Units. Two patients' data were excluded due to motion greater than 3 mm, resulting in a patient N = 9 (six men, three women; age: μ = 36.1 yrs; σ = 10.1 yrs.; min/max = 21–51 yrs). As controls, we tested N = 26 healthy adult subjects (15 men, 11 women; age: μ = 25.1 yrs; σ = 7.68 yrs.; min/max = 19–49 yrs) recruited from the general community. For this study, we did not match patients and controls for mean age and gender, since our larger sample of 65 controls [Tolkunov et al., 2010] failed to provide evidence for any relationship between the variables of interest and age. Subjects were excluded if they had a history of neurological or cardiac illness, substance abuse (screened using the Structured Clinical Interview for DSM‐IV: SCID‐IV [First et al., 2002; Lobbestael et al., 2010; Ventura et al., 1998]), presence of metal in the body, were pregnant, or taking medication with known affects on arousal (e.g., benzodiazepines). Subjects' screening before participation included a medical history and physical exam. Diagnoses for patients and screening for healthy subjects were assessed using the SCID‐IV. Symptom severity for patients was assessed using the Positive and Negative Syndrome Scale [Kay et al., 1988]: positive symptoms μ = 21.7 (out of 49), σ = 6.9; negative symptoms μ = 25.1 (out of 49), σ = 6.3; general symptoms μ = 44.7, σ = 15.6; total scores (out of 210) μ = 91.5, σ = 26.7). Because our patients were acutely symptomatic, we were unable for ethical reasons to withold medication; however, to mitigate medication‐ confounds we avoided recruiting patients using medications known to affect heart rate variability [Mujica‐Parodi et al., 2005] as well as group‐wide homogenous treatment strategies. Specific medications for all patients in this sample are previously reported [Radulescu and Mujica‐Parodi, 2008]. This study was approved by the Stony Brook University Institutional Review Board. All subjects provided informed consent; patients had an additional capacity evaluation signed by their treating psychiatrists.
Study Design
To study the dynamics of the prefrontal‐limbic network, we performed fMRI imaging of patients and controls on a task (passive viewing of affect‐valent faces) known to reliably activate this system [Mujica‐Parodi et al., 2009]. All subjects were hospitalized for at least 48 hours at the Stony Brook University Hospital's General Clinical Research Center, to provide maximum control over the testing environment. Comparison subjects and outpatients were admitted to the hospital at 8 p.m., provided informed consent, and received a physician‐administered history and physical to ensure eligibility in the study. Inpatients were evaluated in their own units.
fMRI Task and Stimuli
While in the MRI scanner, subjects underwent two runs of a blocked design fMRI task. The stimuli used for this task consisted of grey‐scale photos of male and female faces depicting angry, fearful, happy, and neutral emotions [Ekman and Friesen, 1976]. During scanning, subjects passively viewed the stimuli using an angled mirror mounted on the head coil and a screen placed directly outside the magnet bore. Stimuli were presented using a computer running E‐prime software (version 1.0; Psychology Software Tools, Inc.; Pittsburgh, PA) and were projected onto the screen using a projector placed outside the scanner room. The fMRI task consisted of blocked presentations of faces alternating with a 20 s fixation cross, during which a white cross was presented on a black background (REST condition). Each fMRI run lasted for 5 min and 40 s and included two blocks each of angry, neutral, happy, and fearful faces. Each face block consisted of nine different faces of the same emotion type, displayed for 2.2 s each for total block duration of 20 s.
Image Acquisition
Subjects were scanned on a 1.5T Philips Intera MRI scanner at the Stony Brook Hospital using a eight‐channel SENSE head coil. These were acquired using two groups (one for each fMRI run) of 136 T2*‐weighted echoplanar single‐shot images covering the frontal and limbic areas of the brain, with TR = 2,500 ms, SENSE factor = 2, TE = 45ms, flip angle = 90°, matrix = 64 × 64 × 64, 3.9 × 3.9 × 4 mm3 voxels, and 30 contiguous oblique coronal slices. In addition to the functional scan, an anatomical scan to match the slice orientation of the functional scan was obtained. The acquisition parameters for this sequence were: TR = 15 ms, TE = 450 ms, matrix = 256 × 256, FOV = 250 and 30 contiguous oblique coronal slices with 4 mm slice thickness and no gap between the slices. Anatomical data were used to generate a customized EPI template to normalize our EPI scans to the standard frame of reference. The subject's head was secured with tape to minimize head movements during the scans.
Image Analysis
We performed fMRI data pre‐processing using Statistical Parametric Mapping software (SPM99; available at: http://www.fil.ion.ucl.ac.uk/spm), running under Matlab 6.5 (Mathworks, Natick, MA). The raw functional BOLD images were first realigned to the first volume to remove movement‐related artifacts, which were fully corrected using SPM99's algorithm (sinc interpolation). Realigned images were then spatially normalized into 3 × 3 × 3 mm3 using an affine transformation with a set of 7 × 8 × 7. Basis functions and a customized template that was created using the data for the first 12 subjects; the incomplete brain coverage and oblique nature of our slices required us to use a custom template for normalization. For each subject, the scalp was removed from a low‐resolution EPI image, using the Brain Extraction Tool (BET) [Smith, 2002] available in MRIcro software, at a fractional intensity threshold of 0.5. These skull stripped images were then registered and normalized to each other and the average image was smoothed with a Gaussian kernel of 8 mm full‐width half maximum and registered to the EPI template provided by SPM99 to generate the final template. The realigned and normalized EPI images were then smoothed with a Gaussian kernel of 8 mm full‐width half maximum.
Frequency Domain Analysis
For each subject we used the full 136 data‐point raw time series1, which included all conditions. We calculated the power spectral density as the squares of the Fourier transformation amplitudes of the linearly detrended time series. From the power spectral density we computed the scaling parameter β, by plotting the power spectrum on a log‐log scale and estimating the slope by applying a linear fit to the data in the 0.06 to 0.2Hz range (Fig. 1). The upper limit on the frequency range was constrained by the sampling rate, while the lower limit was chosen to avoid confounds due to either task design or physiological variables such as heart rate or respiration [Bar et al., 2007].
Figure 1.
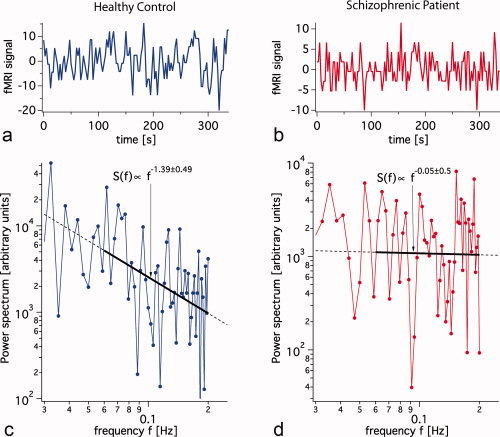
Voxel‐wise scale invariance of the power spectral density (PSSI). We provide here a representative time series (a) for a healthy control and (b) for a schizophrenia patient. The log‐log plots of the power spectra were fit by a straight line over the frequency range of (0.06–0.2 Hz) resulting in scaling exponents of (c) β = −1.39 (S.D. = 0.49) for the healthy control and (d) β = −0.05 (S.D. = 0.50) for the schizophrenic subject. Both examples are consistent with the average standard deviation of individual fit for β (average S.D. = 0.53) found over all voxels and subjects, and thus may be considered a good illustration of the linear fitting as a whole. [Color figure can be viewed in the online issue, which is available at wileyonlinelibrary.com.]
We then statistically compared the β‐values between the patient and control groups, using the non‐parametric Wilcoxon Rank‐Sum test, which compensated for the difference in sample sizes and which made no assumption of normally distributed values. Thresholds were set at P < 0.005 with V min = 3 × 3 × 3 = 27 contiguous voxels, the latter of which exceeded the smoothing kernel; we additionally used a Small Volume Correction algorithm to correct for multiple comparisons [Worsley, 2003]. Once statistical analyses identified cluster coordinates of dynamical differences between patients and controls, we interpreted those differences using Poincaré maps, lag τ = 1, for the time series (also using Wilcoxon Rank‐Sum Tests). Poincaré maps were computed from an average time series over the entire cluster, since time series for each voxel within the cluster were correlated: k 1 (correlating over 49 voxels) mean r = 0.41 (S.D. = 0.09) for patients and r = 0.42 (S.D. = 0.09) for controls; k 2 (correlating over 27 voxels) mean r = 0.64 (S.D. = 0.08) for patients and r = 0.69 (S.D. = 0.08) for controls. The use of Poincaré maps has been successful in quantifying heart rate variability using indexed R‐R time‐series [Bergfeldt and Haga, 2003; Kamen et al., 1996; Piskorski and Guzik, 2007] and of other clinical measures [Doble and Narayan, 2007]. The Poincaré map represents variability within the time series between activation at each time X n as a function of its predecessor Xn−1; in the context of nonlinear dynamics, it is a two dimensional reconstruction of the time series phase space. It typically appears as a cloud of points distributed preferentially in the first diagonal direction. This reflects the fact that two consecutive time series values which are similar produce a Poincaré point close to the diagonal (more to the right if the common value is higher, and more to the left if the value is lower, spanning the “length” of the scatter plot), while two consecutive time series values separated by a large jump produce a point detached from the diagonal by a distance that reflects the size of the jump (contributing to the “width” of the cloud). Hence the dispersion of points along the diagonal (loading of the first principal component) is thought to indicate the long‐term variability trends, while the dispersion in the perpendicular direction (loading of second principal component) reflects the level of short term variability [Acharya, 2007]. The ratio between the two represents the balance between long‐ and short‐term variability [Acharya, 2007; Contreras et al., 2007]. Therefore, for any voxel cluster(s) showing significantly different β between groups, variability was calculated as aspect ratio of the principal component standard deviations. Finally, to assess sensitivity of dynamical analyses as compared to standard analyses of activation amplitudes using the General Linear Model, we performed a standard fMRI analysis for FEAR‐NEUTRAL, ANGRY‐NEUTRAL, HAPPY‐NEUTRAL, and NEUTRAL‐REST contrasts, as well as TASK‐REST to identify differences in general engagement that could inform the results.
Concerned that the experiment length (α 10 min) of our block design might not have been long enough to verify that the fMRI BOLD power spectrum indeed obeys a power law, we fitted several common candidate distributions to 42 min of fMRI data from the left amygdala while a control subject engaged in a “guided rest” condition (watching a dramatic film). We fitted the power spectrum (from 0.01 to 0.2Hz) using a non‐linear least‐square fit to the following candidate distributions: exponential Ae
−λf, stretched exponential Af
β−1
e
, Log‐normal
 , Power law Af
β, and truncated power law Af
β−1
e
. While the χ2 of the fits were fairly close to each other (since most fits only require two to three parameters the Akaike goodness of fit criterion [Akaike, 1974] reduces to minimizing χ2), only a power law fit resulted in a fit with uniformly distributed residuals while at the same time exhibiting the lowest χ2 of all candidate distributions. We are therefore confident that a power law is the most appropriate distribution for our data.
, Power law Af
β, and truncated power law Af
β−1
e
. While the χ2 of the fits were fairly close to each other (since most fits only require two to three parameters the Akaike goodness of fit criterion [Akaike, 1974] reduces to minimizing χ2), only a power law fit resulted in a fit with uniformly distributed residuals while at the same time exhibiting the lowest χ2 of all candidate distributions. We are therefore confident that a power law is the most appropriate distribution for our data.
As illustrated in Figure 1, linear fits to log‐log plots of the power spectral density resulted in β's of an average fit standard deviation equal to 0.53 over all voxels and subjects, indicating that the fitting procedure was reliable. Initially, being aware that a log‐log scale compromises the assumption of a Gaussian distribution of errors [Clauset et al., 2009], we attempted to fit a power law to our data using a nonlinear least square fit on the raw data using the Levenberg‐Marquardt algorithm [Marquardt, 1963]. Unfortunately, this algorithm was often unable to converge in an automated fashion resulting in incomplete data sets. We therefore chose the robust least‐square linear fit to log‐log (see also Discussion).
RESULTS
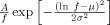
Using the computational techniques and thresholds described in the Methods section, statistical comparisons revealed two clearly‐defined clusters (k 1, k 2) located in Brodmann Area 10 (k 1 composed of 49 voxels in the orbitofrontal cortex, k 2 composed of 27 voxels in the medial prefrontal cortex; Fig. 2a) for which β was significantly different between the two groups. As shown in Figure 2b, β was statistically larger in patients than in controls.
Figure 2.
(a) The three‐dimensional position of the clusters defined by β differences between nine schizophrenia patients and 26 controls. Cluster k 1: Talairach coordinates of its most significant voxel: x = 27, y = 46, z = −12; Cluster k 2: Talairach coordinates of its most significant voxel: x = −3, y = 53, z = 14. (b) Distribution of voxel‐computed β over entire cluster, for patients and controls. Cluster k 1: For patients, cluster mean β = −0.18 (S.E. = 0.2). For healthy controls, cluster mean β = −1.02 (S.E. = 0.12). Between‐group rank statistics within k 1: mean Z = 3.1007, mean P = 0.003. Cluster k 2: For patients, cluster mean β = −0.11 (S.E. = 0.18). For healthy controls, cluster mean β = −0.99, SE = 0.13. Between group rank statistics within k 2: mean Z = 3.1543, mean P = 0.002.
The results were robust under two types of cluster averaging: of β values and of time series. For k 1, differences in cluster mean β distributions between the two groups were Z = 4.3215, P = 0.00002. For patients, average values of β over all voxels within k 1 had a group mean of −0.18 (S.E. = 0.12), while for controls, average values of β over all voxels within k 1 had a group mean of −1.02 (S.E. = 0.04). For k 2, differences in cluster mean β distributions between the two groups were Z = 3.9441, P = 0.00008. For patients, average values of β over all cluster voxels had a group mean of −0.11 (S.E. = 0.10), while for controls, average values of β over all voxels within k 2 had a group mean of −0.99 (S.E. = 0.08). The results were also statistically significant when considering the average time series over all voxels in each cluster (k 1: Z = 4.0196, P = 0.00006; k 2: Z = 3.0760, P = 0.002, respectively). For k1 the average time series produced β values with mean β = −0.34 (S.E. = 0.11) for patients and β = −0.96 (S.E. = 0.05) for controls. For k 2 the average time series produced β values with a mean β = −0.05 (S.E. = 0.08) for patients and β = −0.54 (S.E. = 0.09) for controls.
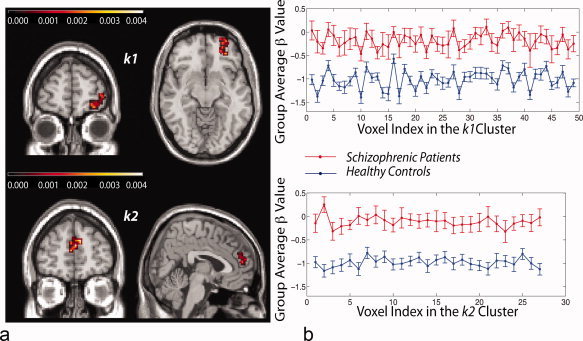
The Poincaré map (see Fig. 3) showed that the temporal variability, as measured by the aspect ratio (AR) of its time‐delay distributions, was more restricted in patients than in controls (k 1ARpatients = 2.36 (S.E. = 0.32), k 1ARcontrols = 3.06 (S.E. = 0.18); Z = −1.9437, P = 0.05; and k 2ARpatients = 1.75 (S.E. = 0.15), k 2ARcontrols = 2.60 (S.E. = 0.20); Z = −2.5099, P = 0.01).
Figure 3.
Poincaré maps of each cluster average time series, which show the value of each timepoint X n versus its predecessor X n−1, illustrate lowered variability (i.e., more restricted area of scatter, in nine schizophrenia patients as compared with 26 controls, with 136 data points per subject. (a) First cluster: Z = −1.9437, P = 0.05. (b) Second cluster: Z = −2.5099, P = 0.01.
Despite the distinct dynamics observed between the schizophrenia patients and controls, standard fMRI analyses using the General Linear Model (mean activation, maximal amplitude, or standard deviation) were insensitive to group differences for any contrast.
DISCUSSION
Analogously to the role of heart rate variability as a diagnostic biomarker and predictor of heart disease, our results (showing distinctions in neural dynamics between patients and controls) provide preliminary evidence that control systems regulation in general, and power spectrum scale invariance in particular, may be a valuable approach worth exploring further in the effort to exploit neuroimaging for psychiatric diagnosis. The absence of statistically significant results associated with standard fMRI analyses suggests the possibility that dynamics may provide greater sensitivity in discerning differences in schizophrenia than activation amplitudes.
As mentioned in the Methods section, experimentally determined power law exponents β were estimated using a least square linear fit to the log‐log power spectrum. This method of estimation is not unproblematic and may lead to a biased approximation of the scaling parameter that is extensively discussed in Clauset et al. [Clauset et al., 2009]. Even though we did not observe large variations in β when switching between non‐linear least square fits to a power law and linear least square fits to log‐log, a discussion of the absolute values of β has to proceed with caution. Using biased exponents may be especially problematic when comparing to theoretical work; however, our methods were chosen for comparison to other experimental research, since most groups do use linear least square fits to log‐log to estimate exponents.
Our frequency analyses not only showed distinct dynamics between patients and controls, but localized the abnormalities to BA10. BA10 is a prefrontal cortical region implicated as an inhibitory component of the control circuit regulating emotional arousal [Phelps et al., 2004; Rosenkranz et al., 2003]; however, more generally, BA10 is thought to support higher‐order cognitive processing and integration of inputs [Dumontheil et al., 2008]. Developmental and functional studies have supported the central role of BA10 in problem solving, reasoning, prospective memory, and episodic memory retrieval [Buckner and Koutstaal, 1998], executive function [Gilbert et al., 2008] and planning [Baker et al., 1996] (such as management of subgoals, while maintaining information in working memory [Braver and Bongiolatti, 2002]). The suboptimal regulation of dynamics we have found in BA10 is well supported in the context of the signs and symptoms of schizophrenia, whose cognitive deficits affect all of these higher functions [American Psychiatric Association, 2000]. Moreover, existing structural [Black et al., 2004; Vogeley et al., 2003], functional [MacDonald et al., 2005] and pharmacological [Pandey et al., 1997] research have directly shown components of BA10 to be impaired in schizophrenia. These impairments have been further correlated with dysfunctions in receptor dynamics in BA10 [Beasley et al., 2002; Klimek et al., 1999], especially with respect to defective glutamatergic neurotransmission [Ghose et al., 2009]. Glutamatergic receptor deficits (of density and structure) are generally suspected to play an important role in the neuroarchitectural abnormalities found in schizophrenia (aberrant neuronal migration, reduced synaptic connections [McGlashan and Hoffman, 2000]) and in its neurodegeneration process through glutamate neurotoxicity [Olney, 1994].
Our frequency domain results clearly indicate that subjects in the healthy control group had signals in the pink noise range (β ≃ −1; i.e., S(f) α 1/f), which has been shown to represent an ideal (i.e., close to critical) range of functioning. Power‐law scaling behavior of spontaneous oscillations has been interpreted within the theory of self‐organized criticality [Buzsáki, 2006]. Pink noise seems to be the optimal transition between order and randomness (also known as critical, or bifurcation state) [Bedard et al., 2006; Van Orden et al., 2005], a state of supple regulation in which even minor system perturbations permit a system to efficiently respond to stimuli but then return to baseline [Radulescu, 2008]. Indeed, power laws corresponding to the broad pink noise range have been observed at multiple levels in the normal function of the brain “fractal,” from the context of behavior [van der Werf et al., 2006] to activation of brain regions using EEG [Linkenkaer‐Hansen et al., 2001; Ward, 2002], MEG [Linkenkaer‐Hansen et al., 2001; Novikov et al., 1997], or MRI [Tolkunov et al., 2010], to neural population activity [Beggs and Plenz, 2003; Milstein et al., 2009]), to the dynamics of the nerve cell membrane [Lundstrom and McQueen, 1974]. In contrast, the patient group had β values close to zero, i.e., close to the white noise range.
Additional analysis of these dynamics is provided by the geometry of the Poincaré map, which has been shown in the heart rate variability literature [Acharya, 2007; Brennan et al., 2001; Guzik et al., 2007] to provide diagnostically valuable information in the differentiation between healthy and dysfunctional regulation in physiological control circuits such as the autonomic nervous system. The scatter plot, a graphical representation of the full set of possible differences between successive time points in the timeseries, was distributed over a more restricted area for patients than for controls, as measured by its aspect ratio. Thus, patients' neural time series showed lower variability as compared to those of controls. As suggested by research showing coupling between limbic and autonomic regulation [Tolkunov et al., 2010], the patients' lowered PSSI provides an important conceptual connection to well‐established findings of lowered heart rate variability in schizophrenia [Bar et al., 2007; Henry et al., 2010; Mujica‐Parodi et al., 2005].
While heart rate variability has grown increasingly common as a psychiatric biomarker, one of its critical limitations in that capacity is its nonspecificity; indeed lowered heart rate variability has been observed for not only schizophrenia, but also anxiety [Gorman and Sloan, 2000], depression [Gorman and Sloan, 2000] and panic disorder [McCraty et al., 2001], while clinical presentations are markedly distinct. Comparison between this and a previous study of fMRI PSSI and trait anxiety [Tolkunov et al., 2010] suggests that a potential advantage of measuring dysregulation more directly in the brain—as opposed to its presumed effects downstream in the autonomic nervous system—is the added degrees of freedom provided by spatial resolution, and therefore the greater likelihood of identifying disorder‐discriminating characteristics. As with schizophrenia patients, anxious individuals in our prior study showed a more stiff dynamic than their calmer colleagues. However, β differences for trait anxiety were distributed within the entire limbic circuit (amygdala, orbitofrontal cortex, hippocampus, superior temporal gyrus, posterior insula, and anterior cingulate). In contrast, for schizophrenia patients, dysregulation was clearly localized to the prefrontal BA10. Thus, although limbic and autonomic “dysregulation” were present in both anxiety and schizophrenia, the two sets of PSSI results clearly differed in their localization within the circuit; the observed dynamical differences in schizophrenia do not appear to be simply an exaggeration of the ones responsible for unusually high trait anxiety within the healthy population, but are qualitatively distinct. One important area for future study is to investigate the degree to which observed PSSI abnormalities in schizophrenia are specific to particular symptoms or symptom‐clusters in this highly heterogeneous disease.
The most common approach toward analyzing fMRI data relies upon the general linear model (GLM), in which responses are calculated as the degree to which outputs (time series for each voxel) are explained by inputs (the design matrix), plus an error term. The strength of the GLM is its ability to disassociate neural processes specific to distinct stimuli by linear regression, as well as the maximization of signal detection by fitting data to an expected “canonical” hemodynamic waveform. While GLM‐based fMRI analyses have traditionally focused on response amplitudes, more recent techniques have been developed to explore the significance of more dynamic features of the timeseries. Most of these techniques seek to explore “connectivity” within the brain, asking the degree to which responses in disparate areas are coupled in linear (e.g., cross‐correlations, psychophysiological interaction analysis, Granger causality) and nonlinear (e.g., dynamic causal modeling) ways.
In contrast, the dynamic methods (PSSI and Poincaré plots) presented here describe the suppleness of an intact control circuit by quantifying its responsivity, or variability. This is an approach that is fundamentally different from neural GLM and connectivity analyses in both its aims and methods, but which has been used extensively in quantifying autonomic regulation. Variability analyses assume nonlinear feedback between components of the circuit, and are particularly well‐suited to non‐invasive diagnostics because of their ability to extract the dynamics of the system as a whole from the fluctuations of a single node (for example, heart rate). Traditionally, heart rate variability analyses have benefited from long time series, often collected over 24 and sometimes even 48 hours, as well as ambulatory environments in which inputs are task‐free. The shortness of our time series, its relatively low temporal resolution (2.5 s), as well as the presence of a frequency‐dependent task, all are standard for fMRI (including both the GLM as well as connectivity analyses), but constitute less than optimal conditions for applying variability methods.
Of the dynamical methods, we choose PSSI and Poincaré plots because they are relatively assumption‐free, unlike other variability methods that require prior optimization of block size and noise filters (approximate entropy), lag and embedding dimension (time‐delay embedding), or bin size (Shannon entropy). This is a critical issue when applying a method to short, low‐resolution, and digitized data such as fMRI, in which there are insufficient number of data points to make meaningful choices regarding block size, lag, and bin‐size. Like PSSI, detrended fluctuation analysis is a variability measure that does not rely upon parameter optimization. It arose as a fractal analytical technique in the context of heart rate variability time series [Ho et al., 1997; Peng et al., 1995], but was recently extended successfully to identifying and quantifying brain activity from fMRI [Hu et al., 2008]. Detrended fluctuation analysis is part of the same class of measures as conventional spectral measures, in that the fractal exponent obtained by detrended fluctuation analysis techniques can be obtained alternatively from the power spectrum of the signal [Willson et al., 2002]. Its important advantage over conventional power spectral methods is the ability to deal with nonstationary signals; it was not necessary to use here because our data set was sufficiently short that nonstationarity was fully corrected by linear detrending, as can be seen in Figure 1. Much longer fMRI time series are likely to reveal nonstationarity problems similar to those seen in long‐term heart rate variability analyses, and thus, detrended fluctuation analysis may be a superior method to apply under these circumstances.
We used fMRI because of its unique ability to obtain data over the entire brain, and therefore access the entire prefrontal‐limbic circuit, understanding that fMRI time series would constrain the band of available frequencies for power spectral techniques, as well as lag‐lengths. Even with these limitations, however, it is important to note that dynamical differences were still clearly discernable between the populations. Moreover, results were robust to extending the frequency range (0.003‐0.2 Hz; see Fig. 4). To test the effect of the design on the power spectrum, we regressed the task design convolved with the hemodynamic response function out of the time series and compared the resulting power spectrum with the original (see Fig. 5). We examined voxels in the reported clusters as well as active ones (as defined by the task). As can be seen from Figure 5, the task design did not affect PSSI. However, a previous study found that tasks can affect the high‐frequency signal power in the rest periods [Duff et al., 2008]. Future work will determine whether sensitivity may be increased through the use of longer, task‐free designs [Cordes et al., 2001]. Given our finding that dysregulation in schizophrenia was localized to cortical regions, it may also be possible to increase the frequency band by the use of other neuroimaging modalities with shallower anatomical depth yet greater temporal resolution, such as electroencephalography and near‐infrared spectroscopy.
Figure 4.
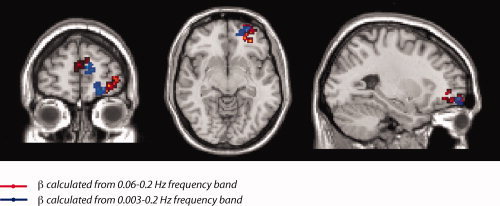
Comparison of spatial localization of dynamical results depending upon frequency bands that include and exclude design and physiological variables. From the power spectral density we computed the scaling parameter β, by plotting the power spectrum on a log‐log scale and estimating the slope by applying a linear fit to the data in the 0.06 to 0.2 Hz range. The upper limit on the frequency range was obtained by the sampling rate, while the lower limit was chosen to avoid confounds due to either task design or physiological variables such as heart rate or respiration. However, localization of dynamical difference to Brodmann Area 10 was robust to extending the frequency range (0.003–0.2 Hz), suggesting that task design did not significantly affect the differences we observed between schizophrenia patients and healthy controls.
Figure 5.
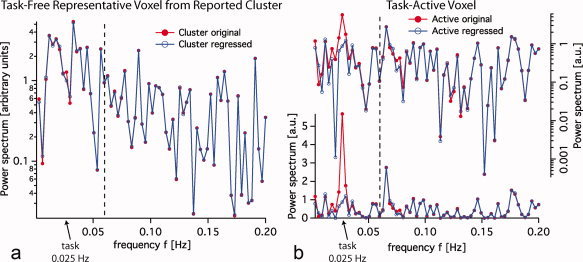
Power spectrum of time‐series using a block design (20s stimulus on, 20s stimulus off; task frequency = 0.025 Hz) with and without task regression. (a) Power spectra of the original time series and of the residual remaining after the design convolved with the HRF function has been regressed out, are very similar. (b) The same comparison for an active voxel in which the design plays a major role by definition. The part of the spectrum to the right of the dashed line (0.06 Hz) is almost identical for both original and regressed time series (active and inactive voxels), suggesting that block designs can be used for the PSSI analysis as long as frequency bands exclude task frequencies. In order to highlight the task regression we plotted the same comparison for active voxels in log and linear scale.
Our findings suggest that variability analyses may provide valuable information about neural system‐wide dynamics not otherwise obtained through conventional neuroimaging techniques, aiding our ability to identify loci of dysregulated networks associated with complex psychiatric disorders such as schizophrenia.
Acknowledgements
The authors thank Tsafrir Greenberg, John Stewart, R.N., Mark Sedler, M.D., and Andrew Francis, M.D. Ph.D., for their invaluable assistance with patient recruitment and screening.
Footnotes
1For the dynamical analyses we chose to use raw time‐series, more commonly used in physical contexts, rather than their first derivative, sometimes used in physiological contexts, to avoid confusion with respect to comparison with the wider literature (the description of “white‐pink‐brown” noise refers specifically to analyses of raw time‐series). Between‐voxel relationships for β do not differ between the raw signal and its derivative; while the β value is affected (shifting by a constant: βderivative = βraw + 2), its spatial and therefore anatomical localization are not.
REFERENCES
- Acharya UR ( 2007): Advances in Cardiac Signal Processing. Berlin: Springer; xxii, pp 468. [Google Scholar]
- Achermann P, Kunz H ( 1999): Modeling circadian rhythm generation in the suprachiasmatic nucleus with locally coupled self‐sustained oscillators: Phase shifts and phase response curves. J Biol Rhythms 14: 460–468. [DOI] [PubMed] [Google Scholar]
- Akaike H ( 1974): A new look at the statistical model identification. IEEE Trans Autom Control 19: 716–723. [Google Scholar]
- American Psychiatric Association ( 2000): Diagnostic and Statistical Manual of Mental Disorders DSM‐IV‐TR. Arlington: American Psychiatric Publishing, Inc. [Google Scholar]
- Aon MA, Cortassa S, O'Rourke B ( 2004): Percolation and criticality in a mitochondrial network. Proc Natl Acad Sci USA 101: 4447–4452. [DOI] [PMC free article] [PubMed] [Google Scholar]
- Baker SC, Rogers RD, Owen AM, Frith CD, Dolan RJ, Frackowiak RS, Robbins TW ( 1996): Neural systems engaged by planning: A PET study of the Tower of London task. Neuropsychologia 34: 515–526. [DOI] [PubMed] [Google Scholar]
- Bar KJ, Boettger MK, Koschke M, Schulz S, Chokka P, Yeragani VK, Voss A ( 2007): Non‐linear complexity measures of heart rate variability in acute schizophrenia. Clin Neurophysiol 118: 2009–2015. [DOI] [PubMed] [Google Scholar]
- Beasley CL, Zhang ZJ, Patten I, Reynolds GP ( 2002): Selective deficits in prefrontal cortical GABAergic neurons in schizophrenia defined by the presence of calcium‐binding proteins. Biol Psychiatry 52: 708–715. [DOI] [PubMed] [Google Scholar]
- Bedard C, Kroger H, Destexhe A ( 2006): Does the 1/f frequency scaling of brain signals reflect self‐organized critical states? Phys Rev Lett 97: 118102. [DOI] [PubMed] [Google Scholar]
- Beggs JM, Plenz D ( 2003): Neuronal avalanches in neocortical circuits. J Neurosci 23: 11167–11177. [DOI] [PMC free article] [PubMed] [Google Scholar]
- Bergfeldt L, Haga Y ( 2003): Power spectral and Poincare plot characteristics in sinus node dysfunction. J Appl Physiol 94: 2217–2224. [DOI] [PubMed] [Google Scholar]
- Black JE, Kodish IM, Grossman AW, Klintsova AY, Orlovskaya D, Vostrikov V, Uranova N, Greenough WT ( 2004): Pathology of layer V pyramidal neurons in the prefrontal cortex of patients with schizophrenia. Am J Psychiatry 161: 742–744. [DOI] [PubMed] [Google Scholar]
- Braver TS, Bongiolatti SR ( 2002): The role of frontopolar cortex in subgoal processing during working memory. Neuroimage 15: 523–536. [DOI] [PubMed] [Google Scholar]
- Brennan M, Palaniswami M, Kamen P ( 2001): Do existing measures of Poincare plot geometry reflect nonlinear features of heart rate variability? IEEE Trans Biomed Eng 48: 1342–1347. [DOI] [PubMed] [Google Scholar]
- Buckner RL, Koutstaal W ( 1998): Functional neuroimaging studies of encoding, priming, and explicit memory retrieval. Proc Natl Acad Sci USA 95: 891–898. [DOI] [PMC free article] [PubMed] [Google Scholar]
- Buzsáki G ( 2006): Rhythms of the Brain. Oxford; New York: Oxford University Press; xiv, pp 448. [Google Scholar]
- Clauset A, Shalizi C, Newman MEJ ( 2009): Power‐law distributions in empirical data. SIAM Rev 51: 661. [Google Scholar]
- Cohen H, Lowental U, Kaplan Z, Kotler M ( 1998): [Heart rate variability, frequency domain analysis: Use and applications in psychiatry]. Harefuah 134: 875–879. [PubMed] [Google Scholar]
- Cohen H, Matar MA, Kaplan Z, Kotler M ( 1999): Power spectral analysis of heart rate variability in psychiatry. Psychother Psychosom 68: 59–66. [DOI] [PubMed] [Google Scholar]
- Contreras P, Canetti R, Migliaro ER ( 2007): Correlations between frequency‐domain HRV indices and lagged Poincare plot width in healthy and diabetic subjects. Physiol Meas 28: 85–94. [DOI] [PubMed] [Google Scholar]
- Cordes D, Haughton VM, Arfanakis K, Carew JD, Turski PA, Moritz CH, Quigley MA, Meyerand ME ( 2001): Frequencies contributing to functional connectivity in the cerebral cortex in “resting‐state” data. AJNR Am J Neuroradiol 22: 1326–1333. [PMC free article] [PubMed] [Google Scholar]
- Doble M, Narayan SK ( 2007): Mathematical analysis of EEG of patients with non‐fatal nonspecific diffuse encephalitis. Int J Biol Life Sci 3: 4. [Google Scholar]
- Duff EP, Johnston LA, Xiong J, Fox PT, Mareels I, Egan GF ( 2008): The power of spectral density analysis for mapping endogenous BOLD signal fluctuations. Hum Brain Mapp 29: 778–790. [DOI] [PMC free article] [PubMed] [Google Scholar]
- Dumontheil I, Burgess PW, Blakemore SJ ( 2008): Development of rostral prefrontal cortex and cognitive and behavioural disorders. Dev Med Child Neurol 50: 168–181. [DOI] [PMC free article] [PubMed] [Google Scholar]
- Ekman P, Friesen W ( 1976): Pictures of Facial Affect. Palo Alto, CA: Consulting Psychologists Press. [Google Scholar]
- First MB, Spitzer RL, Miriam G, Williams JBW ( 2002): Structured Clinical Interview for DSM‐IV‐TR Axis I Disorders, Research Version, Patient Edition, (SCID‐I/P). New York: Biometrics Research, New York State Psychiatric Institute. [Google Scholar]
- Floresco SB, Tse MT ( 2007): Dopaminergic regulation of inhibitory and excitatory transmission in the basolateral amygdala‐prefrontal cortical pathway. J Neurosci 27: 2045–2057. [DOI] [PMC free article] [PubMed] [Google Scholar]
- Ghose S, Gleason KA, Potts BW, Lewis‐Amezcua K, Tamminga CA ( 2009): Differential expression of metabotropic glutamate receptors 2 and 3 in schizophrenia: A mechanism for antipsychotic drug action? Am J Psychiatry 166: 812–820. [DOI] [PMC free article] [PubMed] [Google Scholar]
- Gilbert SJ, Bird G, Brindley R, Frith CD, Burgess PW ( 2008): Atypical recruitment of medial prefrontal cortex in autism spectrum disorders: An fMRI study of two executive function tasks. Neuropsychologia 46: 2281–2291. [DOI] [PMC free article] [PubMed] [Google Scholar]
- Glass L ( 2001): Synchronization and rhythmic processes in physiology. Nature 410: 277–284. [DOI] [PubMed] [Google Scholar]
- Gorman JM, Sloan RP ( 2000): Heart rate variability in depressive and anxiety disorders. Am Heart J 140( 4 Suppl ): 77–83. [DOI] [PubMed] [Google Scholar]
- Gottschalk A, Bauer MS, Whybrow PC ( 1995): Evidence of chaotic mood variation in bipolar disorder. Arch Gen Psychiatry 52: 947–959. [DOI] [PubMed] [Google Scholar]
- Guzik P, Piskorski J, Krauze T, Schneider R, Wesseling KH, Wykretowicz A, Wysocki H ( 2007): Correlations between the Poincare plot and conventional heart rate variability parameters assessed during paced breathing. J Physiol Sci 57: 63–71. [DOI] [PubMed] [Google Scholar]
- Guzzetti S, Borroni E, Garbelli PE, Ceriani E, Della Bella P, Montano N, Cogliati C, Somers VK, Malliani A, Porta A ( 2005): Symbolic dynamics of heart rate variability: A probe to investigate cardiac autonomic modulation. Circulation 112: 465–470. [DOI] [PubMed] [Google Scholar]
- Henry BL, Minassian A, Paulus MP, Geyer MA, Perry W ( 2010): Heart rate variability in bipolar mania and schizophrenia. J Psychiatr Res 44: 168–176. [DOI] [PMC free article] [PubMed] [Google Scholar]
- Ho KK, Moody GB, Peng CK, Mietus JE, Larson MG, Levy D, Goldberger AL ( 1997): Predicting survival in heart failure case and control subjects by use of fully automated methods for deriving nonlinear and conventional indices of heart rate dynamics. Circulation 96: 842–848. [DOI] [PubMed] [Google Scholar]
- Hu J, Lee JM, Gao J, White KD, Crosson B ( 2008): Assessing a signal model and identifying brain activity from fMRI data by a detrending‐based fractal analysis. Brain Struct Funct 212: 417–426. [DOI] [PMC free article] [PubMed] [Google Scholar]
- Kamen PW, Krum H, Tonkin AM ( 1996): Poincare plot of heart rate variability allows quantitative display of parasympathetic nervous activity in humans. Clin Sci (Lond) 91: 201–208. [DOI] [PubMed] [Google Scholar]
- Kauffman SA ( 1993): The Origins of Order: Self‐Organization and Selection in Evolution. New York: Oxford University Press; pp 709. [Google Scholar]
- Kay SR, Opler LA, Lindenmayer JP ( 1988): Reliability and validity of the positive and negative syndrome scale for schizophrenics. Psychiatry Res 23: 99–110. [DOI] [PubMed] [Google Scholar]
- Kernohan AF, Perry CG, Small M ( 2003): Clinical impact of the new criteria for the diagnosis of diabetes mellitus. Clin Chem Lab Med 41: 1239–1245. [DOI] [PubMed] [Google Scholar]
- Kitzbichler MG, Smith ML, Christensen SR, Bullmore E ( 2009): Broadband criticality of human brain network synchronization. PLoS Comput Biol 5: e1000314. [DOI] [PMC free article] [PubMed] [Google Scholar]
- Klimek V, Rajkowska G, Luker SN, Dilley G, Meltzer HY, Overholser JC, Stockmeier CA, Ordway GA ( 1999): Brain noradrenergic receptors in major depression and schizophrenia. Neuropsychopharmacology 21: 69–81. [DOI] [PubMed] [Google Scholar]
- Kopell N, Ermentrout GB, Whittington MA, Traub RD ( 2000): Gamma rhythms and beta rhythms have different synchronization properties. Proc Natl Acad Sci USA 97: 1867–1872. [DOI] [PMC free article] [PubMed] [Google Scholar]
- Kresh JY, Izrailtyan I ( 1998): Evolution in functional complexity of heart rate dynamics: A measure of cardiac allograft adaptability. Am J Physiol 275: R720–R727. [DOI] [PubMed] [Google Scholar]
- Laitio TT, Huikuri HV, Makikallio TH, Jalonen J, Kentala ES, Helenius H, Pullisaar O, Hartiala J, Scheinin H ( 2004): The breakdown of fractal heart rate dynamics predicts prolonged postoperative myocardial ischemia (table of contents). Anesth Analg 98: 1239–1244. [PubMed] [Google Scholar]
- LeDoux J ( 2003): The emotional brain, fear, and the amygdala. Cell Mol Neurobiol 23: 727–738. [DOI] [PMC free article] [PubMed] [Google Scholar]
- Levina A, Herrmann JM, Geisel T ( 2007): Dynamical synapses causing self‐organized criticality in neural networks. Nat Phys 3: 857–860. [Google Scholar]
- Linkenkaer‐Hansen K, Nikouline VV, Palva JM, Ilmoniemi RJ ( 2001): Long‐range temporal correlations and scaling behavior in human brain oscillations. J Neurosci 21: 1370–1377. [DOI] [PMC free article] [PubMed] [Google Scholar]
- Lobbestael J, Leurgans M, Arntz A ( 2010): Inter‐rater reliability of the Structured Clinical Interview for DSM‐IV Axis I Disorders (SCID I) and Axis II Disorders (SCID II). Clin Psychol Psychother 18: 75–79. [DOI] [PubMed] [Google Scholar]
- Lundstrom I, McQueen D ( 1974): A proposed 1‐f noise mechanism in nerve cell membranes. J Theor Biol 45: 405–409. [DOI] [PubMed] [Google Scholar]
- MacDonald AW, 3rd , Carter CS, Kerns JG, Ursu S, Barch DM, Holmes AJ, Stenger VA, Cohen JD ( 2005): Specificity of prefrontal dysfunction and context processing deficits to schizophrenia in never‐medicated patients with first‐episode psychosis. Am J Psychiatry 162: 475–484. [DOI] [PubMed] [Google Scholar]
- Marquardt D ( 1963): An algorithm for least‐squares estimation of nonlinear parameters. J Soc Ind Appl Math 11: 431–441. [Google Scholar]
- McCraty R, Atkinson M, Tomasino D, Stuppy WP ( 2001): Analysis of twenty‐four hour heart rate variability in patients with panic disorder. Biol Psychol 56: 131–150. [DOI] [PubMed] [Google Scholar]
- McGlashan TH, Hoffman RE ( 2000): Schizophrenia as a disorder of developmentally reduced synaptic connectivity. Arch Gen Psychiatry 57: 637–648. [DOI] [PubMed] [Google Scholar]
- Merrin EL, Floyd TC ( 1996): Negative symptoms and EEG alpha in schizophrenia: A replication. Schizophr Res 19: 151–161. [DOI] [PubMed] [Google Scholar]
- Milstein J, Mormann F, Fried I, Koch C ( 2009): Neuronal shot noise and Brownian 1/f2 behavior in the local field potential. PLoS One 4: e4338. [DOI] [PMC free article] [PubMed] [Google Scholar]
- Mitra PP, Ogawa S, Hu X, Ugurbil K ( 1997): The nature of spatiotemporal changes in cerebral hemodynamics as manifested in functional magnetic resonance imaging. Magn Reson Med 37: 511–518. [DOI] [PubMed] [Google Scholar]
- Mitra PP, Pesaran B ( 1999): Analysis of dynamic brain imaging data. Biophys J 76: 691–708. [DOI] [PMC free article] [PubMed] [Google Scholar]
- Mujica‐Parodi LR, Corcoran C, Greenberg T, Sackeim HA, Malaspina D ( 2002): Are cognitive symptoms of schizophrenia mediated by abnormalities in emotional arousal? CNS Spectr 7: 58–60, 65–69. [DOI] [PubMed] [Google Scholar]
- Mujica‐Parodi LR, Korgaonkar M, Ravindranath B, Greenberg T, Tomasi D, Wagshul M, Ardekani B, Guilfoyle D, Khan S, Zhong Y, Chon K, Malaspina D ( 2009): Limbic dysregulation is associated with lowered heart rate variability and increased trait anxiety in healthy adults. Hum Brain Mapp 30: 47–58. [DOI] [PMC free article] [PubMed] [Google Scholar]
- Mujica‐Parodi LR, Yeragani V, Malaspina D ( 2005): Nonlinear complexity and spectral analyses of heart rate variability in medicated and unmedicated patients with schizophrenia. Neuropsychobiology 51: 10–15. [DOI] [PMC free article] [PubMed] [Google Scholar]
- Novikov E, Novikov A, Shannahoff‐Khalsa D, Schwartz B, Wright J ( 1997): Scale‐similar activity in the brain. Phys Rev E 56: R2387. [Google Scholar]
- Olney JW ( 1994): New mechanisms of excitatory transmitter neurotoxicity. J Neural Transm Suppl 43: 47–51. [PubMed] [Google Scholar]
- Pandey GN, Conley RR, Pandey SC, Goel S, Roberts RC, Tamminga CA, Chute D, Smialek J ( 1997): Benzodiazepine receptors in the post‐mortem brain of suicide victims and schizophrenic subjects. Psychiatry Res 71: 137–149. [DOI] [PubMed] [Google Scholar]
- Paulus MP, Geyer MA, Braff DL ( 1996): Use of methods from chaos theory to quantify a fundamental dysfunction in the behavioral organization of schizophrenic patients. Am J Psychiatry 153: 714–717. [DOI] [PubMed] [Google Scholar]
- Peng CK, Havlin S, Stanley HE, Goldberger AL ( 1995): Quantification of scaling exponents and crossover phenomena in nonstationary heartbeat time series. Chaos 5: 82–87. [DOI] [PubMed] [Google Scholar]
- Peng CK, Mietus J, Hausdorff JM, Havlin S, Stanley HE, Goldberger AL ( 1993): Long‐range anticorrelations and non‐Gaussian behavior of the heartbeat. Phys Rev Lett 70: 1343. [DOI] [PubMed] [Google Scholar]
- Phelps EA, Delgado MR, Nearing KI, LeDoux JE ( 2004): Extinction learning in humans: Role of the amygdala and vmPFC. Neuron 43: 897–905. [DOI] [PubMed] [Google Scholar]
- Piskorski J, Guzik P ( 2007): Geometry of the Poincare plot of RR intervals and its asymmetry in healthy adults. Physiol Meas 28: 287–300. [DOI] [PubMed] [Google Scholar]
- Prank K, Kloppstech M, Nowlan SJ, Sejnowski TJ, Brabant G ( 1996): Self‐organized segmentation of time series: Separating growth hormone secretion in acromegaly from normal controls. Biophys J 70: 2540–2547. [DOI] [PMC free article] [PubMed] [Google Scholar]
- Radulescu A ( 2008): Schizophrenia–A parameters' game? J Theor Biol 254: 89–98. [DOI] [PubMed] [Google Scholar]
- Radulescu AR, Mujica‐Parodi LR ( 2008): A systems approach to prefrontal‐limbic dysregulation in schizophrenia. Neuropsychobiology 57: 206–216. [DOI] [PubMed] [Google Scholar]
- Ragland JD, Laird AR, Ranganath C, Blumenfeld RS, Gonzales SM, Glahn DC ( 2009): Prefrontal activation deficits during episodic memory in schizophrenia. Am J Psychiatry 166: 863–874. [DOI] [PMC free article] [PubMed] [Google Scholar]
- Reimondo G, Paccotti P, Minetto M, Termine A, Stura G, Bergui M, Angeli A, Terzolo M ( 2003): The corticotrophin‐releasing hormone test is the most reliable noninvasive method to differentiate pituitary from ectopic ACTH secretion in Cushing's syndrome. Clin Endocrinol (Oxf) 58: 718–724. [DOI] [PubMed] [Google Scholar]
- Rosenkranz JA, Moore H, Grace AA ( 2003): The prefrontal cortex regulates lateral amygdala neuronal plasticity and responses to previously conditioned stimuli. J Neurosci 23: 11054–11064. [DOI] [PMC free article] [PubMed] [Google Scholar]
- Servant D, Logier R, Mouster Y, Goudemand M ( 2009): [Heart rate variability. Applications in psychiatry]. Encephale 35: 423–428. [DOI] [PubMed] [Google Scholar]
- Smith SM ( 2002): Fast robust automated brain extraction. Hum Brain Mapp 17: 143–155. [DOI] [PMC free article] [PubMed] [Google Scholar]
- Tolkunov D, Rubin D, Mujica‐Parodi L ( 2010): Power spectrum scale invariance quantifies limbic dysregulation in trait anxious adults using fMRI: Adapting methods optimized for characterizing autonomic dysregulation to neural dynamic time series. Neuroimage 50: 72–80. [DOI] [PMC free article] [PubMed] [Google Scholar]
- Tulppo MP, Kiviniemi AM, Hautala AJ, Kallio M, Seppanen T, Makikallio TH, Huikuri HV ( 2005): Physiological background of the loss of fractal heart rate dynamics. Circulation 112: 314–319. [DOI] [PubMed] [Google Scholar]
- van der Werf SY, Kaptein KI, de Jonge P, Spijker J, de Graaf R, Korf J ( 2006): Major depressive episodes and random mood. Arch Gen Psychiatry 63: 509–518. [DOI] [PubMed] [Google Scholar]
- Van Orden GC, Holden JG, Turvey MT ( 2005): Human cognition and 1/f scaling. J Exp Psychol Gen 134: 117–123. [DOI] [PubMed] [Google Scholar]
- Ventura J, Liberman RP, Green MF, Shaner A, Mintz J ( 1998): Training and quality assurance with the Structured Clinical Interview for DSM‐IV (SCID‐I/P). Psychiatry Res 79: 163–173. [DOI] [PubMed] [Google Scholar]
- Vierling‐Claassen D, Siekmeier P, Stufflebeam S, Kopell N ( 2008): Modeling GABA alterations in schizophrenia: A link between impaired inhibition and altered gamma and beta range auditory entrainment. J Neurophysiol 99: 2656–2671. [DOI] [PMC free article] [PubMed] [Google Scholar]
- Vogeley K, Tepest R, Schneider‐Axmann T, Hutte H, Zilles K, Honer WG, Falkai P ( 2003): Automated image analysis of disturbed cytoarchitecture in Brodmann area 10 in schizophrenia. Schizophr Res 62: 133–140. [DOI] [PubMed] [Google Scholar]
- Ward L ( 2002): Dynamical Cognitive Science. Cambrige, MA: MIT Press. [Google Scholar]
- Williams LM, Das P, Harris AW, Liddell BB, Brammer MJ, Olivieri G, Skerrett D, Phillips ML, David AS, Peduto A, Gordon E ( 2004): Dysregulation of arousal and amygdala‐prefrontal systems in paranoid schizophrenia. Am J Psychiatry 161: 480–489. [DOI] [PubMed] [Google Scholar]
- Willson K, Francis DP, Wensel R, Coats AJ, Parker KH ( 2002): Relationship between detrended fluctuation analysis and spectral analysis of heart‐rate variability. Physiol Meas 23: 385–401. [DOI] [PubMed] [Google Scholar]
- Worrell GA, Cranstoun SD, Echauz J, Litt B ( 2002): Evidence for self‐organized criticality in human epileptic hippocampus. Neuroreport 13: 2017–2021. [DOI] [PubMed] [Google Scholar]
- Worsley KJ ( 2003): Detecting activation in fMRI data. Stat Methods Med Res 12: 401–418. [DOI] [PubMed] [Google Scholar]
- Yoon JH, Minzenberg MJ, Ursu S, Ryan Walter BS, Wendelken C, Ragland JD, Carter CS ( 2008): Association of dorsolateral prefrontal cortex dysfunction with disrupted coordinated brain activity in schizophrenia: Relationship with impaired cognition, behavioral disorganization, and global function. Am J Psychiatry 165: 1006–1014. [DOI] [PMC free article] [PubMed] [Google Scholar]