Abstract
In magnetic resonance imaging based brain morphometry, Gaussian smoothing is often applied to increase the signal‐to‐noise ratio and to increase the detection power of statistical parametric maps. However, most existing studies used a single smoothing filter without adequately justifying their choices. In this article, we want to determine the extent for which performing a morphometry analysis using multiple smoothing filters, namely conducting a scale space search, improves or decreases the detection power. We first compared scale space search with single‐filter analysis through a simulated population study. The multiple comparisons in our four‐dimensional scale space searches were corrected for using a unified P‐value approach. Our results illustrate that, compared with a single‐filter analysis, a scale space search analysis can properly capture the variations in analysis results caused by variations in smoothing, and more importantly, it can obviously increase the sensitivity for detecting brain morphometric changes. We also show that the cost of an increased critical threshold for conducting a scale space search is very small. In the second experiment, we investigated age and gender effects on cortical volume, thickness, and surface area in 104 normal subjects using scale space search. The obtained results provide a perspective of scale space theory on the morphological changes with age and gender. These results suggest that, in exploratory studies of aging, gender, and disease, conducting a scale space search is essential, if we are to produce a complete description of the structural changes or abnormalities associated with these dimensions. Hum Brain Mapp 34:2113–2128, 2013. © 2011 Wiley Periodicals, Inc.
Keywords: Gaussian kernel smoothing, filter size, unified P‐value, permutation test, cortical volume, cortical surface area, cortical thickness, surface‐based morphometry
INTRODUCTION
In brain morphometric analyses [Mietchen and Gaser, 2009], it is the usual practice to smooth the image data before statistical analysis so as to increase the signal‐to‐noise ratio and to reduce the impact of misregistration. The smoothing also increases the statistical normality of the data and enhances the sensitivity of the analysis. These improvements are obtained at the cost of spatial resolution, with a loss of local detail. The question arises: which smoothing filter, often a Gaussian kernel, is optimal? The matched filter theorem [Pratt, 1991] states that the size of the optimal filter should match the size of the target signal. However, this concept is only applicable when there is prior information about the extent of the signal to be detected. In general, such prior information is unknown in exploratory studies. In practice, investigators commonly choose a filter size based on a rough prior hypothesis about the signal extent, or just simply following a choice previously reported in similar work, so that a significant degree of arbitrariness is present in most imaging studies and the filter sizes employed in existing brain morphometric studies are often very different (Table 1). It has been demonstrated that variations in smoothing can produce very different analysis results [Han et al., 2006; Jones et al., 2005]. Some authors [Bernal‐Rusiel et al., 2008; Lerch and Evans, 2005] have sought to determine the optimal smoothing filter through optimizing the statistical inference instead of trying to match the signal extent directly. In these studies, investigators, using simulated data, examined a range of filter sizes and reported the one that best balanced the trade‐off between sensitivity (proportion of true positives) increase and specificity (proportion of true negatives) reduction as the optimal filter. However, results from these simulation studies cannot be widely applied to real studies as the numbers of true positives and true negatives can only be known in simulations. More recently, Bernal‐Rusiel et al. 2010 proposed a hierarchical thresholding approach to determine the optimal smoothing level by estimating the trade off between the detection sensitivity and specificity, which could be applied to real MRI data. However, this method has some important limitations, e.g., it cannot correct for the multiple comparisons for testing a range of filter sizes. More importantly, in its validation with simulated data, the method failed to detect all of the simulated signals across the whole brain, even with the optimal filter. This means that even though one can successfully determine the optimal filter for a specific signal, there is no guarantee that this filter is also optimal for the other signals contained in the image data, as there is no rationale for assuming that all signals should be the same [Poline and Mazoyer, 1994b]. Therefore, single‐filter approaches do not yield a full description of the brain morphometric changes that exist at different spatial scales.
Table 1.
Examples of Gaussian smoothing kernel sizes used in MRI‐based brain morphometric analyses
| References | Morphometry technique | Filter FWHM (mm) |
|---|---|---|
| Bennett and Baird [2006] | VBM | 4 |
| Hutton et al. [2009] | VBM | 6 |
| Guo et al. [2010] | VBM | 8 |
| Keller et al. [2004] | VBM | 10 |
| Good et al. [2001a, 2001b] | VBM | 12 |
| Sowell et al. 2003 | SBM | 15 |
| Lerch et al. [2008] | SBM | 20 |
| Shaw et al. [2006] | SBM | 30 |
| Lyttelton et al. [2009] | SBM | 40 |
The concept of scale space search in the context of voxel‐based analyses of functional brain imaging data has been utilized to address the issue of smoothing filter choice in brain activation detection. Poline and Mazoyer [1994a, 1994b] first introduced a four‐dimensional (4D) search over a range of filter sizes to find activations at different scales (filter sizes) in positron emission tomography. Some exploratory neuroanatomical studies [Han et al., 2006; Jones et al., 2005] adopted this idea to illustrate the effect of variations in Gaussian smoothing on structural change detection with voxel‐based morphometry (VBM). Although these multifiltering analyses produced more robust descriptions for the signal detected than single‐filter analyses, they did not follow a true multiscale process because they considered different scales as independent images. To conduct a true scale space search over scales as well as the spatial location, Worsley et al. 1996a refined Poline and Mazoyer [1994a, 1994b]'s approach and proposed a unified P‐value method based on the expected Euler characteristic (EC) of the excursion set of a scale space statistical field [Siegmund and Worsley, 1995]. This unified P‐value method set a critical threshold for finding the 4D local maxima to control for the false positive rate in the 4D search, considering the statistical behavior of the image data across scales.
In the current study, we investigated the influence of scale space search on cortical structural change detection with surface‐based morphometry (SBM), using a MRI database containing 104 normal subjects with ages ranging from 19 to 85 years. By utilizing the unified P‐value, we adopt a strategy of scale space search to generate hierarchical scale space representations of the cortical morphometric changes contained in the image data. First, we compared scale space search and single‐filter analysis through a simulated population study, where the structural differences in cortical volume, thickness, and surface area between two groups drawn from the employed database were artificially induced. In the second experiment, we studied the effects of normal aging and gender on the cortical volume, thickness, and surface area in the 104 normal subjects with scale space searches. The applicability of the unified P‐value approach to surface‐based morphometric data was also validated by comparing it against a nonparametric permutation test.
MATERIALS AND METHODS
Subjects
We studied the brains of 104 normal subjects ranging in age from 19 to 85 years [mean age = 45.7 years, standard deviation (SD) = 18.0]. These subjects included 49 men (mean age = 45.4 years, SD = 16.1) and 55 women (mean age = 45.9 years, SD = 19.6). All subjects were recruited for the International Consortium of Brain Mapping (ICBM) dataset at Montreal Neurological Institute (MNI) and have no history of neurological and psychiatric disorders. Each subject gave written informed consent, and the Research Ethics Committee of the Montreal Neurological Institute and Hospital approved the study.
MRI Acquisition
All subjects were scanned with a Siemens Sonata 1.5 T MRI scanner. Three‐dimensional (3D) T1‐weighted images with high resolution were obtained by a 3D gradient echo sequence with following parameters: voxel size = 1 mm, isotropic; 117 sagittal slices; TR = 22 ms; TE = 9.2 ms; flip angle = 30°; acquisition matrix = 256 × 256; FOV = 256 × 256 mm2.
Image Processing
The MR images were processed with the CIVET MRI analysis pipeline (version 1.1.9) [Ad‐Dab'bagh et al., 2006] developed at MNI to automatically extract and co‐register the cortical surfaces for each subject [Kim et al., 2005; MacDonald et al., 2000]. The main pipeline processing steps are as follows (Fig. 1). First, intensity non‐uniformity in the raw MR images was corrected using the N3 algorithm [Sled et al., 1998], and images in the native space were linearly registered into the ICBM152 space [Collins et al., 1994]; Next, each brain volume was classified into white matter (WM), gray matter (GM), cerebrospinal fluid (CSF), and background using the INSECT algorithm [Zijdenbos et al., 1998], and then partial volume fractions of these tissue types were computed in each brain voxel [Tohka et al., 2004]. The inner (WM/GM interface) and outer (pial) cortical surfaces were extracted from each brain volume using the CLASP algorithm [Kim et al., 2005]. The hemispheric inner and outer cortical surfaces were modeled with a deformable polygonal mesh consisted of 81,920 triangles (40,962 vertices). To obtain accurate cross‐subject correspondences, the extracted hemispheric cortical surfaces were nonlinearly aligned to a hemisphere‐unbiased iterative surface template [Lyttelton et al., 2007] using a depth‐potential function [Boucher et al., 2009]. Finally, the aligned cortical surfaces were rescaled back to native space dimension using the inverse of the scaling parameters of the corresponding linear volumetric transformation matrix. All morphometric measures were thus made in native space.
Figure 1.
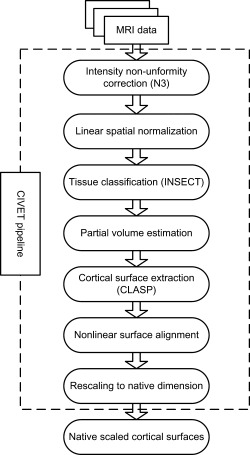
Procedure of MR image processing.
Cortical Morphometric Measurements
The cortical volume was calculated using a tetrahedron‐based finite element method [Reddy, 2005]. Since, for a single subject, the inner and outer cortical surfaces were modeled with the same deformable polygonal mesh, the space between them can be modeled as a tetrahedral mesh [Maunder, 1996] by decomposing each of the prisms defined by each pair of corresponding triangles, respectively, on the inner and outer surfaces into three tetrahedrons (Fig. 2). The volume M of each of the tetrahedrons was computed using a dot product and a cross product as
| (1) |
where a, b, c, and d are the vertices of a tetrahedron. Finally, the volume assigned to any cortical node was one fourth of the total volume of all tetrahedrons adjoining the vertex corresponded to it.
Figure 2.

Decomposing a prism into three tetrahedrons. (A–C) and (A′–C′) are the corresponding triangles on the outer and inner cortical surfaces, respectively. [Color figure can be viewed in the online issue, which is available at http://wileyonlinelibrary.com.]
The cortical thickness was measured using the tlink metric [Lerch and Evans, 2005] of computing the Euclidean distance between linked vertices, respectively, on the inner and outer cortical surfaces.
The cortical surface area was measured by calculating the areas of the triangles adjoining each cortical vertex and assigning a portion of each triangular area to the vertex with the Voronoi's method.
Scale Space Search
The scale space search analyses were implemented in Matlab (the MathWorks, Inc., version 2010) using our Multivariate Surface Processing Toolbox, which was developed based on the unified P‐value algorithm [Worsley et al., 1996a] and the SurfStat toolbox (http://www.math.mcgill.ca/keith/surfstat/). First, local cortical morphometric measurements were smoothed using surface‐based diffusion [Meyer et al., 2003] with different diffusion times t. This was equivalent to smoothing the data with Gaussian smoothing kernels of full width half maximum (FWHM)
| (2) |
To acquire a “full” scale space search, based on the suggestion in [Lindeberg, 1994], the scale interval was selected to be delimited by the finest scale level ω1 = 1 mm (t = 0.1) corresponding to the resolution of the image and the coarsest scale level ω2 = 256 mm (t = 5,910) corresponding to the size of the image. Since the scale space statistical field is stationary in log(FWHM) [Siegmund and Worsley, 1995], we took 49 samples, equally spaced on the log space, in the scale interval by sampling the diffusion time interval as
| (3) |
where n = 1, 2, …,49 and t 1 = 0.1. At each scale, a linear model was applied separately at each vertex υ:
| (4) |
where Y(υ) is the smoothed morphometric measure data, X is the matrix of explanatory variables, β(υ) represents the regression coefficients to be computed for each explanatory variable, and ε(υ) is the error term. Surface maps of t‐statistics were generated by testing a null hypothesis for a coefficient of interest at each scale. These t maps, together with the scale dimension, constructed a 4D scale space. The unified P‐value [Worsley et al., 1996a] defined as
| (5) |
where R d(V) is the d‐dimensional resel count of the searching region V, d = 0, 1, 2, and 3, ρd(t α) is the d‐dimensional Euler characteristic (EC) density, was applied to set a critical threshold tα for the local maxima t max in the scale space for correcting the 4D multiple comparisons, so that the probability of P(t max ≥ tα) < α (detailed definitions and calculations of R d(V) and ρd(tα) are available in [Worsley et al., 1996b]). Significant effects were detected at vertices where t > tα.
Comparison Between Scale Space Search and Single‐Filter Analysis
To investigate the difference between scale space search and single‐filter analysis in cortical morphometric analysis, an artificial patient population was created. Fifty subjects with ages ranging from 20 to 50 years were taken from the employed database, and split into two groups of 25 subjects (controls and patients). Gender and age were balanced between the two groups (controls: 34.8 ± 9.6 years, 13 men, 12 women; patients: 34.8 ± 9.6 years, 14 men, 11 women). The two populations were compared in terms of the original measures of cortical volume, thickness, and surface area. No significant group differences were found.
To induce artificial group differences, for the patient group, the measures of cortical volume, thickness, and surface area were arbitrarily reduced by 25% in five cortical regions, which, respectively, were randomly selected in the left middle temporal gyrus (MTG.L), the left middle frontal gyrus (MFG.L), the left supramarginal gyrus (SMG.L), the left superior parietal gyrus (SPG.L), and the left middle occipital gyrus (MOG.L), and, respectively, with the sizes of about 100, 225, 400, 900, and 1,600 mm2 (see Fig. 3). The sizes of the cortical regions to induce cortical morphometric changes were determined on the cortical surface registration template by adding the area of all triangle faces within the same region.
Figure 3.

Cortical regions used for inducing cortical morphometric changes in the artificial patient group shown on the cortical surface template. The anatomical labels and sizes of each region are given in the legend. [Color figure can be viewed in the online issue, which is available at http://wileyonlinelibrary.com.]
The synthetic population differences were first detected using single‐filter analyses separately with the filters of ω = 1, 5, 10, 15, 20, 25, 30, 35, and 40 mm, which covered the range of filter sizes utilized in the reviewed single‐filter based studies (see Table 1). Multiple comparisons in single‐filter analyses were corrected for using the random field theory (RFT) [Worsley et al., 1996b]. Next, we searched for the artificial cortical structural changes from the starting scale ω1 = 1 mm (voxel size) to the end scale ω2 = 256 mm (image size) with the unified P‐value based scale space search. Detection sensitivities and specificities were computed for these single‐filter and scale space search analyses.
Moreover, we also computed the distributions of the unified P‐value threshold tα = 0.05 for searching for the local maxima in a 4D scale space and for searching at a fixed scale to examine the difference between scale space search and single‐filter analysis with respect to the critical threshold.
Scale Space Search for Aging and Gender Effects
To further reveal the impact of scale space search on real exploratory SBM study, we detected the age‐ and gender‐related cortical morphometric changes in the total 104 normal subjects included in the employed database with scale space searches. At each scale, the smoothed data were regressed against age, gender, age–gender interaction, and total cortical volume. Significant aging and gender effects were detected in the t‐statistic maps generated from the linear regressions along the scale dimension from ω1 = 1 to ω2 = 256 mm using the unified P‐value approach. The 4D multiple comparisons were also separately corrected for using a nonparametric permutation test [Nichols and Holmes, 2002] with loose assumptions about the distribution of the data. Ten thousand null scale spaces were generated by randomly assigning the elements of a factor of interest (age or gender) to the subjects. The critical threshold tα for the local maxima t max in the corresponding actual scale space was found as the [floor(10,000α) + 1]th largest member of the permutation distribution of the maximal t‐statistic in each null scale space (this assessment was not conducted in the simulated population study due to the simulated data).
RESULTS
Scale Space Search versus Single Filter
The simulated population differences in cortical volume, thickness, and surface area detected using single‐filter analyses are illustrated in Figures 4, 5, 6. It is clear to see that, for the single‐filter analyses, the variation in smoothing filter size caused the variation in analysis results: focal changes in MTG.L (induced size of 100 mm2) and MFG.L (induced size of 225 mm2) were only well detected by analyses with small smoothing filters (ω < 15 mm); whereas, analyses with larger filters (ω > 30 mm) only captured regional changes in SPG.L (induced size of 900 mm2) and MOG.L (induced size of 1,600 mm2).
Figure 4.
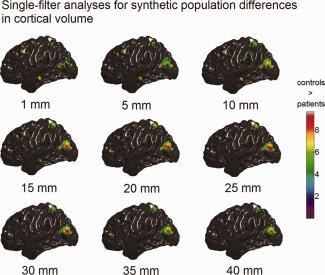
Synthetic population differences in cortical volume (t maps, RFT thresholded with tα = 0.05) detected with single‐filter analyses. The color bar encodes the t‐statistics at each vertex. Bellow each t map is the corresponding filter size. [Color figure can be viewed in the online issue, which is available at http://wileyonlinelibrary.com.]
Figure 5.
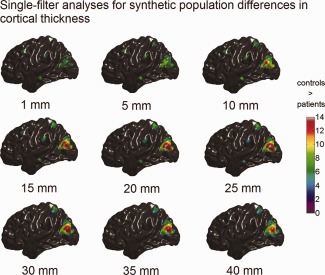
Synthetic population differences in cortical thickness (t maps, RFT thresholded with tα = 0.05) detected with single‐filter analyses. The color bar encodes the t‐statistics at each vertex. Bellow each t map is the corresponding filter size. [Color figure can be viewed in the online issue, which is available at http://wileyonlinelibrary.com.]
Figure 6.
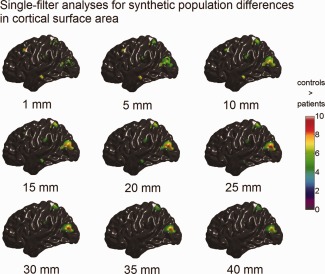
Synthetic population differences in cortical surface area (t maps, RFT thresholded with tα = 0.05) detected with single‐filter analyses. The color bar encodes the t‐statistics at each vertex. Bellow each t map is the corresponding filter size. [Color figure can be viewed in the online issue, which is available at http://wileyonlinelibrary.com.]
In Figures 7A, 8A, and 9A, we selectively present the synthetic structural changes detected with scale space search at the scale levels, which are equal or close to the filter sizes used in the single‐filter analyses, among the 49 scale samples equally spaced on the log space. The full results of scale space search analyses are shown in the Movies 1–3 in the Supporting Information. These visualized results show that the scale space search properly captured the variations of detected structural changes caused by the variations in smoothing. Furthermore, at a single scale, the scale space search sometimes captured relatively less or smaller patterns of structural change than the single‐filter approach with that filter size, due to the increased critical threshold for a 4D search. For example, at ω = 25 mm, the scale space search analysis did not detected the small patterns of induced cortical thinning in MTG.L and SMG.L, which, whereas, were detected by the single‐filter analysis with the filter of ω = 25 mm. However, the full results of a scale space search always identified more signals than a single‐filter analysis. In Figures 7B, 8B, and 9B, we synthesized the spatial locations of the structural changes detected at all the 49 scales for the scale space search analyses. These show that the induced cortical structural changes with different shapes and sizes, especially the cortical thinning, were appropriately detected by the scale space search analyses.
Figure 7.
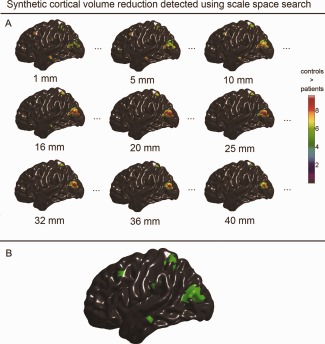
Synthetic population differences in cortical volume detected with scale space search. A: Unified P‐value thresholded t maps of selected scales that were equal or close to the filters used in the single‐filter analyses (full results are available in Movie 1 included in the Supporting Information). B: Spatial locations of the detected volume changes integrated over the scale dimension. [Color figure can be viewed in the online issue, which is available at http://wileyonlinelibrary.com.]
Figure 8.
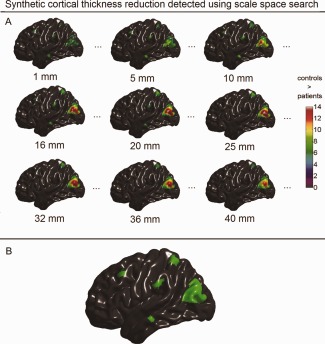
Synthetic population differences in cortical thickness detected with scale space search. A: Unified P‐value thresholded t maps of selected scales that were equal or close to the filters used in the single‐filter analyses (full results are available in Movie 2 included in the Supporting Information). B: Spatial locations of the detected thickness changes integrated over the scale dimension. [Color figure can be viewed in the online issue, which is available at http://wileyonlinelibrary.com.]
Figure 9.
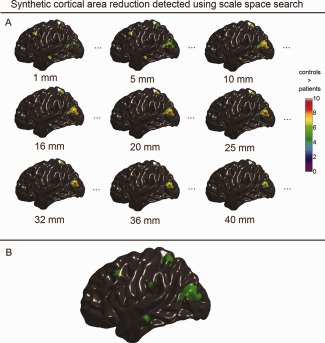
Synthetic population differences in cortical surface area detected with scale space search. A: Unified P‐value thresholded t maps of selected scales that were equal or close to the filters used in the single‐filter analyses (full results are available in Movie 3 included in the Supporting Information). B: Spatial locations of the detected surface area changes integrated over the scale dimension. [Color figure can be viewed in the online issue, which is available at http://wileyonlinelibrary.com.]
The computed detection sensitivities and specificities of the single‐filter analyses and scale space searches (Fig. 10) quantitatively demonstrate the superiorities of the scale space search. As we expected, with the increase of the filter size, the sensitivities of the single‐filter analyses first increased to a maximum (volume at ω = 10 mm, thickness at ω = 20 mm, and surface area at ω =10 mm) and then decreased; the specificities of the single‐filter analyses reduced continuously. In all the three analyses for the induced structural changes in cortical volume, thickness, and surface area, the sensitivities of the scale space searches were always higher than the ones of the single‐filter analyses. Moreover, the specificities of the scale space searches were slightly lower than the ones of the single‐filter analyses with small smoothing filters, but they were still at an excellent level (>0.99).
Figure 10.
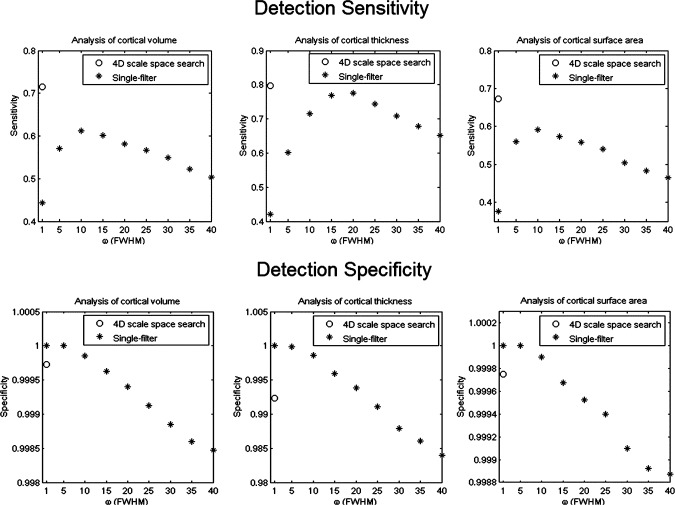
Detection sensitivities and specificities for detecting the synthetic population differences of single‐filter analyses, respectively, with filters of ω = 1, 5, …,40 mm and the scale space search from ω1 = 1 to ω2 = 256 mm.
Figure 11 shows the distributions of the critical threshold tα = 0.05 computed with the unified P‐value and RFT, respectively. As the scale ω1 increased, the thresholds for both the scale space search and single‐filter analysis decreased. The threshold for scale space search was always slightly higher than that for the single‐filter approach, except with ω1 = ω2 where the 4D search is equivalent to the single‐filter analysis. The largest t‐statistic difference between the two distributions was only about 0.02.
Figure 11.
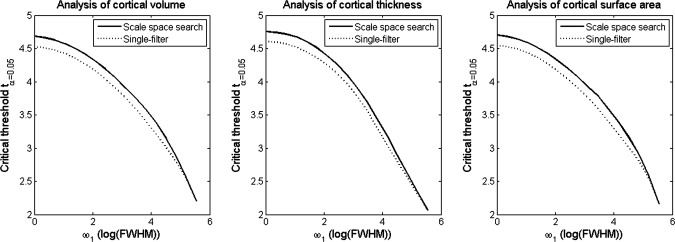
Distributions of critical thresholds tα = 0.05 for single‐filter analysis at a fixed scale ω1 (computed with RFT), and for scale space search from different ω1 to the end scale of ω2 = 256 mm (computed with unified P‐value).
Aging Effects on Cortical Morphometric Measures
The scale space search analyses identified varying patterns of age‐related changes of cortical volume and thickness along the scale dimension (see Figs. 12 and 13; full results are available in Movies 4 and 5 in the Supporting Information), however, did not detect any significant aging effect on cortical surface area. At the finer scales of ω < 10 mm, only a few small foci of volume reduction were observed respectively in the right insula, the medial superior frontal gyri, the left lingual gyrus, the right gyrus rectus, and the right temporal pole. As the scale further increased, these small foci disappeared, except the one in the right temporal pole, which continually increased in size and then disappeared when the scale reached ω > 64 mm. At the coarser scales of ω > 64 mm, the age‐related cortical volume reductions showed as larger regional patterns in the prefrontal cortex and the inferior temporal lobe.
Figure 12.
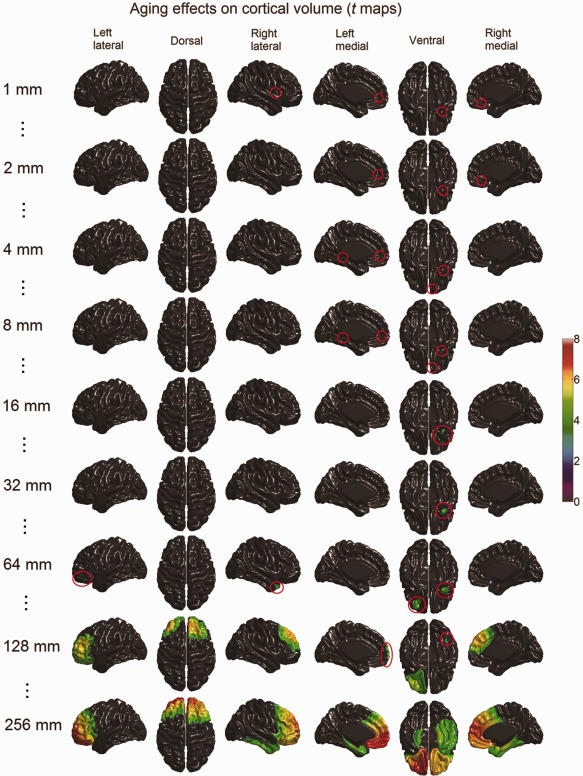
Age‐related cortical volume reduction detected with scale space search (t maps thresholded with unified P‐value, tα = 0.05 = 4.7) at selected scales (full results are available in Movie 4 included in the Supporting Information). At fine scales, aging effects on cortical volume appeared as a few foci, which are rather difficult to see in the small visualizations here. The spatial locations of these foci are highlighted with red circles. With the increase of the scale, some of these foci extended and merged into large regions, some disappeared and new ones appeared. [Color figure can be viewed in the online issue, which is available at http://wileyonlinelibrary.com.]
Figure 13.
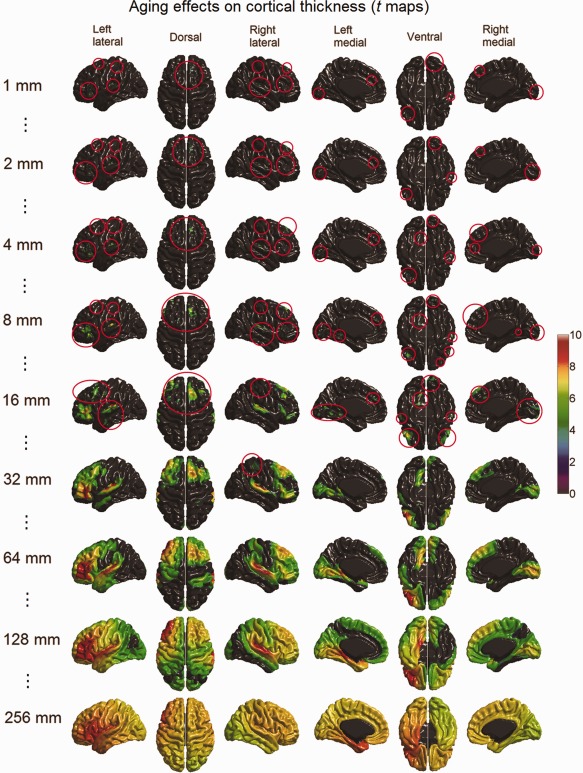
Age‐related cortical thickness reduction detected with scale space search (t maps thresholded with unified P‐value, tα = 0.05 = 4.8) at selected scales (full results are available in Movie 5 included in the Supporting Information). At fine scales, aging effects on cortical thickness showed in small regions, which are rather difficult to see in the small visualizations here. The spatial locations of these foci are highlighted with red circles. With the increase of the scale, most these foci extended and merged into large regions. [Color figure can be viewed in the online issue, which is available at http://wileyonlinelibrary.com.]
At the finer scales of ω < 10 mm, cortical thickness showed more foci of age‐related reduction than cortical volume, which were detected in the prefrontal lobe, the superior and inferior temporal gyri, the medial occipital lobe, and the central gyri. These aging effects on cortical thickness increased in size when the scale further increased, finally covering the entire cortex at a scale of ω > 160 mm.
Gender Differences on Cortical Morphometric Measures
We did not find any significant vertex‐wise gender difference in cortical volume and surface area by controlling the total cortical volume in the linear regressions. The scale space search analysis revealed only small foci of significantly increased cortical thickness in women compared with men at scales of ω < 35 mm (Fig. 14). At the finest scale of ω = 1 mm, the foci of cortical thickening in women were located in the superior parietal gyri, the middle frontal gyri, the left angular gyrus, the left posterior temporal lobe, the right anterior temporal lobe, and the right anterior occipital lobe. As the scale increased, most of these foci did not survive for long, except the ones located in the superior parietal gyri. Especially, the foci of cortical thickening in women in the left superior parietal gyri first increased in size, next merged into a bigger region, and then this region shrank, and finally, it disappeared when the scale exceeded ω = 32 mm.
Figure 14.
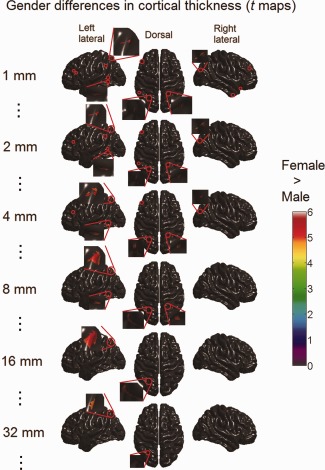
Gender difference (female–male) in cortical thickness detected with scale space search (t maps thresholded with unified P‐value, tα = 0.05 = 4.8). Significant cortical thickening in women was only found as a few small foci (emphasized with red circles, and the most prominent ones are magnified) at fine scales (ω < 35 mm). [Color figure can be viewed in the online issue, which is available at http://wileyonlinelibrary.com.]
Unified P‐value versus Permutation Test
Figure 15 displays the distributions of the critical threshold tα, computed using the unified P‐value method and the permutation test, for the scale space search analyses for the effects of age and gender on the cortical volume, thickness, and surface area. It can be seen that, the unified P‐value threshold was always lower than that for the permutation test, except at the extreme tail (α > 0.9). However, the performances of the unified P‐value method and the permutation test were generally very similar. In all six analyses shown, the difference between the thresholds for the t‐statistic significance level α = 0.05 set by the two approaches was only about 0.3. The t maps thresholded with permutation test were not presented here, because they were very similar to those for the unified P‐value method.
Figure 15.
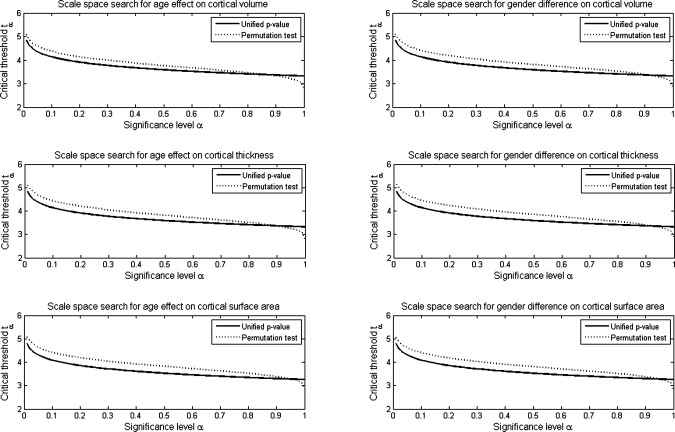
Distributions of critical threshold tα computed using the unified P‐value method and permutation test (10,000 permutations).
DISCUSSION
The goal of this article is to show the superiority of scale space search to single‐filter analysis and to reveal the impact of scale space search on exploratory studies of cortical morphometric changes. First, we conducted a simulated population study to compare scale space search and single‐filtering analysis. Then, we applied the unified P‐value based scale space search to examine the aging and gender effects on cortical volume, thickness, and surface area in 104 normal subjects. In addition, we compared the unified P‐value against a nonparametric permutation test to evaluate its validity for structural MRI data. The obtained results and observations in the presented work are summarized and discussed in this section.
Advantages of Scale Space Search
The artificial population differences detected using single‐filter analyses, respectively, with filters of ω = 1, 5,…,40 mm were different from each other. This confirmed the statement that variations in smoothing will produce variations in analysis results [Han et al., 2006; Jones et al., 2005]. The scale space searches in our experiments captured these variations along the scale dimension appropriately, which cannot be identified with a single‐filter analysis. Furthermore, a single‐filter analysis always failed to simultaneously capture all the five simulated population difference patterns with different sizes optimally. Whereas, the scale space search analyses properly detected the smaller patterns of structural changes at finer scales and the larger patterns at coarser scales. Therefore, a scale space search can produce more complete description for the signals contained in the image data than a single‐filter analysis.
We also noticed that smaller patterns of synthetic structural changes, such as the ones in MTG.L and MFG.L, appearing at finer scales disappeared at coarser scales; differently, larger patterns, such as the ones in SPG.L and MOG.L, appeared not only at coarser scales but also at finer scales, although they only appeared as some small foci within the corresponding regions at finer scales. Thus, as we did in this work, it is important to start a scale space search from a very small scale level to a large scale level to ensure a full scale space search, especially for the small patterns of signal. In addition, according to the matched filter theorem, the optimal detections of the five patterns of induced group differences, respectively, with the sizes of 100, 225, 400, 900, and 1,600 mm2, are expected to be acquired, respectively, with filers of ω = 10, 15, 20, 30, and 40 mm. However, in the presented results, the optimal detections were obtained with filters that, in general, were smaller than the expected ones. This is probably because that the cortical surface smoothing [Meyer et al., 2003] employed in this work was isotropic, but the induced structural changes were somehow anisotropic.
The superiority of scale space search was also numerically demonstrated by the greater detection sensitivities of scale space search analyses than the single‐filter analyses. In addition, the filter size where the single‐filter analysis obtained the highest sensitivity was not constant for different morphometric measurements (ω = 10 mm for volume, ω = 20 mm for thickness, and ω = 10 mm for surface area). This implies that a smoothing filter that is “optimal" for the analysis of a given morphometric measurement may be not also applicable to other measurements. Moreover, we observed that the specificities of our scale space search analyses were very high (>0.99), even though the searched scale spaces covered a very wide range of scales from ω = 1 to 256 mm. This indicated that the unified P‐value approach we utilized controlled for the increased false positive rate in the 4D multiple comparisons appropriately (specificity = 1 ‐ false positive rate).
The comparison between the distributions of the critical threshold computed with the unified P‐value and RFT illustrates that the cost of an increased critical threshold must be paid for implementing a scale space search compared with implementing a single‐filter analysis. However, this cost is very small. The above discussed advantages of scale space search are beneficial to practical exploratory studies, especially for disease studies, where very little is known about the brain structural changes or abnormalities to be investigated.
Scale Space Search for Aging and Gender Effects
Our scale space search analyses revealed age‐related changes in either cortical volume or thickness, which are consistent with the previously reported vulnerabilities of the cerebral cortex to aging [Fjell et al., 2009; Good et al., 2001b; Lemaitre et al., 2005; Salat et al., 2004; Sowell et al., 2003; Tisserand et al., 2002]. Differently, our results support the “last in, first out” hypothesis of aging [Raz and Rodrigue, 2006], i.e., brain regions that are the last to develop are the first to be affected by aging, from the perspective of scale space theory. According to the scale space theory [Lindeberg, 1994; Lindeberg et al., 1999], a region having larger spatial extent, higher intensity and longer lifetime in the scale space may be treated as more significant. Therefore, aging effects on cortical volume and thickness observed in the prefrontal cortex are the most strongest across the entire cortex. Based on the Flechsig's myelination precedence (a metric of developmental myelination of intracortical fibers), the prefrontal cortex is one of the last regions to undergo complete maturation. Moreover, like many existing cortical thickness studies [e.g., Fjell et al., 2009; Lemaitre et al., 2005; Salat et al., 2004], we also found significant cortical thinning in or around the primary visual cortex and motor cortex, which develop early. These findings were previously reported as contradictory to the “first in, last out” theory. However, our results from scale space search analysis suggested that these areas should be considered as less significant than the prefrontal cortex because of their relatively smaller sizes, lower t values and shorter lifetime along the scale dimension.
It is not very surprising that there is no age‐related change in cortical surface area was detected in our study. In [Kochunov et al., 2005], investigators found that the age‐related increase in the sulcal width was inversely correlated with the decrease in the sulcal depth. Thus, atrophied brains may exhibit a change in gyral complexity but not a change in surface area [Narr et al., 2004]. This indicates that cortical volume and thickness are more informative for detecting age‐related morphometric changes than surface area. Moreover, compared with cortical volume, cortical thickness always showed a more diffuse range of significant age‐related reduction. These distinctions between cortical volume, thickness, and surface area in aging observed here are well in line with the results reported by the existing studies [Im et al., 2008; Lemaitre et al., [Link]; Rettmann et al., 2006].
In addition, we also observed striking asymmetric patterns of age‐related reduction in either cortical volume or thickness in the inferior temporal lobe at certain coarse scales. Although, by far, there is no clear evidence of asymmetric aging of the brain, lateralized patterns of cortical atrophy in aging have been observed in a number of studies [e.g., Gur et al., 1991; Raz et al., 2004; Thambisetty et al., 2010].
For the gender differences, only cortical thickness showed significant gender differences in this work. Therefore, cortical thickness is more sensitive than cortical volume and surface area to the local structural changes related to gender, as in the analyses of aging effects. The failure of detecting gender differences in volume and surface area, and the failure of detecting large regions of gender differences in thickness were primarily attributable to that we used unscaled measures and controlled for the total cortical volume. It has been demonstrated that examining the brain with unscaled data will find less pronounced gender differences than with stereotaxic‐scaled measures, as stereotaxic‐scaling may lead to disproportionate increases of cortical morphometric measures and consequently lead to exaggerated structural changes [Im et al., 2006; Luders et al., 2006]. Furthermore, the observed cortical thickening in women support the previously reported higher GM concentration [Good et al., 2001a] and GM/WM ratio [Gur et al., 1999] in women than men, and the hypothesis of sexual dimorphism. According to the scale space theory, the patterns of cortical thickening in women in the superior parietal gyri are the most significant because of their larger size, higher t values and longer lifetime in the scale space. This finding is consistent with the results reported in [Im et al., 2006; Luders et al., 2006].
Validity of Unified P‐value
The unified P‐value method was originally developed for functional brain image analysis [Worsley et al., 1996a], and it depends on certain assumptions about the distribution of the data, e.g., Gaussian distribution. There is no guarantee that an algorithm developed for functional neuroimaging data should be universal, and in particular should apply to brain morphometric measure data. Therefore, we separately applied a nonparametric permutation test to correct for the multiple comparisons in the scale space search. The thresholds set using the unified P‐value method were slightly lower than those of the permutation test. In general, however, the performances of the unified P‐value method and the permutation test were similar, especially when α < 0.05. Thus, the assumptions of the unified P‐value method that was originally developed for volume‐based functional neuroimaging data were acceptable for our surface‐based cortical morphometric data.
Further Considerations and Future Work
A possible disadvantage of the scale space search is the complicated interpretation and understanding of the hierarchical representations of the detected signals. In Figures 7B, 8B, and 9B, we integrated the spatial locations of the simulated structural changes detected at different scales into a single image to illustrate the detection capacity of a scale space search to the induced patterns. However, this type of synthesized visualizations cannot be used to replace the hierarchical representations in practical applications, as the essential aim of conducting a scale space search is to capture the signals with different shapes and sizes that appear differently at different scales. Recently, an approach, named threshold free cluster enhancement (TFCE), has been proposed by Smith and Nichols 2009, which can be considered as an alternative to scale space search. TFCE modulates the raw statistic map by the height of each voxel/vertex along with its base of support, and then produces a single output image where the voxel/vertex‐wise values represent the amount of cluster‐like local spatial support. The output of TFCE is easy to interpret and contains rich spatial information about the signals to detect. TFCE can identify the region of support without any assistance from spatial smoothing; however, data smoothing are still required prior to implementing TFCE to suppress the image noise and, more importantly, to reduce the impact of misregistration. Although Smith and Nichols 2009 tried to find an optimal smoothing filter for their experiments, they suggested that it would be valuable to integrate the TFCE measure over a range of smoothing filters based on the concept of scale space. The scale space search approach presented in this article is applicable for this purpose.
Furthermore, in this article, we theoretically interpreted the results of our scale space search analyses based on the scale space theory. A meaningful future work is to quantitatively determine the significance of the detected signals in the scale space utilizing the technique such as scale‐space primal sketch [Lindeberg, 1994], which has been applied to studies of brain activation patterns in functional neuroimaging [Lindeberg et al., 1999; Operto et al., 2008]. In addition, the statistical inferences in this work were based on vertex‐wise thresholding. Extending the study with cluster‐wise inferences will enhance our understanding about the impact of scale space search on brain morphometric analyses, although the presented results are already enough to demonstrate the superiorities of the scale space search to the single‐filter analysis and comparing different critical thresholding methods is out of the scope of this article. Moreover, like most of the existing brain morphometric studies, the surface diffusion employed in this work was isotropic [Meyer et al., 2003]. Isotropic diffusion may be undesirable when the signal to detect follows the direction of cortical folds [Boucher et al., 2011]. Therefore, it is also desirable to apply the concept of scale space search to investigate the impact of anisotropic surface diffusion with different anisotropic factors on the surface‐based cortical morphometry.
CONCLUSION
The fact that variations in smoothing affects the analysis results is an issue, while not new in volumetric analysis, has not been thoroughly addressed in MRI based brain morphometry. Theoretically, the optimal smoothing kernel should match the spatial extent of the target signal. However, prior information about the signal extent, in general, is unknown in exploratory studies. Therefore, cortical structural changes previously reported using single‐filter approaches and without giving sufficiently justified reason for the choice of smoothing filter may need to be reconsidered.
In this article, we first illustrated the superiorities of scale space search to single‐filter analysis for brain morphometric studies through a simulated population study. Then, we showed the effects of scale space search on detections of age‐ and gender‐related cortical morphometric changes. Our results illustrated that, when the signal extent is unknown, searching scale space can increase the detection sensitivity and produce a relatively complete description of the structural changes, with just a small cost of the increase of the critical threshold. Therefore, it is essential to conduct a scale space search to fully understand the changes in morphology that vary with age, gender, and disease. Moreover, the presented results also demonstrated the ability of the unified P‐value to control for the false positive rate for 4D scale space search and its validity to our surface‐based cortical morphometric data.
Supporting information
Supporting Information Movie 1
Supporting Information Movie 2
Supporting Information Movie 3
Supporting Information Movie 4
Supporting Information Movie 5
Acknowledgments
The MRI data were originally collected by the International Consortium for Brain Mapping (ICBM: P.I., JC Mazziotta).
REFERENCES
- Ad-Dab'bagh Y, Einarson D, Lyttelton O, Muehlboeck J-S, Mok K, Ivanov O, Vincent RD, Lepage C, Lerch J, Fombonne E, Evans AC (2006): The CIVET image-processing environment: A fully automated comprehensive pipeline for anatomical neuroimaging research. Proceedings of the 12th Annual Meeting of the Organization for Human Brain Mapping (OHBM). Florence, Italy.
- Bernal‐Rusiel JL, Atienza M, Cantero JL (2008): Detection of focal changes in human cortical thickness: Spherical wavelets versus Gaussian smoothing. Neuroimage 41:1278–1292. [DOI] [PubMed] [Google Scholar]
- Bernal‐Rusiel JL, Atienza M, Cantero JL (2010): Determining the optimal level of smoothing in cortical thickness analysis: A hierarchical approach based on sequential statistical thresholding. Neuroimage 52:158–171. [DOI] [PubMed] [Google Scholar]
- Boucher M, Whitesides S, Evans A (2009): Depth potential function for folding pattern representation, registration and analysis. Med Image Anal 13:203–214. [DOI] [PubMed] [Google Scholar]
- Boucher M, Evans A, Siddiqi K (2011): Anisotropic diffusion of tensor fields for fold shape analysis on surfaces. Inf Process Med Imaging 22:271–282. [DOI] [PubMed] [Google Scholar]
- Collins DL, Neelin P, Peters TM, Evans AC (1994): Automatic 3D intersubject registration of MR volumetric data in standardized Talairach space. J Comput Assist Tomogr 18:192–205. [PubMed] [Google Scholar]
- Fjell AM, Westlye LT, Amlien I, Espeseth T, Reinvang I, Raz N, Agartz I, Salat DH, Greve DN, Fischl B, Dale AM, Walhovd KB (2009): High consistency of regional cortical thinning in aging across multiple samples. Cereb Cortex 19:2001–2012. [DOI] [PMC free article] [PubMed] [Google Scholar]
- Good CD, Johnsrude I, Ashburner J, Henson RN, Friston KJ, Frackowiak RS (2001a): Cerebral asymmetry and the effects of sex and handedness on brain structure: A voxel‐based morphometric analysis of 465 normal adult human brains. Neuroimage 14:685–700. [DOI] [PubMed] [Google Scholar]
- Good CD, Johnsrude IS, Ashburner J, Henson RN, Friston KJ, Frackowiak RS (2001b): A voxel‐based morphometric study of ageing in 465 normal adult human brains. Neuroimage 14 ( 1 Pt 1):21–36. [DOI] [PubMed] [Google Scholar]
- Gur RC, Mozley PD, Resnick SM, Gottlieb GL, Kohn M, Zimmerman R, Herman G, Atlas S, Grossman R, Berretta D, Erwin R, Gur RE (1991): Gender differences in age effect on brain atrophy measured by magnetic resonance imaging. Proc Natl Acad Sci USA 88:2845–2849. [DOI] [PMC free article] [PubMed] [Google Scholar]
- Gur RC, Turetsky BI, Matsui M, Yan M, Bilker W, Hughett P, Gur RE (1999): Sex differences in brain gray and white matter in healthy young adults: Correlations with cognitive performance. J Neurosci 19:4065–4072. [DOI] [PMC free article] [PubMed] [Google Scholar]
- Han X, Jovicich J, Salat D, van der Kouwe A, Quinn B, Czanner S, Busa E, Pacheco J, Albert M, Killiany R, Maguire P, Rosas D, Makris N, Dale A, Dickerson B, Fischl B (2006): Reliability of MRI‐derived measurements of human cerebral cortical thickness: The effects of field strength, scanner upgrade and manufacturer. Neuroimage 32:180–194. [DOI] [PubMed] [Google Scholar]
- Im K, Lee JM, Lee J, Shin YW, Kim IY, Kwon JS, Kim SI (2006): Gender difference analysis of cortical thickness in healthy young adults with surface‐based methods. Neuroimage 31:31–38. [DOI] [PubMed] [Google Scholar]
- Im K, Lee JM, Lyttelton O, Kim SH, Evans AC, Kim SI (2008): Brain size and cortical structure in the adult human brain. Cereb Cortex 18:2181–2191. [DOI] [PubMed] [Google Scholar]
- Jones DK, Symms MR, Cercignani M, Howard RJ (2005): The effect of filter size on VBM analyses of DT‐MRI data. Neuroimage 26:546–554. [DOI] [PubMed] [Google Scholar]
- Kim JS, Singh V, Lee JK, Lerch J, Ad‐Dab'bagh Y, MacDonald D, Lee JM, Kim SI, Evans AC (2005): Automated 3‐D extraction and evaluation of the inner and outer cortical surfaces using a Laplacian map and partial volume effect classification. Neuroimage 27:210–221. [DOI] [PubMed] [Google Scholar]
- Kochunov P, Mangin JF, Coyle T, Lancaster J, Thompson P, Riviere D, Cointepas Y, Regis J, Schlosser A, Royall DR, Zilles K, Mazziotta J, Toga A, Fox PT (2005): Age‐related morphology trends of cortical sulci. Hum Brain Mapp 26:210–220. [DOI] [PMC free article] [PubMed] [Google Scholar]
- Lemaitre H, Crivello F, Grassiot B, Alperovitch A, Tzourio C, Mazoyer B (2005): Age‐ and sex‐related effects on the neuroanatomy of healthy elderly. Neuroimage 26:900–911. [DOI] [PubMed] [Google Scholar]
- Lemaitre H, Goldman AL, Sambataro F, Verchinski BA, Meyer‐Lindenberg A, Weinberger DR, Mattay VS: Normal age‐related brain morphometric changes: Nonuniformity across cortical thickness, surface area and gray matter volume? Neurobiol Aging (in press). [DOI] [PMC free article] [PubMed] [Google Scholar]
- Lerch JP, Evans AC (2005): Cortical thickness analysis examined through power analysis and a population simulation. Neuroimage 24:163–173. [DOI] [PubMed] [Google Scholar]
- Lindeberg T (1994): Scale‐Space Theory in Computer Vision. Boston: Kluwer Academic; xii, 423 p. [Google Scholar]
- Lindeberg T, Lidberg P, Roland PE (1999): Analysis of brain activation patterns using a 3‐D scale‐space primal sketch. Hum Brain Mapp 7:166–194. [DOI] [PMC free article] [PubMed] [Google Scholar]
- Luders E, Narr KL, Thompson PM, Rex DE, Woods RP, Deluca H, Jancke L, Toga AW (2006): Gender effects on cortical thickness and the influence of scaling. Hum Brain Mapp 27:314–324. [DOI] [PMC free article] [PubMed] [Google Scholar]
- Lyttelton O, Boucher M, Robbins S, Evans A (2007): An unbiased iterative group registration template for cortical surface analysis. Neuroimage 34:1535–1544. [DOI] [PubMed] [Google Scholar]
- MacDonald D, Kabani N, Avis D, Evans AC (2000): Automated 3‐D extraction of inner and outer surfaces of cerebral cortex from MRI. Neuroimage 12:340–356. [DOI] [PubMed] [Google Scholar]
- Maunder CRF (1996): Algebraic Topology. Dover Publications: New York. [Google Scholar]
- Meyer N, Desbrun M, Schröder P, Barr AH (2003): Discrete differential‐geometry operators for triangulated 2‐manifolds. In Visualization and Mathematics III Hege HC. and Polthier K. (Eds). Springer: Berlin: 35–57. [Google Scholar]
- Mietchen D, Gaser C (2009): Computational morphometry for detecting changes in brain structure due to development, aging, learning, disease and evolution. Front Neuroinform 3:25. [DOI] [PMC free article] [PubMed] [Google Scholar]
- Narr KL, Bilder RM, Kim S, Thompson PM, Szeszko P, Robinson D, Luders E, Toga AW (2004): Abnormal gyral complexity in first‐episode schizophrenia. Biol Psychiatry 55:859–867. [DOI] [PubMed] [Google Scholar]
- Nichols TE, Holmes AP (2002): Nonparametric permutation tests for functional neuroimaging: A primer with examples. Hum Brain Mapp 15:1–25. [DOI] [PMC free article] [PubMed] [Google Scholar]
- Operto G, Clouchoux C, Bulot R, Anton JL, Coulon O (2008): Surface‐based structural group analysis of fMRI data. Med Image Comput Comput Assist Interv 11 ( Pt 1):959–966. [DOI] [PubMed] [Google Scholar]
- Poline JB, Mazoyer BM (1994a): Analysis of individual brain activation maps using hierarchical description and multiscale detection. IEEE Trans Med Imaging 13:702–710. [DOI] [PubMed] [Google Scholar]
- Poline JB, Mazoyer BM (1994b): Enhanced detection in brain activation maps using a multifiltering approach. J Cereb Blood Flow Metab 14:639–642. [DOI] [PubMed] [Google Scholar]
- Pratt WK (1991): Digital Image Processing. New York: Wiley. [Google Scholar]
- Raz N, Rodrigue KM (2006): Differential aging of the brain: Patterns, cognitive correlates and modifiers. Neurosci Biobehav Rev 30:730–748. [DOI] [PMC free article] [PubMed] [Google Scholar]
- Raz N, Gunning‐Dixon F, Head D, Rodrigue KM, Williamson A, Acker JD (2004): Aging, sexual dimorphism, and hemispheric asymmetry of the cerebral cortex: Replicability of regional differences in volume. Neurobiol Aging 25:377–396. [DOI] [PubMed] [Google Scholar]
- Reddy JN (2005): An Introduction to the Finite Element Method (Engineering Series). New York: McGraw‐Hill. [Google Scholar]
- Rettmann ME, Kraut MA, Prince JL, Resnick SM (2006): Cross‐sectional and longitudinal analyses of anatomical sulcal changes associated with aging. Cereb Cortex 16:1584–1594. [DOI] [PubMed] [Google Scholar]
- Salat DH, Buckner RL, Snyder AZ, Greve DN, Desikan RS, Busa E, Morris JC, Dale AM, Fischl B (2004): Thinning of the cerebral cortex in aging. Cereb Cortex 14:721–730. [DOI] [PubMed] [Google Scholar]
- Siegmund DO, Worsley KJ (1995): Testing for a signal with unknown location and scale in a stationary gaussian random‐field. Ann Stat 23:608–639. [Google Scholar]
- Sled JG, Zijdenbos AP, Evans AC (1998): A nonparametric method for automatic correction of intensity nonuniformity in MRI data. IEEE Trans Med Imaging 17:87–97. [DOI] [PubMed] [Google Scholar]
- Smith SM, Nichols TE (2009): Threshold‐free cluster enhancement: Addressing problems of smoothing, threshold dependence and localisation in cluster inference. Neuroimage 44:83–98. [DOI] [PubMed] [Google Scholar]
- Sowell ER, Peterson BS, Thompson PM, Welcome SE, Henkenius AL, Toga AW (2003): Mapping cortical change across the human life span. Nat Neurosci 6:309–315. [DOI] [PubMed] [Google Scholar]
- Thambisetty M, Wan J, Carass A, An Y, Prince JL, Resnick SM (2010): Longitudinal changes in cortical thickness associated with normal aging. Neuroimage 52:1215–1223. [DOI] [PMC free article] [PubMed] [Google Scholar]
- Tisserand DJ, Pruessner JC, Sanz Arigita EJ, van Boxtel MP, Evans AC, Jolles J, Uylings HB (2002): Regional frontal cortical volumes decrease differentially in aging: An MRI study to compare volumetric approaches and voxel‐based morphometry. Neuroimage 17:657–669. [PubMed] [Google Scholar]
- Tohka J, Zijdenbos A, Evans A (2004): Fast and robust parameter estimation for statistical partial volume models in brain MRI. Neuroimage 23:84–97. [DOI] [PubMed] [Google Scholar]
- Worsley KJ, Marrett S, Neelin P, Evans AC (1996a): Searching scale space for activation in PET images. Hum Brain Mapp 4:74–90. [DOI] [PubMed] [Google Scholar]
- Worsley KJ, Marrett S, Neelin P, Vandal AC, Friston KJ, Evans AC (1996b): A unified statistical approach for determining significant signals in images of cerebral activation. Hum Brain Mapp 4:58–73. [DOI] [PubMed] [Google Scholar]
- Zijdenbos A, Forghani R, Evans A (1998): Automatic quantification of MS lesions in 3D MRI brain data sets: Validation of INSECT. Med Image Comput Comput Assist Interv—Miccai'98 1496:439–448. [Google Scholar]
Associated Data
This section collects any data citations, data availability statements, or supplementary materials included in this article.
Supplementary Materials
Supporting Information Movie 1
Supporting Information Movie 2
Supporting Information Movie 3
Supporting Information Movie 4
Supporting Information Movie 5


