

Abstract
This study explored the somatotopy of the motor areas of the medial wall of the cerebral hemisphere, in the human brain. In a sample of 16 healthy participants, we drew 9 regions of interest (ROI) over the primary motor area (M1), each corresponding to a well‐known somatic representation. Using functional magnetic resonance imaging, we investigated the resting state functional connectivity between each selected ROI and the motor areas of the medial wall. The main finding was the identification of a rostrocaudal gradient of connectivity in which the more we move from cranial to caudal body representation areas in M1, the more the corresponding connected area in the medial wall is shifted rostrocaudally, confirming the somatotopic schema found in the SMA. We also reanalyzed data obtained in a previous experiment, we performed using hand and foot motor tasks; the reanalysis consisted in traditional BOLD and functional connectivity analyses. Finally, we performed a meta‐analysis of 28 studies of hand and foot motor tasks, mapping their cerebral representations using the tools provided by the Brainmap database. All data converge in confirming a somatotopic representation of the medial wall motor areas, with hand representation placed more rostrally and ventrally than that of the foot. Hum Brain Mapp, 2010. © 2010 Wiley‐Liss, Inc.
Keywords: motor areas, medial wall, supplementary motor area, SMA, cingulate motor areas, resting state, functional connectivity, seed voxel correlation, functional magnetic resonance imaging, fMRI, somatotopy
INTRODUCTION
Ever since they were first identified, the motor areas of the medial wall have remained, in large part, a mystery. Originally the only recognized motor area in the mesial face of the brain was the supplementary motor area (SMA), located in the medial portion of Brodmann's cytoarchitectonic area 6 [Penfield and Welch, 1951; Woolsey et al., 1952]. This knowledge was derived through electrical stimulation of the cortical surface of the human brain during surgery for brain tumors. We now know of five premotor areas, located in subfields of Brodmann's areas 6, 23, and 24. These premotor areas include the SMA, the pre‐SMA [Rizzolatti et al., 1996; Tanji 1996], and three areas located within the cingulate sulcus—the rostral, dorsal, and ventral cingulate motor areas (CMAr, CMAd, and CMAv, respectively). The SMA and pre‐SMA are located in the dorsomedial frontal cortex, rostrally to the leg representation of the primary motor cortex (M1). The SMA is located caudal to the vertical projection of the commissure, while the pre‐SMA lies rostral to this line. The three cingulate motor areas are located within the homonym sulcus: the CMAr and CMAv in the ventral bank of the sulcus and the CMAd in the dorsal bank; each cingulate motor area corresponds to a different cytoarchitectonic field.
The somatotopic organization of the motor areas of the medial wall was originally studied in nonhuman primates by observing movements evoked by intracortical microstimulation [Luppino et al., 1991; Mitz and Wise, 1987], or by comparing the distribution of labeled neurons after tracer injections into distinct segments of the spinal cord [He et al., 1995]. Intracortical stimulation studies found a rostrocaudal progression of orofacial, forelimb, and hindlimb movement representations within the SMA; distinct forelimb and hindlimb motor areas have also been identified in the CMAd [He et al., 1995; Luppino et al., 1991] and in the CMAv [He et al., 1995]. In humans, few studies have used electrical stimulation of the cortex (e.g., Fried et al., 1991; Lim et al., 1994; Yazawa et al., 2000; for a review Allison et al., 1996]: these studies are clearly limited to those patients needing implantation of subdural electrodes for clinical reasons—assessing or treating drug‐resistant epilepsy. Their results confirmed a somatotopic organization of the SMA with the lower extremities represented caudally, the head and face rostrally, and the upper extremities between these two regions; by contrast, pre‐SMA does not appear to have a somatotopic organization. A surgical study correlated the clinical symptoms observed after SMA removal with the extent of the resection [Fontaine et al., 2002], and found the location of the motor deficit to correspond to SMA somatotopy. Neuroimaging techniques, being less or not invasive, can be used more extensively. Some positron emission tomography (PET) studies have suggested that there is somatotopy in the SMA [Colebatch et al., 1991; Grafton et al., 1993] and in the CMA [Grafton et al., 1993], with index finger responses dorsal to shoulder responses. However, other PET experiments have been unable to map spatially distinct regions of activation within these regions [Matelli et al., 1993], and the results of a meta‐analysis of human PET studies [Picard and Strick, 1996] were not so clear‐cut, showing partial overlap of arm and hand representations within both the SMA and the CMA.
Abbreviations.
- BOLD
blood oxygenation level dependent
- CMA
Cingulate motor areas
- FC
functional connectivity
- GS
global signal
- LFBF
low‐frequency BOLD fluctuations
- M1
primary motor area
- rms
root mean square
- ROI
region of interest
- rsFC
resting state functional connectivity
- rs‐fMRI
resting state functional magnetic resonance imaging
- SD
standard deviation
- SMA
Supplementary motor area
- WM
white matter
Functional magnetic resonance imaging (fMRI) motor paradigms have been used to explore the somatotopic organization of the medial wall [Chainay et al., 2004; Mayer et al., 2001; Rijntjes et al., 1999]; the latter study confirmed the rostral‐caudal organization of the motor areas of the medial wall found in previous human and nonhuman primate studies, but contradicted the dorso–ventral organization found in nonhuman cortical stimulation studies. With a different perspective, Rijntjes et al. suggested that somatotopy in secondary structures in human motor system can be defined functionally and not on the basis of anatomical representation. An alternative novel approach in fMRI studies considers the low frequency oscillations (<0.1 Hz) of the BOLD signal in the resting state. As such oscillations show a high level of coherence between multiple anatomically separate brain regions, they are assumed to reflect functional connections between areas [Fox and Raichle, 2007; Greicius et al., 2003; Van Dijk et al., 2010]. These correlating resting state patterns have consistently been found between regions of well‐known functional networks, such as the motor, visual and auditory networks (e.g. Damoiseaux et al., 2006; De Luca et al., 2006; van de Ven et al., 2004].
The resting state functional connectivity (rsFC) method can be efficiently applied to explore the somatotopy of the motor structures of the medial wall. The presence of anatomical and functional connections between M1 and the premotor medial areas has been demonstrated in both nonhuman primate studies (e.g., He et al., 1995; Morecraft and Van Hoesen, 1992; for a review see Dum and Strick, 2002] and human studies using electrical stimulation (e.g., Matsumoto et al., 2007] and combinations of different techniques (for some good examples see [Johansen‐Berg et al., 2004], combining diffusion tensor imaging and fMRI; [Fox et al., 1997] and [Siebner et al., 2000] both combining transcranial magnetic stimulation and PET). Functional connectivity (FC) has been used very recently to parcellate SMA and pre‐SMA, based on the similarity of their connection to the whole brain, as reflected by correlation during resting state [Kim et al., 2009], as well as to explore the correlations of rostral and caudal cingulate motor areas with the rest of the brain [Habas, 2010]. In this work, we used resting state functional connectivity in an alternative fashion: starting from the well‐known topography of the primary motor cortex [Penfield and Boldrey, 1937; Penfield and Rasmussen, 1950], we explored the functional connections between each somatotopic subregion of M1 and the premotor areas of the medial wall. A similar methodology was recently used to investigate the interhemispheric functional connections of different subregions of the primary motor cortex [van den Heuvel and Hulshoff Pol, 2009]. In particular, we segmented the M1 of each participant into nine ROIs, from the foot representation area to the tongue area, and we extracted the mean time course from each ROI. We then correlated this time course with all the voxels of the brain's medial wall and represented the results in 2D and 3D fashion.
In sum, the aim of the work is to shed light on the somatotopy of the motor areas of the medial wall using this novel technique. Indeed, so far data on the dorsoventral organization coming from nonhuman cortical stimulation studies and those obtained through neuroimaging techniques are contradictory. As far as the rostrocaudal organization is concerned, it has been found in both human and nonhuman primate studies but traditional neuroimaging experiments have been limited to the investigation of a few somatic regions at a time; instead, the approach we use in this work allows us to explore the somatotopy of all body parts, as it does not require the performance of any task. Thus, we intend to demonstrate the rostrocaudal sequence of face, hand, and foot in the motor areas of the medial wall, as well as the dorsoventral organization found in animal studies.
Moreover, to further validate our data, we performed three supplementary experiments, i.e., we compared the results of the this study with:
-
i
Traditional task‐related activations and (ii) FC during a motor task. To these aims, we analyzed data acquired during a previous study by our research group [Sacco et al., 2009] in which healthy subjects performed hand and foot motor tasks.
-
iii
The results of recent works mapping the motor representation of hand and foot: to this aim, we performed a meta‐analysis of 28 studies of hand and foot motor tasks using the tools provided by the Brainmap database [Laird et al., 2005].
MATERIALS AND METHODS
Resting State fMRI Study
Participants
Resting state fMRI study: sixteen right‐handed healthy nine women and seven men; age range = 23–75, mean age = 51 years), free of neurological or psychiatric disorders, not taking any form of medication known to alter brain activity, and with no history of drug or alcohol abuse, participated in the study. Written informed consent was obtained from each subject, in accordance with the Declaration of Helsinki; the study was approved by our institutional committee on ethical use of human subjects. The fMRI study was performed at the Ospedale Koelliker in Turin (Italy).
Task and image acquisition
Subjects were instructed simply to keep their eyes closed, think of nothing in particular, and not to fall asleep. After the scanning session, the participants were asked if they had fallen asleep during the scan in order to possibly exclude those who gave positive or doubtful answers.
Images were acquired on a 1.5 Tesla INTERA™ scanner (Philips Medical Systems) with a SENSE high‐field, high‐resolution (MRIDC) head coil optimized for functional imaging. Resting state functional T2* weighted images were acquired using echoplanar (EPI) sequences, with a repetition time (TR) of 2,000 ms, an echo time (TE) of 50 ms, and a 90° flip angle. The acquisition matrix was 64 × 64, with a 200 mm field of view (FoV). A total of 200 volumes were acquired, with each volume consisting of 19 axial slices, parallel to the anterior–posterior (AC‐PC) commissure; slice thickness was 4.5 mm with a 0.5 mm gap. To reach a steady‐state magnetization before acquiring the experimental data, two scans were added at the beginning of functional scanning: the data from these scans were discarded.
A set of three‐dimensional high‐resolution T1‐weighted structural images was acquired during a single session for each participant, using a Fast Field Echo (FFE) sequence, with a 25 ms TR, an ultra‐short TE and a 30° flip angle. The acquisition matrix was 256 × 256, the FoV was 256 mm. The set consisted of 160 contiguous sagittal images covering the whole brain. In‐plane resolution was 1 × 1 mm2 and slice thickness 1 mm (1 × 1 × 1 mm3 voxels).
Data analysis
BOLD imaging data were analyzed using the BrainVoyager QX 2.0 software (Brain Innovation, Maastricht, Holland). Functional images were preprocessed as follows to reduce artifacts [Miezin et al., 2000]: (i) slice scan time correction was performed using a sinc interpolation algorithm; (ii) 3D motion correction was applied: using a trilinear interpolation algorithm, all volumes were spatially aligned to the first volume by rigid body transformations and the roto‐translation information was saved for subsequent processing; (iii) spatial smoothing was performed using a Gaussian kernel of 8 mm FWHM; (iv) temporal filtering (linear trend removals) was used to reduce cardiac and respiratory noise, and a band pass filter of 0.01–0.08 Hz, used as described [Biswal et al., 1995; Greicius et al., 2003], showed that the 0.01–0.08 Hz frequency range had the greatest power in revealing the underlying connectivity [Achard et al., 2006; Biswal et al., 1995; Fransson, 2006; Greicius et al., 2009; Hagmann et al., 2008; Vincent et al., 2007].
Preprocessing was followed by a series of steps to facilitate accurate anatomical localization of brain activity and inter‐subject averaging. For each subject, the slice‐based functional scan was coregistered with the 3D high‐resolution structural scan, and the 3D structural data‐set was transformed into Talairach space [Talairach and Tournoux, 1988] by translating the cerebrum and rotating it in the ACPC plane to identify the borders of the cerebrum. Finally, using the anatomo‐functional coregistration matrix and the determined Talairach reference points, the functional time course of each subject was transformed into Talairach space, and the volume time course was created.
Selection of ROIs
We segmented each subject's gray matter (GM) and drew nine 5 × 5 × 5 mm3 bilateral cubic seed ROIs over the 3D renderized M1 surface of each subject in an equispaced fashion starting from the dorsomedial region of M1 (foot area) and ending in the ventrolateral region of M1 (tongue area) (See Fig. 1). The ROIs were carefully delineated to avoid the problem of multicollinearity due to their excessive proximity. To circumvent the same problem, the maximum number of nine bilateral ROIs was chosen following the empirical suggestions of Zhang et al. [ 2008]. A sample set of ROIs designed over the reference 3D template is given in Supporting Information Table S1.
Figure 1.
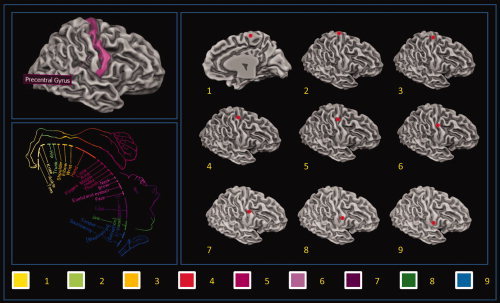
Example ROI used for the seed voxel correlation analysis. [Color figure can be viewed in the online issue, which is available at wileyonlinelibrary.com.]
Functional Connectivity Analysis
The first step in all FC analyses was to extract BOLD time courses from each ROI by averaging over voxels within each region. Several nuisance covariates were included in our analyses to control for the effects of physiological processes, such as fluctuations related to cardiac and respiratory cycles [Bandettini and Bullmore, 2008; Birn et al., 2008; Napadow et al., 2008] and motion. Specifically, we included nine additional covariates that modeled nuisance signals from white matter (WM), Global signal (GS) [Fox et al., 2009] and cerebrospinal fluid (CSF), as well as six motion parameters [Van Dijk et al., 2010].
All seed‐based predictors were z‐normalized; temporal autocorrelation correction [Woolrich et al., 2001] was used. Seed ROI‐driven FC maps were computed on a voxel‐wise basis for each previously selected region. The individual participant multiple regression analysis was carried out using the general linear model (GLM) [Friston, 2007] and resulted in a t‐based map (SPMt) FDR corrected [Benjamini and Hochberg, 1995; Genovese et al., 2002] for multiple comparisons (q < 0.05, cluster threshold K > 10 voxels in the native resolution).
Group Statistical Map
To map the rostrocaudal and dorsoventral shift of each ROI‐related connected cluster we collected the coordinates of the center of mass of each subject's medial wall cluster and compared them using a separate one‐way ANOVA with Tukey's HSD post hoc test (coordinates value as the dependent and ROI as the factor of interest) for each axis.
Group images showed in Figure 2 and Supporting Information Figure S4 were obtained using a fixed‐effect group‐level analysis (FFX) using BrainVoyager QX 2.0. Corrections for multiple comparisons were performed using FDR correction [Benjamini and Hochberg, 1995; Genovese et al., 2002] (q < 0.05, cluster threshold K > 10 voxels in the native resolution); the resulting maps were then projected on a 2D representation of the brain using BrainVoyager QX. Movement was assessed by summing the deviations (three translations plus three rotations at a radius of 50 mm) used to compensate for head motion within fMRI. The result refers to the head movement root mean square (rms) mm averaged over subjects. Pearson's bivariate coefficient for movement and age was calculated with SPSS 13.
Figure 2.
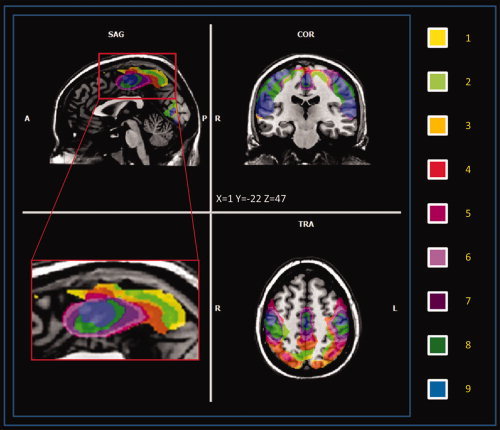
Clusters of LFBF connectivity of the medial wall, each color represents a different ROI‐related pattern (multi‐subject, FFX q < 0.05 FDR corrected, minimum voxel size K > 10 voxels in the native resolution). [Color figure can be viewed in the online issue, which is available at wileyonlinelibrary.com.]
To inspect possible age or gender effects on the rsFC maps, we conducted a correlational analysis between each subject‐specific ROI‐generated map, age and gender using the ANCOVA analysis tool implemented in BrainVoyager QX.
Reliability Test
To evaluate the spatial consistency of functional connectivity patterns across subjects, we computed the Split‐half reliability index: we calculated the reliability coefficient using the Spearman Brown [Brown, 1910; Spearman, 1910] formula,
 where the term r
h, in our case, is the spatial similarity of the maps obtained from two randomly selected, equally numerous subgroups. The term r
h is a measure of the intersection of two fuzzy sets, the Sørensen index [Sorensen, 1948], defined as:
where the term r
h, in our case, is the spatial similarity of the maps obtained from two randomly selected, equally numerous subgroups. The term r
h is a measure of the intersection of two fuzzy sets, the Sørensen index [Sorensen, 1948], defined as:
 , where A and B are the elements in sample A and B, respectively, and C is the number of elements shared by the two samples (this is equivalent to Dice metric).
Task‐Related Activations and FC During Motor Tasks
Subjects
Eight right‐handed and right‐footed healthy volunteers (four women and four men; age range = 20.8–34.8, mean age = 27 years) free of neurological or psychiatric disorders, not taking any form of medication known to alter brain activity, and with no history of drug or alcohol abuse, participated in the study. Written informed consent was obtained from each subject, in accordance with the Declaration of Helsinki; the study was approved by our Institutional Committee on Ethical Use of Human Subjects (see Supporting Information for methodological details).
Foot task.
In the active condition, subjects moved their right foot and left foot alternately. In the rest condition, they had to relax, without performing any movements. The movements they were required to perform were plantarflexion (downward) and dorsiflexion (upward), which implied extension and flexion of the ankle joint. Movements were performed at 0.5 Hz, as this rate is similar to that of ankle movements during walking.
Hand Task.
In the active condition, subjects moved their right hand and left hand alternately. In the rest condition, they had to relax, without performing any movements. The movement consisted of the flexion and extension of the four fingers (thumb excluded) conjointly. Movements were performed at 0.5 Hz. The stimuli were visual and represented two hands.
For both tasks, the amplitude and speed of movements were taught to participants before entering the scanner and then controlled by an observer looking into the scanner; all participants were very accurate in both amplitude and speed (the number of individual movements differed maximally by two movements at the end of the experiment for both the hand and the foot task).
BOLD activation
The multi‐subject design matrix was specified and each defined boxcar was convolved with a predefined hemodynamic response function (HRF) to account for the hemodynamic delay. A statistical analysis using the General Linear Model with separate study predictors was performed on the group to yield functional activation maps. A mask including Brodmann's areas 4, 5, 6, 7, 23, 24, 31 was created with an in‐house script (see Supporting Information) and used in the subsequent analysis. Fixed‐effect group‐level analyses were conducted using BrainVoyager QX 2.0. Corrections for multiple comparisons were performed using Bonferroni correction (P < 0.05, cluster threshold K > 10 voxels in the native resolution); the resulting maps were then projected on a 3D representation of the brain using the BrainVoyager QX cortical tool. See Supporting Information for a more detailed explanation.
Functional connectivity during the motor task
We measured functional connectivity using the seed voxel method for the foot task. For each subject, we selected two bilateral clusters of 5 × 5 × 5 mm3 contiguous seed voxels within the primary somatomotor cortex. The location of the ROI was chosen by selecting the peak voxel of the task‐related activity (GLM, boxcar function convolved with the two gamma hemodynamic functions, results Bonferroni corrected) in the precentral gyrus. The cluster seed included the voxel with the most task‐related activity in the foot task, and significant voxels surrounding it. Time courses at each voxel of the seed cluster were averaged. Next, the time course for the seed voxel cluster was correlated with every other voxel time course in the brain. Voxel time courses correlating significantly (P < 0.05 corrected for multiple comparisons using Bonferroni correction) were considered to be functionally connected. See Supporting Information for a more detailed explanation.
Fixed‐effect group‐level analyses were conducted using BrainVoyager QX 2.0. Corrections for multiple comparisons were performed using Bonferroni correction (P < 0.05, cluster threshold K > 10 voxels in the native resolution); the resulting maps were then projected on a 2D representation of the brain using the BrainVoyager QX cortical tool.
Literature Meta‐Analysis
Selection of studies
Studies for hand and foot motor execution were selected using the BrainMap Database [Laird et al., 2005]. BrainMap is a community accessible database which archives peaks coordinates from published neuroimaging studies, along with the corresponding metadata that summarize the experimental design. At the moment BrainMap contains 1,928 papers generated by 9,036 experiments expressing 81 paradigm classes; those papers indicates 72,592 local maxima of activations (locations).
Peer‐reviewed articles involving hand and foot motor execution published in English between 1990 and 2009 were selected from the search results of the Brainmap database. A total of 28 studies were included in the meta‐analysis. For further details see Supporting Information Table S2.
Activation likelihood estimation
To summarize the results of the database searches, we used the activation likelihood estimation (ALE). ALE analysis is a quantitative voxel‐based meta‐analysis method which can be used to estimate consistent activation across different imaging studies (Laird, 2005 #747). ALE maps of coactivations are derived on the basis of foci of interest, where multiple studies have reported statistically significant peaks activation. To limit the inter‐subject and inter‐laboratory variability typical of neuroimaging studies, we used an algorithm which estimates the spatial uncertainty of each focus taking into account the possible differences among studies. This algorithm was preferred to a prespecified FWHM as in the original ALE approach. The advantage of such an algorithm is that it comprises a method to calculate the above‐chance clustering between experiments (i.e., random effects analysis, RFX), rather than between foci [fixed effects analysis, FFX, (Eickhoff, 2009 #465)]. ALE maps were computed at an FDR‐corrected threshold of q < 0.05; minimum cluster dimension K > 100 mm3, visualized using Mricron (http://www.cabiatl.com/mricro/mricron) and BrainVoyager QX 2.1 (Goebel, 2006 #748).
RESULTS
Results of the Resting State fMRI Study
Movement was assessed by summing the deviations used to compensate for head motion within the MR scanner. The overall quantity of movement was rms 0.27 ± 0.09 mm (mean ± standard deviation) for the 16 subjects; there was no correlation between head movement and age (Pearson bivariate coefficient 0.11, P = 0.68). Hence, we excluded the influence of this confounding factor. We found no significant correlation between age or gender and rsFC maps, q < 0.05 FDR corrected cluster threshold K > 5 voxels in the native resolution [Benjamini and Hochberg, 1995; Genovese et al., 2002]. The reliability test indicated good‐to‐high reliability for our results (r sb > 0.69, mean 0.77, see Supporting Information Table S3).
No subjects were excluded on the basis of having reported falling asleep during the scanning session
The spatial resolution of our data did not permit us to consider each premotor area separately; our data are thus presented considering all the medial wall motor areas together. The results are represented over a 2D plane passing through the Talairach X = 0 coordinate. Areas of significant connectivity (q < 0.05 FDR corrected, cluster threshold K > 10 voxels) were found over Brodmann's areas 4, 5, 6, 7, 24, and 31. See Figure 2, Supporting Information Figure S4 for the multi‐subject maps and Supporting Information Table S4–S12 for the list of all the centers of gravity of all the single subjects (ROI 1 to 9). The medial wall areas found to be connected in some of our nine ROIs are the SMA, the precuneus, the paracentral lobule, CMAd, and CMAv. No significantly connected voxels were found in the CMAr and pre‐SMA territory.
The main results can be summarized as follows:
-
1
Moving from dorsal to ventral M1 regions (ROI 1 to 9) we observed a shift in the center of mass of the connected clusters in the medial wall from the caudal to more rostral sites. Figure 3, Table I, and Supporting Information Tables S13 and S14 show this shift to be significant from body/leg to arm areas while it failed to reach significance in the face/head region.
-
2
We observed a shift in the center of mass of the connected clusters on the z (dorsoventral) axis: body and leg motor regions are represented dorsally whereas arm and face areas are found more ventrally. See Figure 4, Table I and Supporting Information Tables S15 and S16.
-
3
The average volume of the connected clusters tend to decrease from the dorsal to ventral sites as shown in Supporting Information Figure S5
-
4
Some ROIs, such as 5 (located over the finger area), 6‐7‐8 (located over the face area) show two activation peaks, both located close to the ventral border of BA 6, one dorsal corresponding to the SMA, and one ventral, corresponding to the CMAd. The remaining ROIs show the dorsal (SMA) activation peak only. Supporting Information Figure S6 and Tables S17 and S18 show the distribution of the ROIs with one and two peaks of activation.
Figure 3.
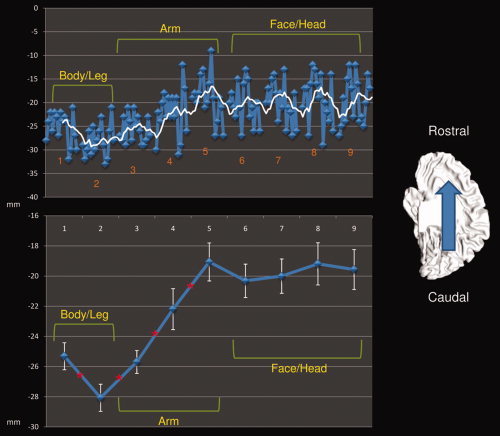
Center of mass rostrocaudal shift of each ROI‐related connected cluster. Upper panel shows the shift over the Y axis of each subject's center of mass (blue line) and the moving mean (white line, mean of 5 consecutive points). Lower panel shows the shift over the Y axis of the mean center of mass (blue line) and the confidence level (white error bar). * Significant differences between two adjacent ROI (P < 0.05). [Color figure can be viewed in the online issue, which is available at wileyonlinelibrary.com.]
Table I.
Mean center of mass and volume of the medial wall areas correlated to each seed (Mean of each single‐subject center of mass, q < 0.05 FDR corrected, cluster threshold K > 10 voxels in the native resolution)
| ROI | Center of gravity (TAL) | Volume (mm3) | ||
|---|---|---|---|---|
| X | Y | Z | ||
| 1 | 0 | −25.3 | 58 | 6,697 |
| 2 | 0 | −28 | 58.4 | 4,505 |
| 3 | 0 | −25.6 | 58 | 4,334 |
| 4 | 0 | −22.1 | 55.3 | 4,873 |
| 5 | 0 | −19 | 54.8 | 5,224 |
| 6 | 0 | −20.3 | 54.9 | 4,460 |
| 7 | 0 | −20 | 55 | 3,189 |
| 8 | 0 | −19.1 | 56.5 | 1,509 |
| 9 | 0 | −19.5 | 55.6 | 655 |
Figure 4.
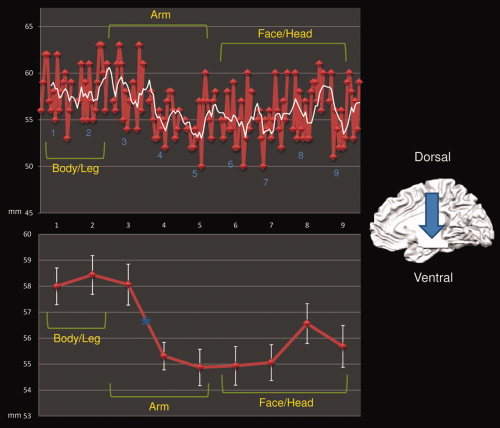
Center of mass dorsoventral shift of each ROI‐related connected cluster. Upper panel shows the shift over the Z axis of each subject's center of mass (red line) and the moving mean (white line, mean of 5 consecutive points). Lower panel shows the shift over the Z axis of the mean center of mass (red line) and the confidence level (white error bar). Asterisks show significant shifts in the post hoc ANOVA comparison. [Color figure can be viewed in the online issue, which is available at wileyonlinelibrary.com.]
Results of the Somatotopic Analysis of the motor paradigm
Both task‐related motor activations and FC during motor tasks performed on eight healthy subjects (multi‐subject FFX, P < 0.05 Bonferroni corrected, cluster threshold K > 10 voxels; see Supporting Information material for methodological details) confirmed the results of the rs‐fMRI study (see above) and those of the meta‐analysis (see below): the motor representation of the hand was found rostrally and ventrally to the foot area (See Fig. 5 and Tables II and III and Supporting Information Table S19.), the volume of the foot area was higher than that of the hand area.
Figure 5.
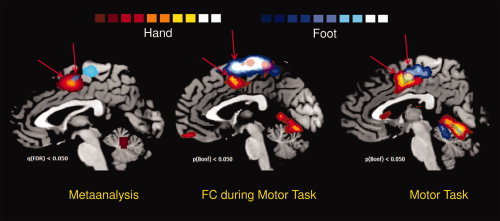
Results of meta‐analysis, FC during motor task and task‐related activations. Left panel shows the ALE results of the meta‐analysis of 28 papers regarding hand and foot motor tasks. Blue clusters: foot activations, red clusters: hand activations (q < 0.05 FDR corrected, K > 100 mm3, 5000 iterations). Center panel shows the FC during hand and foot motor task. Blue clusters: foot connectivity, red clusters: hand connectivity (multi‐subject, FFX q < 0.05 Bonferroni corrected, minimum voxel size K > 10 voxels in the native resolution). Right panel shows the activations of hand and foot motor tasks. Blue clusters: foot activations, red clusters: hand activations (multi‐subject, FFX q < 0.05 Bonferroni corrected, minimum voxel size K > 10 voxels in the native resolution). Arrows are aimed to indicate the supplementary activation of each foot/hand clusters. [Color figure can be viewed in the online issue, which is available at wileyonlinelibrary.com.]
Table II.
Center of mass and volume of the medial wall hand and foot task‐related activations and FC during motor task (multi‐subject, FFX q < 0.05 Bonferroni corrected, cluster threshold K > 10 voxels in the native resolution)
| Center of gravity (TAL) | Volume (mm3) | |||
|---|---|---|---|---|
| X | Y | Z | ||
| Hand motor activation | 0 | −3 | 45 | 7,720 |
| Foot motor activation | 0 | −16 | 53 | 82,291 |
| Hand FC motor task | 0 | −4 | 44 | 4,221 |
| Foot FC motor task | 0 | −18 | 60 | 8,545 |
Table III.
Center of mass and volume of the medial wall hand and foot clusters derived from a meta‐analysis of the recent literature (Activation likelihood estimation; 5,000 iterations, q < 0.05 FDR corrected, cluster threshold K > 100 mm3. Source: Brainmap. Conversion from MNI coordinates performed with the Nonlinear Yale MNI to Talairach conversion algorithm)
| Weighted Center (TAL) | Volume (mm3) | |||
|---|---|---|---|---|
| X | Y | Z | ||
| Hand | 0 | −2 | 51 | 11,542 |
| Foot | 0 | −4 | 53 | 1,587 |
Using the results of the task‐related motor activations as a localizer to identify the hand and foot motor representation over the primary motor area, we found a good agreement with the ROIs we selected in the resting state fMRI study. Indeed the foot representation was found in correspondence of ROI 1 and the hand representation in correspondence of ROI 4 and 5.
Results of the Meta‐Analysis
The ALE meta‐analysis of hand and foot movement tasks with 5000 iterations, q < 0.05 FDR corrected [Benjamini and Hochberg, 1995; Genovese et al., 2002], cluster threshold K > 100 mm3, revealed that the center of mass of the hand ALE cluster is located rostrally and ventrally to the foot cluster (See Fig. 5 and Supporting Information Fig. S19). No information about the volume of the ALE‐generated cluster can be inferred because the hand ALE estimates are generated from a much higher number of foci with respect to those of the foot. Indeed, this method is inherently sensitive to the number of data points sampled within a given volume: when the number of foci increases, more voxels become significant, and the overall volume increases [Mayka et al., 2006].
DISCUSSION
The rs‐fMRI study we conducted provided a more complete picture of the somatotopy of the medial wall motor areas with respect to previous neuroimaging studies. Indeed, traditional neuroimaging experiments using PET or fMRI tasks were limited to the investigation of a few somatic regions at a time (e.g., differentiating within‐limb somatic regions such as in Colebatch et al., 1991, and in Grafton et al., 1993, or comparing upper vs. lower limb specific movements such as in Mayer et al., 2001]; by contrast, our rs‐fMRI experiment allowed us to explore the somatotopy of all body parts, as it did not require the performance of any task. More specifically, the rs‐fMRI study showed a rostrocaudal gradient of connectivity in which the more we move from cranial to caudal body representation areas in the M1, the more the corresponding connected area in the medial wall is shifted rostrocaudally, confirming the somatotopic schema found in the SMA of both nonhuman and human subjects through intracortical stimulation techniques (see introduction), i.e., the rostrocaudal sequence of face, hand, and foot representations. We found this shifting to be significant from body/leg to arm areas, while it failed to reach significance in the face/head region.
Our rs‐fMRI study also showed a shift in the center of mass of the connected clusters along the dorsoventral (z) axis: body and leg motor regions of M1 are connected to more dorsal regions of the medial wall, while hand and face areas are connected to more ventral medial regions. This result was previously described by Luppino et al. (for a review see Luppino et al., 1991] and Rizzolatti et al. [ 1998]: in monkeys, the cingulate motor zone demonstrates a forelimb representation located on the ventral bank of the cingulate sulcus and a hindlimb representation located on the rostral bank. This finding is further supported by both the somatotopic analysis of our previous data and by the meta‐analysis study we conducted. As we previously noted, a recent fMRI study failed to find such a dorsoventral organization in the CMA [Rijntjes et al., 1999]. However, the work of Rijntjes et al. investigated a typical hand movement (signing) that subjects were asked to perform either with their hand or with their foot. Although they found overlapping areas of activation for the two tasks in the secondary sensorimotor cortex—corresponding to the hand anatomical representation—these possibly represent functional areas of a highly trained movement of the dominant hand: such functional representations have been probably coded in neuronal assemblies that have become part of the anatomical representation of the limb with which it is usually performed. Differently, our fMRI study used simple, non over‐learned movements that directly addressed the somatotopic issue.
Besides, the volume of the connected clusters in the medial wall tends to decrease from the dorsal to ventral sites: M1 ventral sites, corresponding to the more cranial body representation areas (face and head) show smaller areas of connectivity, while dorsal sites (hand, foot) show bigger connected clusters. This may suggest a “core and surround” structure, where medial wall areas corresponding to head and face representation constitute the “core,” progressively spreading while moving to more caudal body representation areas such as arms and legs‐feet. A similar kind of structure was previously described in other areas of somatosensory cortices by Cipolloni and Pandya [ 1999] and seems to reflect some kind of structural connectivity. An alternative explanation could be related to distal vs. proximal body representation areas. Indeed, it has been found that, in each motor area, the size of the distal representation is comparable to or larger than the size of the proximal representation [He et al., 1995; Strick et al., 1998]. Our finding is in line with such previous data. However, it has to be noted that rsFC tends to decrease as the distance between the seed ROI and the target region increases, and indeed the more we move from foot representation areas to face areas, the greater the distance between the seed ROI and the medial wall. Thus, it is essential to interpret this finding with caution.
Finally, some ROIs, such as 5 (located over the finger area), 6‐7‐8 (located over the face area) show two activation peaks, both located close to the ventral border of BA 6, one dorsal corresponding to the SMA [according to the boundaries defined by Mayka et al. [ 2006]], and one ventral, corresponding to the CMAd. The remaining ROIs show only the dorsal (SMA) activation peak. We speculated that this strong connectivity between the M1 face area and CMA may be explained by postulating the ventral part of M1 (face area) and CMA to be part of the same circuit, working together with the lateral part of the facial nucleus, to provide the lower face motor innervation [Morecraft et al., 2004]. Indeed, studies in nonhuman primates have demonstrated that the frontal and cingulate facial areas are selectively and reciprocally interconnected at the cortical level [Morecraft and Van Hoesen, 1992; Morecraft et al., 1996, 2001; Muakkassa and Strick, 1979; Tokuno et al., 1997].
The results of the analysis of our previous motor‐related data and those of the meta‐analysis were concordant in defining the spatial positions of the upper limb (hand) and lower limb (foot) activations; moreover, they all showed the volume of activation to be bigger for hand rather than foot movement. In the results of the FC analysis of our previous data, as well as in those of the present rs‐fMRI study, the center of mass of the foot representation in the medial wall was located more dorsally with respect to the results of the meta‐analysis. This can be explained by the fact that the ROI that generates the lower limb (foot) connectivity is located in the medial wall, very close to the area of M1 foot representation thus generating a unique big cluster comprising both areas.
As far as the connectivity between M1 and the medial wall areas is concerned, taking together the results of the present rs‐fMRI study, those of the traditional BOLD and FC analyses of our previous data, and those of the meta‐analysis, we confirmed the presence of a relationship between areas of M1 known to carry a specific body representation and distinct areas of the medial wall: along the rostrocaudal axis, anatomically homologous areas of lateral motor cortices and medial motor cortices are observed to be connected with each other. Similarly, dorsoventral to rostrocaudal axis correlation was found between lateral to medial motor areas. No significantly connected voxels were found in the CMAr and pre‐SMA territory: this is concordant with previous studies claiming that the pre‐SMA is not connected with M1 [Luppino et al., 1993].
To sum up, the main findings of the present research demonstrate a specific organization of the medial wall motor areas, with the upper limb representation placed more rostrally and ventrally than that of the lower limb. They substantiate the hypothesis that in humans the medial wall motor representations of the body are located in a somatotopic fashion following two different gradients: cranial body areas are located rostrally and ventrally while caudal body areas are located more caudally and dorsally. Besides, we further validated the utilization of the rsFC as a helpful tool to map the somatotopy of brain motor areas.
Although clusters of connectivity and task‐related activities allow us to identify a rough somatotopic organization in both SMA and CMA, our results also show a large overlap in the somatotopic organization. This finding supports the hypothesis of a dynamic organization of medial wall motor areas, which suggests high functional plasticity; functional plasticity is necessary to support the role of SMA in planning multiple movements ahead (Tanji, 1994 #761) in motor learning, but also in the regulation of motor performance, as suggested by the activity of SMA neurons related to adaptation of movements to a new dynamic environments (Padoa‐Schioppa, 2004 #762). These considerations suggest that medial wall motor areas constitute the intersection of anatomical and functional representations of movements [Rijntjes et al., 1999].The limit of our study resides in the relatively low resolution of our data. In fact, the spatial resolution of our data did not permit us to consider each premotor area separately, thus being unable to discriminate between SMA and CMA somatotopy. Different somatotopic images of the body have been described in nonhuman primates in both SMA, pre‐SMA, and CMA; future research using high‐resolution techniques is needed to disentangle the specific somatotopy of these premotor areas in humans.
Methodological Considerations
-
i
In our rs‐fMRI study, the sample was heterogeneous for age. Some studies have investigated functional connectivity in different age groups and found it to increase from childhood to adulthood [Fair et al., 2008: samples of 7–9‐years‐old children vs. adults) and decrease in elderly people [Damoiseaux et al., 2008: over 70‐years‐old subjects). Moreover, from adolescence to adulthood, effective connectivity between different networks seems to decrease while that within the same network seems to increase [Stevens et al., 2009: 12–30‐years‐old subjects). Although large, our sample did not include subjects of any age group where connectivity changes have been demonstrated, such as children, adolescents or elderly people. Furthermore, the results of our rs‐fMRI study are comparable to those obtained with the motor paradigm (data collected in our previous experiment), where there was a different, and more restricted, age distribution. Finally, at a behavioral level, we found no correlation between age and head movements while in the scanner. For all these reasons, we believe our findings are unlikely to be biased by the heterogeneity of age of our subjects.
-
ii
While physiological noise has been shown [Birn et al., 2008] to be correlated with rsFC patterns, the regression of nuisance correlations that can be estimated from the data (via white‐matter, ventricular, and whole‐brain signals) are sufficient to reduce artifacts associated with respiration and other sources of spurious noise [Van Dijk et al., 2010]. Indeed it has recently been shown that sophisticated statistical correction of both respiratory and heart rate correction resulted in only minor changes in correlations among default mode network regions [van Buuren et al., 2009].
-
iii
Given the variable geometry of the clusters of connectivity found in the medial wall, instead of the peak activation, we considered the center of mass as a better reference, more properly capturing such complex geometry.
-
iv
Although intersubject variance has been considered in our primary rsFC analysis—aimed at discovering the presence of rostrocaudal and dorsoventral shifts—in all the confirmatory analysis we used a fixed effect analysis due to the limited number of subjects. Similarly, the ALE metaanalysis performed by GingerAle 1.0 can be seen as a fixed effect analyses. Nevertheless, the high reproducibility of our results (see the split‐half reliability—Supporting Information Table S3) enable us to rule out the possibility that the observed patterns derived merely from random fluctuations, or were due to unintentional tasks performed by single subjects. In addition, the results of the three types of investigations performed in the present paper are all congruent with each other, and in agreement with anatomical and functional data obtained in nonhumans as well as human primates.
Supporting information
Additional Supporting Information may be found in the online version of this article.
Supporting Information 1
Supporting Information 2
Acknowledgements
The authors wish to thank all the subjects who participated in this study.
REFERENCES
- Achard S, Salvador R, Whitcher B, Suckling J, Bullmore E ( 2006): A resilient, low‐frequency, small‐world human brain functional network with highly connected association cortical hubs. J Neurosci 26: 63–72. [DOI] [PMC free article] [PubMed] [Google Scholar]
- Allison T, McCarthy G, Luby M, Puce A, Spencer DD ( 1996): Localization of functional regions of human mesial cortex by somatosensory evoked potential recording and by cortical stimulation. Electroencephalogr Clin Neurophysiol 100: 126–140. [DOI] [PubMed] [Google Scholar]
- Bandettini PA, Bullmore E ( 2008): Endogenous oscillations and networks in functional magnetic resonance imaging. Hum Brain Mapp 29: 737–739. [DOI] [PMC free article] [PubMed] [Google Scholar]
- Benjamini Y, Hochberg Y ( 1995): Controlling the false discovery rate: A practical and powerful approach to multiple testing. J Roy Stat Soc Ser B 57: 289–300. [Google Scholar]
- Birn RM, Murphy K, Bandettini PA ( 2008): The effect of respiration variations on independent component analysis results of resting state functional connectivity. Hum Brain Mapp 29: 740–750. [DOI] [PMC free article] [PubMed] [Google Scholar]
- Biswal B, Yetkin FZ, Haughton VM, Hyde JS ( 1995): Functional connectivity in the motor cortex of resting human brain using echo‐planar MRI. Magn Reson Med 34: 537–541. [DOI] [PubMed] [Google Scholar]
- Brown W ( 1910): Some experimental results in the correlation of mental abilities. Br J Psychol 3: 296–322. [Google Scholar]
- Chainay H, Krainik A, Tanguy ML, Gerardin E, Le Bihan D, Lehéricy S ( 2004): Foot, face and hand representation in the human supplementary motor area. Neuroreport 15: 765–769. [DOI] [PubMed] [Google Scholar]
- Cipolloni PB, Pandya DN ( 1999): Cortical connections of the frontoparietal opercular areas in the rhesus monkey. J Comp Neurol 403: 431–458. [PubMed] [Google Scholar]
- Colebatch JG, Deiber MP, Passingham RE, Friston KJ, Frackowiak RS ( 1991): Regional cerebral blood flow during voluntary arm and hand movements in human subjects. J Neurophysiol 65: 1392–1401. [DOI] [PubMed] [Google Scholar]
- Damoiseaux JS, Rombouts SA, Barkhof F, Scheltens P, Stam CJ, Smith SM, Beckmann CF ( 2006): Consistent resting‐state networks across healthy subjects. Proc Natl Acad Sci USA 103: 13848–13853. [DOI] [PMC free article] [PubMed] [Google Scholar]
- Damoiseaux JS, Beckmann CF, Arigita EJ, Barkhof F, Scheltens P, Stam CJ, Smith SM, Rombouts SA ( 2008): Reduced resting‐state brain activity in the “default network” in normal aging. Cereb Cortex 18: 1856–1864. [DOI] [PubMed] [Google Scholar]
- De Luca M, Beckmann CF, De Stefano N, Matthews PM, Smith SM ( 2006): fMRI resting state networks define distinct modes of long‐distance interactions in the human brain. Neuroimage 29: 1359–1367. [DOI] [PubMed] [Google Scholar]
- Dum RP, Strick PL ( 2002): Motor areas in the frontal lobe of the primate. Physiol Behav 77: 677–682. [DOI] [PubMed] [Google Scholar]
- Eickhoff SB, Laird AR, Grefkes C, Wang LE, Zilles K, Fox PT ( 2009): Coordinate‐based activation likelihood estimation meta‐analysis of neuroimaging data: a random‐effects approach based on empirical estimates of spatial uncertainty. Hum Brain Mapp. 30: 2907–2926. PubMed PMID: 19172646; PubMed Central PMCID: PMC2872071. [DOI] [PMC free article] [PubMed] [Google Scholar]
- Fair DA, Cohen AL, Dosenbach NU, Church JA, Miezin FM, Barch DM, Raichle ME, Petersen SE, Schlaggar BL ( 2008): The maturing architecture of the brain's default network. Proc Natl Acad Sci USA 105: 4028–4032. [DOI] [PMC free article] [PubMed] [Google Scholar]
- Fontaine D, Capelle L, Duffau H ( 2002): Somatotopy of the supplementary motor area: Evidence from correlation of the extent of surgical resection with the clinical patterns of deficit. Neurosurgery 50: 297–303. [DOI] [PubMed] [Google Scholar]
- Fox MD, Raichle ME ( 2007): Spontaneous fluctuations in brain activity observed with functional magnetic resonance imaging. Nat Rev Neurosci 8: 700–711. [DOI] [PubMed] [Google Scholar]
- Fox P, Ingham R, George MS, Mayberg H, Ingham J, Roby J, Martin C, Jerabek P ( 1997): Imaging human intra‐cerebral connectivity by PET during TMS. Neuroreport 8: 2787–2791. [DOI] [PubMed] [Google Scholar]
- Fox MD, Zhang D, Snyder AZ, Raichle ME ( 2009): The global signal and observed anticorrelated resting state brain networks. J Neurophysiol 101: 3270–3283. [DOI] [PMC free article] [PubMed] [Google Scholar]
- Fransson P ( 2006): How default is the default mode of brain function? Further evidence from intrinsic BOLD signal fluctuations. Neuropsychologia 44: 2836–2845. [DOI] [PubMed] [Google Scholar]
- Fried I, Katz A, McCarthy G, Sass KJ, Williamson P, Spencer SS, Spencer DD ( 1991): Functional organization of human supplementary motor cortex studied by electrical stimulation. J Neurosci 11: 3656–3666. [DOI] [PMC free article] [PubMed] [Google Scholar]
- Friston KJ. 2007. Statistical Parametric Mapping: The Analysis of Functional Brain Images. London: Academic; 647 p. [Google Scholar]
- Genovese CR, Lazar NA, Nichols T ( 2002): Thresholding of statistical maps in functional neuroimaging using the false discovery rate. Neuroimage 15: 870–878. [DOI] [PubMed] [Google Scholar]
- Goebel R, Esposito F, Formisano E ( 2006): Analysis of functional image analysis contest (FIAC) data with brainvoyager QX: From single‐subject to cortically aligned group general linear model analysis and self‐organizing group independent component analysis. Hum Brain Mapp. 27: 392–401. PubMed PMID: 16596654. [DOI] [PMC free article] [PubMed] [Google Scholar]
- Grafton ST, Woods RP, Mazziotta JC ( 1993): Within‐arm somatotopy in human motor areas determined by positron emission tomography imaging of cerebral blood flow. Exp Brain Res 95: 172–176. [DOI] [PubMed] [Google Scholar]
- Greicius MD, Krasnow B, Reiss AL, Menon V ( 2003): Functional connectivity in the resting brain: A network analysis of the default mode hypothesis. Proc Natl Acad Sci USA 100: 253–258. [DOI] [PMC free article] [PubMed] [Google Scholar]
- Greicius MD, Supekar K, Menon V, Dougherty RF ( 2009): Resting‐state functional connectivity reflects structural connectivity in the default mode network. Cereb Cortex 19: 72–78. [DOI] [PMC free article] [PubMed] [Google Scholar]
- Habas C ( 2010): Functional connectivity of the human rostral and caudal cingulate motor areas in the brain resting state at 3T. Neuroradiology 52: 47–59. [DOI] [PubMed] [Google Scholar]
- Hagmann P, Cammoun L, Gigandet X, Meuli R, Honey CJ, Wedeen VJ, Sporns O ( 2008): Mapping the structural core of human cerebral cortex. PLoS Biol 6: e159. [DOI] [PMC free article] [PubMed] [Google Scholar]
- He SQ, Dum RP, Strick PL ( 1995): Topographic organization of corticospinal projections from the frontal lobe: Motor areas on the medial surface of the hemisphere. J Neurosci 15: 3284–3306. [DOI] [PMC free article] [PubMed] [Google Scholar]
- Johansen‐Berg H, Behrens TE, Robson MD, Drobnjak I, Rushworth MF, Brady JM, Smith SM, Higham DJ, Matthews PM ( 2004): Changes in connectivity profiles define functionally distinct regions in human medial frontal cortex. Proc Natl Acad Sci USA 101: 13335–13340. [DOI] [PMC free article] [PubMed] [Google Scholar]
- Kim JH, Lee JM, Jo HJ, Kim SH, Lee JH, Kim ST, Seo SW, Cox RW, Na DL, Kim SI, Saad ZS ( 2010): Defining functional SMA and pre‐SMA subregions in human MFC using resting state fMRI: Functional connectivity‐based parcellation method. Neuroimage 49: 2375–2386. [DOI] [PMC free article] [PubMed] [Google Scholar]
- Laird AR, Lancaster JL, Fox PT ( 2005): BrainMap: the social evolution of a human brain mapping database. Neuroinformatics 3: 65–78. [DOI] [PubMed] [Google Scholar]
- Lim SH, Dinner DS, Pillay PK, Luders H, Morris HH, Klem G, Wyllie E, Awad IA ( 1994): Functional anatomy of the human supplementary sensorimotor area: Results of extraoperative electrical stimulation. Electroencephalogr Clin Neurophysiol 91: 179–193. [DOI] [PubMed] [Google Scholar]
- Luppino G, Matelli M, Camarda RM, Gallese V, Rizzolatti G ( 1991): Multiple representations of body movements in mesial area 6 and the adjacent cingulate cortex: An intracortical microstimulation study in the macaque monkey. J Comp Neurol 311: 463–482. [DOI] [PubMed] [Google Scholar]
- Luppino G, Matelli M, Camarda R, Rizzolatti G ( 1993): Corticocortical connections of area F3 (SMA‐proper) and area F6 (pre‐SMA) in the macaque monkey. J Comp Neurol 338: 114–140. [DOI] [PubMed] [Google Scholar]
- Matelli M, Rizzolatti G, Bettinardi V, Gilardi MC, Perani D, Rizzo G, Fazio F ( 1993): Activation of precentral and mesial motor areas during the execution of elementary proximal and distal arm movements: A PET study. Neuroreport 4: 1295–1298. [DOI] [PubMed] [Google Scholar]
- Matsumoto R, Nair DR, LaPresto E, Bingaman W, Shibasaki H, Luders HO ( 2007): Functional connectivity in human cortical motor system: A cortico‐cortical evoked potential study. Brain 130: 181–197. [DOI] [PubMed] [Google Scholar]
- Mayer AR, Zimbelman JL, Watanabe Y, Rao SM ( 2001): Somatotopic organization of the medial wall of the cerebral hemispheres: A 3 Tesla fMRI study. Neuroreport 12: 3811–3814. [DOI] [PubMed] [Google Scholar]
- Mayka MA, Corcos DM, Leurgans SE, Vaillancourt DE ( 2006): Three‐dimensional locations and boundaries of motor and premotor cortices as defined by functional brain imaging: A meta‐analysis. Neuroimage 31: 1453–1474. [DOI] [PMC free article] [PubMed] [Google Scholar]
- Miezin FM, Maccotta L, Ollinger JM, Petersen SE, Buckner RL ( 2000): Characterizing the hemodynamic response: Effects of presentation rate, sampling procedure, and the possibility of ordering brain activity based on relative timing. Neuroimage 11: 735–759. [DOI] [PubMed] [Google Scholar]
- Mitz AR, Wise SP ( 1987): The somatotopic organization of the supplementary motor area: Intracortical microstimulation mapping. J Neurosci 7: 1010–1021. [DOI] [PMC free article] [PubMed] [Google Scholar]
- Morecraft RJ, Van Hoesen GW ( 1992): Cingulate input to the primary and supplementary motor cortices in the rhesus monkey: Evidence for somatotopy in areas 24c and 23c. J Comp Neurol 322: 471–489. [DOI] [PubMed] [Google Scholar]
- Morecraft RJ, Schroeder CM, Keifer J ( 1996): Organization of face representation in the cingulate cortex of the rhesus monkey. Neuroreport 7: 1343–1348. [DOI] [PubMed] [Google Scholar]
- Morecraft RJ, Louie JL, Herrick JL, Stilwell‐Morecraft KS ( 2001): Cortical innervation of the facial nucleus in the non‐human primate: A new interpretation of the effects of stroke and related subtotal brain trauma on the muscles of facial expression. Brain 124: 176–208. [DOI] [PubMed] [Google Scholar]
- Morecraft RJ, Stilwell‐Morecraft KS, Rossing WR ( 2004): The motor cortex and facial expression: New insights from neuroscience. Neurologist 10: 235–249. [DOI] [PubMed] [Google Scholar]
- Muakkassa KF, Strick PL ( 1979): Frontal lobe inputs to primate motor cortex: Evidence for four somatotopically organized 'premotor' areas. Brain Res 177: 176–182. [DOI] [PubMed] [Google Scholar]
- Napadow V, Dhond R, Conti G, Makris N, Brown EN, Barbieri R ( 2008): Brain correlates of autonomic modulation: combining heart rate variability with fMRI. Neuroimage 42: 169–177. [DOI] [PMC free article] [PubMed] [Google Scholar]
- Padoa‐Schioppa C, Li CS, Bizzi E ( 2004): Neuronal activity in the supplementary motor area of monkeys adapting to a new dynamic environment. J Neurophysiol 91: 449–473. [DOI] [PubMed] [Google Scholar]
- Penfield W, Boldrey E ( 1937): Somatic motor and sensory representation in the cerebral cortex of man as studied by electrical stimulation. Brain 60: 389–443. [Google Scholar]
- Penfield W, Rasmussen T ( 1950): The Cerebral Cortex of Man. A Clinical Study of Localization of Function. New York: Macmillan; 248 p. [Google Scholar]
- Penfield W, Welch K ( 1951): The supplementary motor area of the cerebral cortex: A clinical and experimental study. AMA Arch Neurol Psychiatry 66: 289–317. [DOI] [PubMed] [Google Scholar]
- Picard N, Strick PL ( 1996): Motor areas of the medial wall: A review of their location and functional activation. Cereb Cortex 6: 342–353. [DOI] [PubMed] [Google Scholar]
- Rijntjes M, Dettmers C, Buchel C, Kiebel S, Frackowiak RS, Weiller C ( 1999): A blueprint for movement: functional and anatomical representations in the human motor system. J Neurosci 19: 8043–8048. [DOI] [PMC free article] [PubMed] [Google Scholar]
- Rizzolatti G, Luppino G, Matelli M ( 1996): The classic supplementary motor area is formed by two independent areas. Adv Neurol 70: 45–56. [PubMed] [Google Scholar]
- Rizzolatti G, Luppino G, Matelli M ( 1998): The organization of the cortical motor system: New concepts. Electroencephalogr Clin Neurophysiol 106: 283–296. [DOI] [PubMed] [Google Scholar]
- Sacco K, Cauda F, D'Agata F, Mate D, Duca S, Geminiani GC ( 2009): Reorganization and enhanced functional connectivity of motor areas in repetitive ankle movements after training in locomotor attention. Brain Research 1297: 124–134. [DOI] [PubMed] [Google Scholar]
- Siebner HR, Peller M, Willoch F, Minoshima S, Boecker H, Auer C, Drzezga A, Conrad B, Bartenstein P ( 2000): Lasting cortical activation after repetitive TMS of the motor cortex: A glucose metabolic study. Neurology 54: 956–963. [DOI] [PubMed] [Google Scholar]
- Sorensen T ( 1948): A method of establishing groups of equal amplitude in plant society based on similarity of species content. K Danske Vidensk Selsk 5: 1–34. [Google Scholar]
- Spearman C ( 1910): Correlation calculated from faulty data. Br J Psychol 3: 271–295. [Google Scholar]
- Stevens MC, Pearlson GD, Calhoun VD ( 2009): Changes in the interaction of resting‐state neural networks from adolescence to adulthood. Hum Brain Mapp 30: 2356–2366. [DOI] [PMC free article] [PubMed] [Google Scholar]
- Strick PL, Dum RP, Picard N ( 1998): Motor areas on the medial wall of the hemisphere. Novartis Found Symp 218: 64–75. [DOI] [PubMed] [Google Scholar]
- Talairach J, Tournoux P. 1988. Co‐Planar Stereotaxic Atlas of the Human Brain: 3‐Dimensional Proportional System—An Approach to Cerebral Imaging. Stuttgart: Thieme. [Google Scholar]
- Tanji J ( 1994): The supplementary motor area in the cerebral cortex. Neurosci Res 19: 251–268. [DOI] [PubMed] [Google Scholar]
- Tanji J ( 1996): New concepts of the supplementary motor area. Curr Opin Neurobiol 6: 782–787. [DOI] [PubMed] [Google Scholar]
- Tokuno H, Takada M, Nambu A, Inase M ( 1997): Reevaluation of ipsilateral corticocortical inputs to the orofacial region of the primary motor cortex in the macaque monkey. J Comp Neurol 389: 34–48. [DOI] [PubMed] [Google Scholar]
- van Buuren M, Gladwin TE, Zandbelt BB, van den Heuvel M, Ramsey NF, Kahn RS, Vink M. ( 2009): Cardiorespiratory effects on default‐mode network activity as measured with fMRI. Hum Brain Mapp 30: 3031–3042. [DOI] [PMC free article] [PubMed] [Google Scholar]
- van de Ven VG, Formisano E, Prvulovic D, Roeder CH, Linden DE ( 2004): Functional connectivity as revealed by spatial independent component analysis of fMRI measurements during rest. Hum Brain Mapp 22: 165–178. [DOI] [PMC free article] [PubMed] [Google Scholar]
- van den Heuvel MP, Hulshoff Pol HE ( 2010): Specific somatotopic organization of functional connections of the primary motor network during resting state. Hum Brain Mapp 31: 631–644. PubMed PMID: 19830684. [DOI] [PMC free article] [PubMed] [Google Scholar]
- Van Dijk KR, Hedden T, Venkataraman A, Evans KC, Lazar SW, Buckner RL ( 2010): Intrinsic functional connectivity as a tool for human connectomics: Theory, properties, and optimization. J Neurophysiol 103: 297–321. [DOI] [PMC free article] [PubMed] [Google Scholar]
- Vincent JL, Patel GH, Fox MD, Snyder AZ, Baker JT, Van Essen DC, Zempel JM, Snyder LH, Corbetta M, Raichle ME ( 2007): Intrinsic functional architecture in the anaesthetized monkey brain. Nature 447: 83–86. [DOI] [PubMed] [Google Scholar]
- Woolrich MW, Ripley BD, Brady M, Smith SM ( 2001): Temporal autocorrelation in univariate linear modeling of FMRI data. Neuroimage 14: 1370–1386. [DOI] [PubMed] [Google Scholar]
- Woolsey CN, Settlage PH, Meyer DR, Sencer W, Pinto Hamuy T, Travis AM ( 1952): Patterns of localization in precentral and “supplementary” motor areas and their relation to the concept of a premotor area. Res Publ Assoc Res Nerv Ment Dis 30: 238–264. [PubMed] [Google Scholar]
- Yazawa S, Ikeda A, Kunieda T, Ohara S, Mima T, Nagamine T, Taki W, Kimura J, Hori T, Shibasaki H ( 2000): Human presupplementary motor area is active before voluntary movement: Subdural recording of Bereitschaftspotential from medial frontal cortex. Exp Brain Res 131: 165–177. [DOI] [PubMed] [Google Scholar]
- Zhang D, Snyder AZ, Fox MD, Sansbury MW, Shimony JS, Raichle ME ( 2008): Intrinsic functional relations between human cerebral cortex and thalamus. J Neurophysiol 100: 1740–1748. [DOI] [PMC free article] [PubMed] [Google Scholar]
Associated Data
This section collects any data citations, data availability statements, or supplementary materials included in this article.
Supplementary Materials
Additional Supporting Information may be found in the online version of this article.
Supporting Information 1
Supporting Information 2