

Abstract
This study aimed to identify subunits of the basal ganglia and thalamus and to investigate the functional connectivity among these anatomically segregated subdivisions and the cerebral cortex in healthy subjects. For this purpose, we introduced multilevel independent component analysis (ICA) of the resting‐state functional magnetic resonance imaging (fMRI). After applying ICA to the whole brain gray matter, we applied second‐level ICA restrictively to the basal ganglia and the thalamus area to identify discrete functional subunits of those regions. As a result, the basal ganglia and the thalamus were parcelled into 31 functional subdivisions according to their temporal activity patterns. The extracted parcels showed functional network connectivity between hemispheres, between subdivisions of the basal ganglia and thalamus, and between the extracted subdivisions and cerebral functional components. Grossly, these findings correspond to cortico‐striato‐thalamo‐cortical circuits in the brain. This study also showed the utility of multilevel ICA of resting state fMRI in brain network research. Hum Brain Mapp, 2013. © 2012 Wiley Perodicals, Inc.
Keywords: basal ganglia, functional connectivity, independent component analysis, parcellation, thalamus
INTRODUCTION
The basal ganglia and the thalamus are subcortical structures with integral roles in both normal brain function and disease and are accordingly heterogeneous in structure [Morel, 1997]. The main components of the basal ganglia are the striatum (which includes the caudate nucleus and putamen), pallidum, substantia nigra, and subthalamic nucleus, each of which is subdivided further into several nuclei based on neuronal types and their patterns of connection. The thalamus also includes eight or nine subnuclei [Morel et al., 1997], which may be categorized according to their connectivity with other subcortical or cortical areas. The parcellation of subnuclei may yield clues to the pathology of Parkinson's disease, schizophrenia, and other neurological disorders; thus, the technique attracts research attention [Henderson et al., 2000; Kim et al., 2007; Kreczmanski et al., 2007].
Current techniques for morphometric neuroimaging enable whole brain parcellation using anatomical landmarks of the cerebral cortex [Collins et al., 1995; Fischl et al., 2004; Tzourio‐Mazoyer et al., 2002]. These techniques have limitations in identifying subnuclei in the basal ganglia and the thalamus, which inspired new parcellation techniques based on anatomical connectivity as defined by diffusion tensor imaging (DTI). Fiber tractography was shown to be useful especially in parcellation of thalamic nuclei based on thalamo‐cortical connectivity [Behrens et al., 2003a; Johansen‐Berg et al., 2005]. The probabilistic fiber tractography was also used to parcel the discrete subnuclei of the basal ganglia according to anatomical connectivity patterns [Draganski et al., 2008].
In parallel with these parcellation approaches based on the anatomical connectivity, functional connectivity‐based parcellation receives a wide attention because anatomical connectivity may not necessarily explain functional connectivity [Buckner et al., 2008; Honey et al., 2010; Van Dijk et al., 2010]. The functional parcellation techniques for the brain have been promoted by the researches on spontaneous functional network using resting‐state functional magnetic resonance imaging (rs‐fMRI), which does not depend on performance of specific tasks [Biswal et al., 1995, 1997; Greicius et al., 2003; Lowe et al., 1998; McGuire et al., 1996; Raichle and Snyder, 2007]. Functional approaches parcel brain regions according to the temporal correlation of activities between regions [Cohen et al., 2008]. Several parcellation techniques based on rs‐fMRI have been suggested to subdivide the cerebral cortex into functional sub‐units. These include hierarchical clustering [Achard et al., 2006], the Gaussian mixture model [Golland et al., 2008], graph theory [Shen et al., 2010], and independent component analysis (ICA) [Ji et al., 2009].
Despite many studies on the cortical parcellation, relatively few methods to subdivide subcortical brain regions have been proposed. Zhang et al. [ 2008] parcelled thalamic nuclei by the winner‐take‐all method, which labels each voxel in the thalamus with the most probable site of functional connectivity in the cortex. Barnes et al. [ 2010] generated discrete sub‐regions of the basal ganglia using the similarity patterns of functional connectivity defined by voxel‐wise correlations between the basal ganglia and whole brain. To identify basal ganglia voxels, they also used a network analysis based on graph theory that used the modularity optimization technique [Newman 2006].
In contrast to the univariate voxel‐by‐voxel approaches of Zhang and Barnes, ICA, a multivariate blind source separation method, has been used to decompose spontaneous brain activity into maximally independent functional components, each composed of anatomically segregated but functionally relevant regions. The functional components driven by ICA, however, depend on selection of the model order, i.e., the number of meaningful components. Abou‐Elseoud et al. [ 2010] reported that model orders of 70–80 separate subcortical signal sources sufficiently without over‐fitting the data. Indeed, Ystad et al. [ 2010] used ICA with a high order model (n = 72) to identify region‐specific functional components of subcortical nuclei. In that study, they identified only five subunits among the whole basal ganglia and thalamus, and they did not parcel the subnuclei in detail. For more detailed separation of subnuclei within the basal ganglia and thalamus, increasing model order may not be a solution because the increased model order may induce over‐fitting problems in other brain structures [Beckmann and Smith, 2004, 2005].
In this study, we introduced a multilevel ICA—initially proposed in the analysis of the microarray gene data [Chen et al., 2009]—of resting state fMRI, which applies ICAs consecutively to the whole brain and subcortical regions, to parcel subdivisions in the basal ganglia and thalamus. The aims of this study were to show (1) the advantages of multilevel ICA in identifying subdivisions of the basal ganglia and thalamus, (2) the detailed inter‐regional connectivity among subdivisions of the basal ganglia and thalamus, and (3) the validity of the proposed method, by determining the inter‐individual variability in the parcellation of subdivisions of basal ganglia and thalamus.
METHODS
Participants
This study followed the guidelines for use of human subjects established by the Institutional Review Board of Yonsei University School of Medicine. Twenty‐one healthy righted‐handed volunteers (10 male and 11 female, mean age = 21.14 ± 6.95 years) participated in this study. All participants were screened for past or present history of medical, neurological, and psychiatric illnesses according to self‐reports. Handedness was assessed with a Korean version of the Annett handedness questionnaire [Annett, 1970]. After we provided a complete description of the study, all participants gave their written informed consent.
Imaging Parameters
All scans were acquired using a Philips 3.0‐T scanner (Philips Intera Achieva, Philips Medical System; Best, The Netherlands) with a Sensitivity Encoding (SENSE) head coil (SENSE factor = 2). Functional scans based on echo‐planar imaging (EPI) consisted of 160 axial volumes with the following parameters: 80 × 80 acquisition matrix with 31 slices, field‐of‐view 220 × 210 × 140 mm3, 2.75 × 2.75 × 4.5 mm3 voxels, echo time 30 ms, repetition time 2,000 ms, and no slice gap. All subjects were asked to lie in the scanner with their eyes closed and to relax but not sleep. They were not given any task. For registration purposes, high‐resolution T 1‐weighted coronal MRI volumes were acquired using a fast spin echo (FSE) sequence with the following parameters: 256 × 256 image matrix with 182 slices, field‐of‐view 220 × 220 × 218 mm3, 0.859 × 0.859 × 1.2 mm3 voxels, echo time 4.6 ms, and repetition time 9.7 ms.
Preprocessing
All acquired images were preprocessed using the SPM8 software package (http://www.fil.ion.ucl.ac.uk/spm/software/spm8/). The preprocessing steps are (1) a slice‐timing correction; (2) 3D rigid‐body co‐registration to the first volume of each subject's session for head motion correction; (3) nonlinear spatial normalization into the standard Montreal Neurological Institute (MNI) space, and subsampling to 2 × 2 × 2 mm3 resulting in 79 × 95 × 69 isocubic voxels; (4) spatial smoothing with a Gaussian kernel of 8‐mm FWHM. The first 10 volumes in each subject's scan were excluded because of the T 1‐equilibrium magnetization effect. The data was analyzed at voxels within the whole intracranial space in regions empirically defined by SPM a priori maps as areas where at least one of the gray matter, white matter, or cerebrospinal fluid (CSF) probability was higher than 0.2 (Fig. 2b). This mask covers the whole brain, including cortical and subcortical gray matter, white matter, and CSF but excluding non‐brain regions and skull. The slight inclusion of white matter and CSF due to a lower threshold would raise no significant effect in the second‐level analysis, since the first‐level ICA may extract the component of these regions as artifacts (e.g., see IC46‐IC50 in Fig. 1).
Figure 2.
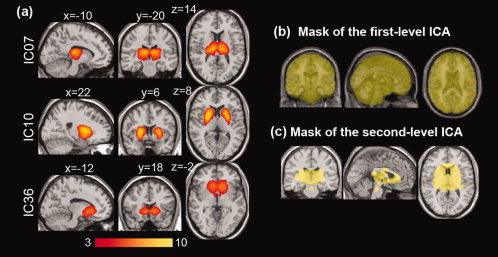
Three selected independent component (IC) maps of the basal ganglia and thalamus from the first‐level ICA and masks for the first‐ and second‐level ICA. The whole brain mask (b) for the first‐level ICA was defined with an area where at least one of the gray matter, white matter, or cerebrospinal fluid probability (from a priori maps in SPM8) was higher than 0.2. The subcortical regions from first‐level ICA (a) consisted of thalamus (Th), caudate nucleus (Ca), pallidum (Pa), and putamen (Pu). The final ROI for the second‐level ICA was determined as the union of the IC maps and the anatomical regions corresponding to the basal ganglia and thalamus in AAL map (c). [Color figure can be viewed in the online issue, which is available at wileyonlinelibrary.com.]
Figure 1.
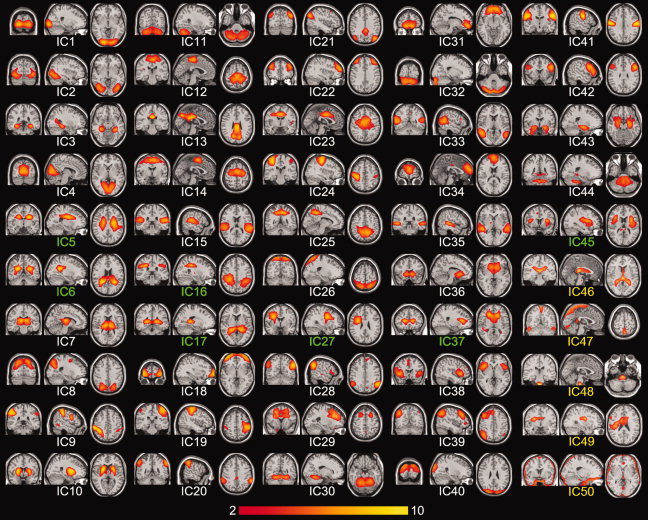
Independent component (IC) maps from the first‐level ICA. ICs containing white matter regions were represented by green color font (IC5, IC6, IC16, IC17, IC27, IC37, and IC45). We regarded IC46–50 (yellow) as the artifactural components from head motion, physiological noise, registration and segmentation error, and CSF fluctuations. [Color figure can be viewed in the online issue, which is available at wileyonlinelibrary.com.]
Each dataset was corrected by (1) removal of linear intensity trends; (2) normalization of within‐run intensity using Fisher's z‐transformation; (3) regression of the mean white matter signal and the mean CSF signal averaged over the respective regions where tissue probability of either white matter or CSF is higher than 0.5; and (4) a temporal band‐pass filtering (0.01 < f < 0.08 Hz).
First‐Level ICA of fMRI Data
Using GIFT software (http://icatb.sourceforge.net), we applied group ICA to the preprocessed fMRI scans to decompose the resting‐state data of the group into common spatially‐independent components. In this approach, the temporal redundancy of group fMRI data was reduced through two steps using a principal component analysis (PCA) before ICA [Calhoun et al., 2009].
At the subject level, we reduced the temporal dimension of the observed fMRI data matrix, Y i, using PCA, i.e., X i = Fi−1Yi where X i is the N c 1 × v reduced data matrix for subject i (where N c 1 is the number of first‐reduced dimensions for each subject, and v is the number of voxels), Fi−1 the N c 1 × t reducing matrix resulting from the subject's PCA decomposition (where t is the number of time points), and Y i the t × v observed fMRI data matrix. PCA has been used to reduce data dimension and thus to decrease computational load, because the size of fMRI dataset is typically large and the most of information usually exist in the lower dimensional subspace [Calhoun et al., 2009]. Reduced data from each subject were concatenated temporally at the group level, and PCA decomposition was applied again, i.e., X G = G−1YG = G−1[F1−1Y1 F2−1Y2 … FN−1YN]t where X G is the N c 2 × v reduced data matrix for all N subjects (where N c 2 is the number of second‐reduced dimensions for the group), G−1 the N c 2 × N·N c 1 reducing matrix obtained from the group's PCA decomposition, and Y G the N·N c 1 × v concatenated data matrix from each subject. According to ICA decomposition, we can express the reduced data for the group X G as X G = AS where A is the N c 2 × N c 2 mixing matrix, and S the N c 2 × v maps of independent spatial components.
In this study, independent components were estimated from the temporally reduced data matrix using the infomax approach [Bell and Sejnowski, 1995]. The number of components was determined to be sufficiently large (N c 1 = 30, N c 2 = 50) based on the minimum description length criteria [Li et al., 2007].
From the final 50 group components (N c 2 = 50), we excluded five artifactual components that were apparently associated with head motion, physiological noise, registration error or CSF fluctuations (Fig. 1). Some IC maps containing white matter regions were not excluded since they extended into the cortical regions. Finally, 45 anatomically relevant IC maps except for the distinct artifactual components were selected as the functional subunits for further analysis.
Second‐Level ICA for the Basal Ganglia and the Thalamus Subvolume
We applied a second‐level ICA to sub‐volume data from the basal ganglia and thalamus. To localize a sub‐volume in the subcortical area, we converted each IC spatial map value to z‐score to improve the normality and selected the components that overlapped sufficiently (>30%) with the basal ganglia or thalamus region defined in the automated anatomical labeling (AAL) map [Tzourio‐Mazoyer et al., 2002]. This referential subcortical region consisted of thalamus (Th), caudate nucleus (Ca), pallidum (Pa), and putamen (Pu; Fig. 2a).
Because these three IC maps did not completely cover the whole basal ganglia and thalamus, we used the union of the AAL subcortical mask and three IC maps of subcortical regions. The final ROI (v new) for the second‐level ICA was determined as the combination of the IC maps and the anatomical regions corresponding to the basal ganglia and thalamus components (BGT) as ROI (v new) = ROIfunc ∪ ROIanat = (ICBGT1 ∪ ICBGT1 ∪ … ∪ ICBGTn) ∪ (AALTh ∪ AALCa ∪ AALPa ∪ AALPu). Second‐level group ICA was applied to this sub‐volume region (Fig. 2c). The number of components was found to be the same as that of the first‐level (N c 2 = 50).
From these group components, we again excluded nonbasal ganglia and nonthalamic components using the above overlap strategy (<10%). Finally, the functional subunits of the basal ganglia and thalamus were selected from 31 anatomically relevant IC maps.
Generation of a Map of Subdivisions in Basal Ganglia and Thalamus
We assumed that measured blood oxygenation level‐dependent (BOLD) signals mixed in a linear manner with spatially independent components and the corresponding time series. Thus, the time series at a voxel v can be rewritten as x v = Σa n·s v ,n where x v is the N c 2 × 1 signal vector at a voxel v of X G; a n is the nth column of mixing matrix A whose size is N c 2 × 1; and s v ,n is the nth IC value at the voxel v of S. We defined Cv,n as the contribution of the nth IC to the measured data at a voxel v as Cv,n ≡ a n·s v ,n. We assigned each voxel v to the functional label L v corresponding to the IC with the maximum absolute contribution to the signal in the voxel v, i.e., L v = arg maxn(|x v·Cv,n|).
To generate the map of subdivisions, each voxel within the basal ganglia and thalamus was assigned the maximally contributed IC label—i.e., winner‐take‐all strategy. Theoretically, this parcellation technique is a type of the most widely used “winner‐take‐all” methods [e.g., Behrens et al., 2003a; Zhang et al., 2008]. The primary difference of the current method from the previous methods, however, is that the current method is a data‐driven analysis, which does not require any a priori and restricted target ROIs to define probability of connectivity. Anatomical correspondence of each parceled subdivisions was visually identified according to previous researches [Behrens et al., 2003a; Draganski et al., 2008; Leh et al., 2007; Niemann et al., 2000].
Functional Network Connectivity Among ICs of Subdivisions in Basal Ganglia and Thalamus
As an index of functional network connectivity among ICs, correlation coefficients (r) were calculated for the time‐series of all ICs of each individual. This functional network connectivity analysis was performed in previous studies [Andrews‐Hanna et al., 2007; Jafri et al., 2008]. The mixing matrix for ICs in the individual subject was calculated using a back‐projection method [Calhoun et al., 2009] formulated as Ãi = FiGiA where Ãi is the t × N c 2 matrix for ith subject whose column is the time‐series of each IC. We evaluated the functional connectivity between the functional ICs of the cortex from the first‐level ICA, and the ICs matching to the subdivisions of the basal ganglia and thalamus driven in the second‐level ICA. We also conducted functional connectivity analysis among ICs corresponding to subdivisions of the basal ganglia and thalamus derived in the second‐level ICA. After Fisher's z‐transformation of the correlation coefficient r, a one‐sample t‐test was applied. We considered the functional connectivity of ICs to be functionally relevant if the correlation was confirmed by a false discovery rate (FDR) q < 0.05.
Reproducibility Across Individual Parcellations
We evaluated the presence or absence of each subnucleus (i.e., ICs corresponding to the nucleus) at each voxel within the basal ganglia and thalamus at subject level, as in Draganski et al. [ 2008]. To do this, we compared individual parcellation maps with the group parcellation map. The number of subjects having a given combination of nuclei was counted as a consistency measure.
RESULTS
The Basal Ganglia and the Thalamus From the First‐Level ICA
Among 45 nonartifactual ICs, excluding five noise components from 50 ICs (Fig. 1), three components (IC7/10/36) corresponding to the basal ganglia and thalamus (threshold z > 3) had a relatively high overlap with the basal ganglia and thalamus regions as defined anatomically on the AAL map (Table I). Specifically, IC7 was associated with the bilateral thalamic area with almost full coverage of the thalamic region on the AAL map. IC10 was located in the whole basal ganglia area with its maximum value at the putamen. IC36 was centered at the caudate and extended over the pallidum and putamen (Fig. 2).
Table I.
Percentage of spatial overlap of selected ICs (z > 3) with basal ganglia regions on the AAL map
| IC | Thalamus | Caudate | Pallidum | Putamen | ||||
|---|---|---|---|---|---|---|---|---|
| Left | Right | Left | Right | Left | Right | Left | Right | |
| 7 | 99.64 | 99.90 | 17.78 | 17.40 | 30.72 | 10.71 | 11.69 | 8.93 |
| 10 | 25.09 | 26.58 | 52.18 | 72.74 | 74.74 | 97.86 | 95.34 | 98.21 |
| 36 | 0 | 0 | 57.38 | 57.24 | 53.92 | 35.71 | 40.04 | 31.58 |
Subdivisions in the Basal Ganglia and Thalamus From the Second‐Level ICA
Second‐level ICA with a subvolume gave a more precise subdivision of basal ganglia and thalamus. Using the volume defined by basal ganglia and thalamic regions derived from the first‐level ICA and the AAL map (see “Methods” section), the second‐level ICA identified 31 ICs corresponding to basal ganglia and thalamus, and 17 ICs for nonbasal ganglia and nonthalamus from 48 nonartifactural ICs (Fig. 3). The ICs with at least 10% overlap with the basal ganglia and thalamus regions in the AAL map were considered to be anatomically relevant regions.
Figure 3.
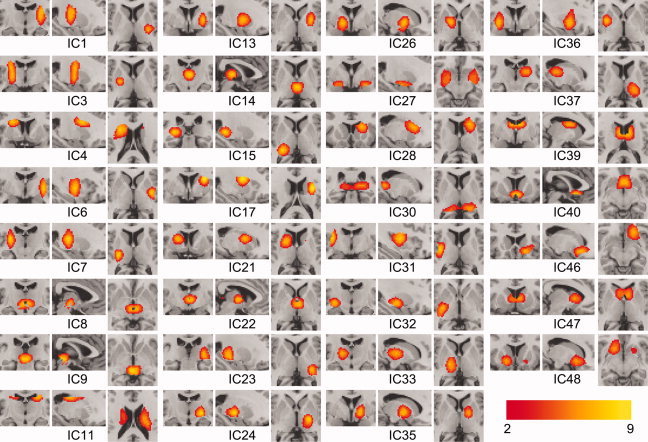
Independent component (IC) maps from the second‐level ICA. The nonbasal ganglia and nonthalamic ICs were presented in the Supporting Information Figure S1. [Color figure can be viewed in the online issue, which is available at wileyonlinelibrary.com.]
Subdivisions Parcellation Maps of the Basal Ganglia and Thalamus
Figure 4 shows the parcellation maps for subdivisions of the thalamus and basal ganglia derived from the second‐level ICA.
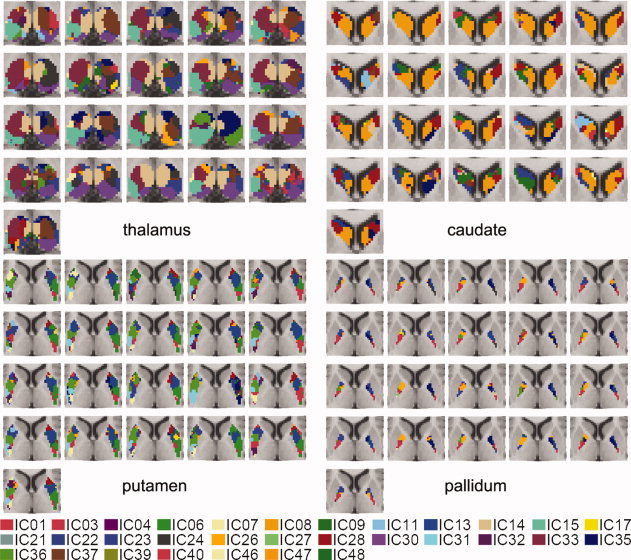
Figure 4.
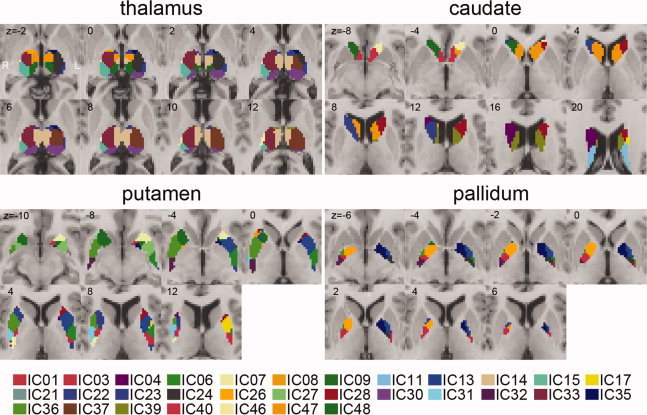
Functional segmentation map of thalamus, caudate, putamen, and pallidum using multilevel ICA. The volumes of subdivisions are IC1 (760 mm2), IC3 (1144 mm2), IC4 (1704 mm2), IC6 (1880 mm2), IC7 (656 mm2), IC8 (568 mm2), IC9 (712 mm2), IC11 (1760 mm2), IC13 (3672 mm2), IC14 (2912 mm2), IC15 (1232 mm2), IC17 (744 mm2), IC21 (2120 mm2), IC22 (472 mm2), IC23 (720 mm2), IC24 (1520 mm2), IC26 (1328 mm2), IC27 (584 mm2), IC28 (2768 mm2), IC30 (1888 mm2), IC31 (792 mm2), IC32 (1064 mm2), IC33 (3568 mm2), IC35 (1608 mm2), IC36 (3224 mm2), IC37 (3224 mm2), IC39 (2384 mm2), IC40 (1376 mm2), IC46 (1288 mm2), IC47 (3264 mm2), and IC48 (3136 mm2). [Color figure can be viewed in the online issue, which is available at wileyonlinelibrary.com.]
Thalamus
Thalamic parcellation revealed anatomically distinct nuclei in the thalamus. Ventral‐anterior (VA) and ventral‐lateral (VL), including ventral‐medial (VM) nuclei, were found in IC24/33/37 and IC15/23. Pulvinar (PU) and anterior (AN) nuclei were also found in IC30 and IC22. The medial‐dorsal (MD) nucleus was partitioned into three subregions—IC8 (anterior), IC14 (middle), and IC9 (posterior).
Caudate nucleus
The head of the caudate consisted of IC40 (bilateral), IC46 (left), and IC48 (right). A bilateral component (IC40) was located toward the medial side in the head of the caudate. The tail of the caudate was found in IC11. The body of the caudate comprised several distinct regions, i.e., IC47 (the major part of the body of caudate), IC39 (located more toward the posterior than IC47), IC28 (left), and IC4/21 (right).
Pallidum and Putamen
Even though the given IC maps did not clearly separate the pallidum and the putamen (i.e., some ICs covered both the pallidum and putamen as in Fig. 4), the rostral and caudal portions of these structures were distinguished relatively well. IC1/3/6/7/23/31/32 comprised the caudal portion, and IC13/17/26/27/28/35/36 the rostral part. IC13 and IC36 covered most portions of the pallidum and the putamen.
Functional Network Connectivity Within the Basal Ganglia and Thalamus Components
Among the 31 meaningful ICs of the basal ganglia and thalamus selected from the second‐level ICA, we found significant functional network connectivity; i.e., a significant correlation coefficient for the time‐series of these components (FDR q < 0.05; Fig. 5).
Figure 5.
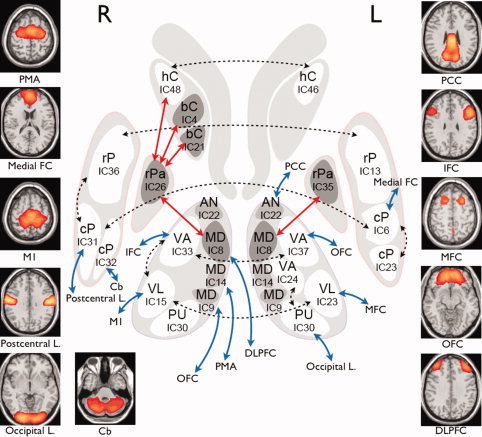
Functional interconnections between regions of basal ganglia subdivisions and the cerebral cortex. Dashed line represents the bilateral connectivity, and solid line represents the connection between subdivisions of the basal ganglia (red) and cortical areas (blue). Abbreviations: hC, head of caudate; bC, body of caudate; rPa, rostral part of pallidum; rP, rostral part of putamen; cP, caudal part of putamen; AN, anterior nucleus of thalamus; MD, medial dorsal nucleus of thalamus; VA, ventral anterior nucleus of thalamus; VL, ventral lateral nucleus of thalamus; PU, pulvinar of thalamus; IFC, inferior frontal cortex; PCC, posterior cingulate cortex; MFC, middle frontal cortex; OFC, orbito frontal cortex; M1, primary motor area; PMA, premotor area; FC, frontal cortex; L, lobe. [Color figure can be viewed in the online issue, which is available at wileyonlinelibrary.com.]
IC37 and IC33, corresponding to the left and right ventral‐anterior nuclei, had the highest functional connectivity (r = 0.35, P = 2.75 × 10⁻⁷). Although IC14/22/30 also identified bilateral thalamic regions, the greater part of each thalamus was partitioned into the left and right subregions (IC37/33). Likewise, the putamen (IC6/31: r = 0.30, P = 5.46 × 10⁻⁶ and IC13/36: r = 0.30, P = 4.33 × 10⁻⁶), the thalamus (IC23/15: r = 0.33, P = 1.13 × 10⁻⁶), and the caudate (IC46/48: r = 0.36, P = 2.53 × 10⁻⁶) regions had high inter‐hemispheric connectivity. In addition, IC6/23 (r = 0.40, P = 7.79 × 10⁻⁹) and IC31/36 (r = 0.37, P = 2.69 × 10⁻⁷) showed functional connectivity near the left and right posterior parts of the putamen, whereas IC6 and IC36 were located in the more anterior side. Significant functional network connectivity was found between the right ventro‐anterior (IC33) and ventro‐posterior (IC15) thalamus (r = 0.29, P = 2.06 × 10⁻⁶) and left ventral‐anterior (IC24) and pulvinar (IC30) thalamus (r = 0.20, P = 1.87 × 10⁻⁶). The medial‐dorsal (IC8) nucleus of the thalamus was correlated with regions of the bilateral pallidum (IC35/26, r > 0.16, P < 0.004). The right pallidum (IC26) was also functionally connected with the right caudate (IC4/21/48, r > 0.14, P < 0.003).
Functional Network Connectivity Between the Basal Ganglia, Thalamus, and Cerebral Cortex
Thalamo‐cortical functional network connectivity
The thalamic subdivisions driven at the second‐level ICA and the cortical regions driven at the first‐level ICA showed significant functional network connectivity. Specifically, the medial‐dorsal nuclei (IC8/9/14) of the thalamus were correlated with regions of the dorsolateral prefrontal (r = −0.19, P = 1.80 × 10⁻⁶), orbito‐frontal (r = −0.25, P = 1.96 × 10⁻⁶), and premotor/SMA (r = −0.16, P < 0.004) cortices. The ventral nuclei (VA/VL/VM: IC15/33/23/37) were functionally interconnected with the precentral cortex and the inferior‐, middle‐, and orbito‐frontal cortex. The anterior nuclei (AN: IC22) were interconnected with the posterior cingulate (Fig. 5). The pulvinar (IC30) of the thalamus was functionally connected with the occipital cortex (see Fig. 5).
Functional network connectivity between striatum and cortex
Time series in the nuclei (IC6/31/32) of the putamen were highly correlated with those of the medial‐frontal, postcentral cortex, and cerebellum (IC34/41/11 from the first ICA, respectively; FDR q < 0.0001; Fig. 5). However, no significant correlations were found between ICs in the caudate and cortex.
Reproducibility Across Individual Parcellations
Subdivisions of the basal ganglia and thalamus at the individual level were highly correlated with corresponding regions in the group parcellation map (Fig. 6). For example, in the thalamic parcellation, we detected MD and VA (or VL) nuclei bilaterally in all subjects. PU was found in 16 out of 21 (17 in the left hemisphere and 16 in the right hemisphere) subjects. Also, we found AN in 12 (15 in the left hemisphere and 12 in the right hemisphere) of 21 subjects. In the caudate parcellation, we found the bilateral and lateral head nuclei in 20 (21 in the left hemisphere and 20 in the right hemisphere) subjects, and the tail nuclei in 12 (17 in the left hemisphere and 12 in the right hemisphere) subjects. Most parts in the body of the caudate were found in 19 of 21 subjects.
Figure 6.
Individual parcellation maps of basal ganglia and thalamus for the complete group of 21 subjects. Color label is the same with Figure 4. [Color figure can be viewed in the online issue, which is available at wileyonlinelibrary.com.]
DISCUSSION
Using multilevel spatial ICA of resting‐state fMRI, we identified the subdivisions of the basal ganglia and thalamus as functionally connected structures. Small but independent subdivisions in the basal ganglia and thalamus, which the conventional ICA did not detect, were clearly identified. The parcellation schemes for these subdivisions were grossly consistent with those in previous anatomical studies of the basal ganglia and thalamus [Morel, 1997; Morel et al., 1997]. Furthermore, functional network analysis showed the association of subdivisions in the striatum and thalamus with the cortical network driven by multilevel IC.
Parcellation of the Thalamus and the Basal Ganglia
The parcellation of the thalamus and basal ganglia has been performed using DTI fiber tractography by a winner‐take‐all approach, i.e., labeling each voxel with the corresponding cortical area based on the highest anatomical connectivity with the voxel [Behrens et al., 2003a, b; Draganski et al., 2008; Johansen‐Berg et al., 2005]. Another winner‐take‐all approach for the subcortical parcellation is based on functional connectivity defined by rs‐fMRI. Zhang et al. [ 2008] assigned the cortical label with the highest functional connectivity to the voxel in the thalamus.
As a data‐driven approach, we assumed that several functional components may be linearly combined to generate BOLD signals at each voxel of the basal ganglia and the thalamus and that ICA could effectively separate these functional components. The functional label at each voxel was determined by assigning to the voxel the IC that makes the maximal contribution. In contrast to the previous winner‐take‐all parcellation methods, the proposed ICA method does not require any predefined cortical targets to parcel subdivisions of the thalamus and the basal ganglia. This is an important property in the parcellation of subcortical brain structures, such as the basal ganglia, that may not have specific or easily identified target cortical regions, as in the thalamus.
The spatial pattern of thalamic subdivisions observed in our study corresponds grossly to the previous cytoarchitectonic study [Morel et al., 1997] and the rs‐fMRI study [Zhang et al., 2008]. Particularly, the identified thalamic subregions—AN(IC22), PU(IC30), VL/VA(IC15/23/33/24/37), and MD(IC8/14/9)—may suggest the reliability of this method. However, the accurate one‐to‐one mapping between the cytoarchitectonic subnuclei and our functional subdivisions may not be possible since there may exist a discrepancy between the subcortical function and anatomy. Also, the comparison of our results with those of Zhang et al. [ 2008] is limited since the functional subunit may be depending on the various factors such as the applied target masks—e.g., five cortical targets in Zhang et al. [ 2008].
Although further studies are required to examine how the functional subdivision is related with the cytoatchitectonic subnuclei, the functional component found in the ICA represents temporal coactivation among voxels within the component and act as a functional subunit during resting state.
Functional Network Connectivity of the Basal Ganglia and Thalamus
The multilevel ICA method for parcellation has an additional advantage in evaluating functional network connectivity among subcortical subdivisions and cortical components by using weight matrix. In this study, we calculated bivariate correlation coefficients for evaluating functional network connectivity instead of partial correlation coefficients because it is not clear whether time series of a IC, i.e., a column of the mixing matrix, is affected by activities of other ICs.
We found a high‐bilateral functional connectivity among nuclei of the basal ganglia and thalamus (Fig. 5). Studies of the cat [Fisher et al., 1984; Nieoullon et al., 1978] revealed inter‐hemispheric cortico‐caudate neural connections that may explain functional coupling between right and left basal ganglia. In addition to bilateral connectivity, we found the thalamo‐cortical connectivity between the medial‐dorsal nuclei (IC8) of the thalamus and dorsolateral prefrontal cortex (DLPFC), and thalamo‐striatal functional connectivity among the thalamus (IC8), the globus pallidus (IC26/35), and the caudate (IC4/21/48). The thalamo‐striatal and thalamo‐cortical functional connectivity can be explained by a parallel loop model of Alexander et al. [ 1986], composed of five segregated cortico‐striatal connections, or alternatively of Lawrence et al. [ 1998], comprised of four functional loops. Our network connectivity results suggested that the medial‐dorsal nucleus (IC8) of the thalamus was functionally connected with the right pallidum (IC26) mediating the right caudate nucleus (IC48) and the bilateral DLPFC (Fig. 5). This result is grossly consistent with the parallel loop model, wherein the DLPFC and posterior cingulate cortex constitute a cognitive functional circuit with the head of caudate, the substantia nigra and globus pallidus, and the ventral‐anterior and medial‐dorsal nucleus of the thalamus. A meta‐analysis of 126 functional neuroimaging studies found that the right caudate nucleus coactivates with the bilateral medial‐dorsal nuclei of the thalamus and the right globus pallidus [Postuma and Dagher, 2006]. Using a very large dataset (= 1,000 subjects), a recent study also showed cortico‐striatal connectivity [Buckner et al., 2010]. As they showed thalamic connections from the pulvinar to the visual cortex, and from the anterior and medial nuclei to the fronto‐parietal networks [Buckner et al., 2010], we found consistent connectivity from the pulvinar nuclei of the thalamus (IC30) to the occipital lobe and from the medial‐dorsal nuclei of the thalamus to a number of frontal regions including DLFPC (see Fig. 5). Thus, we confirmed the existence of the cortico‐striato‐thalamo‐cortical circuit, which is functionally connected among the segregated subdivisions and cortical regions.
The putamen is a major motor‐related area in the striatum that is associated with cortical motor areas such as the primary motor cortex and supplementary motor area [Di Martino et al., 2008]. Regarding functional connectivity of the putamen, this study produced two interesting findings. First, we did not find any correlations between activities of the putamen and the motor‐related cortical areas. Second, the right caudal nucleus (IC32) of the putamen was functionally interconnected with the cerebellum, which is consistent with previous findings showing anatomical connectivity between them via the thalamus [Bostan et al., 2010; Hoshi et al., 2005]. The first finding, i.e., the absence of the functional connectivity for well‐known neural circuits, may be another example of the inconsistency between anatomical and functional connectivity as discussed in the reviews of Buckner et al. [ 2008], Honey et al. [ 2010] and Van Dijk et al. [ 2010]. For example, the medial‐dorsal nucleus of the thalamus shows functional connectivity to the motor and premotor cortex in the resting‐state fMRI, but is anatomically connected to the prefrontal cortex as shown by DTI tractography [Zhang et al., 2010]. This discrepancy may arise from technical limitations, which include the low spatial resolution and errors in the fiber tractography. Functional connectivity also exists between the right and left primary visual cortex [Vincent et al., 2007], which do not have direct anatomic connectivity, and similarly, in cerebro‐cerebellar circuits [Krienen and Buckner, 2009]. Functional connectivity without apparent anatomical basis might also be explained by polysynaptic connections or common feed‐forward projections via the thalamus [Van Dijk et al., 2010]. Conversely, the absence of functional connectivity between the putamen and the motor cortex in this study does not imply a lack of anatomical connectivity between these regions. Functional connectivity can be modulated in spite of stable anatomical connectivity [Buckner et al., 2009; Fransson, 2006]; e.g., task performance can induce changes in functional connectivity strength [Albert et al., 2009; Hasson et al., 2009; Lewis et al., 2009; Waites et al., 2005]. Thus, the absence of significant functional connectivity between the putamen and motor cortical areas may stem from reduced connectivity strength during the resting state. However, we cannot rule out the possibility that the putamen receives many inputs from motor‐associated cortices such as the supplementary motor area, accurate premotor area, primary motor cortex, and primary somatosensory cortex [Alexander et al., 1986] and ICA of BOLD signals did not clearly identify neural synchronization between these areas.
Finally, this study detected the negative thalamo‐frontal functional connectivity, which was unexpected. Because negative correlations have been found as nonartifactural relationships in brain [Di Martino et al., 2008; Kelly et al., 2008], further studies are also required to clarify these phenomena.
In summary, this method served not only to parcel subdivisions of the basal ganglia and thalamus, according to the temporal profiles within subdivisions, but also to trace functional network connectivity among subdivisions.
Multilevel ICA Versus a General ICA
ICA is a blind source separation method widely used in fMRI analysis [McKeown et al., 1998] to identify brain networks such as the default mode network in the resting state in fMRI time‐series [Beckmann et al., 2005; De Luca et al., 2006]. ICA decomposes mixtures of time‐series signals from unknown sources into maximally independent components. Despite its wide acceptance in fMRI analysis, ICA is limited in that it cannot identify the number of intrinsic source signals. Furthermore, because ICA optimizes the mixing matrix toward the criterion of maximal independence among a set of source signals, the optimal ICA solutions for the whole brain may not be optimal to extract detailed information from sources within smaller restricted spaces as in the basal ganglia and thalamus. In this study, the conventional ICA (i.e., first‐level ICA) found only three ICs, corresponding grossly to the basal ganglia and thalamus. This is consistent with previous findings that relatively low order (≈ 50) ICA can extract components that are large and fused [Jafri et al., 2008; Smith et al., 2009]. A recent study showed that ICA with a model order of about 70 can extract the subcortical components in sufficient detail without over‐fitting the data [Abou‐Elseoud et al., 2010]. Indeed, Ystad et al. [ 2010] applied a model order of 72 to extract 49 functional components and identified some components corresponding to basal ganglia and thalamus. In contrast to this study, that study grossly identified only five sub‐regions: the main thalamus, medial‐dorsal nucleus of the thalamus, superior and inferior putamen, and head of the caudate. Increasing the model order to detect more detailed subdivisions within the basal ganglia and the thalamus may not be a solution, because it may result in over‐fitting problems with other components. Therefore, we proposed a multilevel ICA, which allows more freedom for specific brain regions without changing other functional components. By applying the second‐level ICA to sub‐volume space, we eventually derived 31 spatial components in the basal ganglia and thalamus.
Reproducibility and Individual Variability
For individual subjects, our method to parcel functional nuclei of the basal ganglia and thalamus appeared to be highly reproducible, especially in some regions of the thalamus and caudate. In particular, the medial‐dorsal and ventral‐anterior (or ventral‐lateral) nuclei of the thalamus were found in all subjects, while the pulvinar (≈76%) and anterior nuclei (≈57%) were less consistently identified across subjects. Also, the head and body of the caudate were found in over 90% of the subjects, even though the corresponding tail of the caudate nucleus was found less consistently (≈57%).
One plausible explanation for relatively low reproducibility in some specific subdivisions may be the high between‐subjects variation in the extent of nuclei within basal ganglia. Some small nuclei with large variation in size and position across individuals could be difficult to extract from the group‐specific parcellation data, which are based on the assumption that individual subregions do not vary in size or position between subjects [Aron et al., 2007].
The dependency of reproducibility on anatomical properties of each subdivision was found in an anatomical atlas map study [Park et al., 2004], which showed that the subregions located medially, with their simpler structure and bigger size, will have higher probability of anatomical overlap across subjects. In this context, the low reproducibility of the tail of the caudate (IC11) may be attributable to its thin and narrow shape near the large ventricular regions.
In line with our results, an anatomical parcellation study of individual variability based on probabilistic tractography found a reproducibility rate of 62–100% for subcortical regions, including the basal ganglia and thalamus [Draganski et al., 2008]. Therefore, the anatomy of subdivisions in the basal ganglia and thalamus may not be identical across individuals, even though we applied spatial normalization to the individual data set [Traynor et al., 2010].
When we generated statistical probabilistic atlas maps for each subdivision by counting overlap frequencies of individual subdivisions at each voxel across subjects using individual parcellation maps in Figure 6 (see Supporting Information Fig. S3), some ICs (IC24, IC32, IC35, and more) appeared to be widely distributed, and a certain subdivision (IC36) showed very low spatial overlap across subjects, although most probability atlas maps represented similar patterns with group ICA maps. These differences of the probability map distribution may possibly be due to the differences in the inter‐individual variations of the functional anatomy or imperfect parcellation due to limited number of data sets and noise in individual space. In contrast to the parcellation in the individual space that is less stable due to noise and small data size, group ICA is considered to be more stable because it parcellates subdivisions using the data that averages these variabilities.
Methodological Issues and Limitations
There are some methodological issues to be considered. In determining the subvolume area for the second‐level ICA, we used a subcortical atlas (AAL map) as a complementary to subcortical ICs found in the first‐level ICA, which showed a limitation in completely covering subcortical regions. Indeed, we could apply second‐level ICA to 3 subcortical IC maps without using AAL map. However, the first‐level ICA of the whole brain is imperfect in the identification of the subcortical regions for the second‐level analysis due to several potential factors as discussed previously. It could also be possible to apply a single ICA directly to the basal ganglia and thalamus defined by the AAL map. In this case, we could not associate the subdivision of the basal ganglia and thalamus with cortical components found in the first‐level analysis without a priori cortical target mask. Therefore, we decided to combine both anatomically and functionally defined subcortical regions to extend the initial mask as much as possible considering a “potential discrepancy” between functional and structure ROIs.
Regardless of methods to define subcortical mask, applying ICA to the restricted area provided better separation of subdivisions than applying ICA to the whole brain, which is the strong feature of the current method. The current multilevel ICA, separately applied to cortical and subcortical regions, enables us to associate the subcortical components of the second‐level ICA with cortical components found in the first‐level analysis.
The effect of Gaussian smoothing kernel size on ICA is not fully understood. Ideally, as a linear filtering, Gaussian smoothing can spread out functional components spatially while leaving mixing matrix without major changes. In other words, for measured images X, estimated source S and Gaussian kernel K, it can be represented as X = AS, KX = KAS = AKS = AS k, where S k is smoothed source images. If so, the relative contribution of each IC to a voxel will remain unchanged and the resulting parcellation map will not be significantly altered. In practice, however, the infomax optimization algorithm may be affected by the noise and probability distribution of training data sets. Generally speaking, when a larger smoothing kernel is applied, the signals of neighboring voxels tend to be dependent on each other and results in degradation of spatial resolution. On the other hand, with a smaller smoothing kernel, the noise would not be suppressed sufficiently. For group analysis, smoothing is also needed to minimize effects of spatial normalization errors that could result from misregistration between T 1‐weighted image and fMRI data, imperfect registration algorithms, and high inter‐individual variability in the brain topology. Thus, the optimal size of smoothing kernel is a trade‐off between the loss of spatial information and the suppression of noise and spatial normalization errors. In this study, we applied relatively large smoothing kernel (= 8 mm) to parcellate subcortical subdivisions in consideration of noise suppression and spatial normalization errors. We presented a parcellation result with a lower‐sized smoothing kernel (= 4 mm) in Supporting Information Figure S2, but it is not clear which smoothing kernel is the better choice. Further, evaluation should be needed to test the effect of smoothing kernel on the ICA and to determine the optimal kernel size.
A methodological limitation of our technique inherits the limitation of ICA. Although ICA can maximally estimate ICs equal to sample size in principle, some of estimated ICs can be just random effects due to noise, violations of model, or algorithmic problems such as local maxima [Hyvarinen, 2011].
For all resulting ICs, we cannot clearly decide which ICs are noise and which are desirable ICs. To date, selecting ICs has been also decided by a priori information of the researcher [Calhoun et al., 2009]. In the first‐level ICA, we visually identified the artifactual IC maps that appeared to be associated with head motion, physiological noise, registration error or CSF fluctuations. We excluded these artifacts in the further analysis. Some IC maps containing white matter regions were not excluded since they extended into the cortical regions. In the second‐level analysis, we confined IC maps within the basal and thalamus regions and excluded nonbasal ganglia and nonthalamic components in the parcellation process.
Some functional components found in the second‐level ICA were not locally segregated, but rather distributed over two or more anatomical regions. For example, IC23 in Figure 3 overlapped both with the thalamic ventro‐lateral nuclei and the caudal part of the putamen. This is consistent with previous functional imaging studies that the ventro‐lateral thalamus co‐activates with the left putamen [e.g., Postuma and Dagher, 2006]. This distributed but co‐activated clusters in a component in the ICA of rs‐fMRI indicates the mismatch between the functional segregation and anatomical segregation, which is a well‐known issue nowadays.
Of note, some small subdivisions of basal ganglia (e.g., tail of caudate and dorso‐lateral putamen) were indistinct, possibly because we used a relatively large voxel, which was used to achieve higher SNR and shorter TR, to analyze the resting‐state fMRI dataset. Further study using a smaller voxel with high SNR, in combination with tractography of DTI, may provide more exact information on the subcortical structure.
In this study, we did not cover the basal ganglia areas that are relatively difficult to localize by anatomical atlas; these included the substantia nigra, subthalamic nucleus, and nucleus accumbens. It will of course be worthwhile to investigate those subcortical areas.
CONCLUSIONS
Multilevel ICA of resting‐state fMRI revealed in detail the component subdivisions of the basal ganglia and thalamus. The extracted subdivisions showed bilateral functional connectivity between hemispheres, and functional connectivity between subregions of the basal ganglia and thalamus. In addition, functional regions of the cerebral cortex were highly correlated with the extracted subdivisions. These findings reflected the cortico‐striato‐thalamo‐cortical circuits in the brain. This study also showed the usefulness of multilevel ICA in brain network research.
Supporting information
Additional Supporting Information may be found in the online version of this article.
Supporting Information
References
- Abou‐Elseoud A, Starck T, Remes J, Nikkinen J, Tervonen O, Kiviniemi V ( 2010): The effect of model order selection in group PICA. Hum Brain Mapp 31: 1207–1216. [DOI] [PMC free article] [PubMed] [Google Scholar]
- Achard S, Salvador R, Whitcher B, Suckling J, Bullmore E ( 2006): A resilient, low‐frequency, small‐world human brain functional network with highly connected association cortical hubs. J Neurosci 26: 63–72. [DOI] [PMC free article] [PubMed] [Google Scholar]
- Albert NB, Robertson EM, Miall RC ( 2009): The resting human brain and motor learning. Curr Biol 19: 1023–1027. [DOI] [PMC free article] [PubMed] [Google Scholar]
- Alexander GE, DeLong MR, Strick PL ( 1986): Parallel organization of functionally segregated circuits linking basal ganglia and cortex. Annu Rev Neurosci 9: 357–381. [DOI] [PubMed] [Google Scholar]
- Andrews‐Hanna JR, Snyder AZ, Vincent JL, Lustig C, Head D, Raichle ME, Buckner RL ( 2007): Disruption of large‐scale brain systems in advanced aging. Neuron 56: 924–935. [DOI] [PMC free article] [PubMed] [Google Scholar]
- Annett M ( 1970): A classification of hand preference by association analysis. Br J Psychol 61: 303–321. [DOI] [PubMed] [Google Scholar]
- Aron AR, Behrens TE, Smith S, Frank MJ, Poldrack RA ( 2007): Triangulating a cognitive control network using diffusion‐weighted magnetic resonance imaging (MRI) and functional MRI. J Neurosci 27: 3743–3752. [DOI] [PMC free article] [PubMed] [Google Scholar]
- Barnes KA, Cohen AL, Power JD, Nelson SM, Dosenbach YB, Miezin FM, Petersen SE, Schlaggar BL ( 2010): Identifying basal ganglia divisions in individuals using resting‐state functional connectivity MRI. Front Syst Neurosci 4: 1–10. [DOI] [PMC free article] [PubMed] [Google Scholar]
- Beckmann CF, Smith SM ( 2004): Probabilistic independent component analysis for functional magnetic resonance imaging. IEEE Trans Med Imaging 23: 137–152. [DOI] [PubMed] [Google Scholar]
- Beckmann CF, Smith SM ( 2005): Tensorial extensions of independent component analysis for multisubject FMRI analysis. Neuroimage 25: 294–311. [DOI] [PubMed] [Google Scholar]
- Beckmann CF, DeLuca M, Devlin JT, Smith SM ( 2005): Investigations into resting‐state connectivity using independent component analysis. Philos Trans R Soc Lond B Biol Sci 360: 1001–1013. [DOI] [PMC free article] [PubMed] [Google Scholar]
- Behrens TE, Johansen‐Berg H, Woolrich MW, Smith SM, Wheeler‐Kingshott CA, Boulby PA, Barker GJ, Sillery EL, Sheehan K, Ciccarelli O, Thompson AJ, Brady JM, Matthews PM ( 2003a): Non‐invasive mapping of connections between human thalamus and cortex using diffusion imaging. Nat Neurosci 6: 750–757. [DOI] [PubMed] [Google Scholar]
- Behrens TE, Woolrich MW, Jenkinson M, Johansen‐Berg H, Nunes RG, Clare S, Matthews PM, Brady JM, Smith SM ( 2003b): Characterization and propagation of uncertainty in diffusion‐weighted MR imaging. Magn Reson Med 50: 1077–1088. [DOI] [PubMed] [Google Scholar]
- Bell AJ, Sejnowski TJ ( 1995): An information‐maximization approach to blind separation and blind deconvolution. Neural Comput 7: 1129–1159. [DOI] [PubMed] [Google Scholar]
- Biswal B, Yetkin FZ, Haughton VM, Hyde JS ( 1995): Functional connectivity in the motor cortex of resting human brain using echo‐planar MRI. Magn Reson Med 34: 537–541. [DOI] [PubMed] [Google Scholar]
- Biswal BB, Van Kylen J, Hyde JS ( 1997): Simultaneous assessment of flow and BOLD signals in resting‐state functional connectivity maps. NMR Biomed 10: 165–170. [DOI] [PubMed] [Google Scholar]
- Bostan AC, Dum RP, Strick PL ( 2010): The basal ganglia communicate with the cerebellum. Proc Natl Acad Sci USA 107: 8452–8456. [DOI] [PMC free article] [PubMed] [Google Scholar]
- Buckner RL, Andrews‐Hanna JR, Schacter DL ( 2008): The brain's default network: Anatomy, function, and relevance to disease. Ann N Y Acad Sci 1124: 1–38. [DOI] [PubMed] [Google Scholar]
- Buckner RL, Sepulcre J, Talukdar T, Krienen FM, Liu H, Hedden T, Andrews‐Hanna JR, Sperling RA, Johnson KA ( 2009): Cortical hubs revealed by intrinsic functional connectivity: Mapping, assessment of stability, and relation to Alzheimer's disease. J Neurosci 29: 1860–1873. [DOI] [PMC free article] [PubMed] [Google Scholar]
- Buckner RL, Yeo B, Choi E, Sepulcre J, Sabuncu MR, Roffman J, Zollei L, Fischl B, Liu H, Smoller J ( 2010): Estimates of Cerebellar, Thalamic, and Basal Ganglia Circuits Using Intrinsic Functional Connectivity Form 1000 Subjects. Society for Neuroscience. San Diego, CA: Neuroscience Meeting Planner. [Google Scholar]
- Calhoun VD, Liu J, Adali T ( 2009): A review of group ICA for fMRI data and ICA for joint inference of imaging, genetic, and ERP data. Neuroimage 45 ( 1 Suppl): S163–S172. [DOI] [PMC free article] [PubMed] [Google Scholar]
- Chen L, Xuan J, Wang C, Wang Y, Shih Ie M, Wang TL, Zhang Z, Clarke R, Hoffman EP ( 2009): Biomarker identification by knowledge‐driven multilevel ICA and motif analysis. Int J Data Min Bioinform 3: 365–381. [DOI] [PubMed] [Google Scholar]
- Cohen AL, Fair DA, Dosenbach NU, Miezin FM, Dierker D, Van Essen DC, Schlaggar BL, Petersen SE ( 2008): Defining functional areas in individual human brains using resting functional connectivity MRI. Neuroimage 41: 45–57. [DOI] [PMC free article] [PubMed] [Google Scholar]
- Collins DL, Holmes CJ, Peters TM, Evans AC ( 1995): Automatic 3D model‐based neuro‐anatomical segmentation. Hum Brain Mapp 3: 190–208. [Google Scholar]
- De Luca M, Beckmann CF, De Stefano N, Matthews PM, Smith SM ( 2006): fMRI resting state networks define distinct modes of long‐distance interactions in the human brain. Neuroimage 29: 1359–1367. [DOI] [PubMed] [Google Scholar]
- Di Martino A, Scheres A, Margulies DS, Kelly AM, Uddin LQ, Shehzad Z, Biswal B, Walters JR, Castellanos FX, Milham MP ( 2008): Functional connectivity of human striatum: A resting state FMRI study. Cereb Cortex 18: 2735–2747. [DOI] [PubMed] [Google Scholar]
- Draganski B, Kherif F, Kloppel S, Cook PA, Alexander DC, Parker GJ, Deichmann R, Ashburner J, Frackowiak RS ( 2008): Evidence for segregated and integrative connectivity patterns in the human basal ganglia. J Neurosci 28: 7143–7152. [DOI] [PMC free article] [PubMed] [Google Scholar]
- Fischl B, van der Kouwe A, Destrieux C, Halgren E, Segonne F, Salat DH, Busa E, Seidman LJ, Goldstein J, Kennedy D, Caviness V, Makris N, Rosen B, Dale AM ( 2004): Automatically parcellating the human cerebral cortex. Cereb Cortex 14: 11–22. [DOI] [PubMed] [Google Scholar]
- Fisher RS, Shiota C, Levine MS, Hull CD, Buchwald NA ( 1984): Interhemispheric organization of corticocaudate projections in the cat: A retrograde double‐labelling study. Neurosci Lett 48: 369–373. [DOI] [PubMed] [Google Scholar]
- Fransson P ( 2006): How default is the default mode of brain function? Further evidence from intrinsic BOLD signal fluctuations. Neuropsychologia 44: 2836–2845. [DOI] [PubMed] [Google Scholar]
- Golland Y, Golland P, Bentin S, Malach R ( 2008): Data‐driven clustering reveals a fundamental subdivision of the human cortex into two global systems. Neuropsychologia 46: 540–553. [DOI] [PMC free article] [PubMed] [Google Scholar]
- Greicius MD, Krasnow B, Reiss AL, Menon V ( 2003): Functional connectivity in the resting brain: A network analysis of the default mode hypothesis. Proc Natl Acad Sci USA 100: 253–258. [DOI] [PMC free article] [PubMed] [Google Scholar]
- Hasson U, Nusbaum HC, Small SL ( 2009): Task‐dependent organization of brain regions active during rest. Proc Natl Acad Sci USA 106: 10841–10846. [DOI] [PMC free article] [PubMed] [Google Scholar]
- Henderson JM, Carpenter K, Cartwright H, Halliday GM ( 2000): Loss of thalamic intralaminar nuclei in progressive supranuclear palsy and Parkinson's disease: Clinical and therapeutic implications. Brain 123 ( Part 7): 1410–1421. [DOI] [PubMed] [Google Scholar]
- Honey CJ, Thivierge JP, Sporns O ( 2010): Can structure predict function in the human brain? Neuroimage 52: 766–776. [DOI] [PubMed] [Google Scholar]
- Hoshi E, Tremblay L, Feger J, Carras PL, Strick PL ( 2005): The cerebellum communicates with the basal ganglia. Nat Neurosci 8: 1491–1493. [DOI] [PubMed] [Google Scholar]
- Hyvarinen A ( 2011): Testing the ICA mixing matrix based on inter‐subject or inter‐session consistency. Neuroimage 58: 122–136. [DOI] [PubMed] [Google Scholar]
- Jafri MJ, Pearlson GD, Stevens M, Calhoun VD ( 2008): A method for functional network connectivity among spatially independent resting‐state components in schizophrenia. Neuroimage 39: 1666–1681. [DOI] [PMC free article] [PubMed] [Google Scholar]
- Ji Y, Herve PY, Aickelin U, Pitiot A ( 2009): Parcellation of fMRI datasets with ICA and PLS—A data driven approach. Med Image Comput Comput Assist Interv 12 ( Part 1): 984–991. [DOI] [PubMed] [Google Scholar]
- Johansen‐Berg H, Behrens TE, Sillery E, Ciccarelli O, Thompson AJ, Smith SM, Matthews PM ( 2005): Functional‐anatomical validation and individual variation of diffusion tractography‐based segmentation of the human thalamus. Cereb Cortex 15: 31–39. [DOI] [PubMed] [Google Scholar]
- Kelly AM, Uddin LQ, Biswal BB, Castellanos FX, Milham MP ( 2008): Competition between functional brain networks mediates behavioral variability. Neuroimage 39: 527–537. [DOI] [PubMed] [Google Scholar]
- Kim JJ, Kim DJ, Kim TG, Seok JH, Chun JW, Oh MK, Park HJ ( 2007): Volumetric abnormalities in connectivity‐based subregions of the thalamus in patients with chronic schizophrenia. Schizophr Res 97: 226–235. [DOI] [PubMed] [Google Scholar]
- Kreczmanski P, Heinsen H, Mantua V, Woltersdorf F, Masson T, Ulfig N, Schmidt‐Kastner R, Korr H, Steinbusch HW, Hof PR, Schmitz C ( 2007): Volume, neuron density and total neuron number in five subcortical regions in schizophrenia. Brain 130( Part 3): 678–692. [DOI] [PubMed] [Google Scholar]
- Krienen FM, Buckner RL ( 2009): Segregated fronto‐cerebellar circuits revealed by intrinsic functional connectivity. Cereb Cortex 19: 2485–2497. [DOI] [PMC free article] [PubMed] [Google Scholar]
- Lawrence AD, Sahakian BJ, Robbins TW ( 1998): Cognitive functions and corticostriatal circuits: Insights from Huntington's disease. Trends Cogn Sci 2: 379–388. [DOI] [PubMed] [Google Scholar]
- Leh SE, Ptito A, Chakravarty MM, Strafella AP ( 2007): Fronto‐striatal connections in the human brain: A probabilistic diffusion tractography study. Neurosci Lett 419: 113–118. [DOI] [PMC free article] [PubMed] [Google Scholar]
- Lewis CM, Baldassarre A, Committeri G, Romani GL, Corbetta M ( 2009): Learning sculpts the spontaneous activity of the resting human brain. Proc Natl Acad Sci USA 106: 17558–17563. [DOI] [PMC free article] [PubMed] [Google Scholar]
- Li YO, Adali T, Calhoun VD ( 2007): Estimating the number of independent components for functional magnetic resonance imaging data. Hum Brain Mapp 28: 1251–1266. [DOI] [PMC free article] [PubMed] [Google Scholar]
- Lowe MJ, Mock BJ, Sorenson JA ( 1998): Functional connectivity in single and multislice echoplanar imaging using resting‐state fluctuations. Neuroimage 7: 119–132. [DOI] [PubMed] [Google Scholar]
- McGuire PK, Paulesu E, Frackowiak RS, Frith CD ( 1996): Brain activity during stimulus independent thought. Neuroreport 7: 2095–2099. [PubMed] [Google Scholar]
- McKeown MJ, Makeig S, Brown GG, Jung TP, Kindermann SS, Bell AJ, Sejnowski TJ ( 1998): Analysis of fMRI data by blind separation into independent spatial components. Hum Brain Mapp 6: 160–188. [DOI] [PMC free article] [PubMed] [Google Scholar]
- Morel A ( 1997): Stereotactic Atlas of the Human Thalamus and Basal Ganglia. New York: Informa Healthcare. [Google Scholar]
- Morel A, Magnin M, Jeanmonod D ( 1997): Multiarchitectonic and stereotactic atlas of the human thalamus. J Comp Neurol 387: 588–630. [DOI] [PubMed] [Google Scholar]
- Newman ME ( 2006): Modularity and community structure in networks. Proc Natl Acad Sci USA 103: 8577–8582. [DOI] [PMC free article] [PubMed] [Google Scholar]
- Niemann K, Mennicken VR, Jeanmonod D, Morel A ( 2000): The Morel stereotactic atlas of the human thalamus: Atlas‐to‐MR registration of internally consistent canonical model. Neuroimage 12: 601–616. [DOI] [PubMed] [Google Scholar]
- Nieoullon A, Cheramy A, Glowinski J ( 1978): Release of dopamine in both caudate nuclei and both substantia nigrae in response to unilateral stimulation of cerebellar nuclei in the cat. Brain Res 148: 143–152. [DOI] [PubMed] [Google Scholar]
- Park HJ, Levitt J, Shenton ME, Salisbury DF, Kubicki M, Kikinis R, Jolesz FA, McCarley RW ( 2004): An MRI study of spatial probability brain map differences between first‐episode schizophrenia and normal controls. Neuroimage 22: 1231–1246. [DOI] [PMC free article] [PubMed] [Google Scholar]
- Postuma RB, Dagher A ( 2006): Basal ganglia functional connectivity based on a meta‐analysis of 126 positron emission tomography and functional magnetic resonance imaging publications. Cereb Cortex 16: 1508–1521. [DOI] [PubMed] [Google Scholar]
- Raichle ME, Snyder AZ ( 2007): A default mode of brain function: A brief history of an evolving idea. Neuroimage 37: 1083–1090; discussion 1097–1099. [DOI] [PubMed] [Google Scholar]
- Shen X, Papademetris X, Constable RT ( 2010): Graph‐theory based parcellation of functional subunits in the brain from resting‐state fMRI data. Neuroimage 15: 1027–1035. [DOI] [PMC free article] [PubMed] [Google Scholar]
- Smith SM, Fox PT, Miller KL, Glahn DC, Fox PM, Mackay CE, Filippini N, Watkins KE, Toro R, Laird AR, Beckmann CF ( 2009): Correspondence of the brain's functional architecture during activation and rest. Proc Natl Acad Sci USA 106: 13040–13045. [DOI] [PMC free article] [PubMed] [Google Scholar]
- Traynor C, Heckemann RA, Hammers A, O'Muircheartaigh J, Crum WR, Barker GJ, Richardson MP ( 2010): Reproducibility of thalamic segmentation based on probabilistic tractography. Neuroimage 52: 69–85. [DOI] [PubMed] [Google Scholar]
- Tzourio‐Mazoyer N, Landeau B, Papathanassiou D, Crivello F, Etard O, Delcroix N, Mazoyer B, Joliot M ( 2002): Automated anatomical labeling of activations in SPM using a macroscopic anatomical parcellation of the MNI MRI single‐subject brain. Neuroimage 15: 273–289. [DOI] [PubMed] [Google Scholar]
- Van Dijk KR, Hedden T, Venkataraman A, Evans KC, Lazar SW, Buckner RL ( 2010): Intrinsic functional connectivity as a tool for human connectomics: Theory, properties, and optimization. J Neurophysiol 103: 297–321. [DOI] [PMC free article] [PubMed] [Google Scholar]
- Vincent JL, Patel GH, Fox MD, Snyder AZ, Baker JT, Van Essen DC, Zempel JM, Snyder LH, Corbetta M, Raichle ME ( 2007): Intrinsic functional architecture in the anaesthetized monkey brain. Nature 447: 83–86. [DOI] [PubMed] [Google Scholar]
- Waites AB, Stanislavsky A, Abbott DF, Jackson GD ( 2005): Effect of prior cognitive state on resting state networks measured with functional connectivity. Hum Brain Mapp 24: 59–68. [DOI] [PMC free article] [PubMed] [Google Scholar]
- Ystad M, Eichele T, Lundervold AJ, Lundervold A ( 2010): Subcortical functional connectivity and verbal episodic memory in healthy elderly—A resting state fMRI study. Neuroimage 52: 379–388. [DOI] [PubMed] [Google Scholar]
- Zhang D, Snyder AZ, Fox MD, Sansbury MW, Shimony JS, Raichle ME ( 2008): Intrinsic functional relations between human cerebral cortex and thalamus. J Neurophysiol 100: 1740–1748. [DOI] [PMC free article] [PubMed] [Google Scholar]
- Zhang D, Snyder AZ, Shimony JS, Fox MD, Raichle ME ( 2010): Noninvasive functional and structural connectivity mapping of the human thalamocortical system. Cereb Cortex 20: 1187–1194. [DOI] [PMC free article] [PubMed] [Google Scholar]
Associated Data
This section collects any data citations, data availability statements, or supplementary materials included in this article.
Supplementary Materials
Additional Supporting Information may be found in the online version of this article.
Supporting Information