

Abstract
Education has been extensively considered an influential factor in the modulation of interindividual differences in cognitive performance and cerebral structure. Consequently, education has been linked to the concept of reserve, which refers to an unspecified aspect of brain structure or function that enables people with more education to cope better with brain pathology or age‐related changes. Nevertheless, the education‐related neural mechanisms involved in reserve are still not completely understood. In this study, 150 healthy subjects were submitted to a comprehensive sociodemographic, clinical and cognitive assessment, and a high‐resolution structural MRI and diffusion tensor imaging scan protocol. Data of micro‐ (mean diffusivity, MD) and macro‐ (volume) structural changes of six bilateral deep gray matter structures (thalamus, caudate nucleus, putamen, hippocampus, amygdala, and globus pallidus) were analyzed with reference to years of formal education. Results show that decreased MD in both left and right hippocampi was the only structural parameter that, along with decreasing age, significantly correlated with higher education. The present findings suggest that the hippocampal formation might be one site where education‐mediated microstructural changes occur, possibly compensating for cognitive decline. Hum Brain Mapp, 2011. © 2010 Wiley‐Liss, Inc.
Keywords: hippocampus, neural reserve, cognitive reserve, DTI, education
INTRODUCTION
There is a general consensus that interindividual differences in cognitive performance and brain structure/function can be modulated by life events such as cognitive enrichment factors, occupational attainment, and leisure activities [e.g. Scarmeas and Stern, 2003].
Early cognitive enrichment has been shown to be crucial for maintaining cognitive performance later in life [e.g. Roe et al., 2007]. Formal education is one of the most studied enrichment factors, and there is some evidence of education‐dependent interindividual differences in brain structure and function. For instance, there are reports of reduced intracranical volume and smaller head size in individuals with a low level of education [e.g. Mortimer et al., 2003]. Furthermore, at the functional level, a significant negative correlation has been recently shown between educational attainment and lower brain glucose metabolism in temporo‐parietal association areas [Garibotto et al., 2008].
These findings can be converged into a coherent framework supporting the concept of reserve. This concept refers to an unspecified aspect of brain structure or function that enables people with more reserve to cope better with brain pathology or age‐related changes [Stern, 2002]. Stern [2003] proposed two different models for dealing with the concept of reserve. On one hand, the threshold model [Satz, 1993] posits that there are large individual differences in reserve capacity and a presumed critical threshold and clinical deficits emerge only when brain pathology has passed this threshold. This implies that if two patients have different reserve capacities, a lesion of a particular size may exceed the threshold of damage sufficient to produce clinical symptoms in one patient but not the other.
On the other hand, the active model of reserve [Stern, 2003; Roe et al., 2007] focuses on the existing variations in task processing among individuals rather than on physiological differences. Thus, reserve may result in more efficient use of brain networks and provide greater ability sustain brain damage without signs of cognitive deficits.
Previous imaging studies investigating the biological markers of education‐mediated reserve were mainly focused on cortical structure and function. Seo et al. [in press] investigated the effect of demographic factors (age of onset, sex, and years of education) on the distribution of cortical thickness in normal subjects and patients with Alzheimer Desease (AD). The authors found that patients with earlier onset and higher education suffered from marked gray matter thinning in frontal and temporo‐parietal areas. In addition, Stern et al. [1992] observed that the parieto‐temporal blood flow deficit of patients with the same level of dementia severity was greater in those with higher education. This result was confirmed in a later study by Alexander et al. [1997] who found that, in patients with AD, higher education was correlated with reduced cortical metabolism in prefrontal, premotor, and left superior parietal association areas. That is, more educated patients who show more severe metabolic deficits exhibit the same level of cognitive ability compared to less educated patients whose disease is less severe. These results suggest that education might have a biological role in mediating reserve advantage and thus neuroprotection, possibly mediated by higher synaptic density or a greater repertoire of acquired skills to cope with gradually progressing impairment.
Less is known about education‐related changes in the deep gray matter structures, such as the hippocampus, thalamus, basal ganglia, and amygdala. As these assemblies are known to be connected to virtually all cortical areas and have been extensively associated with cognitive decline and affective behavior in different disorders such as Alzheimer's [e.g. de Jong et al., 2008] and Parkinson's [e.g. Aminoff, 2001] disease and schizophrenia [e.g. Spoletini et al., in press], it would be interesting to study macro and micro variations of these structures in relation to educational attainment.
For this purpose, volumetric and diffusion tensor imaging (DTI) is a reliable tool of investigation. Among DTI indices, mean diffusivity (MD) is preferentially used to investigate pathological changes in the brain. Although DTI measures have been mainly used to study white matter changes, it is now clear that they can also be used to highlight microstructural alterations at the level of gray matter [Muller et al., 2007]. Increased MD is generally thought to result from an increase in extracellular space due to a loss of neurons, axons, and dendrites [e.g., Kantarci et al., 2005]. In a study investigating the relationship between the basilar dendrites of the supragranular pyramidal cells in Wernicke's area and higher cognitive functions in healthy subjects, Jacobs et al. [1993] found that education had a consistent and substantial effect such that dendritic measures increased as educational levels increased.
Therefore, MD can be considered a reliable index of education‐related interindividual variability at the microstructural level.
In this study, we investigated whether volumetry and MD information of six bilateral deep gray matter structures (i.e. thalamus, caudate nucleus, putamen, globus pallidus, hippocampus, and amygdala) are related to a reserve proxy (years of formal education) in a large cohort of healthy subjects. Thus, we hypothesized that if educational attainment plays a role in mediating reserve, we would find a relationship between volume increase and/or MD reduction and higher education.
METHODS
Subjects
We enrolled 150 healthy subjects (61 males, 40.6%; mean age ± SD = 40.35 ± 15.69 years, range: 18–65; mean education ± SD = 14.54 ± 3.3 years, range: 5–21) in the study. The only inclusion criterion was age between 18 and 65 years. Exclusion criteria included: (i) suspect of cognitive impairment or dementia based on Mini Mental State Examination (MMSE) [Folstein et al., 1975] score ≤ 24 [Measso et al., 1993], identifying positive screening for cognitive deterioration in the Italian population, and confirmed by a clinical neuropsychological evaluation using the Mental Deterioration Battery [Carlesimo et al., 1996] and NINCDS‐ADRDA criteria for dementia [McKhann et al., 1984], (ii) subjective complaint of memory difficulties or of any other cognitive deficits interfering or not with daily living activities, (iii) major medical illnesses, e.g., diabetes (not stabilized), obstructive pulmonary disease, or asthma; hematological and oncological disorders; pernicious anemia; clinically significant and unstable active gastrointestinal, renal, hepatic, endocrine, or cardiovascular system disease; newly treated hypothyroidism, (iv) current or reported psychiatric [assessed by the SCID‐I and the SCID‐II, First et al., 1997a, b] or neurological (assessed by a clinical neurological evaluation) disorders (e.g., schizophrenia, mood disorders, anxiety disorders, stroke, Parkinson's disease, seizure disorder, head injury with loss of consciousness or any other significant mental or neurological disorder), (v) known or suspected history of alcoholism or drug dependence and abuse during lifetime, (vi) MRI evidence of focal parenchymal abnormalities or cerebrovascular diseases.
The study was approved and carried out in accordance with the guidance of our local Ethics Committee. Written consent was obtained from all participants after the study procedures had been explained to them.
Education Measurement
Education was assessed by means of a personal interview and was recorded as years completed in schools legally recognized by the Italian Ministry of Education. Repeated years of schooling due to failed exams or bad general grades were ignored. The Italian educational system is divided into five basic steps, each of which is completed by passing a final exam: (i) primary or elementary school (5 years); (ii) secondary (middle) school (3 years); (iii) high school (4–5 years); (iv) university (programs lasting from 3 to 6 years); (v) advanced academic degree (PhD, 3 years). Before 1962, obligatory schooling included only primary school; from 1963 to the present, it also includes middle school. On the basis of the organization of the Italian schools, in this study the distribution of subjects' years of education was mostly grouped in three clusters (Fig. 2): (i) 8 years (primary and middle school); (ii) 13 years (high school): (iii) 17 and 18 years (university).
Figure 2.
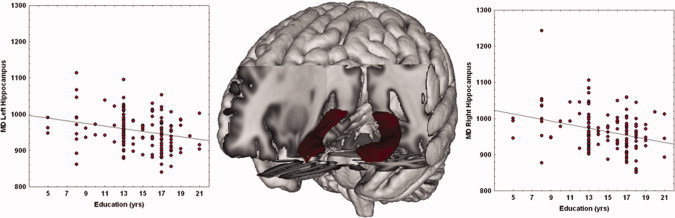
Scatterplot of MD (10−6 mm2/s) and years of education in left and right hippocampi. Linear fit (black lines) is reported. [Color figure can be viewed in the online issue, which is available at wileyonlinelibrary.com.]
Image Acquisition and Processing
All 150 participants underwent the same imaging protocol, which included standard clinical sequences (FLAIR, DP‐T2‐weighted), whole‐brain T1‐weighted and diffusion‐weighted scanning using a 3T Allegra MR imager (Siemens, Erlangen, Germany) with a standard quadrature head coil. All planar sequence acquisitions were obtained in the plane of the AC‐PC line. Particular care was taken to center the subjects in the head coil and to restrain their movements with cushions and adhesive medical tape. Diffusion‐weighted volumes were acquired using echo‐planar imaging (TE/TR = 89/8,500 ms, bandwidth = 2,126 Hz/vx; matrix size: 128 × 128; 80 axial slices, voxel size: 1.8 × 1.8 × 1.8 mm3) with 30 isotropically distributed orientations for the diffusion‐sensitizing gradients at a b‐value of 1,000 s/mm2 and six b = 0 images. Scanning was repeated three times to increase the signal‐to‐noise ratio. Whole‐brain T1‐weighted images were obtained in the sagittal plane using a modified driven equilibrium Fourier transform (MDEFT) [Deichmann et al., 2004] sequence (TE/TR = 2.4/7.92 ms, flip angle: 15°, voxel‐size: 1 × 1 × 1 mm3).
Image processing was performed using FSL 4.1 (http://www.fmrib.ox.ac.uk/fsl/). Image distortions induced by eddy currents and head motion in the DTI data were corrected by applying a 3D full affine (mutual information cost function) alignment of each image to the mean no diffusion weighting (b0) image. After these corrections, DTI data were averaged and concatenated into 31 (1 b0 + 30 b1000) volumes. A diffusion tensor model was fit at each voxel, generating fractional anisotropy (FA), and MD maps. The FA maps were used to obtain a better coregistration with T1‐weighted images because the spatial distribution of signal intensities was similar in both image modalities, and MD values were used as an index of micro structural integrity within the deep gray matter nuclei. The FA maps created were registered to brain‐extracted whole‐brain volumes from T1‐weighted images using a full affine (correlation ratio cost function) alignment with nearest‐neighbor resampling. The calculated transformation matrix was applied to the MD maps with identical resampling options.
Anatomical T1‐weighted images were processed with the segmentation tool FIRST 1.1 [Woolrich et al., 2009] integrated in the FSL software [Smith et al., 2004]. This is a model‐based segmentation/registration tool. The shape/appearance models used in FIRST are constructed from manually segmented images provided by the Center for Morphometric Analysis (CMA), MGH, Boston, MA. The manual labels are parameterized as surface meshes and modeled as a point distribution model. Deformable surfaces are used to automatically parameterize the volumetric labels in terms of meshes; the deformable surfaces are constrained to preserve vertex correspondence across the training data. Furthermore, normalized intensities along the surface normals are sampled and modeled. The shape and appearance model is based on multivariate Gaussian assumptions. Shape is then expressed as a mean with modes of variation (principal components). On the basis of the learned models, FIRST searches through linear combinations of shape modes of variation for the most probable shape instance given the intensities observed in the T1 image. In other words, this tool is optimized to find the optimal border and extent of the structures considered, modeling these structures as surfaces.
This method of segmentation is particularly useful for structures with a low contrast‐to‐noise ratio. For each subject and each hemisphere the caudate (body), putamen, pallidum, thalamus (thalamic nuclei and pulvinar), hippocampus (dentate gyrus, the ammonic subfields (CA1, CA2, CA3, and CA4), the prosubiculum, and the subiculum), and amygdala (basolateral complex, centro‐medial, and cortical nuclei) were segmented. For each subject, the results of region of interest (ROI) segmentation and the coregistered FA map were superimposed on the original T1‐weighted volume and the resulting images were visually assessed by two trained radiologists to exclude misregistration or erroneous ROI identification (Fig. 1).
Figure 1.
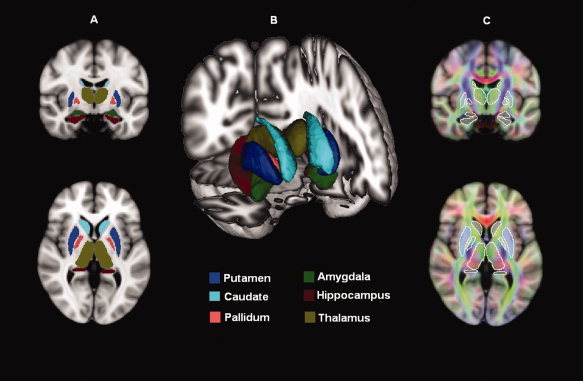
Deep gray matter structure volumetry and diffusivity. (A) ROI mapped onto one subject's images. (B) latero‐frontal three‐dimensional view of the segmented structures. (C) DTI‐derived maps coregistered to T1‐weighted images. Average values of DTI‐derived parameters (MD, FA) were calculated using segmented structures as regions of interest.
For each subject and each hemisphere, we calculated the volumes of the above‐mentioned ROIs. Prior to statistical analysis, individual volume values were multiplied by a normalization factor obtained with the SIENAX tool [Smith et al., 2001] from the corresponding T1‐weighted image. These segmented ROIs defined the binary masks where mean values of MD were calculated for each individual. For each subject, two trained neuroradiologists coinspected all available clinical MRI sequences (i.e. T1‐ and T2‐weighted and FLAIR images) to ensure that subjects were free from structural brain pathology and vascular lesions.
This image processing method was applied in previous works [Cherubini et al., 2009; Peran et al., 2009; Spoletini et al., in press].
Statistical Analyses
Partial correlation coefficients (Pearson's r) were calculated to assess the relationship between (i) age and education, (ii) anatomical measures and education. As calculating a high number of correlation coefficients increases the risk of a type I error, that is, erroneously concluding that a significant correlation is present, the issue of the relationship between anatomical measures and education was also explored using stepwise multiple regression analyses. The latter is a multivariate statistical method that permits looking for relationships without inflating the risk of a type I error [Draper and Smith, 1981]. Given the high collinearity (r > 0.70) between right and left structures (both for volumetric and MD data), two separate stepwise multiple regression analyses (i.e. one for right and one for left structures) were computed. In these analyses, years of education was the dependent variable and the anatomical measures that survived the P < 0.00416 threshold in the correlation analyses (Bonferoni correction: P < 0.05/12 number of comparisons) entered as independent variables along with age. Note that we performed both forward and backward stepwise regressions considering all independent variables jointly. The forward stepwise regression starts with no variables in the model; it tries out the variables one by one and includes them if they are statistically significant. The backward stepwise regression starts with all candidate variables and tests them for statistical significance, deleting any that are not significant. Although the stepwise method is only optimal locally, the agreement between forward and backward stepwise methods should support the resulting statistics.
RESULTS
The following results emerged: education correlated negatively with age (r = −0.478; P < 0.0001); normalized volume of bilateral thalami and left caudate correlated positively with education; the negative correlation between MD values and education was significant for the bilateral thalami, bilateral putamen, bilateral hippocampi, and right caudate (Table I).
Table I.
Crude correlations between education and deep macro and micro structure in 150 healthy subjects
| Structure | Normalized volume | Mean diffusivity | ||
|---|---|---|---|---|
| Pearson's r | P‐value | Pearson's r | P‐value | |
| Right thalamus | 0.306 | <0.0001a | −0.291 | 0.0003a |
| Left thalamus | 0.346 | <0.0001a | −0.294 | 0.0002a |
| Right putamen | 0.173 | 0.034 | −0.291 | 0.0003a |
| Left putamen | 0.175 | 0.032 | −0.282 | 0.0004a |
| Right hippocampus | −0.032 | 0.696 | −0.301 | 0.0002a |
| Left hippocampus | 0.010 | 0.907 | −0.248 | 0.0021a |
| Right caudate nucleus | 0.175 | 0.032 | −0.304 | 0.0001a |
| Left caudate nucleus | 0.262 | 0.0012a | −0.206 | 0.0113 |
| Right amygdala | −0.115 | 0.162 | −0.036 | 0.662 |
| Left amygdala | −0.127 | 0.123 | 0.082 | 0.322 |
| Right globus pallidus | 0.112 | 0.1714 | −0.022 | 0.786 |
| Left globus pallidus | 0.082 | 0.319 | −0.059 | 0.476 |
Statistically significant after Bonferoni correction for multiple comparisons.
In the two forward stepwise regression analyses, we obtained identical results for right and left structures (Table II). In both cases, age was the first selected predictor for entry into the model. In particular, increasing age was related to lower education. Once age‐related variance was removed both in right and left regression analyses, MD of the hippocampus was the second variable that entered into the regression models. In particular, increasing education was associated with decreasing hippocampal MD. No other variables entered into the models. The equations were highly significant for analyses investigating left (F = 25.9; df = 2,147; P < 0.0001) and right (F = 26.6; df = 2,147; P < 0.0001) deep gray matter structures and explained 26.1% and 26.6% of the overall variance, respectively. These results were fully confirmed by the backward stepwise regression method.
Table II.
Stepwise multiple regression analyses: predictors of education for 150 healthy subjects
| Variable | Left analysis | Right analysis | ||
|---|---|---|---|---|
| Step 1a | Step 2a | Step 1a | Step 2a | |
| Age | −0.478 (43.763) | −0.451 (39.662) | −0.478 (43.763) | −0.431 (35.090) |
| MD hippocampus | −0.206 (6.529) | −0.183 (6.529) | −0.221 (7.575) | −0.200 (7.575) |
| NV thalamus | 0.092 (1.250) | −0.085 (1.058) | −0.072 (0.758) | −0.037 (0.201) |
| NV caudate nucleus | −0.059 (0.511) | −0.062 (0.554) | — | — |
| MD thalamus | −0.129 (2.476) | −0.082 (0.992) | −0.127 (2.428) | −0.137 (2.783) |
| MD putamen | −0.139 (2.891) | −0.093 (1.269) | −0.164 (4.062) | −0.163 (3.978) |
| MD caudate nucleus | — | — | 0.050 (0.370) | −0.010 (0.016) |
| R 2 | 0.228 | 0.261 | 0.228 | 0.266 |
| P | <0.0001 | <0.0001 | <0.0001 | <0.0001 |
The analyses are separated for left and right structures.
NV, normalized volume; MD, mean diffusivity.
Coefficient for variables in equations are underlined.
Standard coefficient and (F value).
Scatter plots showing the negative correlations between left and right hippocampi MD and education are reported in Figure 2.
DISCUSSION
In this study, educational attainment was analyzed together with indexes of macro (volume) and micro (MD) structural changes of six deep gray matter structures in a large sample of healthy subjects. Results showed that MD, not volume, of both the left and right hippocampi was the only significant predictor of education.
A large body of evidence suggests that high education provides protection against the clinical expression of symptoms in neurodegenerative processes such as those observed in AD [Stern, 2006] or frontotemporal lobar degeneration [FTLD, e.g. Perneczky et al., 2009]. This has led to a growing interest in exploring the neural bases of this reserve. Previous structural MRI studies investigating the possible role of education in mediating reserve against degenerative processes focused mainly on volumetric information of whole brain [e.g. Fotenos et al., 2008] and gray matter [e.g. Seo et al., in press] and a survey of white matter hyperintensities [e.g. Kaplan et al., 2009]. As far as we know, this is the first study in healthy humans that investigated education‐related reserve by focusing on changes in brain microstructure of deep gray matter assemblies.
The negative correlation between hippocampal MD and education can be interpreted in light of the structural and functional features of this assembly. Volumetric studies have shown that the hippocampus is one of the first regions to be involved in pathological aging and it has been suggested that hippocampal atrophy may be the step that determines the transition from normality to Mild Cognitive Impairment [MCI, Wolf et al., 2004]. Consequently, this structure, together with other regions involved in aging and degenerative processes (e.g. the entorhinal and perirhinal cortices), might be one of the sites where a putative protective process against degeneration in so‐called successful aging takes place. There is compelling evidence that neurogenesis, that is, the production of new neurons, normally occurs in the bilateral hippocampal formation of the adult brain in many vertebrates, from birds to primates [Barnea and Nottebohm, 1996; Kempermann et al., 1997]. Moreover, several studies have shown that hippocampal neurogenesis is enhanced in animals living in enriched environments [Epp et al., 2009; Kempermann et al., 1997] and that this enhancement is modulated by hippocampal‐related activities [Shors et al., 2002]. Further, human studies have shown that higher education improves performance on learning and memory tasks [Corral et al., 2006], two processes in which involvement of the bilateral hippocampi has been recognized for decades [e.g. Milner, 1972; Squire, 2004]. Therefore, in humans different levels of education might lead to different levels of cognitive enrichment [Milgram et al., 2006] and this could be reflected in education‐related differences in the hippocampal microstructure, bilaterally. Namely, if an increase in the number of neurons, synapses and dendrites occurs in the hippocampus as a function of education‐related cognitive enrichment, it is plausible that a higher level of neural reserve will be observed in this structure in terms of MD decrease associated with increasing education. The results of this study seem to be in line with Klempin and Kempermann's [2007] hypothesis that adult hippocampal neurogenesis (which seems to be context‐dependent) may contribute to the neural reserve, that is, the potential for structural plasticity that allows compensation in the face of cognitive decline.
One limit of our study is the unavoidable high anticorrelation between education and age, which may have partially confounded our findings. In fact, the hippocampal MD decrease might be more related to age than to greater education. However, recent findings reported by Cherubini et al. [2009], do not support this alternative explanation, because in their in vivo MRI study hippocampal MD variations in a healthy population were age‐independent. In fact, the authors claimed that although this structure is undoubtedly affected by age‐related changes, the higher variability of MR parameters between individuals of similar age makes it difficult to link them to a single variable such as subject's age. Moreover, the authors found that the best MR predictors of physiological aging were the mean relaxation time (T2*) of the putamen and the volume and MD of the thalamus. Therefore, an explanation of our findings in terms of age‐related changes only seems unfounded.
Another possibility that cannot be ruled out in the present study is that variations in hippocampal MD might not reflect education‐related processes but might be linked to other factors such as routine physical exercise. In fact, as recently reviewed by Van Praag [2009], routine physical exercise can enhance the increase of neurons in the hippocampus and thus prevent or delay the loss of cognitive function. For this reason, physical exercise together with education has been extensively considered as a proxy of neural/brain reserve [e.g. Nithianantharajah and Hannan, 2009]. Data from this study are insufficient to disentangle the issue of whether or not hippocampal MD variations are related to physical exercise and, in fact, this could be the topic of future studies.
In conclusion, this study supports the possible role of education in modulating hippocampal microstructure and provides new insights for future research investigating the issue of reserve in the context of both pathology and normal functioning.
REFERENCES
- Alexander G, Furey M, Grady C, Pietrini P, Brady D, Mentis M, Schapiro MB ( 1997): Association of premorbid intellectual function with cerebral metabolism in Alzheimer's disease: Implications for the cognitive reserve hypothesis. Am J Psychiatry 154: 165–172. [DOI] [PubMed] [Google Scholar]
- Aminoff M ( 2001): Parkinson's disease. Neurol Clin 19: 119–128. [DOI] [PubMed] [Google Scholar]
- Barnea A, Nottebohm F ( 1996): Recruitment and replacement of hippocampal neurons in young and adult chickadees: An addition to the theory of hippocampal learning. Proc Natl Acad Sci USA 93: 714–718. [DOI] [PMC free article] [PubMed] [Google Scholar]
- Carlesimo G, Caltagirone C, Gainotti G ( 1996): The Mental Deterioration Battery: Normative data, diagnostic reliability and qualitative analyses of cognitive impairment. The Group for the Standardization of the Mental Deterioration Battery. Eur Neurol 36: 378–384. [DOI] [PubMed] [Google Scholar]
- Cherubini A, Péran P, Caltagirone C, Sabatini U, Spalletta G ( 2009): Aging of subcortical nuclei: Microstructural, mineralization and atrophy modifications measured in vivo using MRI. NeuroImage 48: 29–36. [DOI] [PubMed] [Google Scholar]
- Corral M, Rodríguez M, Amenedo E, Sánchez J, Díaz F ( 2006): Cognitive reserve, age, and neuropsychological performance in healthy participants. Dev Neuropsychol 29: 479–491. [DOI] [PubMed] [Google Scholar]
- de Jong L, van der Hiele K, Veer I, Houwing J, Westendorp R, Bollen E, de Bruin PW, Middelkoop HA, van Buchem MA, van der Grond J ( 2008): Strongly reduced volumes of putamen and thalamus in Alzheimer's disease: An MRI study. Brain 131: 3277–3285. [DOI] [PMC free article] [PubMed] [Google Scholar]
- Deichmann R, Schwarzbauer C, Turner R ( 2004): Optimisation of the 3D MDEFT sequence for anatomical brain imaging:technical implications at 1.5 and 3 T. NeuroImage 21: 757–767. [DOI] [PubMed] [Google Scholar]
- Draper N, Smith H ( 1981): Applied Regression Analysis, 2nd ed. New York: Wiley. [Google Scholar]
- Epp J, Barker J, Galea L ( 2009): Running wild: Neurogenesis in the hippocampus across the lifespan in wild and laboratory‐bred Norway rats. Hippocampus 19: 1040–1049. [DOI] [PubMed] [Google Scholar]
- First MB, Gibbon M, Spitzer RL, Williams JB, Benjamin LS ( 1997a): Structured Clinical Interview for DSM‐IV Axis II Personality Disorders (SCID‐II). Washington, DC: American Psychiatric Press. [Google Scholar]
- First MB, Spitzer RL, Gibbon M, Williams JB ( 1997b): Structured Clinical Interview for DSM‐IV Axis I Disorders (SCID‐I), Clinician Version. Washington, DC: American Psychiatric Press. [Google Scholar]
- Folstein M, Folstein S, McHugh P ( 1975): “Mini‐mental state”. A practical method for grading the cognitive state of patients for the clinician. J Psychiatr Res 12: 189–198. [DOI] [PubMed] [Google Scholar]
- Fotenos A, Mintun M, Snyder A, Morris J, Buckner R ( 2008): Brain volume decline in aging: Evidence for a relation between socioeconomic status, preclinical Alzheimer disease, and reserve. Arch Neurol 65: 113–120. [DOI] [PubMed] [Google Scholar]
- Garibotto V, Borroni B, Kalbe E, Herholz K, Salmon E, Holtoff V, Sorbi S, Cappa SF, Padovani A, Fazio F, Perani D ( 2008): Education and occupation as proxies for reserve in aMCI converters and AD: FDG‐PET evidence. Neurology 71: 1342–1349. [DOI] [PubMed] [Google Scholar]
- Jacobs B, Schall M, Scheibel AB ( 1993): A quantitative dendritic analysis of Wernicke's area in humans. II. Gender, hemispheric, and environmental factors. J Comp Neurol 327: 97–111. [DOI] [PubMed] [Google Scholar]
- Kantarci K, Petersen RC, Boeve BF, Knopman DS, Weigand SD, O'Brien PC, Shiung MM, Smith GE, Ivnik RJ, Tangalos EG, Jack CR Jr. ( 2005): DWI predicts future progression to Alzheimer disease in amnestic mild cognitive impairment. Neurology 64: 902–904. [DOI] [PMC free article] [PubMed] [Google Scholar]
- Kaplan R, Cohen R, Moscufo N, Guttmann C, Chasman J, Buttaro M, Hall C, Wolfson L ( 2009): Demographic and biological influences on cognitive reserve. J Clin Exp Neuropsychol 31: 1–9. [DOI] [PubMed] [Google Scholar]
- Kempermann G, Kuhn H, Gage F ( 1997): More hippocampal neurons in adult mice living in an enriched enviroment. Nature 386: 493–495. [DOI] [PubMed] [Google Scholar]
- Klempin F, Kempermann G ( 2007): Adult hippocampal neurogenesis and aging. Eur Arch Psychiatry Clin Neurosci 257: 271–280. [DOI] [PubMed] [Google Scholar]
- McKhann G, Drachman D, Folstein M, Katzman R, Price D, Stadlan E ( 1984): Clinical diagnosis of Alzheimer's disease: Report of the NINCDS‐ADRDA Work Group under the auspices of Department of Health and Human Services Task Force on Alzheimer's Disease. Neurology 34: 939–944. [DOI] [PubMed] [Google Scholar]
- Measso G, Cavarzeran F, Zappalà G, Lebowitz B, Crook T, Pirozzolo F, Amaducci L, Massari D, Grigoletto F ( 1993): The Mini‐Mental State Examination: Normative study of an Italian random sample. Dev Neuropsychol 9: 77–85. [Google Scholar]
- Milgram N, Siwaktapp C, Araujo J, Head E ( 2006): Neuroprotective effects of cognitive enrichment. Ageing Res Rev 5: 354–369. [DOI] [PubMed] [Google Scholar]
- Milner B ( 1972): Disorders of learning and memory after temporal lobe lesions in man. Clin Neurosurg 19: 421–446. [DOI] [PubMed] [Google Scholar]
- Müller MJ, Greverus D, Weibrich C, Dellani PR, Scheurich A, Stoeter P, Fellgiebel A ( 2007): Diagnostic utility of hippocampal size and mean diffusivity in amnestic MCI. Neurobiol Aging 28: 398–403. [DOI] [PubMed] [Google Scholar]
- Mortimer JA, Snowdon DA, Markesbery W ( 2003): Head circumference, education and risk of dementia:findings from the nun study. J Clin Exp Neuropsychol 25: 671–679. [DOI] [PubMed] [Google Scholar]
- Nithianantharajah J, Hannan AJ ( 2009): The neurobiology of brain and cognitive reserve:Mental and physical activity as modulators of brain disorders. Prog Neurobiol 89: 369–382. [DOI] [PubMed] [Google Scholar]
- Péran P, Cherubini A, Luccichenti G, Hagberg G, Démonet JF, Rascol O, Celsis P, Caltagirone C, Spalletta G, Sabatini U ( 2009): Volume and iron content in basal ganglia and thalamus. Hum Brain Mapp 30: 2667–2675. [DOI] [PMC free article] [PubMed] [Google Scholar]
- Perneczky R, Pohl C, Bornschein S, Förstl H, Kurz A, Diehl‐Schmid J ( 2009): Accelerated clinical decline in well‐educated patients with frontotemporal lobar degenerations. Eur Arch Psychiatry Clin Neurosci 259: 362–367. [DOI] [PubMed] [Google Scholar]
- Roe C, Xiong C, Miller J, Morris J ( 2007): Education and Alzheimer disease without dementia support for the cognitive reserve hypothesis. Neurology 68: 223–228. [DOI] [PubMed] [Google Scholar]
- Satz P ( 1993): Brain reserve capacity on symptom onset after brain injury: A formulation and review of evidence for threshold theory. Neuropsychology 7: 273–295. [Google Scholar]
- Scarmeas N, Stern Y ( 2003): Cognitive reserve and lifestyle. J Clin Exp Neuropsychol 25: 625–633. [DOI] [PMC free article] [PubMed] [Google Scholar]
- Seo SW, Im K, Lee JM, Kim ST, Ahn HJ, Go SM, Kim SH, Na DL: Effects of demographic factors on cortical thickness in Alzheimer's disease. Neurobiol Aging (in press). 0000. [DOI] [PubMed] [Google Scholar]
- Shors T, Townsend D, Zhao M, Kozorovitskiy Y, Gould E ( 2002): Neurogenesis may relate to some but not all types of hippocampal‐dependent learning. Hippocampus 12: 578–584. [DOI] [PMC free article] [PubMed] [Google Scholar]
- Smith SM, De Stefano M, Jenkinson M, Mattews PM ( 2001): Normalised accurate measurement of longitudinal brain change. J Comput Assist Tomogr 25: 466–475. [DOI] [PubMed] [Google Scholar]
- Smith SM, Jenkinson M, Woolrich MW, Beckmann CF, Behrens TE, Johansen‐Berg H, Bannister PR, De Luca M, Drobnjak I, Flitney DE, Niazy RK, Saunders J, Vickers J, Zhang Y, De Stefano N, Brady JM, Matthews PM ( 2004): Advances in functional and structural MR image analysis and implementation as FSL. NeuroImage 23: S208–S219. [DOI] [PubMed] [Google Scholar]
- Squire L ( 2004): Memory systems of the brain: A brief history and current perspective. Neurobiol Learn Mem 82: 171–177. [DOI] [PubMed] [Google Scholar]
- Spoletini I. Cherubini A. Banfi G, Rubino IA, Peran P, Caltagirone C, Spalletta G: Hippocampi, thalami and accumbens microstructural damage in Schizophrenia: A volumetry, diffusion, and neuropsychological study. Schizophr Bull (in press). 2003. [DOI] [PMC free article] [PubMed] [Google Scholar]
- Stern Y ( 2002): What is cognitive reserve? Theory and research application of the reserve concept. Int Neuropsychol Soc 88: 448–460. [PubMed] [Google Scholar]
- Stern Y ( 2003): The concept of cognitive reserve: A catalyst for research. J Clin Exp Neuropsychol 25: 589–593. [DOI] [PubMed] [Google Scholar]
- Stern Y ( 2006): Cognitive reserve and Alzheimer disease. Alzheimer Dis Assoc Disord 20: 112–117. [DOI] [PubMed] [Google Scholar]
- Stern Y, Alexander G, Prohovnik I, Mayeux R ( 1992): Inverse relationship between education and parietotemporal perfusion deficit in Alzheimer's disease. Ann Neurol 32: 371–375. [DOI] [PubMed] [Google Scholar]
- van Praag H ( 2009): Exercise and the brain: Something to chew on. Trends Neurosci 32: 283–290. [DOI] [PMC free article] [PubMed] [Google Scholar]
- Wolf H, Hensel A, Kruggel F, Riedel‐Heller SG, Arendt T, Wahlund LO, Gertz HJ ( 2004): Structural correlates of mild cognitive impairment. Neurobiol Aging 25: 913–924. [DOI] [PubMed] [Google Scholar]
- Woolrich MW, Jbabdi S, Patenaude B, Chappell M, Makni S, Behrens T, Beckmann C, Jenkinson M, Smith SM ( 2009): Bayesian analysis of neuroimaging data in FSL. Neuroimage 45: S173–S186. [DOI] [PubMed] [Google Scholar]