

Abstract
The sulcal morphology of the human frontal lobe is highly variable. Although the structural images usually acquired in functional magnetic resonance imaging studies provide information about this interindividual variability, this information is only rarely used to relate structure and function. Here, we investigated the spatial relationship between posterior frontolateral activations in a task‐switching paradigm and the junction of the inferior frontal sulcus and the inferior precentral sulcus (inferior frontal junction, IFJ) on an individual‐subject basis. Results show that, although variable in terms of stereotaxic coordinates, the posterior frontolateral activations observed in task‐switching are consistently and reliably located at the IFJ in the brains of individual participants. The IFJ shares such consistent localization with other nonprimary areas as motion‐sensitive area V5/MT and the frontal eye field. Building on tension‐based models of morphogenesis, this structure–function correspondence might indicate that the cytoarchitectonic area underlying activations of the IFJ develops at early stages of cortical folding. Hum Brain Mapp, 2009. © 2007 Wiley‐Liss, Inc.
Keywords: frontal lobe, prefrontal cortex, cognitive control, magnetic resonance imaging
INTRODUCTION
The anatomy of the frontal lobe of the human brain is highly variable between subjects. This is true in terms of sulcal morphology [Cunningham,1892; Eberstaller,1890; Germann et al.,2005; Juch et al.,2005; Lohmann et al.,1999; Ono et al.,1990] and cytoarchitecture [Amunts et al.,1999; Rajkowska and Goldman‐Rakic,1995]. While cytoarchitectonic features are usually not identifiable on anatomical magnetic resonance images acquired in functional imaging studies (but see, e.g., Walters et al. [2003,2007] for anatomical high‐resolution studies), these images provide us with information about the gross morphology of individual brains. The importance of systematically analyzing this information was recently emphasized by Devlin and Poldrack [2007], Fadiga [2007], and Tzourio‐Mazoyer et al. [2007]. However, in the large majority of imaging studies activation maps are averaged across brains and displayed on magnetic resonance images of a single‐subject template brain (e.g., the “Colin27”; [Holmes et al.,1998]), or an average of multiple brains (e.g., the ICBM152 [http://www.loni.ucla.edu/ICBM; Toga et al.,2006], or the averaged brains of the subjects who participated in the study). This procedure, however, precludes an investigation of functional–anatomical relationships on an individual‐subject basis.
The considerable sulcal variability of the frontal lobe was already noted by Cunningham [1892], who was able to identify 27 variations of the pattern of the intermediate frontal sulcus in 69 hemispheres.1 More recently, Ono et al. [1990] published a comprehensive atlas of sulcal morphology. These authors described four patterns of the inferior precentral sulcus (arcuate, ramified, bayonet, y‐shaped) and four patterns of the inferior frontal sulcus (continuous, one to three interruptions). Ono et al. found a junction of the inferior precentral sulcus and the inferior frontal sulcus in ∼90% of cases.2
In addition to variations in the sulcal pattern, there is also a high degree of variability in the position of sulci when brains are brought into a common reference space. For example, Germann et al. [2005] have shown that the location of the inferior precentral sulcus may vary up to ∼2 cm in anterior–posterior direction.
Given this variability, the question arises how individual‐subject functional imaging activations are related to sulcal patterns. It is well known from cytoarchitectonic studies that there is a consistent relationship between sulci and cytoarchitectonic areas for a number of primary areas [e.g., Amunts et al.,2000; Geyer et al.,1996,1999; Rademacher et al.,1993]. Accordingly, primary visual activations in functional imaging studies have been found in the calcarine sulcus [e.g., Bridge et al.,2005; DeYoe et al.,1996; Sereno et al.,1995; Tootell et al.,1998] and primary motor activations in the central sulcus [e.g., Dechent and Frahm,2003; Geyer et al.,1996; Yousry et al.,1997]. Thus, for these primary areas there is a strong correspondence between sulcal morphology and functional imaging activations. However, it is less clear whether there might be a similar correspondence for nonprimary areas.
In one of the few functional imaging studies investigating sulcal‐functional relationships in higher‐order areas, Watson et al. [1993] employing positron emission tomography and structural magnetic resonance imaging (MRI) showed that while peak activations of the motion‐sensitive area V5 varied up to 27 mm between participants, the location of these activations was consistent in relation to the individual sulcal patterns: activations were most frequently located just posterior to the junction of the ascending limb of the inferior temporal sulcus and the lateral occipital sulcus. In a subsequent functional magnetic resonance imaging (fMRI) study, Dumoulin et al. [2000] showed that the junction of the ascending limb of the inferior temporal sulcus and the inferior temporal sulcus might be a more reliable landmark for the location of V5. Dumoulin et al. found that the individual activations were on average less than 10 mm from the junction of these sulci.
Another study investigating the relationship of sulcus morphology and functional imaging activations was conducted by Amiez et al. [2006]. In this study, Amiez et al. showed that the pattern of the superior precentral sulcus provided information about the location of activations in a saccade task and an arbitrary visuomotor mapping task: eye movement activations were consistently located in the ventral part of the superior precentral sulcus, whereas the arbitrary visuomotor mapping activations were located in the dorsal part of the superior precentral sulcus.
Thus, at least some nonprimary areas appear to be consistently associated with particular sulci. Currently it is not clear whether a similar correspondence exists for activations located at the junction of the inferior frontal sulcus and the inferior precentral sulcus (the so‐called IFJ; [Brass and von Cramon,2002]). Activations of this region were repeatedly found in previous imaging studies that employed task‐switching paradigms or the Stroop task (for a meta‐analysis, [see Derrfuss et al.,2005]). Employing variants of the task‐switching paradigm, Brass and von Cramon have shown that activity of the IFJ is correlated with efficient task preparation [Brass and von Cramon,2002] and that this activity cannot be explained solely by cue‐encoding processes [Brass and von Cramon,2004]. The studies by Brass and von Cramon [2002,2004] indicated that the IFJ plays a role in the updating of task representations. However, it is currently not known to which degree the IFJ is specifically involved in updating processes or whether it might play a more general role in the integration of working memory, phonological, and motor‐related information [Brass et al.,2005].
Based on studies that employed averaging across participants, Derrfuss et al. [2004] have suggested that activations of the IFJ are approximately located in the following coordinate range: x‐coordinates between ±30 and ±47, y‐coordinates3 between −1 and 10, and z‐coordinates between 27 and 40. This region encompasses parts of Brodmann areas 6, 9, and 44 according to the atlas of Talairach and Tournoux [1988].
Here, data from Brass and von Cramon [2004] were reanalyzed to investigate activations of the IFJ on an individual‐subject level. In particular, we were interested in the question whether individual sulcal morphologies would be predictive of functional activations. Furthermore, a number of subjects who participated in the study of Brass and von Cramon [2004] also participated in the studies by Derrfuss et al. [2004] and Zysset et al. [2006]. For these subjects, also the data from the latter two studies were re‐analyzed to investigate the stability of IFJ activations over time.
MATERIALS AND METHODS
Participants
Fourteen volunteers (8 females, 6 males) took part in the study by Brass and von Cramon [2004]. All were right‐handed as assessed by the Edinburgh Inventory [Oldfield,1971] and had normal or corrected‐to‐normal vision. Mean age was 24.4 years (SD 1.9). Written consent in accordance with the regulations of the local ethics committee was obtained from all participants. Five of the 14 participants also participated in a study by Derrfuss et al. [2004], three volunteers also participated in a study by Zysset et al. [2006].
Behavioral Paradigm
The task employed was a modified version of the task‐switching paradigm introduced by Sudevan and Taylor [1987]. Here, we give only a brief account of the task; for a more detailed description and a figure of the sequence of events in a trial, see Brass and von Cramon [2004]. Targets were numbers between 20 and 40 (excluding 30). On each trial, participants had to execute one of two tasks: either they had to decide whether the number was odd or even (parity task); or they had to decide whether the number was smaller or greater than 30 (magnitude task). Which task to execute was indicated by cues: the parity task was indicated by a diamond or a triangle, and the magnitude task was indicated by a square or an inverted triangle.
In double‐cue trials, two cues were presented consecutively before the target appeared. There were three different double‐cue conditions: a condition in which the same cue was presented twice (cue‐repetition condition), a condition in which the cue changed, but both cues indicated the same task (cue‐switch condition) and a condition in which the cue switched to indicate the other task (meaning‐switch condition). As the group‐level analysis by Brass and von Cramon [2004] was based on the contrast of meaning‐switch vs. cue‐switch trials, only these conditions were considered for our single‐subject analysis.
The experiment consisted of two blocks of 192 trials each; 192 double‐cue trials (64 cue repetition/64 cue switch/64 meaning switch) were randomly intermixed with 128 single‐cue trials (not reported here) and 64 null events. Trial length was 6 s.
MRI Data Acquisition
Imaging was performed using a 3‐T scanner (Medspec 30/100, Bruker, Ettlingen, Germany). Twenty axial slices (19.2 cm FOV, 64 × 64 matrix, 4 mm thickness, 1 mm spacing) parallel to the AC‐PC plane were acquired using a single‐shot gradient‐recalled EPI sequence (TR = 2,000 ms, TE = 30 ms, flip angle = 90°). Before the functional runs, 20 corresponding anatomical 2‐D MDEFT and EPI‐T1 slices were acquired. In a separate scanning session, high‐resolution T1‐weighted reference brain images were acquired from each participant. Stimuli were presented using a head‐mounted display with a resolution of 1,024 × 768 and a refresh rate of 60 Hz.
Identification of Sulci
Orthogonal sections of the high‐resolution T1‐weighted brain scans, 3‐D renderings, and white‐matter segmentations were used to identify the central sulcus, the anterior ascending ramus of the Sylvian fissure, the inferior precentral sulcus, and the inferior frontal sulcus in all brains. The central sulcus was identified using the criteria of Yousry et al. [1997] and the anterior ascending ramus of the Sylvian fissure as the lateral continuation of the circular sulcus of the insula. The inferior precentral sulcus was defined as the first major sulcus anterior and approximately parallel to the inferior part of the central sulcus [Ebeling et al.,1989]. The inferior frontal sulcus was identified as the first major sulcus running in a caudorostral direction and lying immediately dorsal to the anterior ascending ramus of the Sylvian fissure.
Imaging Analysis
The functional magnetic resonance imaging (fMRI) data were processed with LIPSIA software [Lohmann et al.,2001]. This software package contains tools for preprocessing, registration, statistical evaluation, and presentation of fMRI data. First, the functional data were corrected for movement artifacts. Then, the temporal offset differences between slices acquired in one scan were corrected using a spline interpolation algorithm. A temporal high‐pass filter with a cutoff frequency of 80 s was used for baseline correction of the signal.
Anatomical registration for each participant was done in three steps: first, we computed a transformation matrix containing three rotational and three translational parameters that optimized the match between the 2‐D MDEFT/EPI‐T1 slices and the 3‐D reference data set. Then, this transformation matrix was normalized to standard Talairach brain size [Talairach and Tournoux,1988] by applying linear scaling. Finally, the normalized transformation matrix was applied to the functional data using trilinear interpolation. Slice gaps were interpolated to generate output data with a spatial resolution of 3 × 3 × 3 mm3.
The statistical evaluation was based on a least‐squares estimation using the general linear model for serially autocorrelated observations [Aguirre et al.,1997; Friston et al.,1995; Worsley and Friston,1995; Zarahn et al.,1997]. The design matrix was generated utilizing a synthetic hemodynamic response function with a variable delay [Friston et al.,1998]. The model equation, including the observation data, the design matrix, and the error term, was convolved with a Gaussian kernel with a dispersion of 4 s FWHM to account for the temporal autocorrelation [Worsley and Friston,1995]. Subsequently, z maps for the contrast of meaning‐switch vs. null‐event trials were computed for each participant.
In the next analysis step, the T1‐weighted individual MR data were brought into Talairach space and white‐matter segmentations were performed. We used these white‐matter segmentations and the T1 volumes to identify the left inferior precentral sulcus, left inferior frontal sulcus, and, if present, their junction in every brain. Then, we overlaid the individual z maps on the corresponding anatomical data and tried to localize an activation that was located at or close to the junction of the inferior precentral sulcus and the inferior frontal sulcus.
When such an activation was identified, we adjusted the significance threshold in such a way that this activation had a volume of 2,000 mm3. That is, instead of choosing the same significance threshold for every participant, we decided to choose a significance threshold that resulted in a predefined activation volume around the IFJ peak. In the present study, this approach was superior to thresholding at a common significance level since we wanted to compare the localization of these activations across participants. Thus, we were less interested in a common significance threshold constant across participants, but rather in a constant volume of activations. In addition, the volume‐based threshold assured that each participant contributed the same volume to a map displaying the overlap of IFJ activations. The 2,000 mm3 volume was chosen based on an approximation of the volume of the IFJ as resulting from the coordinate range described above (17 mm × 11 mm × 13 mm = 2,431 mm3). The selection of this volume does not imply that the cytoarchitectonic area underlying activations of the IFJ has approximately the same volume. Instead, the chosen volume was a pragmatic decision given that we currently do not know what the exact volume of this area might be. It was selected large enough to likely include the putative underlying cytoarchitectonic area, but small enough not to include major parts of neighboring functional areas.
As we identified IFJ activations based on a null‐event contrast, we also computed time courses to ascertain differences between the meaning‐switch and the cue‐switch condition. These trial‐averaged time courses for the meaning‐switch, the cue‐switch, and the null‐event trials were extracted from the peak coordinate in the IFJ and expressed in percent signal change units.
The activations were displayed in three ways on the individual brains. First, activations were shown on renderings of white‐matter segmentations of T1‐weighted MRI scans. These figures allow an identification of the sulci of the frontolateral cortex and give a better idea of the localization of the activation volume. Second, we traced the outline of the activation volume and the depths of the inferior precentral sulcus and the posterior part of the inferior frontal sulcus on the white‐matter segmentations and displayed these in schematic line drawings. Third, we show an axial and a sagittal slice through the peak activation in the IFJ. These figures enable the identification of the peak location relative to the surrounding sulci and the localization of the activations in terms of Talairach space.
Laterality Analysis
In a meta‐analysis of switching studies [Derrfuss et al.,2005], we found significant clustering of activations at the left and the right IFJ. However, in the study by Brass and von Cramon [2004] significant IFJ activity was found only in the left hemisphere. Thus, we decided to also inspect right‐hemispheric single‐subject IFJ activations to gain a better understanding of laterality effects in the double‐cueing paradigm. As Subject 12 showed reliable IFJ activation only in the right hemisphere, this subject was not included in the laterality analysis.
In a first step, right IFJ activations were identified analogue to those on the left. The mean right IFJ peak and the distance to the left IFJ peak (absolute x values) were computed. Then, percent signal change values were extracted from the left and right IFJ peak voxels for the meaning‐switch condition and the cue‐switch condition. In a third step, the maximum difference between these two conditions in a time window between 5 and 7 s was identified for each participant. These maximum percent signal change differences were then tested for significance.
Reliability Analysis
A subset of six subjects who participated in the study by Brass and von Cramon [2004] also participated in the study by Derrfuss et al. [2004]. In the latter study, participants performed a task‐switching paradigm, an n‐back task, and a Stroop task (for details, [see Derrfuss et al.,2004]). Three further subjects also participated in a study by Zysset et al. [2006]. This study employed a matching version of the Stroop task (for details, [see Zysset et al.,2006]). The fMRI measurements were performed between August 2002 and March 2004.
To investigate the reliability of IFJ activations, we reanalyzed the data from the participants who took part in two or more of the above studies. This was done with the same parameters employed for the analysis of the data from Brass and von Cramon [2004]. Again, the condition of interest was contrasted with null events. Subsequently, the IFJ peak was identified and the volume around this peak was adjusted to correspond as closely as possible to 2,000 mm3 (participant 13 was excluded from this analysis because his IFJ activation was continuous with other activations and, thus, it was not possible to define a volume corresponding to 2,000 mm3).
RESULTS
A junction of the inferior precentral sulcus and the inferior frontal sulcus (IFJ) was identified in 13 of 14 hemispheres. In 5 hemispheres, the two sulci were connected at their fundi (Subjects 1, 2, 3, 9, 10), in 7 hemispheres the inferior precentral sulcus was slightly deeper than the inferior frontal sulcus (∼2–3 mm; Subjects 4, 7, 8, 11, 12, 13, 14), and in one hemisphere the inferior precentral sulcus was substantially deeper than the inferior frontal sulcus (Subject 5). Subject 6 had a small gyral bridge between the inferior precentral sulcus and the inferior frontal sulcus and, thus, no sulcal junction.
When the z maps were overlaid on the corresponding anatomical data sets, we were able to locate an activation at the left IFJ in 11 of 13 participants (Subjects 1–10, 13, 14). Two participants did not show an activation of the left IFJ. One of them (Subject 11) still had an activation in the left inferior precentral sulcus; it was, however, located further superior, at the dorsal‐most part of the inferior precentral sulcus. Another participant (Subject 12) had no activation of the left IFJ, but of the right IFJ.
Figure 1 and Supplementary Figure 1 display the IFJ activations on white‐matter segmentations of individual brains. Figure 2 displays schematic drawings of these activations and Figure 3 depicts the individual peak locations and the outline of the 2,000 mm3 activation volumes on the individual anatomies of six participants (Table I gives the peak locations for all participants). Overall, the peak was located in the inferior precentral sulcus in 86% of participants. The peak was located in the most posterior part of the inferior frontal sulcus in the remaining two participants (14%).
Figure 1.
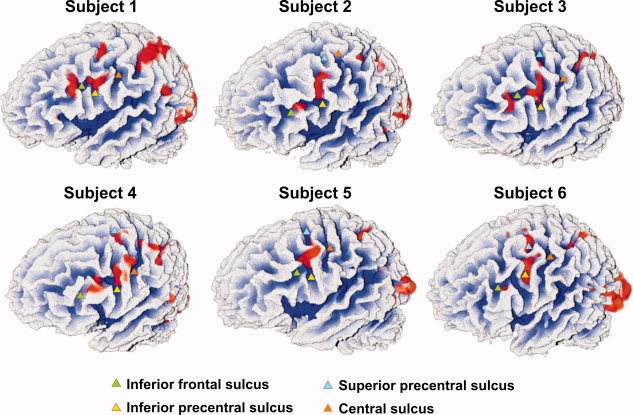
Left frontolateral views of white‐matter segmentations of six subjects with functional imaging maps overlaid in red. Relevant sulci are highlighted by triangles. Note the consistent activation at the junction of the inferior precentral sulcus and the inferior frontal sulcus.
Figure 2.
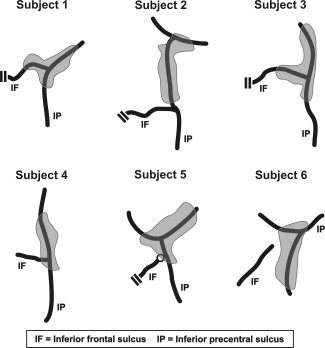
Schematic views of IFJ activations. IFJ activations are shown in grey; black lines indicate the fundi of the inferior precentral and inferior frontal sulci. Note: Double lines indicate truncations of the inferior frontal sulcus. What is marked as inferior frontal sulcus in Subject 4 would be considered as a part of the inferior precentral sulcus following the scheme of Germann et al. [2005]. The circle at the junction of the inferior precentral sulcus and the inferior frontal sulcus in Subject 5 denotes a clear in‐depth separation of these sulci.
Figure 3.
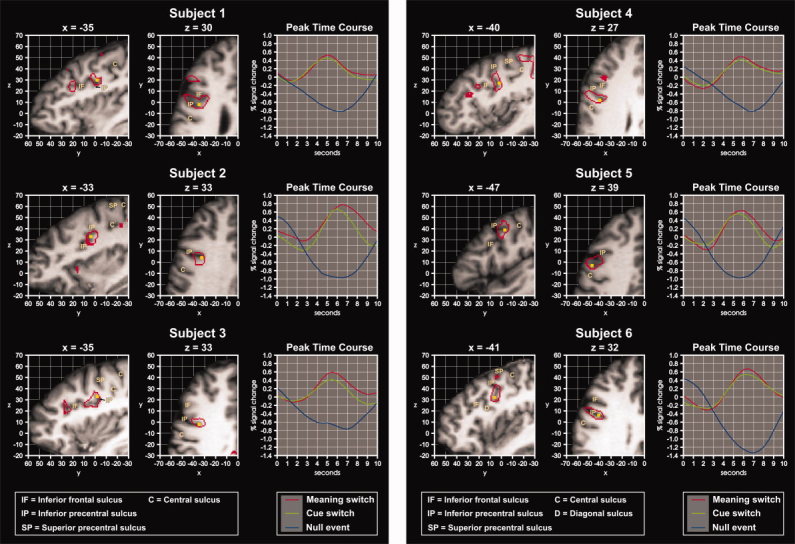
Sagittal and axial slices through the IFJ peak for six individuals. The activation peak is marked by a yellow square, the volume of activation by a red outline. On the right, time‐course analyses for the activation peaks are shown.
Table I.
Inferior frontal junction peaks and z thresholds for all participants
| Subject | IFJ peak | z threshold |
|---|---|---|
| 1 | −35, −2, 30 | 6.5 |
| 2 | −33, 4, 33 | 5.2 |
| 3 | −35, −2, 33 | 6.1 |
| 4 | −40, 2, 27 | 3.9 |
| 5 | −47, −3, 39 | 7.1 |
| 6 | −41, 6, 32 | 7.2 |
| 7 | −41, 0, 33 | 4.0 |
| 8 | −41, 1, 27 | 3.9 |
| 9 | −29, 1, 33 | 2.6 |
| 10 | −38, −4, 36 | 4.0 |
| 11 | −47, 0, 48 | 3.3 |
| 12a | 37, 5, 27 | 4.1 |
| 13 | −35, 11, 33 | 5.1 |
| 14 | −51, 6, 30 | 6.0 |
| Mean | −39, 2, 32 |
Note: The z thresholds were adjusted such that the IFJ activation peaks were surrounded by a 2,000 mm3 activation volume (see Methods).
Not included in the computation of the mean.
Because the activations described earlier were identified in contrasts against null events, we also analyzed the time‐courses of the meaning‐switch, the cue‐switch, and the null‐event condition for the IFJ peaks (Fig. 3). The meaning‐switch condition showed a higher percent signal change in all participants.
The comparison of the Talairach coordinates of the peak locations with the IFJ range as originally defined based on group studies (i.e., x between −30 and −47, y between −1 and 10, and z between 27 and 40) showed that the individual IFJ peaks were located within this range in 50% of participants. In six of the seven remaining participants, the IFJ peak was 4 mm or less outside this range. The peak of Subject 11 was located 8 mm above the upper z limit. The mean of the peak activations, excluding the participant with the right‐lateralized activation, was −39, 2, 32. The standard deviations of the peak locations in x‐, y‐, and z‐direction were ±6, ±4, and ±5 mm, respectively. The ranges in x‐, y‐, and z‐direction were 22 mm, 15 mm, and 21 mm (12 mm in z‐direction without Subject 11). An overlap analysis showed that maximally five out of 13 z maps overlapped in a given voxel (Fig. 4).
Figure 4.
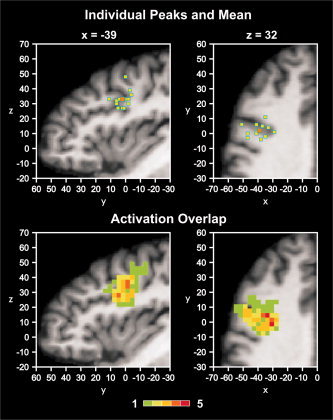
Upper panel: IFJ peak activations of all individuals (yellow squares) overlaid onto an individual brain in Talairach space. Anatomical slices were chosen to correspond to the mean peak location (orange square). Lower panel: Overlap of IFJ activation volumes. The color bar denotes the number of z maps overlapping at a given voxel. There was a maximum overlap of 5 z maps.
Laterality Analysis
An activation of the right IFJ could be identified in all of the 13 subjects included in the laterality analysis. The mean right IFJ peak was located at 42, 2, 31. For absolute x values, the distance between the left and the right IFJ peak was on average 8 mm. At the left IFJ, the percent signal change difference between the meaning‐switch condition and the cue‐switch condition was on average 0.15% (SD = 0.1%). A t test showed that the differences between these two conditions were significantly different from zero (t(12) = 5.5, P < 0.0001). At the right IFJ, the difference between the meaning‐switch condition and the cue‐switch condition was on average 0.07% (SD = 0.17%). The percent signal change differences at the right IFJ were not significantly different from zero (t(12) = 1.4, P < 0.18). A paired t test showed that the signal change differences on the left tended to be higher than on the right (t(12) = 2.1, P < 0.06). An interesting finding was that the variability was considerably higher on the right. In fact, four participants (Subjects 4, 8, 10, and 14) showed higher percent signal changes for the cue‐switch condition in the right hemisphere. When these participants were excluded, the mean percent signal change difference on the right was very similar to the one on the left (M = 0.16%, SD = 0.08%).
Reliability Analysis
Table II and Figure 5 display the results of the reliability analysis. Mean IFJ peak distance between tasks averaged over all subjects was 7.4 mm. Four subjects showed high reliability of the IFJ peak location with distances below 5.4 mm. Such distances approximately correspond to a shift of 1 voxel diagonally (5.2 mm at a 3 × 3 × 3 resolution). Two subjects (Subjects 1 and 2) had peak distances of 11.2and 14.1 mm, respectively. A more detailed inspection of these latter two subjects revealed that Subject 1 had a sub‐peak within the IFJ activation volume in the task‐switching paradigm of Study 2 located at −32, 1, 27. This peak had a z score of 4.2 (in comparison to 4.5 of the main peak at −44, 1, 33). This sub‐peak was very similar to the peaks observed in the other two tasks. Using this peak for the computation of the mean peak distance reduces this distance for Subject 1 to 5.2 mm. Similarly, Subject 2 had a sub‐peak in the Stroop task of Study 3 at −33, 4, 33. This peak had a z score of 5.3 (in comparison to 6.1 of the peak at −42, 13, 27). The location of the sub‐peak wasidentical to the location of the peak in Study 1. No further sub‐peaks could be identified in Subjects 1 and 2. Consideration of the sub‐peaks for Subjects 1 and 2 reduces the mean peak distance averaged across subjects and tasks to 4 mm.
Table II.
IFJ activation peaks for the six subjects who participated in multiple studies
| Subject | Study 1 (task switching) | Study 2 (task switching) | Study 2 (Stroop) | Study 3 (Stroop) | Mean peak distance |
|---|---|---|---|---|---|
| 1 | −35, −2, 30 | 44, 1, 33 | −29, 1, 27 | — | 11.2 |
| 2 | −33, 4, 33 | — | — | −42, 13, 27 | 14.1 |
| 3 | −35, −2, 33 | −38, −2, 30 | −38, 1, 27 | — | 5.3 |
| 4 | −40, 2, 27 | −40, 5, 33 | −43, 5, 30 | −41, 5, 27 | 4.8 |
| 6 | −41, 6, 32 | −41, 3, 29 | −38, 3, 35 | — | 5.4 |
| 11 | −47, 0, 48 | −50, −3, 48 | −50, −3, 48 | −50, 0, 45 | 3.5 |
Figure 5.
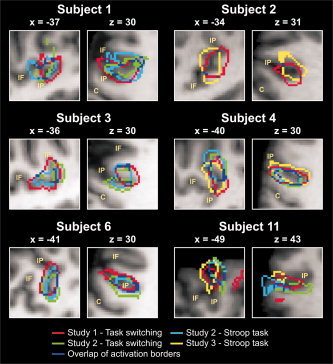
IFJ activations for the six subjects who participated in multiple studies. Volumes of IFJ activations are indicated by colored outlines and are overlaid onto the individual anatomies. For each subject, on the left a sagittal slice is shown and on the right an axial slice. The sulcus abbreviations are explained in Figure 3.
DISCUSSION
The present study investigated the relationship of fMRI activations and sulcal morphology in the lateral frontal lobe on an individual‐subject basis. Data from a task‐switching study [Brass and von Cramon,2004] were reanalyzed to assess the consistency of activations in the posterior frontolateral cortex and to determine the relationship of these activations to individual morphologies of the inferior precentral sulcus and the inferior frontal sulcus. We found a junction of the inferior frontal sulcus and the inferior precentral sulcus (IFJ) in 13 of 14 brains. Twelve of these 13 participants (86%) had an activation that was located at the individually identified IFJ. Additional analyses for a subset of these participants showed that IFJ peak activations were stable across time. Taken together, in the participants included in our study IFJ activations can be reliably identified based on the analysis of sulcal morphology.
Structural–Functional Relationships
The results of the present study indicate that posterior frontolateral activations in the task‐switching paradigm in individual subjects bear a consistent relationship to individual sulcal morphology. These data supplement results from earlier studies in other brain regions that have shown a similarly consistent structural–functional correspondence for temporooccipital (V5; [Dumoulin et al.,2000; Watson et al.,1993]) and dorsal frontal areas (frontal eye fields and dorsal premotor cortex; [Amiez et al.,2006]). These results suggest that the cytoarchitectonic areas responsible for the functional activations in the tasks investigated also bear consistent relationships to the sulci. In a cytoarchitectonic study, Malikovic et al. [2006] found that hOc5/V5 had the highest probability (in 65% of the hemispheres) of being located in the anterior occipital sulcus (the ascending limb of the inferior temporal sulcus in the study of Dumoulin et al.). This localization corresponds well with the results of Dumoulin et al. who found the anterior occipital sulcus most consistently activated (in 53% of the hemispheres). In both the cytoarchitectonic study by Malikovic et al. and the imaging study by Dumoulin et al. V5 was less likely located in the sulci adjacent to the anterior occipital sulcus. Furthermore, evidence has been provided that the frontal eye field as defined in high‐resolution fMRI [Rosano et al.,2002], chemoarchitectonics [Rosano et al.,2003], and cytoarchitectonics [Schmitt et al.,2005] is located in the superior precentral sulcus.
These results indicate that not only primary (e.g., primary visual or motor cortex), but also some non‐primary areas like V5 and the frontal eye field are consistently associated with particular sulci. Such an association between cytoarchitecture and sulcal morphology could be explained by tension‐based models of morphogenesis [Van Essen,1997; Hilgetag and Barbas,2006] which assume that white‐matter development is a critical factor in determining cortical folding. Following these models, it could be argued that areas which form or receive connections early during ontogeny tend to be those areas where the first sulci will develop. Thus, a consistent colocalization of cytoarchitectonic areas and sulci might emerge. It is interesting to note in this context that the sulci found to include primary areas are among the first to develop in ontogeny. For example, Chi et al. [1977] found that the calcarine sulcus develops around gestational week 16 and the central sulcus around week 20. Also, the inferior and superior precentral sulci develop relatively early (week 24; [Chi et al.,1977]). In comparison, sulci delineating secondary frontal gyri develop around weeks 32–35, and sulci delineating tertiary frontal gyri develop around weeks 36–39 [Chi et al.,1977]. Likely, there will be less consistent associations with cytoarchitectonic areas for the late‐developing secondary and tertiary sulci (e.g., see the results of Amunts et al. [1999] for the diagonal sulcus).
In the present study, a consistent relationship between sulcal morphology and functional imaging activations was observed for the junction of the inferior frontal sulcus and the inferior precentral sulcus. While the activation peaks were variable in terms of their Talairach coordinates, they were consistently found at the IFJ of individual participants. Activation volumes were mostly confined to the dorsal part of the inferior precentral sulcus, but sometimes reached the most posterior part of the inferior frontal sulcus and more ventral parts of the inferior precentral sulcus. This result suggests that the cytoarchitectonic area underlying activations of the IFJ might be mainly located in the part of the inferior precentral sulcus above the junction with the inferior frontal sulcus, with an extension into the inferior frontal sulcus or the ventral part of the inferior precentral sulcus in some brains. This is reminiscent of the results for V5 which was most consistently located in the anterior occipital sulcus but could also be found in sulci adjacent to the anterior occipital sulcus.
Laterality
A number of switching studies have reported IFJ activations in the right hemsiphere (for review, [see Derrfuss et al.,2005]). However, the study by Brass and von Cramon [2004] found only left‐lateralized IFJ activity. The present study shows that this result was most likely due to a sub‐group of four participants who had higher percent signal change values for the cue‐switch condition in comparison with the meaning‐switch condition in the right hemisphere. It is currently unclear whether this might be a result of the specific strategy employed by these participants or might reflect a different cortical organization in these participants. Also, it is an open question whether this pattern of results would be replicable. Thus, the current results offer some insights into why a left‐lateralization was found by Brass and von Cramon [2004], but clearly further studies will be necessary to better understand the functional role of the right IFJ.
Reliability
The reliability of IFJ activations was good. When sub‐peaks were considered in two subjects who showed less consistent peak locations, mean peak distance could be reduced to 4 mm. This result is remarkable considering that measurements were separated by at least 4 months (up to 19 months for the subjects who participated in Study 1 and Study 3) and that different tasks were employed (variants of the task‐switching paradigm and the Stroop task). Thus, our results are in line with another study that provided evidence for a high long‐term reliability of fMRI data [Aron et al.,2006]. A limitation of our analysis is that conditions were contrasted against null events. We chose this way to analyze the data as the event‐related designs employed in the studies analyzed here did not have enough power to show between‐condition differences for all participants (in particular, Study 2 employed event‐related designs with task lengths of only around 15 min). However, we inspected timelines to ascertain that the IFJ activations were generally not solely due to low‐level processes but were modulated by experimental conditions. Nevertheless, future single‐subject studies preferably employing blocked designs might be useful to provide evidence for the reliability of IFJ activations in contrasts against higher‐level baselines.
Limits of Localization
When one considers the localization of activations in fMRI studies in relation to anatomical structures, the question of localization accuracy arises. The within‐plane resolution of the EPI sequence in the present study was 3 mm, representing the upper limit of spatial resolution. In addition, there are other factors which are likely to have had an influence on the accuracy of the localization of activations. One such factor is that with gradient‐echo sequences the strongest signal changes are often observed in draining veins, not in neural tissue [e.g., Lai et al.,1993]. Turner [2002: p. 1062] estimated that “an activated cortical area of 100 mm2 will generate an oxygenation change in venous blood that extends without dilution along the vein no more than 4.2 mm beyond the edge of the activated area. At greater distances along the draining vein this oxygenation change will be diluted.” In a study comparing gradient‐echo BOLD at 1.5 T with electrophysiological recordings in the macaque, Disbrow et al. [2000] found that the maximal mean displacement of the BOLD center of volume was 9.5 mm in a given direction of space. In addition, one has to consider that the registration of the functional data to the anatomical data will be less than perfect and that this will introduce additional small errors in localization.
Taken together, in the present study, the active neural tissue might be up to 2 or 3 voxels away from the observed activation peak. Given this spatial resolution, it appears save to conclude that the activation volumes in our study were located at the IFJ. However, we would generally consider it problematic to draw conclusions about whether the posterior or the anterior bank of the precentral sulcus was activated in a given participant.
CONCLUSION
Based on group studies, we have previously argued that the junction region of the inferior frontal sulcus and the inferior precentral sulcus, the IFJ, is consistently involved in updating processes [Brass and von Cramon,2002,2004; Derrfuss et al.,2004]. Here, we have shown that posterior frontolateral activations in a task‐switching paradigm are consistently and reliably located at the IFJ of individual participants. Thus, the IFJ is suggested to be similar to the superior precentral sulcus in that it indicates the location of a functionally defined area. This structure–function correspondence could be explained by tension‐based models of morphogenesis. In addition, preliminary results from cytoarchitectonic analyses [Amunts and von Cramon,2006] suggest that the functionally defined IFJ region might have a microstructural correspondent not labeled in classical cytoarchitectonic maps like that of Brodmann [1909]. Structure–function relationships like the one observed in the present study become increasingly relevant in the context of transcranial magnetic stimulation studies that use structural MRI scans to identify stimulation sites.
Supporting information
Additional Supporting Information may be found in the online version of this article.
Supporting Information Figure 1
Acknowledgements
We would like to thank Stefan Zysset and Derek Ott for their help in the realization of this study.
Footnotes
Note, however, that Cunningham may have been somewhat biased to overestimate the variability of the intermediate frontal sulcus. He viewed this variability as supporting his notion that the intermediate frontal sulcus is not homologous to the principal sulcus of macaques as proposed 2 years earlier by Eberstaller. For a more recent investigation of the intermediate frontal sulcus focusing on sulcal basins, see Huttner et al. [2005].
Note, however, that it has recently been suggested that in many cases the most posterior aspect of the inferior frontal sulcus might be a part of the inferior precentral sulcus [Germann et al.,2005].
Please note that there is a printing error in our 2004 publication. The y‐coordinates should have read “−1 to 10,” not “1 to 10.”
REFERENCES
- Aguirre GK,Zarahn E,D'Esposito M( 1997): Empirical analyses of BOLD fMRI statistics. II. Spatially smoothed data collected under null‐hypothesis and experimental conditions. Neuroimage 5(3): 199–212. [DOI] [PubMed] [Google Scholar]
- Amiez C,Kostopoulos P,Champod AS,Petrides M( 2006): Local morphology predicts functional organization of the dorsal premotor region in the human brain. J Neurosci 26(10): 2724–2731. [DOI] [PMC free article] [PubMed] [Google Scholar]
- Amunts K,von Cramon DY( 2006): The anatomical segregation of the frontal cortex: What does it mean for function? Cortex 42(4): 525–528. [DOI] [PubMed] [Google Scholar]
- Amunts K,Schleicher A,Burgel U,Mohlberg H,Uylings HB,Zilles K( 1999): Broca's region revisited: Cytoarchitecture and intersubject variability. J Comp Neurol 412(2): 319–341. [DOI] [PubMed] [Google Scholar]
- Amunts K,Malikovic A,Mohlberg H,Schormann T,Zilles K( 2000): Brodmann's areas 17 and 18 brought into stereotaxic space‐where and how variable? Neuroimage 11(1): 66–84. [DOI] [PubMed] [Google Scholar]
- Aron AR,Gluck MA,Poldrack RA( 2006): Long‐term test‐retest reliability of functional MRI in a classification learning task. Neuroimage 29(3): 1000–1006. [DOI] [PMC free article] [PubMed] [Google Scholar]
- Brass M,von Cramon DY( 2002): The role of the frontal cortex in task preparation. Cereb Cortex 12(9): 908–914. [DOI] [PubMed] [Google Scholar]
- Brass M,von Cramon DY( 2004): Decomposing components of task preparation with functional MRI. J Cogn Neurosci 16(4): 609–620. [DOI] [PubMed] [Google Scholar]
- Brass M,Derrfuss J,Forstmann B,von Cramon DY ( 2005): The role of the inferior frontal junction area in cognitive control. Trends Cogn Sci 9(7): 314–316. [DOI] [PubMed] [Google Scholar]
- Bridge H,Clare S,Jenkinson M,Jezzard P,Parker AJ,Matthews PM( 2005): Independent anatomical and functional measures of the V1/V2 boundary in human visual cortex. J Vis 5(2): 93–102. [DOI] [PubMed] [Google Scholar]
- Brodmann K( 1909): Vergleichende Lokalisationslehre der Großhirnrinde in ihren Prinzipien dargestellt auf Grund des Zellenbaues. Leipzig: Barth. [Google Scholar]
- Chi JG,Dooling EC,Gilles FH(1977): Gyral development of the human brain. Ann Neurol 1(1): 86–93. [DOI] [PubMed] [Google Scholar]
- Cunningham DJ( 1892): Contribution to the Surface Anatomy of the Cerebral Hemispheres (Cunningham Memoirs, No. VII). Dublin: Royal Irish Academy. [Google Scholar]
- Dechent P,Frahm J( 2003): Functional somatotopy of finger representations in human primary motor cortex. Hum Brain Mapp 18(4): 272–283. [DOI] [PMC free article] [PubMed] [Google Scholar]
- Derrfuss J,Brass M,von Cramon DY( 2004): Cognitive control in the posterior frontolateral cortex: Evidence from common activations in task coordination, interference control, and working memory. Neuroimage 23(2): 604–612. [DOI] [PubMed] [Google Scholar]
- Derrfuss J,Brass M,Neumann J,von Cramon DY( 2005): Involvement of the inferior frontal junction in cognitive control: Meta‐analyses of switching and Stroop studies. Hum Brain Mapp 25: 22–34. [DOI] [PMC free article] [PubMed] [Google Scholar]
- Devlin JT,Poldrack RA( 2007): In praise of tedious neuroanatomy. Neuroimage 37(4): 1033–1041. [DOI] [PMC free article] [PubMed] [Google Scholar]
- DeYoe EA,Carman GJ,Bandettini P,Glickman S,Wieser J,Cox R,Miller D,Neitz J( 1996): Mapping striate and extrastriate visual areas in human cerebral cortex. Proc Natl Acad Sci USA 93(6): 2382–2386. [DOI] [PMC free article] [PubMed] [Google Scholar]
- Disbrow EA,Slutsky DA,Roberts TP,Krubitzer LA( 2000): Functional MRI at 1.5 tesla: A comparison of the blood oxygenation level‐dependent signal and electrophysiology. Proc Natl Acad Sci USA 97(17): 9718–9723. [DOI] [PMC free article] [PubMed] [Google Scholar]
- Dumoulin SO,Bittar RG,Kabani NJ,Baker CL,Le Goualher G,Pike GB,Evans AC( 2000): A new anatomical landmark for reliable identification of human area V5/MT: A quantitative analysis of sulcal patterning. Cereb Cortex 10(5): 454–463. [DOI] [PubMed] [Google Scholar]
- Ebeling U,Steinmetz H,Huang YX,Kahn T( 1989): Topography and identification of the inferior precentral sulcus in MR imaging. Am J Roentgenol 153(5): 1051–1056. [DOI] [PubMed] [Google Scholar]
- Eberstaller O( 1890): Das Stirnhirn. Ein Beitrag zur Anatomie der Oberfläche des Grosshirns. Wien & Leipzig: Urban & Schwarzenberg. [Google Scholar]
- Fadiga L( 2007): Functional magnetic resonance imaging: Measuring versus estimating. Neuroimage 37(4): 1042–1044. [DOI] [PubMed] [Google Scholar]
- Friston KJ,Holmes AP,Worsley KJ,Poline J‐P,Frith CD,Frackowiak RSJ( 1995): Statistical parametric maps in functional imaging: A general linear approach. Hum Brain Mapp 2: 189–210. [Google Scholar]
- Friston KJ,Fletcher P,Josephs O,Holmes A,Rugg MD,Turner R( 1998): Event‐related fMRI: characterizing differential responses. Neuroimage 7(1): 30–40. [DOI] [PubMed] [Google Scholar]
- Germann J,Robbins S,Halsband U,Petrides M( 2005): Precentral sulcal complex of the human brain: Morphology and statistical probability maps. J Comp Neurol 493(3): 334–356. [DOI] [PubMed] [Google Scholar]
- Geyer S,Ledberg A,Schleicher A,Kinomura S,Schormann T,Burgel U,Klingberg T,Larsson J,Zilles K,Roland PE( 1996): Two different areas within the primary motor cortex of man. Nature 382(6594): 805–807. [DOI] [PubMed] [Google Scholar]
- Geyer S,Schleicher A,Zilles K( 1999): Areas 3a, 3b, and 1 of human primary somatosensory cortex. Neuroimage 10(1): 63–83. [DOI] [PubMed] [Google Scholar]
- Hilgetag CC,Barbas H( 2006): Role of mechanical factors in the morphology of the primate cerebral cortex. PLoS Comput Biol 2(3): e22. doi:10.1371/journal.pcbi.0020022. [DOI] [PMC free article] [PubMed] [Google Scholar]
- Holmes CJ,Hoge R,Collins L,Woods R,Toga AW,Evans AC. ( 1998): Enhancement of MR images using registration for signal averaging. J Comput Assist Tomogr 22(2): 324–33. [DOI] [PubMed] [Google Scholar]
- Huttner HB,Lohmann G,von Cramon DY( 2005): Magnetic resonance imaging of the human frontal cortex reveals differential anterior‐posterior variability of sulcal basins. Neuroimage 25(2): 646–651. [DOI] [PubMed] [Google Scholar]
- Juch H,Zimine I,Seghier ML,Lazeyras F,Fasel JH( 2005): Anatomical variability of the lateral frontal lobe surface: Implication for intersubject variability in language neuroimaging. Neuroimage 24(2): 504–514. [DOI] [PubMed] [Google Scholar]
- Lai S,Hopkins AL,Haacke EM,Li D,Wasserman BA,Buckley P,Friedman L,Meltzer H,Hedera P,Friedland R( 1993): Identification of vascular structures as a major source of signal contrast in high resolution 2D and 3D functional activation imaging of the motor cortex at 1.5T: Preliminary results. Magn Reson Med 30(3): 387–392. [DOI] [PubMed] [Google Scholar]
- Lohmann G,von Cramon DY,Steinmetz H( 1999): Sulcal variability of twins. Cereb Cortex 9(7): 754–763. [DOI] [PubMed] [Google Scholar]
- Lohmann G,Muller K,Bosch V,Mentzel H,Hessler S,Chen L,Zysset S,von Cramon DY( 2001): LIPSIA—A new software system for the evaluation of functional magnetic resonance images of the human brain. Comput Med Imaging Graph 25(6): 449–457. [DOI] [PubMed] [Google Scholar]
- Malikovic A,Amunts K,Schleicher A,Mohlberg H,Eickhoff SB,Wilms M,Palomero‐Gallagher N,Armstrong E,Zilles K( 2006): Cytoarchitectonic analysis of the human extrastriate cortex in the region of V5/MT+: A probabilistic, stereotaxic map of area hOc5. Cereb Cortex 17(3): 562–574. [DOI] [PubMed] [Google Scholar]
- Oldfield RC( 1971): Assessment and analysis of handedness—Edinburgh Inventory. Neuropsychologia 9(1): 97–113. [DOI] [PubMed] [Google Scholar]
- Ono M,Kubik S,Abernathey CD( 1990): Atlas of the Cerebral Sulci. Stuttgart: Georg Thieme Verlag. [Google Scholar]
- Rademacher J,Caviness VS Jr,Steinmetz H,Galaburda AM( 1993): Topographical variation of the human primary cortices: Implications for neuroimaging, brain mapping, and neurobiology. Cereb Cortex 3(4): 313–329. [DOI] [PubMed] [Google Scholar]
- Rajkowska G,Goldman‐Rakic PS( 1995): Cytoarchitectonic definition of prefrontal areas in the normal human cortex. II. Variability in locations of areas 9 and 46 and relationship to the Talairach Coordinate System. Cereb Cortex 5(4): 323–337. [DOI] [PubMed] [Google Scholar]
- Rosano C,Krisky CM,Welling JS,Eddy WF,Luna B,Thulborn KR,Sweeney JA( 2002): Pursuit and saccadic eye movement subregions in human frontal eye field: A high‐resolution fMRI investigation. Cereb Cortex 12(2): 107–115. [DOI] [PubMed] [Google Scholar]
- Rosano C,Sweeney JA,Melchitzky DS,Lewis DA ( 2003): The human precentral sulcus: chemoarchitecture of a region corresponding to the frontal eye fields. Brain Res 972(1–2): 16–30. [DOI] [PubMed] [Google Scholar]
- Schmitt O,Modersitzki J,Heldmann S,Wirtz S,Hömke L,Heide W,Kömpf D,Wree A ( 2005): Three‐dimensional cytoarchitectonic analysis of the posterior bank of the human precentral sulcus. Anat Embryol 210(5–6): 387–400. [DOI] [PubMed] [Google Scholar]
- Sereno MI,Dale AM,Reppas JB,Kwong KK,Belliveau JW,Brady TJ,Rosen BR,Tootell RB ( 1995): Borders of multiple visual areas in humans revealed by functional magnetic resonance imaging. Science 268(5212): 889–893. [DOI] [PubMed] [Google Scholar]
- Sudevan P,Taylor DA ( 1987): The cueing and priming of cognitive operations. J Exp Psychol Hum Percept Perform 13(1): 89–103. [DOI] [PubMed] [Google Scholar]
- Talairach J,Tournoux P ( 1988): Co‐Planar Stereotaxic Atlas of the Human Brain. Stuttgart: Georg Thieme Verlag. [Google Scholar]
- Toga AW,Thompson PM,Mori S,Amunts K,Zilles K ( 2006): Towards multimodal atlases of the human brain. Nat Rev Neurosci 7(12): 952–966. [DOI] [PMC free article] [PubMed] [Google Scholar]
- Tootell RB,Hadjikhani NK,Vanduffel W,Liu AK,Mendola JD,Sereno MI,Dale AM( 1998): Functional analysis of primary visual cortex (V1) in humans. Proc Natl Acad Sci USA 95(3): 811–817. [DOI] [PMC free article] [PubMed] [Google Scholar]
- Turner R( 2002): How much cortex can a vein drain? Downstream dilution of activation‐related cerebral blood oxygenation changes. Neuroimage 16(4): 1062–1067. [DOI] [PubMed] [Google Scholar]
- Tzourio‐Mazoyer N,Hervé PY,Mazoyer B( 2007): Neuroanatomy: Tool for functional localization, key to brain organisation. Neuroimage 37(4): 1059–1060. [DOI] [PubMed] [Google Scholar]
- Van Essen DC( 1997): A tension‐based theory of morphogenesis and compact wiring in the central nervous system. Nature 385(6614): 313–318. [DOI] [PubMed] [Google Scholar]
- Walters NB,Egan GF,Kril JJ,Kean M,Waley P,Jenkinson M,Watson JD( 2003): In vivo identification of human cortical areas using high‐resolution MRI: An approach to cerebral structure‐function correlation. Proc Natl Acad Sci USA 100(5): 2981–2986. [DOI] [PMC free article] [PubMed] [Google Scholar]
- Walters NB,Eickhoff SB,Schleicher A,Zilles K,Amunts K,Egan GF,Watson JD( 2007): Observer‐independent analysis of high‐resolution MR images of the human cerebral cortex: In vivo delineation of cortical areas. Hum Brain Mapp 28(1): 1–8. [DOI] [PMC free article] [PubMed] [Google Scholar]
- Watson JD,Myers R,Frackowiak RS,Hajnal JV,Woods RP,Mazziotta JC,Shipp S,Zeki S( 1993): Area V5 of the human brain: Evidence from a combined study using positron emission tomography and magnetic resonance imaging. Cereb Cortex 3(2): 79–94. [DOI] [PubMed] [Google Scholar]
- Worsley KJ,Friston KJ( 1995): Analysis of fMRI time‐series revisited—Again. Neuroimage 2(3): 173–181. [DOI] [PubMed] [Google Scholar]
- Yousry TA,Schmid UD,Alkadhi H,Schmidt D,Peraud A,Buettner A,Winkler P( 1997): Localization of the motor hand area to a knob on the precentral gyrus. A new landmark. Brain 120(Part 1): 141–157. [DOI] [PubMed] [Google Scholar]
- Zarahn E,Aguirre GK,D'Esposito M( 1997): Empirical analyses of BOLD fMRI statistics. I. Spatially unsmoothed data collected under null‐hypothesis conditions. Neuroimage 5(3): 179–197. [DOI] [PubMed] [Google Scholar]
- Zysset S,Schroeter ML,Neumann J,von Cramon DY( 2006): Stroop interference, hemodynamic response and aging: An event‐related fMRI study. Neurobiol Aging 28(6): 937–946. [DOI] [PubMed] [Google Scholar]
Associated Data
This section collects any data citations, data availability statements, or supplementary materials included in this article.
Supplementary Materials
Additional Supporting Information may be found in the online version of this article.
Supporting Information Figure 1