

Abstract
A face‐selective neural signal is reliably found in humans with functional MRI and event‐related potential (ERP) measures, which provide complementary information about the spatial and temporal properties of the neural response. However, because most neuroimaging studies so far have studied ERP and fMRI face‐selective markers separately, the relationship between them is still unknown. Here we simultaneously recorded fMRI and ERP responses to faces and chairs to examine the correlations across subjects between the magnitudes of fMRI and ERP face‐selectivity measures. Findings show that the face‐selective responses in the temporal lobe (i.e., fusiform gyrus—FFA) and superior temporal sulcus (fSTS), but not the face‐selective response in the occipital cortex (OFA), were highly correlated with the face‐selective N170 component. In contrast, the OFA was correlated with earlier ERPs at about 110 ms after stimulus‐onset. Importantly, these correlations reveal a temporal dissociation between the face‐selective area in the occipital lobe and face‐selective areas in the temporal lobe. Despite the very different time‐scale of the fMRI and EEG signals, our data show that a correlation analysis across subjects may be informative with respect to the latency in which different brain regions process information. Hum Brain Mapp, 2010. © 2010 Wiley‐Liss, Inc.
Keywords: face recognition, N170, fusiform face area, face‐selectivity, superior temporal sulcus, P100, occipital face area
INTRODUCTION
A comprehensive account of the neural basis of any function must identify not only the brain regions involved but also when each of these regions contributes to information processing. Functional MRI (fMRI) is the most common noninvasive method for studying the spatial properties of the neural response in the human brain, whereas event‐related potential (ERP) is the most common means to examine its temporal properties. Numerous fMRI and ERP studies have reported robust and selective neural responses to faces in occipito‐temporal cortex. Specifically, fMRI typically reveals three occipito‐temporal face‐selective regions (Fig. 1A), one in the inferior lateral occipital cortex (the occipital face area—OFA), a second in the mid‐fusiform gyrus (the fusiform face area—FFA), and a third in the posterior superior temporal sulcus [STS face area—fSTS, see Fig. 1A; Haxby et al., 2000; Kanwisher and Yovel, 2006]. Similarly, a face‐selective ERP component that peaks at about 170 ms after stimulus onset (the N170—see Fig. 1B) is consistently found at temporal‐occipital electrodes [Bentin et al., 1996; for review see, Rossion and Jacques, 2008]. Although less robust than the N170, several studies have reported an earlier face‐selective component at the 100‐ms latency. This earlier face‐selective component, however, does not consistently appear across all ERP studies and less is known about its role in face processing [for review see, Rossion and Jacques, 2008].
Figure 1.
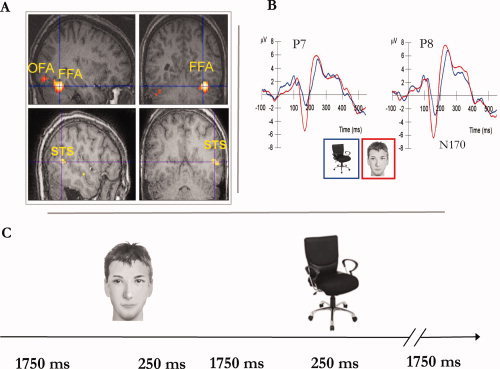
Functional MRI and event‐related potential (ERP) face‐selective responses. A. Regions that show a face‐selective response in one representative subject (face > chairs, P < 0.001). These regions were individually identified in each subject. Face‐selective voxels in the mid fusiform gyrus were defined as the fusiform face area (FFA), in the posterior part of the superior temporal sulcus as the fSTS and in the lateral occipital cortex as the occipital face area (OFA). B. ERP responses to faces and chairs averaged across all subjects in channels P7 and P8. A larger negative potential is revealed in response to faces than chairs at 170 ms after stimulus onset (N170). C. Subjects were presented with grayscale images of faces and chairs in a pseudo‐randomized order. A stimulus was presented for 250 ms. Each trial lasted 2 s. [Color figure can be viewed in the online issue, which is available at wileyonlinelibrary.com.]
Whereas ERP and fMRI studies often employ similar paradigms to assess the latency or the location of a given function in the brain, respectively [e.g., Bentin et al., 1996; McCarthy et al., 1997; Paller et al., 1987; Puce et al., 1998, 2000; Wagner et al., 1998], ERP and fMRI responses to faces have been mostly examined in separate studies by different research groups and very few studies have investigated the relationship between them [Henson et al., 2003; Horovitz et al., 2004]. Henson et al. reported similarities or differences between ERP and fMRI effects of face repetition or familiarity between subjects. A more direct way to study the relationship between electrophysiological and BOLD signals is by examining the correlations between these measures across subjects. Such a procedure was employed by Horovitz et al. in an auditory oddball experiment [Horovitz et al., 2002], and later with faces [Horovitz et al., 2004], for ERP and fMRI responses recorded in separate sessions. Specifically, Horovitz et al. [ 2004] measured the N170 and fMRI responses to faces at different levels of visual noise. Results showed high correlations between the N170 amplitude and the fMRI response across five subjects and five noise levels in the predefined FFA. A voxel‐wise correlation analysis revealed that the N170 response also correlated with the response to faces in the middle frontal gyrus, anterior cingulate, and superior temporal gyrus. To the best of our knowledge this is the only study that reported correlations between the N170 and the FFA response to faces. Importantly, no study has directly examined whether the N170 and fMRI face‐selectivity (i.e., the difference between the response to faces and nonface stimuli) are correlated, which was the main goal of the current study.
A correlation between fMRI and ERP may potentially inform us about the latency in which a given brain region processes information, in particular if a temporal dissociation between different regions is found. Recent transcranial magnetic stimulation (TMS) studies allow us to make predictions with respect to the latency of face processing in face‐selective areas. Pitcher et al. [ 2007] examined the latency in which the occipital face area (OFA) contributes to face processing, and found that TMS to the OFA disrupts face discrimination abilities at 60–100 ms after stimulus onset, but not at latencies around the timing of the face‐selective N170 component [Pitcher et al., 2007, 2008]. These findings suggest that the OFA face‐selectivity may be associated with earlier face‐selective ERPs (around 100 ms) whereas face processing at around 150–200 ms after stimulus onset, which underlies the face N170, may not be associated with the OFA, but with the more anterior face areas in the mid fusiform gyrus (FFA) and/or the posterior fSTS. Source localization ERP studies have suggested either the superior temporal cortex [e.g., Itier and Taylor, 2004b] or the fusiform gyrus [e.g., Deffke et al., 2007; Rossion et al., 2003; Shibata et al., 2002] as possible sources of the N170. Because of the diversity in source localization models and the uncertain nature of inverse solutions, other sources have also been proposed [e.g., posterior inferior temporal gyrus, Schweinberger et al., 2002]. Notably, source localization analyses can only crudely point to anatomical locations, and cannot directly assess the association of the face‐selective N170 with functionally defined face‐selective brain areas revealed with fMRI.
The goal of the current study was to specifically examine the association between the well‐established face‐selective ERP and fMRI measures. By simultaneously recording the fMRI and ERP face‐selective signals to faces and objects (chairs, Fig. 1C), we tested the correlation between face‐selective ERPs and fMRI regions across subjects. Our first question was whether face‐selectivity at the N170 peak is associated with face‐selectivity in the FFA and/or fSTS but not in the OFA. Second, we asked whether face‐selectivity at the OFA is associated with ERPs at latencies earlier than the N170 component.
MATERIALS AND METHODS
Subjects
Twelve subjects (age: 22–30, eight females, two left‐handed) participated in a simultaneous recording of ERP and fMRI. Two right‐handed subjects, one female and one male, were excluded due to technical problems in recordings. All subjects gave informed consent to participating in the study, which was approved by the Helsinki committee of the Tel Aviv Sourasky Medical Center.
Apparatus and Recording Parameters
Functional MRI Recording
MRI data was collected with a GE Signa 3T MRI scanner. We used an echo planar imaging sequence with TR = 2 s, TE = 35 ms, flip angle: 90°, 30 slices of 4 mm with no gap, matrix 64 × 64, FOV = 20 cm.
EEG recording
EEG was recorded with an MR‐compatible 32‐channel battery‐operated amplifier located at the back of the MRI scanner (Brain Products, GmBH, Germany). The signal was amplified and sampled at 5,000 Hz, a rate necessary for gradient artifact removal. The exact timing of stimulus onset and MRI scanner gradient switching was transmitted to the EEG amplifier and recorded together with the EEG signal. Thirty Ag/AgCl nonmagnetic electrodes were positioned on an elastic cap according to the standard 10/20 system, with a fronto‐central reference electrode. The wires were braided and connected to the amplifier. One electrode was placed on the upper‐left part of the back for EKG recordings. The EKG data were used to detect the ballistocardiogram (BCG) artifacts in the EEG signal, which were removed offline.
Stimuli
Grayscale images of four faces and four chairs were presented with Matlab Psychtoolbox [Brainard, 1997]. Stimuli were projected to the center of a screen located in the scanner's bore. The subjects viewed the stimuli through a mirror that was placed on the upper part of the head coil.
Procedure
Three simultaneous EEG‐fMRI runs were recorded. Each run included 48 face and 48 chair trials, and 24 null events that were presented in a pseudo‐randomized order (http://surfer.nmr.mgh.harvard.edu/optseq/), which allowed the deconvolution of fMRI signal time locked to the rapidly presented stimuli [Dale, 1999; Dale et al., 1999]. Each trial lasted 2 s, during which one stimulus was presented for 250 ms. The stimulus onset was shifted by a jitter that was randomly sampled from a uniform distribution between 0 and slice duration time (66.67 ms), to prevent time‐locking of the evoked response to the gradient switching. The ERP signal was time‐locked to the onset of the stimulus. The fMRI signal was sampled every 2 s for each stimulus presentation. The subjects were asked to press a key each time an image was repeated twice in a row (a one‐back task), which occurred every eight trials on average and total of 12 times per session (six for faces and six for chairs). This task was chosen because EEG recorded in a high magnetic field is particularly sensitive to head movements, which can be elicited by the hand movement [Debener et al., 2008]. Our 1‐back task minimizes hand responses but still ensures that subjects remain attentive throughout the session. Each scan lasted 4:12 min and comprised 126 volumes. The first six volumes of each scan were acquired during presentation of a blank screen and discarded from the analysis.
Data Analysis
Functional MRI
We extracted the hemodynamic responses to faces and chairs for each of the face‐selective areas. Face‐selective areas were defined individually for each subject as areas that responded significantly more to faces than chairs, with P < 0.001, uncorrected (T > 3.11). Face‐selective voxels in the mid fusiform gyrus were defined as the FFA, in the posterior part of the superior temporal sulcus as the fSTS and in the lateral inferior occipital cortex as the OFA (Fig. 1A). All 10 subjects showed a face‐selective response in the right fusiform gyrus (FFA), 8 subjects showed a face‐selective response in the left FFA, 8 subjects showed a face‐selective response in the right occipital face area (OFA), 6 subjects showed a face‐selective response in the left OFA, 7 subjects showed a face‐selective response in the posterior part of the right superior temporal sulcus (fSTS), and 7 subjects showed a face‐selective response in the left fSTS. Individuals who showed no face‐selective response in a given ROI were given a score of 0 in the face‐selective index. Correlations were computed with and without these subjects (see below).
Face‐selectivity index.
A normalized face‐selective index was calculated by subtracting the peak of the hemodynamic response to chairs from the response to faces and dividing by their sum: 
Event related potentials
Gradient and ballistocardiogram artifact removal.
To remove MR and ballistocardiogram (BCG) artifacts, we used the FMRIB plug‐in for EEGLAB provided by the University of Oxford Centre for Functional MRI of the Brain (FMRIB) [Iannetti et al., 2005; Niazy et al., 2005]. Artifacts related to MR gradient switching were removed from all EEG datasets using the FASTR, which first corrects for possible minor jitters of gradients by slightly shifting the slice artifacts to obtain the optimized correlation between each of them and the first artifact. Then, an average template of the artifact is computed and subtracted from the signal [Allen et al., 2000]. Subsequently, an optimal basis set (OBS) constructed of first most meaningful PCAs is used to eliminate residual artifacts.
Ballistocardiogram artifacts were removed in two stages: artifact detection was performed on the EKG channel using the Teager energy operator [Kim et al., 2004] and combined adaptive thresholding [Christov, 2004], followed by a correction algorithm, which aligns all events and corrects for false positives and negatives and computes an average artifact template. In the pulse artifact removal stage an artifact template is subtracted from the signal. The template for subtraction is constructed with the optimal basis algorithm, similar to the one used to remove the gradient residuals. For some subjects Gaussian‐weighted mean artifact subtraction was used to remove the artifacts, due to failure of the optimal basis algorithm to operate on them.
ERP averaging.
Following artifact removal, the EEG signal was down‐sampled to 250 Hz. The data were then filtered with a 0.5–45 Hz bandpass filter. Epochs of 100 ms before stimulus onset to 600 ms after stimulus onset were averaged separately for faces and chairs. The N170 amplitude to faces and chairs was measured at the maximum negative peak of the ERP for faces and chairs within 140–200 ms. For analysis of the occipital‐temporal electrodes we utilized the built‐in fronto‐central reference channel (FCz). For the face‐selective VPP component, which is maximal at Cz, a channel adjacent to FCz, we rereferenced the data offline to the average scalp potential. As reported below, face‐selectivity at Cz (VPP) and at the temporal occipital electrodes 170 ms after stimulus onset were highly correlated.
Face‐selectivity Index.
Similar to the fMRI face‐selective index, for each subject we computed a normalized face‐selectivity index of the ERP response to faces and chairs at the peak amplitude within 140–200 ms 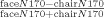 . Unlike the amplitude of the hemodynamic response that was positive for faces and chairs for all subjects, for a few subjects the amplitudes of the N170 to faces and chairs had opposite signs (negative for faces and a low positive value for chairs). Calculation of the index score in such cases generates a deviant value that is larger than 1, whereas a ratio index of selectivity scores is meaningful only within the −1 to 1 range. We therefore subtracted a fixed value that was slightly higher than the larger positive amplitude in our sample such that all amplitude scores of the N170 had a negative value smaller than −1, which results in indices ranging from −1 to 1 [see also Simmons et al., 2007 for a similar baseline correction of a ratio index of fMRI response]. To make sure that the magnitude of the particular chosen factor did not affect our results, we computed the correlations between face‐selective indices that were computed with different factors. The correlations between these face‐selective indices were very high (r > 0.9), which suggests that the magnitude of the factor does not significantly alter the pattern of variance across individuals.
In addition to this standard selectivity ratio, which should be separately computed for each ERP latency based on its range of positive and negative amplitudes, we also computed another type of normalized index where the difference between the response to faces and chairs was divided by the difference between the P1/N1 peak‐to‐peak amplitude for faces:  . The advantage of the P1‐N1 normalized index is that it provides a fixed value that reflects the overall amplitude of the signal for each subject. Therefore, unlike the former index, it does not require the computation of a specific factor for each latency. Importantly, the correlations between the two types of face‐selective indices were very high (r > 0.9), which indicates that both indices are equally valid to be used in the correlational analysis with fMRI selectivity indices. Indeed, the correlations between the ERP and fMRI signals reported below were very similar with the two types of indices. For the correlation analysis with the N170 peak amplitude, we report results with both selectivity indices: the standard ratio index, which is similar to the index we used for the fMRI data, and the P1‐N1 index. To calculate the correlations across different time bins (see Fig. 4) the P1‐N1 index was used so all latencies are normalized based on the same value for a given subject.
Figure 4.
Temporal dissociation between occipital and temporal face‐selective areas: Correlations between face‐selective ERP responses for each 4‐ms bin within 80–180 ms after stimulus onset, and the face‐selectivity of the OFA (purple), FFA (green) and fSTS (orange). High correlations between the ERP face‐selectivity and the OFA, but not the FFA and fSTS, are found around the 110ms latency. A reversed pattern is found around the 160ms range of latencies where the FFA and fSTS, but not the OFA, are highly correlated with the ERP face‐selectivity signal. At the 80–100 ms latency range we revealed nonsignificant negative correlations of similar magnitude across all face‐selective regions. [Color figure can be viewed in the online issue, which is available at wileyonlinelibrary.com.]
For all ERP‐fMRI correlation analyses we used Cook's Distance score to exclude outlier data points. Cook's Distance score for a given observation reflects the change in the magnitude of the correlation that results from excluding this observation [Cook, 1979]. An outlier was defined as Cook's Distance score larger than 3 standard deviations (excluding the outlier score). The only data point that was excluded based on this criterion was in the correlations between the N170 and the rfSTS face‐selectivity measure of one of the subjects who showed no face‐selective response in the superior temporal sulcus and highly deviant Cook's score (Cook's D score was 12 standard deviations above mean).
RESULTS
Correlations Between Face‐Selective fMRI Regions and the N170 Face‐Selectivity
A face‐selective index was computed for each subject (see methods) for the N170 peak amplitude at the right and left temporal‐occipital electrodes (P8 and P7, respectively) where face‐selectivity is typically reported to be maximal with a 32‐channel system [Rossion and Jacques, 2008] and was also maximal in our data. The N170 amplitude to faces and chairs was −7.1 and −4.3, respectively (t(9) = 2.35, P < 0.05) at right temporal electrode (P8) and −6.6 and −2.6, respectively (t(9) = 4.23, P < 0.01) at left electrode (P7). For scalp topographies of the electrophysiological response to faces and chairs see Supporting Information Figure 1.
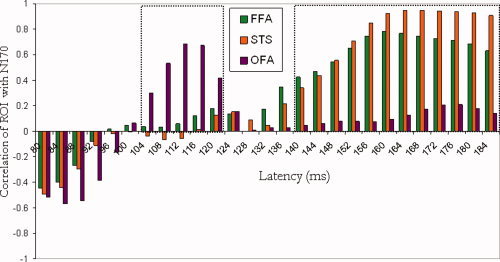
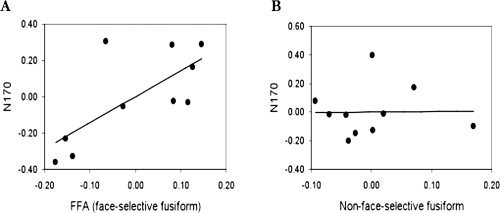
A face‐selective index was also computed for each of the three face‐selective brain regions of each subject (see methods). As shown in the scatter plots displayed in Figure 2, we found that the N170 face‐selectivity index over the right temporal‐occipital site (P8) was highly correlated across subjects with face‐selectivity in the right FFA [r(8) = 0.79, P = 0.007] and the right fSTS [r(7) = 0.87, P = 0.002]. Consistent with our prediction, the N170 face‐selectivity was not correlated with the right OFA face‐selectivity (P(8) = −0.11, P = 0.76). This dissociation suggests that the correlations of the N170 with the FFA and fSTS do not reflect a general association between fMRI and ERP face‐selectivity, but a specific association of face‐selectivity at the posterior part of the temporal lobe with scalp‐recorded face‐selective potentials at around 170 ms after stimulus onset. Examination of the scatter plot of the correlation between the N170 and the fSTS may suggest that the high correlation is primarily mediated by the two individuals who showed nonsignificant face‐selective response in the rfSTS. However, when these two subjects were excluded the correlation between the N170 and rfSTS remained very high and significant (r(5) = 0.82, P < 0.05), which is consistent with the fact that Cook's analysis did not point out that these two observations were outliers. This finding suggests that the two subjects who had no significant face‐selective response in the rfSTS and a minimal N170 face‐selectivity are not outliers, but show a reliable low face‐selectivity response in both measures. A similar analysis was done also for the OFA. The correlation between the N170 and the OFA excluding the two subjects who showed non‐significant face‐selective occipital response also yielded very similar results of no correlation with the N170 r(6) = −0.15, P = 0.72., as the complete sample of 10 subjects.
Figure 2.
The face‐selective N170 is strongly correlated with face‐selective brain areas in the temporal cortex but not in the occipital cortex. A. Percent signal change to faces and chairs in the FFA of a single representative subject. An fMRI face‐selective index (see methods) was computed for each subject based on the amplitude of the hemodynamic response to faces and chairs in the OFA, FFA and fSTS. B. An ERP to faces and chairs of a single representative subject. An ERP face‐selective index was computed for each individual based on the peak amplitude of the N170 to faces and chairs. C. Scatter plots display the correlations between fMRI and ERP face‐selective indices across subjects. Each dot represents one individual. Strong correlations were found between the N170 face‐selectivity and the face‐selectivity of the FFA and fSTS but not with the face‐selectivity of the OFA over the right hemisphere. [Color figure can be viewed in the online issue, which is available at wileyonlinelibrary.com.]
To make sure that the correlations reported above are not restricted to the specific selectivity ratio‐index that we used (which requires a baseline correction) we computed the same correlations with a second index that is normalized to the P1‐N1 peak‐to‐peak difference (see Data Analysis above). The correlations between the N170 face‐selectivity was again very high with the rFFA (r(8) = 0.78, P = 0.008) and the rfSTS (r(7) = 0.85, P = 0.004), but not with the rOFA (r(8) = −0.05, P = 0.89).
In contrast to the high correlations that we revealed in the right hemisphere, N170 face‐selectivity in the left temporal‐occipital site (P7) did not correlate with the left face‐selective fMRI regions r(8) = 0.03, P = 0.94 with lFFA, r(8) = 0.21 P = 0.57 with lfSTS, and r(8) = −0.38, P = 0.28 with lOFA) (see scatter plots in Supporting Information Fig. 2). These null correlations may be due to the relatively low reliability of the N170 face‐selectivity in the left occipital electrode [Sadeh et al., 2008] and are consistent with the well‐established right hemisphere superiority in face processing [Yovel et al., 2008]. Finally, the N170 and fMRI face‐selectivity markers in contralateral hemispheres (right N170 with left fSTS, FFA, OFA and vice‐versa) were not correlated, which highlights the specificity of the ERP‐fMRI correlations over the right hemisphere.
Face‐Selective Vertex Positive Potential (VPP)
A face‐selective positive response is typically found also in central electrodes (Cz) [Jeffreys and Tukmachi, 1992; Joyce and Rossion, 2005; Rossion et al., 2003]. This positivity is believed to reflect the same dipoles that generate the negative face‐selective response in occipital‐temporal electrodes [Joyce and Rossion, 2005]. Our data also revealed a significantly higher response to faces than chairs at Cz, where VPP is maximal. Mean response to faces and chairs of the VPP was 3.9 and 1.9 μV, respectively (t(9) = 2.45, P < 0.05) (see Supporting Information Fig. 3). We first computed a face‐selectivity index for the VPP and examined the correlations with the N170 face‐selectivity. Consistent with the idea that the VPP and N170 reflect the same face‐selective neural response we found a high correlation between face‐selective measures of the two components (r(8) = 0.89, P = 0.001). Interestingly, the VPP face‐selectivity was less correlated with face‐selectivity at P7 (r(8) = 0.45, P = 0.20). These findings either reflect the low reliability of the N170 at P7 [Sadeh et al., 2008] or that the VPP is more influenced by face processes in the more dominated right hemisphere. We next assessed the correlation of the face‐selective VPP with face‐selective fMRI responses. Results were similar to findings in the right temporal occipital electrode P8. The correlation of the face‐selective VPP index was marginally significant with the rFFA [r(8) = 0.59, P = 0.07], and significant with the rfSTS [r(7) = 0.72, P = 0.03], but not with the rOFA [r(8) = −0.41, P = 0.24]. Face‐selectivity in the VPP was not correlated with face‐selective regions in the left hemisphere (lFFA = −0.16, P = 0.65; lfSTS = −0.18, P = 0.61; lOFA = 0.05, P = 0.89). Thus, the VPP seems to be associated more with face‐selective neural responses in the right than the left hemisphere. (See Supporting Information Fig. 3 for scatter plots of the correlations between the VPP and the three ROIs).
Figure 3.
The face‐selective N170 is not associated with face‐responsive voxels in the fusiform gyrus outside the FFA: A. A partial correlation between the N170 face‐selectivity and face‐selectivity in the FFA, when face response outside the FFA is held constant shows a strong correlation. B. A partial correlation between the N170 face‐selectivity and face response outside the FFA, when face‐selectivity in the FFA is held constant, shows no correlation.
Occipital Electrodes
Some studies also report N170 face selectivity in occipital electrodes [for review see, Rossion and Jacques, 2008]. We therefore also examined the N170 to faces and chairs in the right occipital electrode O2, which revealed a marginally significant category effect (faces: −5.9 μV chairs: −3.2 μV, t(9) = 2.09, P = 0.07, see Supporting Information Fig. 4). The N170 face‐selectivity at O2 was highly correlated with face‐selectivity at P8 (r = 0.93, P < 0.0001). It is therefore not surprising that the pattern of correlations with the face‐selective regions was very similar for the two electrodes. The correlation with the rFFA was r(8) = 0.78, P = 0.007, with the rfSTS r(7) = 0.93, P < 0.0003, and there was no correlation with the rOFA r(8) = −0.11, P = 0.77, despite the proximity of the OFA and the location of the O electrode.
The N170 is not Correlated With Face Responsive Regions in the Fusiform Gyrus Outside the FFA
To assess the extent to which the N170 face‐selectivity is specifically associated with face‐selective fMRI regions, we defined a cluster of voxels that showed a higher response to faces than to blank trials in the fusiform gyrus excluding face‐selective voxels (FFA) and computed a face‐selectivity index of this face responsive control region for each subject. The mean percent signal change to faces and chairs in this region was 0.45 and 0.40, respectively. The weak face‐selectivity in this region was correlated with face‐selectivity in the near‐by FFA across subjects (r(8) = 0.59, P = 0.07), which suggests that despite its low mean value (0.05), it is reliable. To assess the unique contribution of face responsive regions in the fusiform gyrus outside the FFA to the N170 face‐selectivity, we computed a partial correlation between the face‐responsive region outside the FFA and the N170, when FFA face‐selectivity is held constant. This analysis revealed no correlation r(7) = 0.01, P = 0.97 (Fig. 3A). In contrast, the partial correlation between the FFA and the N170, when the face responsive area outside the FFA is held constant, was very high r(7) = 0.72, P < 0.05 (Fig. 3B). These findings suggest that the face‐selectivity of the N170 is specifically associated with face‐selective response in the fusiform gyrus (FFA) and not with nearby face responsive regions.
In summary, correlational analyses between face‐selective ERP and fMRI markers reveal a strong association between the N170 face‐selectivity and face‐selective areas in the temporal lobe, but not in the occipital lobe.
Temporal Dissociation Between Occipital and Temporal Face‐Selective Regions
Is face‐selectivity in the OFA associated with earlier latencies of the ERP signal? Similar to many previous face‐selective ERP studies [Bentin et al., 1996; Rossion and Jacques, 2008], our data do not reveal a higher amplitude for faces than objects in the average group ERPs at the 100‐ms latency. Because we were unable to preselect a specific face‐selective peak response at these earlier latencies as we did for the N170, we explored the difference between the ERP amplitudes to faces and chairs at each sampled time point (at 4‐ms intervals) across the range of latencies of the P1 component (80–140 ms), to assess whether individual differences in face‐selectivity at these earlier latencies would co‐vary with the OFA face‐selectivity. Similar analyses were also performed on the range of latencies around the N170 component (140–180 ms).
Figure 4 shows the correlations between face‐selectivity at the right temporal‐occipital electrode (P8) and each of the three face‐selective regions in the right hemisphere for each 4‐ms bin within the P1 latency range (80–140 ms) as well as the N170 latency range (140–180 ms). Because the polarity of face‐selectivity changes across the early latencies (80–140 ms) and the later latencies (140–180 ms), we multiplied the selectivity index by the polarity of the component so that positive correlations between ERP and fMRI face‐selectivity markers would convey the same type of association for the positive and negative ERPs. In other words, regardless of the polarity of the signal, positive correlations reflect that a larger N170 face‐selectivity effect is associated with a larger face‐selectivity of the hemodynamic response, whereas negative correlations suggest that a smaller N170 advantage for faces (or a reversed effect of a larger amplitude to chairs than faces) is associated with a larger difference in hemodynamic response in favor of faces.
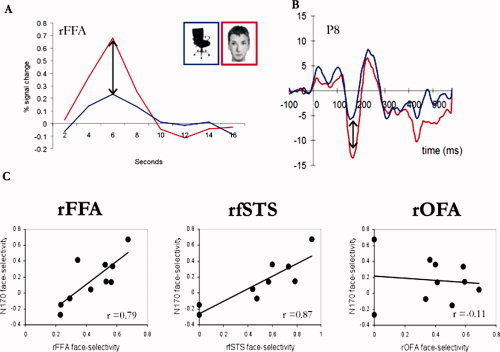
Correlational analyses reveal a strong positive correlation between the OFA face‐selectivity and the ERP face‐selectivity at earlier latencies (∼110 ms). In contrast, no correlations were found with the rFFA and rfSTS at these early latencies. In particular, a positive correlation for the rOFA was found around 112 ms (r(8) = 0.68, P = 0.03). Neither the rFFA (r(8) = 0.06, P = 0.87) nor the rfSTS (r(7) = −0.05, P = 0.89) correlated with the ERP at this latency (see scatter plots in Fig. 5A). It is noteworthy that one data point may specifically contribute to the absence of correlations with rFFA and rfSTS, although Cook's D score did not indicate that this data point is an outlier (Cook's D score is less than 3STDs from mean). Our data therefore suggest that the dissociation between temporal and occipital areas may be less robust at the earlier latencies than at the 170‐ms latencies, probably due to the less robust face‐selectivity at the 100‐ms time window.
Figure 5.
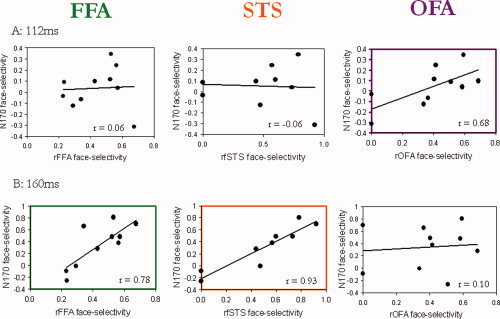
Scatter plots of the correlation coefficients between the face‐selective ERP index at 112 and 160 ms and the OFA, FFA and fSTS. A. The distribution of face‐selectivity ERP and fMRI indices across subjects at an earlier latency (112 ms). Examination of the scatter plots shows that the two subjects who had no face‐selectivity at the OFA also showed no face‐selectivity at the 112‐ms latency. The majority of the subjects who did show a face‐selective OFA also showed a positive ERP face‐selectivity that co‐varied with the magnitude of the hemodynamic face‐selectivity. B. The distribution of face‐selectivity ERP and fMRI indices across subjects at 160ms. The two individuals who did not have face‐selective activation in the fSTS showed negative face‐selective ERP scores at this latency. All subjects showed face‐selective activation in the fusiform gyrus that co‐varied with the magnitude of face‐selectivity at the N170 range of latencies (e.g., 160 ms). These findings suggest that the correlations between the N170 and the FFA or fSTS are not specific to the peak latency of each individual (see Fig. 2) but are found for a range of latencies around the 170 ms latency. [Color figure can be viewed in the online issue, which is available at wileyonlinelibrary.com.]
Consistent with the correlations that we reported for the peak amplitude of the N170, which slightly vary in latency across subjects, we found strong correlations between the fMRI face‐selectivity and the ERP face‐selectivity around 150–180 ms, peaking at 160 ms for the right FFA (r(6) = 0.77, P = 0.009) and at 164 ms for the right fSTS (r(7) = 0.95, P = 0.0001). The OFA was not correlated with the ERP face‐selectivity at the 160‐ms latency (r(8) = 0.13, P = 0.73), nor at any time‐point around these latencies (see Fig. 5B).
Finally, correlational analyses of the early range at 80–100 ms revealed negative nonsignificant correlations between ERP and fMRI face‐selectivity markers of a similar magnitude across all three face‐selective regions. Thus, our data do not reveal any evidence for an association between face‐selectivity at this latency and any of the face‐selective fMRI regions, nor a temporal‐based dissociation between these three face‐selective regions.
In summary, examination of the correlations between the occipital and temporal face‐selective regions across the range of latencies of the P1 and N170 components reveals a temporal dissociation between the occipital and temporal face‐selective regions. The occipital face area was associated with face processing around 110 ms but not 170 ms after stimulus onset, whereas the FFA and fSTS were strongly associated with face processing around 170 ms, and less so around 110 ms after stimulus onset.
DISCUSSION
Despite the fact that ERP and fMRI measures of category selectivity in general and face‐selectivity in particular have been extensively studied, only few studies so far have attempted to assess whether these two very different, yet complementary neurophysiological measures, are associated. The current study not only shows that the face‐selective ERP and fMRI responses are highly correlated but also show that these correlations are specific for distinct ERP latencies and distinct brain regions. First, the N170 face‐selectivity was highly correlated with face‐selective responses in temporal cortex. In contrast, the N170 peak amplitude was not correlated with the face‐selective area in the occipital cortex. Second, the N170 face‐selectivity was not associated with face‐responsive areas in the fusiform gyrus outside the FFA, suggesting that the N170 is specifically correlated with face‐selective cortex. Third, the face‐selective response in the occipital cortex that was not associated with face‐selectivity at 170 ms after stimulus onset, was associated with face‐selective responses at earlier latencies (∼110 ms). Fourth, fMRI face‐selectivity in temporal cortex was not correlated with ERP face‐selectivity at earlier latencies, although these findings were less robust than the dissociation we found at the 170‐ms latency. Finally, these correlations were found only in the right hemisphere, which may be consistent with the well‐established right hemisphere superiority in face processing.
The present study reveals that the fSTS and the FFA face‐selectivity are associated with the N170 face‐selectivity. These findings are in line with Horovitz et al., [ 2004] who revealed a positive correlation between the modulation of the N170 and FFA response to faces at different visual noise levels within and across subjects. The FFA and fSTS have been shown to play very different roles in face processing. Whereas the FFA is believed to be primarily associated with early stages of face identity processing [Gilaie‐Dotan and Malach, 2007; Yovel and Kanwisher, 2005], the fSTS is not sensitive to identity of faces [Grill‐Spector et al., 2004; Yovel and Kanwisher, 2005], but rather to the changeable aspects of the face such as gaze and expression [Allison et al., 2000; Hoffman and Haxby, 2000; Puce et al., 1998]. Examination of the functional profiles of the N170 reported in different studies reveal similarities with both the fSTS and the FFA, depending on the task. For example, similar to the fSTS, the N170 is affected by eye gaze manipulations [Carrick et al., 2007; Puce et al., 1998, 2000]. Similar to the FFA, the N170 is correlated with the behavioral face inversion effect [Jacques and Rossion, 2007; Mazard et al., 2006; Yovel and Kanwisher, 2005] and associated with face identity discrimination [Campanella et al., 2000; Rotshtein et al., 2005]. It is possible that both face‐selective regions contribute to the N170 but that their relative contribution varies according to task or stimuli that may differently activate each of the two regions. Future studies that manipulate task demands may be able to modulate the correlations between each of the regions and the N170 according to the task manipulation. Furthermore, findings reported in this study are restricted to very early stages of face processing but do not rule out the possibility of feedback from higher regions that may influence processing in these regions at later latencies, as well as the participation of more anterior face regions in the temporal lobe or the frontal lobe [Kriegeskorte et al., 2007; Tsao et al., 2008].
Our data show that face‐selectivity in the temporal lobe was also associated with face‐selectivity in central and more right occipital electrodes. In particular, a face‐selective positive component at 170 ms is also robustly found in central electrodes [Jeffreys and Tukmachi, 1992] and is believed to reflect the same dipole that generates the N170 at temporal occipital electrodes [Joyce and Rossion, 2005]. Our correlational analyses support this claim and show that the VPP face‐selectivity is also associated with face‐selectivity in the right temporal lobe (rFFA and rfSTS) but not with the occipital face‐selective area (see Supporting Information Fig. 3). A similar pattern of correlation with temporal but not occipital face‐selective areas was found with the N170 at the more occipital electrode (O2), which also showed a face‐selective N170 response. Thus, the electrical activity measured over the scalp reflects activations that may not be generated right under the location of the electrode, and is also sensitive to strong signals that are generated in more distal locations.
The finding that signal modulation in the OFA is associated with scalp recorded potentials at around 100 ms but not 170 ms after stimulus onset is consistent with recent TMS studies [Pitcher et al., 2007, 2008]. The consistency between the TMS studies, which provide direct evidence on the role of the OFA in face processing at earlier latencies than the N170, and our correlational findings, validates the correlational method used in the current investigation as a way to assess the latency in which brain regions process information. The main advantage of the ERP‐fMRI correlational analysis over TMS is that it can be applied to assess the latency of functions in regions that are not accessible to surface TMS, such as the more medial fusiform face area.
The correlations between event‐related potential and functional MRI face‐selective signals were found in the right hemisphere only. Although face‐selective markers are typically seen in both hemispheres, face‐selective fMRI activations are usually larger [Kanwisher and Yovel, 2006; Kanwisher et al., 1997; Yovel et al., 2008], and scalp recorded N170 tends to have higher amplitude [Bentin et al., 1996; Itier and Taylor, 2004a; for discussion see Rossion and Jacques, 2008] over the right hemisphere. The right hemisphere has been long considered predominant for human face recognition [Levy et al., 1972; Rhodes, 1985]. The asymmetrical processing of human faces is often attributed to the role played by the right hemisphere in global or holistic processing [Jiang et al., 2009; Schiltz and Rossion, 2006] as well as its sensitivity to specific stimulus regularities that characterize human faces [Caldara and Seghier, 2009]. This right hemisphere dominance is further supported by patient studies showing that deprivation of visual information to the right hemisphere results in face recognition impairment, but not so in left hemisphere deprivation [Le Grand et al., 2003] and that acquired prosopagnosia is most often caused by lesions to the right (or bilateral) cortex [Barton et al., 2002; De Renzi, 1997; Rossion, 2008; Schiltz et al., 2006]. Finally, lower correlations of ERP and fMRI face‐selectivity in the left hemisphere may be due to the low reliability of the N170 face‐selectivity over the left hemisphere [Sadeh et al., 2008]. Overall, these findings are in line with the strong association we found between ERP and fMRI markers of face‐selectivity in the right but not the left hemisphere.
The current study is unique in that ERP and fMRI data were collected simultaneously. Although the high magnetic field and MR gradients generate extensive artifacts in the ERP signal, we have recently shown that a highly reliable N170 face‐selective response can be obtained [Sadeh et al., 2008] when suitable artifact removal algorithms are applied [Niazy et al., 2005]. A few studies have reported analyses of simultaneously collected ERP and fMRI data to various other tasks (e.g., auditory oddball task) examined the correlations between the two signals within subjects by correlating the paradigm induced modulation of the ERP amplitude and the BOLD signal in each voxel [Debener et al., 2006; Eichele et al., 2005]. Here we show that robust correlations can be also revealed between the fMRI and the ERP signal across individuals in simultaneous recording. Thus, individual differences in fMRI and ERP measures may provide valuable information about the relationship between the two signals.
Finally, the study of the healthy human brain is limited to non‐invasive methods such as those used in the current investigation and therefore cannot directly reveal the underlying neuronal mechanisms that generate the strong correlations found between the electrophysiological face‐selective signals recorded over the scalp and the face‐selective BOLD signal measured with fMRI. Interestingly, recent fMRI‐single unit recording studies with monkeys revealed a great proportion of face‐selective neurons within a strongly connected network of face‐selective patches found with fMRI [Moeller et al., 2008; Tsao et al., 2006]. Tsao et al. showed that the response of these highly face‐selective neurons in the middle face patch peaks at 130 and 200 ms after stimulus onset, which roughly corresponds to the latencies that we revealed. We assume that the activity of these face‐selective neurons at different latencies and different locations along the occipito‐temporal cortex underlies both the ERP and the BOLD face‐selective signals and may be responsible for the ERP‐fMRI correlations observed with these non‐invasive neuroimaging techniques.
CONCLUSIONS
Our study is the first to reveal a clear association between electrophysiological and fMRI face‐selective markers in the human brain. Furthermore, our analysis reveals a temporal dissociation between different regions and latencies, which may reflect the latency in which different brain regions revealed with fMRI process information. Despite the very different time‐scale and neurophysiological sources of the fMRI and EEG signals, we showed that a correlation analysis across subjects may reveal a strong association between them. Similar analyses can be applied to reveal the temporal properties of brain networks that underlie other perceptual or cognitive systems.
Supporting information
Additional Supporting Information may be found in the online version of this article.
Supplementary Figure 1: Scalp distribution of the grand averaged response for faces and chairs at two latencies — 100ms and 168ms.
Supplementary Figure 2: Scatter plots showing the low correlations of the N170 face‐selectivity index over the left electrode (P7) with face‐selectivity at left ROIs.
Supplementary Figure 3: A. ERPs to faces and chairs at central electrode Cz showing the face‐selective Vertex Positivity Potential (VPP), B. scatter plots showing the correlations between the face‐selectivity of the VPP with face‐selective areas in both hemispheres. The VPP selectivity index is highly correlated with right FFA and fSTS but not with the right OFA nor with any of the left face‐selective regions.
Supplementary figure 4: A. ERPs to faces and chairs at electrode O2. B. Scatter plots showing the correlation of the N170 face‐selectivity index at O2 with the face‐selectivity in the right FFA, fSTS and OFA.
Acknowledgements
The authors thank Talma Hendler for her valuable support. They are grateful to Tamar Goldberg, Gil Issachar, and Yahel Eini for help with data analyses. They also thank Brad Duchaine, Hans Op De Beeck, and the Nancy Kanwisher lab members for their comments on earlier versions of the manuscript.
REFERENCES
- Allen PJ,Josephs O,Turner R ( 2000): A method for removing imaging artifact from continuous EEG recorded during functional MRI. Neuroimage 12: 230–239. [DOI] [PubMed] [Google Scholar]
- Allison T,Puce A,McCarthy G ( 2000): Social perception from visual cues: Role of the STS region. Trends Cogn Sci 4: 267–278. [DOI] [PubMed] [Google Scholar]
- Barton JJ,Press DZ,Keenan JP,O'Connor M ( 2002): Lesions of the fusiform face area impair perception of facial configuration in prosopagnosia. Neurology 58: 71–78. [DOI] [PubMed] [Google Scholar]
- Bentin S,Allison T,Puce A,Perez E,McCarthy G ( 1996): Electrophysiological studies of face perception in humans. J Cogn Neurosci 8: 551–565. [DOI] [PMC free article] [PubMed] [Google Scholar]
- Brainard DH ( 1997): The psychophysics toolbox. Spat Vis 10: 433–436. [PubMed] [Google Scholar]
- Caldara R,Seghier ML ( 2009): The fusiform face area responds automatically to statistical regularities optimal for face categorization. Hum Brain Mapp 30: 1615–1625. [DOI] [PMC free article] [PubMed] [Google Scholar]
- Campanella S,Hanoteau C,Depy D,Rossion B,Bruyer R,Crommelinck M,Guerit JM ( 2000): Right N170 modulation in a face discrimination task: An account for categorical perception of familiar faces. Psychophysiology 37: 796–806. [PubMed] [Google Scholar]
- Carrick OK,Thompson JC,Epling JA,Puce A ( 2007): It's all in the eyes: Neural responses to socially significant gaze shifts. Neuroreport 18: 763–766. [DOI] [PMC free article] [PubMed] [Google Scholar]
- Christov II ( 2004): Real time electrocardiogram QRS detection using combined adaptive threshold. Biomed Eng Online 3: 28. [DOI] [PMC free article] [PubMed] [Google Scholar]
- Cook RD ( 1979): Influential observations in linear‐regression. J Am Stat Assoc 74: 169–174. [Google Scholar]
- Dale AM ( 1999): Optimal experimental design for event‐related fMRI. Hum Brain Mapp 8: 109–114. [DOI] [PMC free article] [PubMed] [Google Scholar]
- Dale AM,Greve DN,Burock MA ( 1999): Optimal stimulus sequence for event‐related fMRI. Germany: Duesseldorf. [Google Scholar]
- De Renzi E ( 1997): Prosopagnosia In: Feinberg TE, Farah MJ, editors. Behavioral Neurology and Neuropsychology. New York: McGraw‐Hill; pp 245–256. [Google Scholar]
- Debener S,Ullsperger M,Siegel M,Engel AK ( 2006): Single‐trial EEG‐fMRI reveals the dynamics of cognitive function. Trends Cogn Sci 10: 558–563. [DOI] [PubMed] [Google Scholar]
- Debener S,Mullinger KJ,Niazy RK,Bowtell RW ( 2008): Properties of the ballistocardiogram artefact as revealed by EEG recordings at 1.5, 3 and 7 T static magnetic field strength. Int J Psychophysiol 67: 189–199. [DOI] [PubMed] [Google Scholar]
- Deffke I,Sander T,Heidenreich J,Sommer W,Curio G,Trahms L,Lueschow A ( 2007): MEG/EEG sources of the 170‐ms response to faces are co‐localized in the fusiform gyrus. Neuroimage 35: 1495–1501. [DOI] [PubMed] [Google Scholar]
- Eichele T,Specht K,Moosmann M,Jongsma ML,Quiroga RQ,Nordby H,Hugdahl K ( 2005): Assessing the spatiotemporal evolution of neuronal activation with single‐trial event‐related potentials and functional MRI. Proc Natl Acad Sci USA 102: 17798–17803. [DOI] [PMC free article] [PubMed] [Google Scholar]
- Gilaie‐Dotan S,Malach R ( 2007): Sub‐exemplar shape tuning in human face‐related areas. Cereb Cortex 17: 325–338. [DOI] [PubMed] [Google Scholar]
- Grill‐Spector K,Knouf N,Kanwisher N ( 2004): The fusiform face area subserves face perception, not generic within‐category identification. Nat Neurosci 7: 555–562. [DOI] [PubMed] [Google Scholar]
- Haxby JV,Hoffman EA,Gobbini MI ( 2000): The distributed human neural system for face perception. Trends Cogn Sci 4: 223–233. [DOI] [PubMed] [Google Scholar]
- Henson RN,Goshen‐Gottstein Y,Ganel T,Otten LJ,Quayle A,Rugg MD ( 2003): Electrophysiological and haemodynamic correlates of face perception, recognition and priming. Cereb Cortex 13: 793–805. [DOI] [PubMed] [Google Scholar]
- Hoffman EA,Haxby JV ( 2000): Distinct representations of eye gaze and identity in the distributed human neural system for face perception. Nat Neurosci 3: 80–84. [DOI] [PubMed] [Google Scholar]
- Horovitz SG,Skudlarski P,Gore JC ( 2002): Correlations and dissociations between BOLD signal and P300 amplitude in an auditory oddball task: A parametric approach to combining fMRI and ERP. Magn Reson Imaging 20: 319–325. [DOI] [PubMed] [Google Scholar]
- Horovitz SG,Rossion B,Skudlarski P,Gore JC ( 2004): Parametric design and correlational analyses help integrating fMRI and electrophysiological data during face processing. Neuroimage 22: 1587–1595. [DOI] [PubMed] [Google Scholar]
- Iannetti GD,Niazy RK,Wise RG,Jezzard P,Brooks JC,Zambreanu L,Vennart W,Matthews PM,Tracey I ( 2005): Simultaneous recording of laser‐evoked brain potentials and continuous, high‐field functional magnetic resonance imaging in humans. Neuroimage 28: 708–719. [DOI] [PubMed] [Google Scholar]
- Itier RJ,Taylor MJ ( 2004a): N170 or N1? Spatiotemporal differences between object and face processing using ERPs. Cereb Cortex 14: 132–142. [DOI] [PubMed] [Google Scholar]
- Itier RJ,Taylor MJ ( 2004b): Source analysis of the N170 to faces and objects. Neuroreport 15: 1261–1265. [DOI] [PubMed] [Google Scholar]
- Jacques C,Rossion B ( 2007): Early electrophysiological responses to multiple face orientations correlate with individual discrimination performance in humans. Neuroimage 36: 863–876. [DOI] [PubMed] [Google Scholar]
- Jeffreys DA,Tukmachi ES ( 1992): The vertex‐positive scalp potential evoked by faces and by objects. Exp Brain Res 91: 340–350. [DOI] [PubMed] [Google Scholar]
- Jiang F,Dricot L,Blanz V,Goebel R,Rossion B ( 2009): Neural correlates of shape and surface reflectance information in individual faces. Neuroscience 163: 1078–1091. [DOI] [PubMed] [Google Scholar]
- Joyce C,Rossion B ( 2005): The face‐sensitive N170 and VPP components manifest the same brain processes: The effect of reference electrode site. Clin Neurophysiol 116: 2613–2631. [DOI] [PubMed] [Google Scholar]
- Kanwisher N,Yovel G ( 2006): The fusiform face area: A cortical region specialized for the perception of faces. Philos Trans R Soc Lond B Biol Sci 361: 2109–2128. [DOI] [PMC free article] [PubMed] [Google Scholar]
- Kanwisher N,McDermott J,Chun MM ( 1997): The fusiform face area: A module in human extrastriate cortex specialized for face perception. J Neurosci 17: 4302–4311. [DOI] [PMC free article] [PubMed] [Google Scholar]
- Kim KH,Yoon HW,Park HW ( 2004): Improved ballistocardiac artifact removal from the electroencephalogram recorded in fMRI. J Neurosci Methods 135: 193–203. [DOI] [PubMed] [Google Scholar]
- Kriegeskorte N,Formisano E,Sorger B,Goebel R ( 2007): Individual faces elicit distinct response patterns in human anterior temporal cortex. Proc Natl Acad Sci USA 104: 20600–20605. [DOI] [PMC free article] [PubMed] [Google Scholar]
- Le Grand R,Mondloch CJ,Maurer D,Brent HP ( 2003): Expert face processing requires visual input to the right hemisphere during infancy. Nat Neurosci 6: 1108–1112. [DOI] [PubMed] [Google Scholar]
- Levy J,Trevarthen C,Sperry RW ( 1972): Reception of bilateral chimeric figures following hemispheric deconnexion. Brain 95: 61–78. [DOI] [PubMed] [Google Scholar]
- Mazard A,Schiltz C,Rossion B ( 2006): Recovery from adaptation to facial identity is larger for upright than inverted faces in the human occipito‐temporal cortex. Neuropsychologia 44: 912–922. [DOI] [PubMed] [Google Scholar]
- McCarthy G,Puce A,Gore JC,Allison T ( 1997): Face‐specific processing in the human fusiform gyrus. J Cogn Neurosci 9: 605–610. [DOI] [PubMed] [Google Scholar]
- Moeller S,Freiwald WA,Tsao DY ( 2008): Patches with links: A unified system for processing faces in the macaque temporal lobe. Science 320: 1355–1359. [DOI] [PMC free article] [PubMed] [Google Scholar]
- Niazy RK,Beckmann CF,Iannetti GD,Brady JM,Smith SM ( 2005): Removal of FMRI environment artifacts from EEG data using optimal basis sets. Neuroimage 28: 720–737. [DOI] [PubMed] [Google Scholar]
- Paller KA,Kutas M,Shimamura AP,Squire LR ( 1987): Brain responses to concrete and abstract words reflect processes that correlate with later performance on a test of stem‐completion priming. Electroencephalogr Clin Neurophysiol Suppl 40: 360–365. [PubMed] [Google Scholar]
- Pitcher D,Walsh V,Yovel G,Duchaine B ( 2007): TMS evidence for the involvement of the right occipital face area in early face processing. Curr Biol 17: 1568–1573. [DOI] [PubMed] [Google Scholar]
- Pitcher D,Garrido L,Walsh V,Duchaine BC ( 2008): Transcranial magnetic stimulation disrupts the perception and embodiment of facial expressions. J Neurosci 28: 8929–8933. [DOI] [PMC free article] [PubMed] [Google Scholar]
- Puce A,Allison T,Bentin S,Gore JC,McCarthy G ( 1998): Temporal cortex activation in humans viewing eye and mouth movements. J Neurosci 18: 2188–2199. [DOI] [PMC free article] [PubMed] [Google Scholar]
- Puce A,Smith A,Allison T. ( 2000): ERPs evoked by viewing facial movements. Cogn Neuropsychol 17: 221–239. [DOI] [PubMed] [Google Scholar]
- Rhodes G ( 1985): Lateralized processes in face recognition. Br J Psychol 76( Part 2): 249–271. [DOI] [PubMed] [Google Scholar]
- Rossion B ( 2008): Constraining the cortical face network by neuroimaging studies of acquired prosopagnosia. Neuroimage 40: 423–426. [DOI] [PubMed] [Google Scholar]
- Rossion B,Jacques C ( 2008): Does physical interstimulus variance account for early electrophysiological face sensitive responses in the human brain? Ten lessons on the N170. Neuroimage 39: 1959–1979. [DOI] [PubMed] [Google Scholar]
- Rossion B,Joyce CA,Cottrell GW,Tarr MJ ( 2003): Early lateralization and orientation tuning for face, word, and object processing in the visual cortex. Neuroimage 20: 1609–1624. [DOI] [PubMed] [Google Scholar]
- Rotshtein P,Henson RN,Treves A,Driver J,Dolan RJ ( 2005): Morphing Marilyn into Maggie dissociates physical and identity face representations in the brain. Nat Neurosci 8: 107–113. [DOI] [PubMed] [Google Scholar]
- Sadeh B,Zhdanov A,Podlipsky I,Hendler T,Yovel G ( 2008): The validity of the face‐selective ERP N170 component during simultaneous recording with functional MRI. Neuroimage 42: 778–786. [DOI] [PubMed] [Google Scholar]
- Schiltz C,Rossion B ( 2006): Faces are represented holistically in the human occipito‐temporal cortex. Neuroimage 32: 1385–1394. [DOI] [PubMed] [Google Scholar]
- Schiltz C,Sorger B,Caldara R,Ahmed F,Mayer E,Goebel R,Rossion B ( 2006): Impaired face discrimination in acquired prosopagnosia is associated with abnormal response to individual faces in the right middle fusiform gyrus. Cereb Cortex 16: 574–586. [DOI] [PubMed] [Google Scholar]
- Schweinberger SR,Pickering EC,Jentzsch I,Burton AM,Kaufmann JM ( 2002): Event‐related brain potential evidence for a response of inferior temporal cortex to familiar face repetitions. Brain Res Cogn Brain Res 14: 398–409. [DOI] [PubMed] [Google Scholar]
- Shibata T,Nishijo H,Tamura R,Miyamoto K,Eifuku S,Endo S,Ono T ( 2002): Generators of visual evoked potentials for faces and eyes in the human brain as determined by dipole localization. Brain Topogr 15: 51–63. [DOI] [PubMed] [Google Scholar]
- Simmons WK,Bellgowan PS,Martin A ( 2007): Measuring selectivity in fMRI data. Nat Neurosci 10: 4–5. [DOI] [PubMed] [Google Scholar]
- Tsao DY,Freiwald WA,Tootell RB,Livingstone MS ( 2006): A cortical region consisting entirely of face‐selective cells. Science 311: 670–674. [DOI] [PMC free article] [PubMed] [Google Scholar]
- Tsao DY,Schweers N,Moeller S,Freiwald WA ( 2008): Patches of face‐selective cortex in the macaque frontal lobe. Nat Neurosci 11: 877–879. [DOI] [PMC free article] [PubMed] [Google Scholar]
- Wagner AD,Schacter DL,Rotte M,Koutstaal W,Maril A,Dale AM,Rosen BR,Buckner RL ( 1998): Building memories: Remembering and forgetting of verbal experiences as predicted by brain activity. Science 281: 1188–1191. [DOI] [PubMed] [Google Scholar]
- Yovel G,Kanwisher N ( 2005): The neural basis of the behavioral face‐inversion effect. Curr Biol 15: 2256–2262. [DOI] [PubMed] [Google Scholar]
- Yovel G,Tambini A,Brandman T ( 2008): The asymmetry of the fusiform face area is a stable individual characteristic that underlies the left‐visual‐field superiority for faces. Neuropsychologia 46: 3061–3068. [DOI] [PubMed] [Google Scholar]
Associated Data
This section collects any data citations, data availability statements, or supplementary materials included in this article.
Supplementary Materials
Additional Supporting Information may be found in the online version of this article.
Supplementary Figure 1: Scalp distribution of the grand averaged response for faces and chairs at two latencies — 100ms and 168ms.
Supplementary Figure 2: Scatter plots showing the low correlations of the N170 face‐selectivity index over the left electrode (P7) with face‐selectivity at left ROIs.
Supplementary Figure 3: A. ERPs to faces and chairs at central electrode Cz showing the face‐selective Vertex Positivity Potential (VPP), B. scatter plots showing the correlations between the face‐selectivity of the VPP with face‐selective areas in both hemispheres. The VPP selectivity index is highly correlated with right FFA and fSTS but not with the right OFA nor with any of the left face‐selective regions.
Supplementary figure 4: A. ERPs to faces and chairs at electrode O2. B. Scatter plots showing the correlation of the N170 face‐selectivity index at O2 with the face‐selectivity in the right FFA, fSTS and OFA.