Abstract
Magnetic interference signals often hamper analysis of magnetoencephalographic (MEG) measurements. Artifact sources in the proximity of the sensors cause strong and spatially complex signals that are particularly challenging for the existing interference‐suppression methods. Here we demonstrate the performance of the temporally extended signal space separation method (tSSS) in removing strong interference caused by external and nearby sources on auditory‐evoked magnetic fields—the sources of which are well established. The MEG signals were contaminated by normal environmental interference, by artificially produced additional external interference, and by nearby artifacts produced by a piece of magnetized wire in the subject's lip. After tSSS processing, even the single‐trial auditory responses had a good‐enough signal‐to‐noise ratio for detailed waveform and source analysis. Waveforms and source locations of the tSSS‐reconstructed data were in good agreement with the responses from the control condition without extra interference. Our results demonstrate that tSSS is a robust and efficient method for removing a wide range of different types of interference signals in neuromagnetic multichannel measurements. Hum Brain Mapp 2009. © 2008 Wiley‐Liss, Inc.
Keywords: magnetoencephalography, auditory, cortex, brain, artifact, single response
INTRODUCTION
Magnetoencephalography (MEG) provides (sub)millisecond temporal resolution for noninvasive tracking of synchronous cortical activity in the human brain [for reviews of the MEG method, see Hämäläinen et al., 1993; Hari, 2004]. The applications of MEG expand from basic to clinical research and are rapidly increasing. As the MEG signals are typically only 50–1,000 fT in strength, they can be easily contaminated by interference arising from magnetic materials or from ambient magnetic interference. MEG recordings are usually performed within a magnetically shielded room and with sensors that are designed to be near‐sighted, considerably more sensitive to brain signals than to distant interference sources.
The preferred way to deal with nonbiological artifacts is to prevent them. If this is not possible, various artifact‐rejection and compensation methods can be applied. One commonly used means is to use high‐pass, low‐pass, or band‐pass filtering. However, the brain signal of interest may be in the same frequency range and thus disappear or strongly attenuate. One may also reject epochs that contain large artifacts. Again the problem is that the real brain signal may be lost as well.
Efficient interference removal can be achieved by utilizing the information of the whole multichannel sensor array. In the signal‐space‐projection method [SSP; Uusitalo and Ilmoniemi, 1997], the output of the multichannel measurement is considered to form a distinct vector in a signal space. External interference is then removed by projecting the measured signal vector into a subspace orthogonal to a predetermined signal space, spanned by interference signal vectors. The interference space is usually estimated by a statistical analysis of the data from an MEG recording performed in the presence of environmental background signals. Interference from environmental sources stays quite stable inside a magnetically shielded room, and SSP can be successfully used for artifact suppression from other sets of data without updating the interference subspace. However, if the spatial interference patterns change, e.g., because of artifact sources inside the room, a new SSP operator has to be computed.
Taulu and coworkers [Taulu and Kajola, 2005; Taulu et al., 2005] recently introduced a new multichannel signal‐processing method, signal‐space separation (SSS), based on physical properties of the magnetic fields and on the possibility with the present‐day whole‐scalp coverage neuromagnetometers to pick up the magnetic field pattern simultaneously over the whole brain. The main applications of SSS include artifact suppression, movement compensation, and a device‐free representation of the signals that can be used, e.g., for standardization between different measurement configurations and devices.
The basic principle of SSS is the following. When data are available from a whole‐scalp‐covering sensor helmet, the multichannel MEG signals can be divided into two sets of elementary magnetic fields: one set for fields arising from sources inside the sensor helmet and another for fields arising from sources outside. Because the MEG signals obey Maxwell's equations in a source‐free volume, the multichannel MEG signals can at any moment be uniquely decomposed into the two sets of elementary fields [Taulu and Kajola, 2005]. The amplitudes of the elementary fields can then be determined from the measurement carried out with a well‐calibrated whole‐scalp‐covering neuromagnetometer. Consequently, the brain signals can be reconstructed by retaining the elementary fields that correspond only to sources inside the sensor helmet; this procedure therefore generates the SSS‐reconstructed internal signals. For a typical MEG measurement, SSS can suppress external interference by a factor exceeding 100, even when the interference sources are located inside the magnetically shielded room [Taulu et al., 2005].
When stimulators or pacemakers are located in the immediate vicinity of the sensors, the spatial SSS model cannot adequately describe all sources of the magnetic field. Signals produced by these kinds of sources are typically spatially complex and strong enough to exceed the sensor noise. If the spatial frequencies included in the SSS model do not completely describe the artifact field, the artifact will appear both in the internal and the external part of the SSS reconstruction. Fortunately, this leakage of the signal to both parts of the SSS model can be utilized in the recognition and removal of the artifact [Taulu and Simola, 2006]: Similar temporal patterns in both SSS parts strongly suggest that an artifact source has generated a field that leaks into both parts. This procedure is justified in practice, because the brain signals, faithfully represented by the internal SSS basis, do not leak into the external SSS basis. Assuming that the temporal patterns of brain signals and artifacts differ, the recognized leaking waveform can be classified as an artifact.
The recognized artifact time patterns can be removed, by projecting them out in the time domain from the SSS‐reconstructed internal signals. In this operation, a time‐domain signal basis is first constructed from the artifacts. Then, the waveform of each channel in the SSS‐reconstructed internal data, including the brain signal and the leaking artifact, is projected to a basis orthogonal to the artifacts. As a consequence, the artifacts are suppressed below the sensor noise while the brain signals persist in the reconstruction. In brief, the spatial SSS separates the brain signals from far‐away external interference, located, say, at a distance more than 0.5 m from the sensors, and the temporal extension of SSS, the temporally extended signal space separation method (tSSS), removes the contribution of the nearby artifact sources by utilizing time information in addition to Maxwell's equations. In the absence of any nearby artifacts, the result of the tSSS algorithm is equivalent to SSS.
SSS has already been used for suppression of external interference and data transformation but only in studies in which the sources and waveforms of the studied signals were inaccurately known a priori [Cheour et al., 2004; Huotilainen et al., 2005; Imada et al., 2006; Pihko et al., 2004]. The performance of tSSS has been tested with simulated data, with promising results also with epileptic spikes, for which, however, the correct locations and waveforms were not known [Taulu and Simola, 2006]. Artifacts caused by a deep brain stimulator have been removed by tSSS [Mäkelä et al., 2007], but control data without the stimulator device were not available.
To evaluate the full value of tSSS, it would be necessary to study real signals whose sources are well established. We therefore explored the effect of tSSS on auditory‐evoked fields, known to arise in the supratemporal auditory cortex [for a review, see Hari, 1990]. Complex magnetic artifacts were purposefully introduced to the ongoing MEG activity during the recording of auditory‐evoked fields by rotating three magnets outside the magnetically shielded room and by fixating a piece of magnetized wire to the lip of a subject who was moving his mouth during the recording. In addition to the analysis of averaged evoked fields, we also studied the replicability of the waveforms of single‐trial auditory responses and the corresponding source locations. The results strongly support the feasibility of the tSSS method in removing, with minimal distortion, external magnetic artifacts from MEG signals.
MATERIALS AND METHODS
The SSS Method
As has been described earlier [Taulu and Kajola, 2005; Taulu and Simola, 2006], the original signals were divided into two sets of elementary fields, separately corresponding to signal sources internal and external to the sensor array. These two volumes are bounded by spheres with radii defined as the smallest and largest distance from the sensor array to a chosen origin. Figure 1 illustrates the internal sphere enclosing the brain and the external volume excluding the sensor array and extending to infinity. Thus, the internal and external volumes are uniquely defined although the sensor array does not constitute a full sphere. In this procedure, the elementary fields are required to satisfy in the measurement volume the Laplace's equation, the general solution of which is an expansion of the spherical harmonic functions. Because of the properties of these functions, the elementary fields can be organized according to their spatial frequencies. The higher the spatial frequency, the faster is the decrease in amplitude of the corresponding field as a function of distance. This behavior naturally limits the number of elementary fields that exceed the noise level of the MEG sensors. These fields have to be included in the linear model that describes all measurable magnetic fields generated by physiological brain sources or by reasonable interference sources located at least a few centimeters from the sensors. This geometrical configuration does not separate all artifact and brain sources from each other. For example, the eyes are located approximately on the boundary of the inner sphere. Therefore, the spatial linear model does not classify eye blink signals as artifacts.
Figure 1.
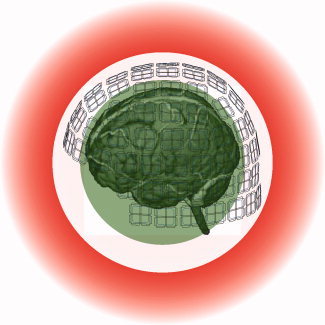
Geometry of a MEG measurement. The green (internal) and red (external) volumes contain the brain and interference sources, respectively. The white region in between is free of magnetic sources, except when artifacts arise from magnetic impurities, braces, stimulators, or other nearby disturbance sources.
In SSS, the output of a multichannel measurement is expressed as a linear combination of elementary signals based on the earlier description. The corresponding harmonic expansions for the internal and external signals are extended to “order values” L in and L out, respectively, that define the highest spatial frequencies in the model. We used L in = 8 and L out = 3, known to be a suitable choice in whole‐scalp MEG recordings [Taulu et al., 2005]; this selection leads to 95 elementary fields, 80 of these for internal and 15 for external contributions.
Temporally Extended SSS
In the temporal analysis performed by means of tSSS, the data are divided into segments that are separately processed. In the present implementation, the segments are blocks of data with N channels with n samples in each and they follow each other in time without overlap. The number of samples n is usually fixed and designed to be large enough to ensure sufficient temporal difference between the brain signals and artifacts. The rationale of this choice is as follows. Within each block, the data are separated into internal, intermediate, and external parts by SSS (see Fig. 1). After this spatial step, the possible temporally correlated signals between the internal and intermediate parts are recognized by a subspace‐intersection method [Golub and Van Loan, 1996; Taulu and Simola, 2006]. Alternatively the internal and external signals could be compared with each other. Assuming that the brain signals are temporally uncorrelated with the artifacts, the recognized correlated signals, if any, are interpreted as artifacts. The recognized artifact signals are projected out in time domain by a linear algebraic operation, where first a signal subspace is composed of the temporal artifact waveforms, represented as vectors that comprise the sampled signal values. Then, the SSS‐reconstructed internal signals, also represented as vectors, are projected into a subspace that is orthogonal to the artifact subspace. Brain signals remain spatially intact in this operation, and temporal distortions only occur if they are temporally correlated with the artifact waveforms within the applied time segment. The brain and artifact signals can be considered random variables that are statistically independent of each other. They can be represented as vectors when decomposed into some suitable basis components, e.g., the Fourier components consisting of sine and cosine functions and their corresponding amplitudes. Statistically, in a high‐enough dimensional basis, any two randomly chosen vectors are orthogonal to each other. Therefore, temporal distortions in tSSS can be avoided if the dimension is sufficiently high given the frequency band of interest and the length T of the time window.
The temporal signal can be represented as a signal vector s composed of the sampled signal values: s = [s(t 1) s(t 2) … s(tn)], where tj is the time instant of the jth sample. The dimension of such a signal is n, and it can be decomposed into at most n degrees of freedom, i.e. n independent waveforms. With finite dimensions n, the angle between two random signals is less than 90°. On the other hand, random noise in the recorded data creates uncertainty in the direction of the signal vector s, and we should choose a time window length T corresponding to n that deviates from the orthogonality condition by an angle smaller than this noise uncertainty. The effective dimension of a signal with frequency f during a time segment of length T is n = Tf. Denoting the high enough dimension by n o, we can define the criterion T > n o/f.
The applied 4‐s and 8‐s epochs of brain and artifact signals both turned out to be long enough to be essentially orthogonal. In principle, T is not limited to a few seconds, but longer windows typically do not provide practical benefit, except for very‐low‐frequency phenomena. Because of the finite window length, tSSS also acts as a high‐pass filter, with the corner frequency inversely proportional to the window length. The correlation limit, introduced by Taulu and Simola [2006] for the decision to label signals as artifacts, ranged from 0.90 to 0.95.
Measurement of Auditory‐Evoked Fields
A healthy adult right‐handed male (45 years), well experienced in MEG measurements, volunteered as the subject for recordings carried out with the prototype of the Elekta Neuromag® 306‐channel neuromagnetometer at the Low Temperature Laboratory, Helsinki University of Technology. The device comprises planar gradiometers and magnetometers, based on thin‐film technology. The planar gradiometers are mostly sensitive to fields arising from nearby sources, whereas the magnetometers couple strongly also to distant sources, and therefore the system provides accurate information of both brain signals and the interference. Thus, it is possible to construct a numerically stable SSS model that enables robust interference suppression.
The MEG recordings had a prior approval by the local ethics committee.
The subject received binaurally 50‐ms 1‐kHz tone pips (60 dB above hearing level) once every 2,005 ms. The MEG signals were filtered through 0.1–200 Hz and digitized at 600 Hz. Data were collected continuously during 100–130 single responses in each of the following conditions.
-
i
During the Control condition, the measurement was done in the presence of typical environmental interference that usually arises from sources located quite far from the room, resulting in essentially homogeneous magnetic fields. Such interferences can usually be satisfactorily handled by conventional artifact suppression methods, and the condition therefore served as a suitable reference measurement for tSSS.
-
ii
During the External interference condition, three 60‐mm long ellipsoid‐shaped permanent magnets were rotated and moved outside the shielded room, at a distance of less than 1 m from its wall. The resulting field contained much stronger gradients than interference from far‐away sources, and it consequently produced inside the shielded room a spatially and temporally more complex field than was the typical interference in the control condition.
-
iii
During the Nearby interference condition, a piece of magnetized wire was attached to the subject's lower lip, and the subject was asked to move his mouth continuously during the measurement to produce large nearby‐artifacts with considerably higher spatial complexity than in condition (ii).
Data Analysis
The raw data from the interference conditions (ii) and (iii) were processed by tSSS and averaged off‐line. The effect of the window length T on the time pattern of the response was studied using data from condition (iii). The waveforms of both averaged and single‐trial responses were then compared with unprocessed data obtained in the Control condition (i). Furthermore, the field patterns of both averaged auditory fields and of single‐trial auditory‐evoked responses were modeled with current dipoles located in a spherical volume conductor, one dipole in each hemisphere, and the interference and control conditions were again compared.
After visual examination of the quality of the averaged responses, the main emphasis was put on single responses. The goal was to analyze individual responses without any other preprocessing besides tSSS. To this end, the sensor signals were reconstructed by tSSS, and then each individual response was analyzed without any temporal or spatial filtering (the original passband of 0.1–200 Hz) was kept. A subset of channels was selected from the left temporal lobe where auditory responses, clearly stronger than the baseline level, were discerned. The peak latencies of the responses were visually determined and the dipole locations, orientations, and strengths were found by least‐squares search. The variability in the dipole location was then compared with the theoretically determined confidence volume [Hämäläinen et al., 1993; Kaukoranta et al., 1986].
RESULTS
Characterization and Removal of Interference Signals
The spatial and temporal characteristics of the interference signals were markedly different in the three conditions.
Figure 2 illustrates from one temporal‐lobe gradiometer channel a 20‐s epoch of spontaneous MEG during the three conditions. In the Control condition, some of the sounds are followed by clearly visible auditory responses. In the interference conditions (ii) and (iii) the responses are obscured by artifacts that are much larger than in the Control condition, especially at low frequencies. Most of the high‐frequency interference, equally present in all conditions, is caused by the 50‐Hz power line signal and its harmonics.
Figure 2.
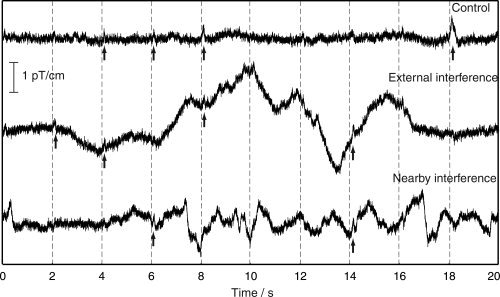
Original signals from one left‐temporal‐lobe gradiometer channel during the Control condition (top), External interference condition (middle), and Nearby interference condition. Stimulus times are denoted by dashed vertical lines. Arrows point to visible auditory responses.
Figure 3 illustrates the effects of the SSS and tSSS artifact elimination procedures. A 10‐s epoch of the original MEG signal from one magnetometer above the left temporal lobe was divided to the internal and external field components by means of SSS and thereafter additionally processed by tSSS; the reconstructions were based on the information measured by all channels.
Figure 3.
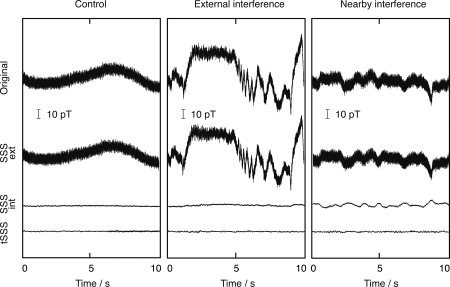
Original and processed signals from one magnetometer during the three conditions. From top to bottom: Original data, SSS reconstruction for signal arising from the outside of the sensor array (SSS external), SSS reconstruction for signal arising from the inside the sensor array (SSS internal), and tSSS reconstruction for the internal signal.
The original signal of the Control condition (left panel) contains magnetic interference typical to a laboratory environment, with contributions from power line, electric instruments, traffic, etc. The SSS correctly classifies the 50‐Hz and low‐frequency signals as external signals. Correspondingly, the SSS‐ and tSSS‐reconstructed signals essentially contain brain signals only.
In the External interference condition, the field generated by the moving magnets was superimposed on the environmental field. The data thus contained considerably stronger signals than in the previous case. Furthermore, the rotation of the magnets caused additional components of higher temporal frequency. Although the spatial pattern of the interference, especially manifested by increased spatial complexity, changed from the first measurement, SSS was still applicable because the interference source was located well outside the sensor array. SSS clearly classified the complex interference as an external signal.
In the Nearby interference condition (the right column of Fig. 3), the SSS model was no longer sufficient for clear signal separation, as is evident from the about three times stronger baseline fluctuation in the internal signal compared with the two previous conditions; however, most of the signal, e.g., the power‐line component, is still classified as having an external origin. In this case, because of the leakage of the magnetic fields that have higher spatial frequencies than those included in the SSS model, the temporal pattern of the nearby artifact source is seen both in the internal and external reconstruction. This pattern was identified by subspace correlation analysis [Taulu and Simola, 2006] that decomposes the temporal principal components of both the internal and external time signals and labels the components common to both parts as nearby artifacts. The nearby artifacts were temporally projected out from the internal signal to produce the tSSS‐reconstructed result that only contained brain signals. The root‐mean‐squares (standard deviations) of the tSSS‐reconstructed signals were comparable in all conditions. The values were, for the lowest traces of Figure 3 from left to right, 259, 317, and 367 fT, calculated over the whole frequency range from 0.1 to 200 Hz. According to spectral analysis, the differences were mainly due to variations around 10 Hz, thus possibly reflecting changes in the background activity in this subject.
Averaged Evoked Responses
In the Methods section, the lower limit for the window length was determined as T > n o/f, where orthogonality was required for the n o‐dimensional random signals. Here we determine experimentally a suitable n o by calculating the average angle between two n‐dimensional random signals as a function of n. An angle close to 90° is considered to correspond to a high‐enough dimension n o. The top of Figure 4 shows the angle between two simulated random time signals as a function of their dimension. The signals were composed as linear combinations of altogether n orthonormal sine and cosine components, i.e. the Fourier components, for which the amplitudes were uniformly distributed from −1 to 1. For each dimension value n, the presented angle is the mean value of 1,000 realizations of the n‐dimensional set of amplitudes. At low dimensions, the angle increases steeply and reaches about 80° at n = 20 and 85° at n = 80. As a rule of thumb, n o = 40, with the angle clearly exceeding 80°, is a safe dimension, because the error resulting from the less than 10° deviance from orthogonality will be masked by the uncertainty in the direction of the brain signal vector because of random noise: The uncertainty of any brain signal with a signal‐to‐noise ratio (SNR) smaller than 1/tan(10°) ≈ 5.7 exceeds 10°. In other words, any angle exceeding 80° between brain and artifact signals can be considered to reflect so high independence that the projection operator of tSSS should not produce significant temporal distortion.
Figure 4.
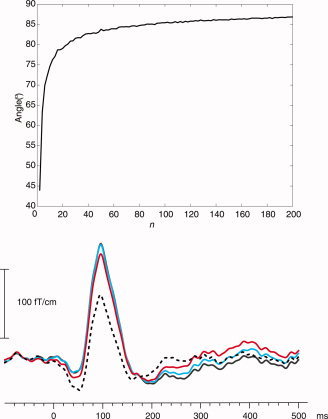
Top: The mean angle between two randomly chosen vectors as a function of their dimension, n. The vectors were composed as linear combinations of orthonormal sine and cosine components, with uniformly distributed random amplitudes ranging from −1 to 1. Bottom: The effect of window length T on the tSSS‐reconstructed auditory response. The values of T were 1 s (black dashed), 2 s (red), 4 s (blue), and 8 s (black solid; under the blue curve during the peak). The data were low‐pass filtered at 70 Hz.
The bottom of Figure 4 shows the averaged auditory response from condition (iii) on a single gradiometer channel tSSS‐processed with window lengths of T = 1, 2, 4, and 8 s. The response is clearly damped at T = 1 s (black dashed line) and still slightly decreased at T = 2 s (red line). Signals processed with T = 4 s and T = 8 s (blue and black lines) do not differ within the first 180 ms. This result is in good agreement with the dimension plot (Fig. 4 top) suggesting n o = 40 to be a reasonably high dimension in terms of orthogonality. For frequencies of about 10 Hz and above, there should be no temporal distortion with T > 40/10 Hz = 4 s, which is supported by Figure 4. The locations of current dipoles fitted to the 100‐ms response were within 4 mm across the different T values.
Figure 5 shows the distribution of averaged (N = 108), but otherwise unprocessed responses from the Control condition. Clear auditory‐evoked fields peak about 100 ms after stimulus onset above both temporal lobes, thereby replicating the very well‐known spatial pattern of the 100‐ms auditory‐evoked responses [Hari, 1990; Hari et al., 1980].
Figure 5.
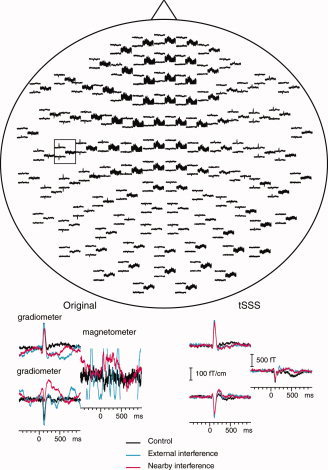
Top: Averaged auditory responses from the 306 channels during the Control condition. The display shows all channels as viewed from above the head, with the subject's nose pointing up in the plane of the paper. The sensor array contains sensor triplets, with two orthogonal planar gradiometers and one magnetometer in each triplet. Bottom: Original (left) and tSSS‐processed (right) averaged signals from a subset of two gradiometers and one magnetometer indicated by the rectangle in the upper figure.
Figure 5 also shows a subset of gradiometer and magnetometer channels before and after tSSS. Averaged gradiometer signals are essentially intact in the Control condition, whereas the magnetometers suffer from, e.g., power‐line disturbance. Both in the External and Nearby interference conditions—where the artifacts were generated by the magnets and the piece of magnetized wire, respectively—even the gradiometer signals are clearly distorted. The tSSS‐processed results, however, are essentially free of interference in all cases and the waveforms of the auditory responses are similar across conditions.
Figure 6 shows the corresponding field patterns on the sensor surface 106 ms after the stimulus onset; the contours are based on the signals of all 306 channels. The field patterns of the original data are dipolar in the Control condition but badly distorted in the other two conditions. However, the field patterns based on the tSSS‐reconstructed signals reveal nicely dipolar, and similar, field patterns in all three cases.
Figure 6.
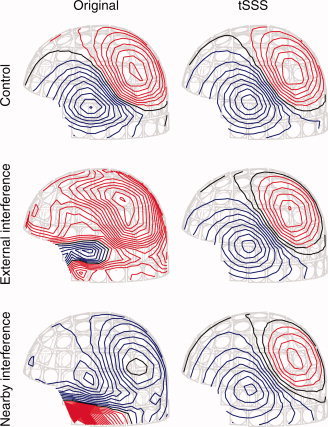
Field patterns based on the original signals (left column) and the tSSS‐reconstructed signals (right column) for the Control, External interference, and Nearby interference conditions. The contour step is 100 fT in all field patterns. The red color corresponds to magnetic flux coming out of the sensor surface, and the blue color indicates field in the opposite direction.
Compared with the source modeling results obtained with the unprocessed Control data, the current dipoles for the tSSS‐processed data were within 2 mm in the Control condition, within 1 mm in the External condition, and within 5 mm in the Nearby interference condition.
Single Responses
The interference was largest in the experiment with the permanent magnets. Figure 7 shows the spatial distribution of a single unprocessed 500‐ms epoch, starting 100 ms before an auditory stimulus. The signals are very noisy and no auditory response can be discerned. Some of the magnetometer signals have partially disappeared from the figure because their amplitudes are beyond the scale range from −2,750 to 2,750 fT. In contrast, a rather clear response can be seen in the tSSS‐reconstructed data on the right.
Figure 7.
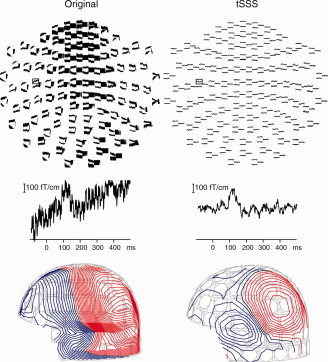
Spatial distribution of a single auditory response before (top left) and after (top right) tSSS processing. No further temporal filtering was applied. The channel of the close‐up is indicated by a rectangle. Bottom: The corresponding field distribution of a single auditory response before (left) and after (right) tSSS processing. The contour step is 100 fT.
The good SNR of the tSSS‐processed single epoch response is reflected in the corresponding regular field distribution of Figure 7, with the typical dipolar pattern of the auditory response. In the unprocessed data, this field component was buried under the interference.
Figure 8 shows single responses from one left temporal‐lobe gradiometer channel during all three conditions: Control (i), External Interference (ii), and Nearby Interference (iii) conditions after three different processing procedures. The top panels show the unprocessed data in which the responses are only vaguely distinguishable as the interference dominates the signal, especially in condition (ii). The middle panels illustrate the signals after application of a SSP operator, based on a previous empty room recording containing environmental interference. In the Control condition (i), the SSP operator efficiently removed the interference so that the clear responses peak around 100 ms; however, SSP did not sufficiently suppress the interference in conditions (ii) and (iii). The lowest panels demonstrate that tSSS produced satisfactory results in all three conditions, so that the 100‐ms responses became prominent in almost each trace. This similarity of the reconstructed signals across conditions indicates that tSSS is quite immune to changes in the artifacts.
Figure 8.
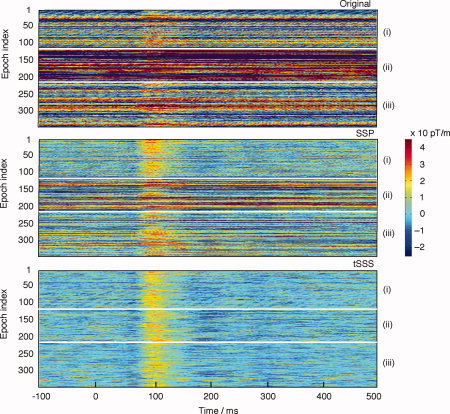
Single‐trial plot of 340 consecutive individual auditory responses (108, 102, and 130, respectively, for the three different conditions) after three different processing procedures: Original (top panels), data processed by the standard SSP operator corresponding to usual environmental interference (middle panels), tSSS‐reconstructed data (bottom). In all boxes, the different conditions are displayed in the order Control (i), External interference (ii), and Nearby interference (iii); these conditions are separated in each panel by thin white horizontal lines.
Figure 9 shows 30 consecutive tSSS‐reconstructed auditory single‐epoch waveforms during the Control condition. The signals are from the same gradiometer channel as in Figure 8, and they show a good SNR and a stable baseline.
Figure 9.
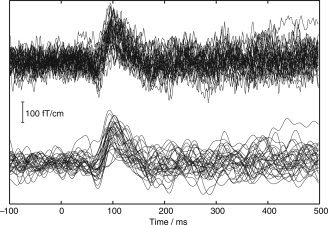
Thirty consecutive tSSS‐reconstructed auditory responses from the Control condition. The upper curves contain the whole frequency band 0.1–200 Hz, whereas the lower signals have been low‐pass filtered at 40 Hz.
For each individual response, a current dipole was fitted to a subset of tSSS‐reconstructed channels over the left hemisphere; the subset typically contained 60–100 channels, comprising both magnetometers and gradiometers. The SNR of the single responses varied, but in most cases the fit yielded goodness‐of‐fit (g) values better than 80%, sometimes even reaching 95%. Such high g values were possible because the tSSS process suppressed the interference to the level of the sensor noise and because the auditory response clearly exceeded the background brain activity, resulting in a very good SNR. Those dipoles in the Control and External interference conditions, for which the g values exceeded 85%, had a computational confidence volume [Hämäläinen et al., 1993] smaller than an ellipsoid with dimensions of about ±4 mm along the direction transverse to the direction of the current dipole, ±9 mm along it and ±11 mm in depth, respectively.
Figure 10 shows single‐trial dipole locations superimposed on the subject's own structural brain slices, with clear clustering around the supratemporal auditory cortex. These locations agree with previous results, indicating that the 100‐ms auditory‐evoked response is generated in the supratemporal plane, just posterior to the primary auditory cortex [Hari, 1990; Hari et al., 1980; Lütkenhöner and Steinsträter 1998].
Figure 10.
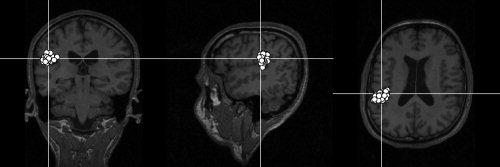
Locations of current dipoles of single auditory responses superimposed on the subject's own magnetic resonance image slices. The goodness‐of‐fit values were for all plotted dipoles better than 85%.
Figure 11 shows the corresponding x‐, y‐, and z‐coordinates of the dipoles in the right‐handed head coordinate system with x‐axis aligned to a line going from the left to the right preauricular point and y‐axis coming out of the nasion, plotted separately for tSSS‐reconstructed single responses from the Control condition (solid lines) and the External interference condition (dashed lines). The distributions are highly similar in both conditions. The standard deviations are ±6 mm for the x‐coordinate, ±4 mm for the y‐coordinate, and ±5 mm for the z‐coordinate. Here the x‐coordinate corresponds best to dipole depth and has the largest variance, as predicted, whereas the y coordinate is close to being transverse to the dipole direction and it accordingly has the smallest variance.
Figure 11.
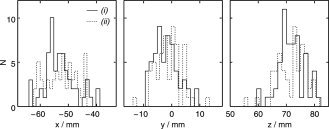
Histograms of x‐, y‐, and z‐coordinates for all current dipoles of Figure 10. N refers to the number of observations, and solid and dotted lines correspond to the Control (i) and External interference (ii) conditions. The x‐axis runs from left to right preauricular point, the y axis points toward the nasion, and the z‐axis is orthogonal to xy‐plane and is directed to the top of the head.
DISCUSSION
We investigated the validity of the tSSS in suppressing interference in MEG measurements. As an important extension to any previous tSSS applications to real MEG data that have lacked artifact‐free control conditions [Mäkelä et al., 2007; Taulu and Simola, 2006], we now for the first time studied the feasibility of tSSS analysis in removing artifacts from MEG signals, auditory‐evoked fields, whose cerebral generator sites are very well established in previous extensive studies [for reviews, see e.g. Hari, 1990, 2004]. In three interference conditions—normal environment, external interference with deliberately increased amplitude and spatial complexity, and additional nearby interference—tSSS efficiently removed the artifacts and left the auditory‐evoked responses intact. The resulting waveforms and source locations were in good agreement with the control condition. The high quality of the tSSS‐reconstructed data also allowed single‐trial analysis.
Source locations of single tSSS‐reconstructed auditory responses were anatomically feasible and their spatial scatter was in good agreement with the theoretically calculated confidence volumes. The scatter would have been even smaller if the responses would have been low‐pass filtered, e.g. with the typical cutoff at 40 Hz, instead of the applied wide frequency range from 0.1 to 200 Hz.
The tSSS method is simple to use. It requires only two assumptions: first that the brain and the external interference sources can be separated geometrically, and second that the brain signals are not temporally correlated with any signal arising from a nearby artifact source. Therefore, tSSS can be widely applied for MEG multichannel measurements. The analysis described in this article generalizes to different kinds of MEG measurements, since according to the principle of linear superposition, all brain sources can be constructed from elementary current dipoles, such as the dipolar sources investigated here.
The tSSS method is based on spatial SSS, which is straightforward to implement for whole‐scalp‐covering MEG devices. Compared with the spatial SSS, however, computation of tSSS currently takes about 10 times longer. The tSSS process for t minutes of 306‐channel MEG data sampled at 600 Hz takes about t minutes with present Linux computers. Multiprocessor architectures are expected to speed up the calculations significantly. Optimization of the tSSS algorithms is thus an important future challenge.
The present work showed, both theoretically and experimentally, that the tSSS‐related modification of the temporal pattern of the brain signals can be alleviated by prolonging the time windows during which the temporal analysis and projections are done; the appropriate window length that renders the brain signal orthogonal to the interference to be removed is inversely proportional to the frequency of interest.
The obtained results, based on a single subject's auditory responses, are expected to be valid more generally because, in practice, tSSS (and SSS) are not sensitive to the location or spatial extent of the brain sources. The reason is that these sources are always located at least a couple of centimeters from the sensors, and therefore the associated magnetic fluxes detected by the sensors are spatially relatively smooth. The SSS model is designed to cover the spatial features that typical MEG signals may contain [Taulu et al., 2005]. It is adaptive in the sense that it recognizes and removes artifacts solely on the basis of the measured data and sensor geometry. In addition, it only uses data of proper MEG sensors containing both the brain signals and the interfering artifacts that need to be removed. Thus, it is possible to obtain more accurate estimates of the artifacts in MEG signals than, e.g., by artifact‐suppression methods based on reference channels located typically more than 10 cm from the MEG sensors [Vrba and Robinson, 2001]. The performance of adaptive reference‐channel methods [de Cheveigné and Simon, 2007] is greatly impaired when nearby artifacts have significant amplitudes on the MEG sensors but are undetectable by the far‐away reference sensors. In addition, extraction of temporally complex artifacts may require a large number of sensors, whereas the number of reference sensors is often quite small. Compared with SSP [Uusitalo and Ilmoniemi, 1997], tSSS is easier to use when the interference patterns are constantly changing, because recalculation of the interference subspace in SSP requires user intervention.
The closer the artifact source is to the brain, the more it will spatially resemble a brain signal. Artifacts generated by eye movements, eye blinks, and contractions of facial muscles are, therefore, challenging for tSSS, and their successful removal still requires further research. Previously, independent component analysis (ICA) has been used successfully to remove eye‐related artifacts [Vigário et al., 1997], and comparison of tSSS with ICA would be of interest in the future.
As long as the interference does not saturate the signals, the tSSS method makes MEG essentially immune to the magnetic environment where the measurements are conducted. Thus good‐quality MEG data can be obtained even if the subject, the assisting personnel, or the equipment contain some magnetic material. Consequently, new possibilities emerge for investigations previously considered too challenging for interference suppression, such as MEG recordings from patients with implanted stimulators or metal objects.
Acknowledgements
We thank Antti Ahonen and Juha Simola for comments on the manuscript, Jari Kainulainen for help in the measurements, and Riitta Pietilä for help in preparing the figures.
REFERENCES
- Cheour M,Imada T,Taulu S,Ahonen A,Salonen J,Kuhl P ( 2004): Magnetoencephalography is feasible for infant assessment of auditory discrimination. Exp Neurol 190: 44–51. [DOI] [PubMed] [Google Scholar]
- de Cheveigné A,Simon J ( 2007): Denoising based on time‐shifted PCA. J Neurosci Meth 165: 297–305. [DOI] [PMC free article] [PubMed] [Google Scholar]
- Golub G,Van Loan C. 1996. Matrix Computations, 3rd ed The John Hopkins University Press, Baltimore, Maryland. [Google Scholar]
- Hämäläinen M,Hari R,Ilmoniemi RJ,Knuutila J,Lounasmaa OV ( 1993): Magnetoencephalography–theory, instrumentation, and applications to noninvasive studies of the working human brain. Rev Mod Phys 65: 413–497. [Google Scholar]
- Hari R ( 1990): The neuromagnetic method in the study of the human auditory cortex In: Grandori F,Hoke M,Romani GL, editors. Auditory Evoked Magnetic Fields and Electric Potentials (Advances in Audiology, Vol. 6). Basel: Karger; pp 222–282. [Google Scholar]
- Hari R ( 2004): Magnetoencephalography in clinical neurophysiological assesment of human cortical functions In: Niedermeyer E,Lopes da Silva F, editors. Electroencephalography: Basic Principles, Clinical Applications, and Related Fields, 5th ed Lippincott, Williams & Wilkins, Philadelphia, USA: pp 1165–1197. [Google Scholar]
- Hari R,Aittoniemi K,Järvinen ML,Katila T,Varpula T ( 1980): Auditory evoked transient and sustained magnetic fields of the human brain: Localization of neural generators. Exp Brain Res 40: 237–240. [DOI] [PubMed] [Google Scholar]
- Huotilainen M,Kujala A,Hotakainen M,Parkkonen L,Taulu S,Simola J,Nenonen J,Karjalainen M,Näätänen R ( 2005): Short‐term memory functions of the human fetus recorded with magnetoencephalography. NeuroReport 16: 81–84. [DOI] [PubMed] [Google Scholar]
- Imada T,Zhang Y,Cheour M,Taulu S,Ahonen A,Kuhl P ( 2006): Infant speech perception activates Broca's area: A developmental magnetoencephalography study. Neuroreport 17: 957–962. [DOI] [PubMed] [Google Scholar]
- Kaukoranta E,Hämäläinen M,Sarvas J,Hari R ( 1986): Mixed and sensory nerve stimulations activate different cytoarchitechtronic areas in the human primary somatosensory cortex SI. Exp Brain Res 63: 60–66. [DOI] [PubMed] [Google Scholar]
- Lütkenhöner B,Steinsträter O ( 1998): High‐precision neuromagnetic study of the functional organization of the human auditory cortex. Audiol Neuro‐Otol 3: 191–213. [DOI] [PubMed] [Google Scholar]
- Mäkelä JP,Taulu S,Pohjola J,Ahonen A,Pekkonen E ( 2007): Effects of subthalamic nucleus stimulation on spontaneous sensorimotor MEG activity in a parkinsonian patient. Int Congr Ser 1300: 345–348. [Google Scholar]
- Pihko E,Lauronen L,Wikström H,Taulu S,Nurminen J,Kivitie‐Kallio S,Okada Y ( 2004): Somatosensory evoked potentials and magnetic fields elicited by tactile stimulation of the hand during active and quiet sleep in newborns. Clin Neurophysiol 115: 448–455. [DOI] [PubMed] [Google Scholar]
- Taulu S,Kajola M ( 2005): Presentation of electromagnetic multichannel data: The signal space separation method. J Appl Phys 97: 1249051–10. [Google Scholar]
- Taulu S,Simola J (2006): Spatiotemporal signal space separation method for rejecting nearby interference in MEG measurements. Phys Med Biol 51: 1759–1768. [DOI] [PubMed] [Google Scholar]
- Taulu S,Simola J,Kajola M ( 2005): Applications of the signal space separation method. IEEE Trans Sign Proc 53: 3359–3372. [Google Scholar]
- Uusitalo M,Ilmoniemi RJ ( 1997): Signal‐space projection method for seprating MEG or EEG into components. Med Biol Eng Comput 35: 135–140. [DOI] [PubMed] [Google Scholar]
- Vigário R,Jousmäki V,Hämäläinen M,Hari R,Oja E ( 1997): Independent component analysis for identification of artifacts in magnetoencephalographic recordings. Adv Neur Inform Process Syst (NIPS*97): 229–235. [Google Scholar]
- Vrba J,Robinson S ( 2001): Signal processing in magnetoencephalography. Methods 25: 249–271. [DOI] [PubMed] [Google Scholar]


