

Abstract
Our primary question was to learn whether mentally composing drawings of their own choice produce different brain electric features in artists and laymen. To this purpose, we studied multichannel electroencephalograph (EEG) signals from two broad groups (all participants were females): artists (professionally trained in visual arts) and non‐artists (without any training in art). To assess the underlying synchronization, which is assumed to be the platform for general cognitive integration between different cortical regions, three measures inspired by nonlinear dynamical system theory were applied as follows: (1) index based on generalized synchronization; (2) index based on mean phase coherence; and (3) index of phase synchrony based on entropy. Results consistent over all three measures were as follows: comparing the tasks to rest, the artists showed significantly stronger short‐ and long‐range delta band synchronization, whereas the non‐artists showed enhancement in short‐range beta and gamma band synchronization primarily in frontal regions; comparing the two groups during the tasks, the artists showed significantly stronger delta band synchronization and alpha band desynchronization than did the non‐artists. Strong right hemispheric dominance in terms of synchronization was found in the artists. In artists, the higher synchrony in the low‐frequency band is possibly due to the involvement of a more advanced long‐term visual art memory and to extensive top‐down processing. The results demonstrate that in artists, patterns of functional cooperation between cortical regions during mental creation of drawings were significantly different from those in non‐artists. Hum. Brain Mapping, 2005. © 2005 Wiley‐Liss, Inc.
Keywords: cortical integration, synchronization, imagery, visual art, EEG, creativity, expertise
INTRODUCTION
According to art historians, “there really is no such thing as art—there are only artists” [Gombrich, 1994]. Generally speaking, art is any conscious human expression using sounds, forms, colors, movements, patterns or other similar elements that elicit strong contemplation and the delight or pleasure of feelings; the arts stimulate and affect our thinking. Ancient philosophers considered thought to be impossible without image, or in other terms, thinking calls for images, and images contain thought [Damasio, 1994; Miller, 1996]. There has been intense debate, however, on whether visual images play a fundamental role in thinking. If so, then the capacity for thinking with images is a distinct hardwired component of the functional architecture of human brain [Kosslyn, 1980], otherwise visual imagery could be classified as mere “epiphenomena” [Pylyshyn, 1986]. There is no argument, however, on the existence of visual images in our mind, and what could be a better “home‐ground of visual thinking” than the practice of visual art [Arnheim, 1969]?
The evidences of prehistoric cave paintings suggest some possible survival values of visual art [Valladas et al., 2001]. Biologists have mostly considered production and appreciation of visual art to be a cultural phenomenon. Professional artists and philosophers, however, have rarely paid attention to the possibility of a biological basis for making of art. Consequently, investigation into the possible neural foundations of production of visual art has not yet been carried out.
Issues of artistic creativity involve too many hidden degrees of freedom (personality, inherent artistic ability, mood, and innate aesthetic choice, among others) and it is not feasible to equalize all the hidden degrees of freedom. Such topics may seem unsolvable at the first sight. When considering the recent achievement in cognitive science, however, it may be worthwhile to address this problem. We approached this problem by recording electroencephalographic (EEG) signals, noninvasively obtained from human subjects belonging to two broad groups, artists and non‐artists, while they were instructed to mentally create drawings of their own choices. EEGs at resting condition were also recorded.
Our analysis was motivated primarily by the assumption that mentally composing a piece of artwork, like any other complex cognitive act, requires not only coactivation of distributed cortical regions but also functional cooperation or synchronization (or synchrony or interdependency, used here interchangeably) between them [Bressler, 1995; Friston, 2001]. Although modern imaging studies using functional magnetic resonance imaging (fMRI) or positron emission tomography (PET) are extremely popular and useful in the localization of brain functions [Cabeza and Nyberg, 2000; Posner et al., 1988], they are not ideal to detect the functional cooperation between distant cortical regions [Bressler, 2002]. EEG or magnetoencephalography (MEG) signals have the potential to study higher brain functioning, especially when the assessment of synchronization is of primary concern [Petsche and Etlinger, 1998]. However, there is no universally accepted definition of synchrony when dealing with signals like EEG. In general, an EEG signal involves a state‐dependent mixture of local, primarily functional segregation and global, primarily functional integration processes, and is a direct manifestation of cortical neuronal assemblies showing a high degree of in‐phase synchronized firing. Strictly speaking, no recordable EEG signal can be obtained noninvasively over the scalp unless the underlying neuronal populations are already partially synchronized, but this is mostly a local and trivial synchronization. Instead, we are interested in the synchrony occurring over a longer distance, i.e., between the signals of two electrodes. The emergence of such macroscopic network formed by reciprocally connected cortical regions provides the substrate of functional cooperation, which in turn is needed for higher cognitive functioning of the human brain. Moreover, such a network involves multiple spatiotemporal scales encompassing a wide range of frequencies from very low delta (<4 Hz) to high‐frequency gamma band (>30 Hz); however, detection of such cooperation between neuronal assemblies and estimation of its extent and strength remain nontrivial and important tasks.
Mathematically, synchronization corresponds to a state in which two or more oscillators display the same frequency due to some kind of interaction [Pikovsky et al., 2001]. However, it has been determined that two neuronal assemblies can be synchronized even if they are detuned in terms of firing frequency [Singer, 1999]. Identical oscillations are, thus, not a prerequisite for synchronization. Here, the term synchrony will be used in a loose sense, more or less synonymous with functional interdependence.
Cross‐correlation and coherence are the two popular measures to detect hidden interaction between two EEG signals, recorded from two different regions of scalp [Petsche and Etlinger, 1998], but they are only suitable if the nature of functional interaction between cortical areas is linear. The implicit assumption of linear coupling between cortical regions is not appropriate, however, when keeping in mind the basic nonlinear behavior of a neuron and its assemblies [Bhattacharya and Petsche, 2001; Fell et al., 1996; Slutzky et al., 2002]. Under the assumption of the brain as a complex nonlinear dynamical system, we applied three newly developed indices for the measurement of synchrony between EEG signals obtained from multiple cortical regions.
The aims of the present study were as follows: (1) to investigate any differences between artists and non‐artists in the strengths of dynamical interaction between cortical regions during mental creation of artwork; (2) the role of synchrony in different frequency bands in this task of creative imagery; and (3) the possible hemispheric dominance in the two groups. Because artists are by definition experts in the process of mental composition of artwork, the task may seem to be too familiar to them compared to the familiarity of the task to non‐artists. Contrary to this common claim that expert performance is highly automatized, however, most types of expert performance are mediated by multiple neuronal information processing mechanisms involving planning, structuring, reasoning, and anticipation. This is supported by the classic theory on expertise by Simon and Chase [1973] proposing that expert attainment of any form of skillful activity is acquired through many years of experience in their domain, usages of larger knowledge base in relevant field, and the higher ability to perform pattern‐based retrieval.
In an investigation of task‐evoked EEG coherence during the solution of different types of chess tasks, a recent study [Volke et al., 1999] showed significant differences between the coherent patterns, which depend primarily on the complexity of the task. Simple and well‐mastered tasks are accompanied usually with increased coherence between cortical regions, whereas poorly mastered tasks are accompanied with decreased coherence or desynchronization. We hypothesize that experts and novices would show different patterns of cortical coherence when solving the same task. Furthermore, it has been shown [Volke et al., 2002] that chess experts showed stronger delta band coherence than novice players did during anticipatory chess movements. Similarly, we also expect that stronger synchrony in the low‐frequency bands, including delta, might play an important role in indicating difference between expert artists and non‐artists during the mental composition of artwork. However, because the two tasks are slightly different (solving/anticipating chess pattern being a stimulus driven task whereas composing a drawing is an internal task) we did not expect similar topographic differences like the earlier chess study [Volke et al., 2002].
Finally, it should be stressed that our motivation was not to address questions as to the very nature of creativity but rather to examine whether today's available mathematical methods could be used to objectify the degree of synchronization to assess the effects on EEG of higher cognitive achievements in everyday situations.
SUBJECTS AND METHODS
Subjects
Nineteen normal female subjects were studied according to the guidelines of the Ethical Committee of the University of Vienna. All subjects gave consent before the experiment. Subjects were divided into two broad groups: artists (9 subjects; mean age, 44.3 years) and non‐artists (10 subjects; mean age, 37.5 years). Every member of the artist group possessed a Master of Art degree from Academy of Fine Arts, Vienna, with extensive professional training in visual arts. Subjects belonging to the non‐artists or control group did not have any training in art nor showed any particular interest in visual art. This study was restricted to females only for elimination of effects due to possible gender differences.
Task
The present study was a part of a series on higher cognitive tasks, which is detailed elsewhere [Bhattacharya and Petsche, 2002; Petsche et al., 1997]. We only considered the task of spontaneous mental creation of drawings. Because subjects were asked to compose a drawing, not to recollect an old one from their memory, this can be considered as a task of creative imagery. Subjects were asked to mentally compose a drawing of their own choices while looking at a white wall and then to sketch it on paper after the EEG examinations. No time limit was given to complete the mental drawing. In resting or background condition, subjects were looking at a white wall without the presence of any other external stimulus. Because our task was also mental composition of drawings of their free choices, mental freedom was allowed on both conditions so that overall neuronal dynamics during mental drawing were emphasized maximally when comparing the task to resting condition.
Data Acquisition and Preprocessing
EEG signals were recorded, with respect to the averaged signals from both earlobes, by 19 gold‐cup electrodes (Fp1, Fp2, F7, F3, Fz, F4, F6, T3, C3, Cz, C4, T4, T5, P3, Pz, P4, P6, O1, and O2) equally distributed over scalp (Fig. 1) according to the standard 10‐20 electrode placement system [Jasper, 1958]. The signals were high‐pass filtered with a lower cut‐off frequency of 0.5 Hz, and sampled at 128 Hz. The analog‐to‐digital resolution was 12 bit. A second‐order polynomial was fitted and subtracted from the signals for removal of any baseline drift. The polynomial subtracted signals were digitally band‐pass filtered (sixth‐order Butterworth, zero phase‐shift filter, slope 24 dB/octave) to extract signals belonging to the five standard frequency bands: delta (<4 Hz); theta (4–7 Hz); alpha (7–13 Hz); beta (13–30 Hz); and gamma (30–50 Hz). It is assumed that individual oscillation represents a brain state or mode, which may be operationally distinct and separable, although the brain might be active in the other modes. Coupling (if any) between different frequency bands is not addressed for the sake of simplicity.
Figure 1.
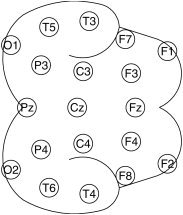
Positions of the 19 electrodes and their designations according to the International standard 10‐20 electrode placement system [Jasper, 1958]. Nose is pointed toward right.
Per subject, the average durations of artifact‐free EEG signals for the task were 305.6 s and 224 s for the artists and non‐artists, respectively. For resting condition, the average durations were 442.2 s and 477 s, respectively.
Measures of Synchrony
Three recently introduced indices were used in this study to assess hidden interdependency between EEG signals; these indices are found to be appropriate when dealing with noisy and nonlinear signals coupled in a complex way. For the sake of notion, let us suppose that we have two simultaneously measured EEG signals {x(k)} and {y(k)} from two electrodes.
Index Based on Generalized Synchronization
For both signals, multidimensional state spaces (X and Y, respectively) are reconstructed using a time‐delay embedding technique [Sauer et al., 1991] so that any state vector is obtained by consecutive scalar values of the signal, i.e., x(k) = (x[k] x[k − τ] x[k − 2τ] … x[k − (m − 1)τ]), where m and τ are embedding dimension and time delay, respectively. If the two systems X and Y are weakly coupled, their interdependence can give rise to a functional relationship between the state space vectors of both systems, a phenomenon commonly known as generalized synchronization [Rulkov et al., 1995]. When the two systems are generally synchronized, two close state vectors of X correspond to two state vectors in Y, which will also lie close, bearing the same time indices.
For any reference vector pair x(k) and y(k), 2R numbers of nearest or true neighbors from their individual state spaces are considered; r k(i) and s k(i) (i = 1, 2,…, 2R) denote the time indices of these nearest neighbors of x(k) and y(k), respectively. The neighbors are sorted in ascending order according to the Euclidean distance from the concerned reference vector. The set of mutual neighbors of x(k) are those state vectors bearing the same time indices of the R nearest neighbors of y(k). To measure the influence of Y on X, the following index is computed as
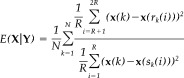 |
(1) |
where N (= L − [m − 1]τ, where L is the number of time samples) is the total number of state vectors.
If the two systems are strongly coupled, there will be strong overlap between the two sets of neighbors, original and mutual, although for uncoupled systems mutual neighbors will be more spread. The strength of coupling is thus manifested by the similarities between the clusters formed by the set of true and mutual neighbors and is assessed by equation (1).
In a similar way, the influence of X on Y is measured in an analogous way:
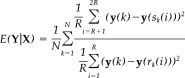 |
(2) |
By construction, E(X|Y) and E(Y|X) are different quantities and both are close to zero if the two systems are fully independent, whereas high positive values of E both ways correspond to strong interdependence. The degree of asymmetry depends on the difference between E(X|Y) and E(Y|X). Through simulation, it has been found that E is robust against noise, easy to interpret, sensitive to weak asymmetry, and applicable to limited data points [Bhattacharya et al., 2003].
The embedding dimension and the number of neighbors are both fixed to 10 as set by earlier studies [Arnhold et al., 1999; Bhattacharya et al., 2001a, 2003]; the time delay is 12, 10, 8, 4, 2 (in time samples) for delta, theta, alpha, beta, and gamma bands, respectively. Each time delay roughly corresponds to the local minimum of mutual information of EEG signals in the respective frequency bands [Abarbanel et al., 1993].
Index Based on Phase Synchrony
The synchrony measure (equations 1 and 2) assesses the generalized functional relationship between two signals, assuming the two systems generating the signals are related by a smooth map. Another kind of relationship between coupled oscillators, called phase synchrony, has been reported recently [Rosenblum et al., 1996], demonstrating that the phase of two weakly coupled nonlinear (noisy or chaotic) oscillators can be synchronized, whereas their amplitudes can remain uncorrelated. This type of phase synchrony is assumed to provide a platform for dynamical integration of actions of distant neuronal assemblies, an essential requirement for emergent cognitive performance [Varela et al., 2001]. In this study, we have adopted two measures of phase synchrony.
Estimation of Phase
Before computation of any measure of phase synchrony, one first needs to estimate phases from the experimental signals, a problem that is nontrivial for complex and irregular signals. There are three basic approaches to this problem: (1) phase estimation based on Hilbert transform [Rosenblum et al., 1996]; (2) phase estimation based on wavelet transform [Lachaux et al., 2000]; and (3) phase estimation based on the timing of “events” (i.e., Poincaré surface) [Bahar et al., 2002]. We adopted the method based on Hilbert transform because it is well defined mathematically for any arbitrary signal and is free of the requirement of stationarity.
For any arbitrary signal {x(k)}, the analytic signal, a complex valued function, is formed as
| (3) |
where {x H(k)} is Hilbert transform of {x(k)}and p.v. stands for Cauchy‐Principal value [Bendat and Piersol, 2000]. The analytic signal can be decomposed further as
| (4) |
where a(k) and ϕ(k) are instantaneous amplitude and instantaneous phase, respectively. Because Hilbert transform, is essentially a convolution of {x(k)} with 1/πk, it therefore emphasizes the local properties of the signal, which makes the method suitable for nonstationary signals. It should be noted that a(k) and ϕ(k) have a clear physical meaning only if the signal {x(k)} is narrow band, a condition that is fulfilled by decomposing the broadband EEG signals into standard EEG frequency bands.
Mean Phase Coherence
The instantaneous phase as computed above is unfolded and defined on the unit circle (i.e., the interval [0,2π]). The relative phase (Φ[k] = ϕx[k] − ϕy[k]) between two signals is calculated, and the circular variance (Ω) of the angular distribution is obtained by transforming the relative phase angles onto the unit circle in the complex plane. Mean phase coherence [Mormann et al., 2000] is defined as
| (5) |
which can be expanded further by Euler's expansion as follows:
| (6) |
If the two signals are phase synchronized, the relative phase will occupy only a small portion of the unit circle leading to a small value of circular variance. Contrarily, if there are no phase relationships, the relative phase will spread over the entire unit circle leading to a large value of circular variance. The values of R are thus restricted between 0 (corresponds to nonsynchronous state) to 1 (perfect phase synchrony).
Phase Synchrony Index Based on Entropy
The instantaneous phases, ϕ(k), of individual signals are computed by equation (4) and defined on a real axis, not restricted to the interval of [0,2π]. The relative phase, Φ(k), is obtained, as earlier, and the distribution function for Φ(k) mod 2π is estimated by suitable partitioning. Modulo operation is necessary to eliminate the effect of noise‐induced phase slips [Tass et al., 1998]. To measure the strength of phase synchrony, deviation of this distribution from the δ‐distribution (corresponding to complete synchronous state or perfect synchrony) is quantified by the following index [Tass et al., 1998]:
| (7) |
where entropy of the distribution of Φ(k) mod 2π,
 ln p
v, where M is the number of bins used for partitioning and p
i is the probability of finding relative phase Φ(k) mod 2π within ith bin. The maximum entropy, H
max, is ln(M), and the optimum number of bins (M) is set as exp(0.626 + 0.4ln[L − 1]) [Otnes and Enochson, 1972].
ln p
v, where M is the number of bins used for partitioning and p
i is the probability of finding relative phase Φ(k) mod 2π within ith bin. The maximum entropy, H
max, is ln(M), and the optimum number of bins (M) is set as exp(0.626 + 0.4ln[L − 1]) [Otnes and Enochson, 1972].
Both R and ρ increase monotonically with the strength of phase synchrony. In each frequency band, a nonoverlapping window of 6‐s duration was used, and for each window, indices were measured for all possible combinations between 19 electrodes.
Statistical Analyses
To compare the degree of synchrony values between the two groups performing the cognitive task or between task and rest within each group, a rank‐sum Wilcoxon test was used. The resulting rank‐sum was converted into error probabilities, and significant changes (different probability levels with cut‐off at P < 0.05) were mapped topographically by connecting lines between the corresponding electrodes. To control for repeated observation of the same measures, a correction [Keppel, 1991] was made with the modified probability:
| (8) |
where r is the number of times any index was measured repeatedly. This is a more conservative estimate than that with Bonferroni's correction; thus, any statistically significant outcome should be taken seriously.
Based on the spatial locations of electrodes, two kinds of synchrony were defined: (1) long‐range synchrony between two electrodes, which are either separated by one electrode or located in opposite hemisphere; and (2) short‐range synchrony between neighboring electrodes located in the same hemisphere. Synchrony values were always compared between identical electrode pairs.
RESULTS
Between Groups: Performing Task of Creative Imagery
Figure 2 shows the absolute values of the three indices while the subjects were drawing mentally. Results are pooled over subjects within group, all possible electrode combinations, and windows. The following observations can be made: (1) in both groups, synchrony value trends are consistent over different frequency bands, i.e., gradual decrease with increasing frequency that could be a characteristic of a fractal EEG spectrum (1/f); (2) differences in absolute synchrony values between artists and non‐artists are consistent (except in theta frequency band) as measured by three different indices; (3) delta band synchrony was enhanced mostly in artists (F 1,19 = 38.75; P < 0.001); (4) alpha band synchrony was enhanced in non‐artists (F 1,19 = 16.2; P < 0.01); and (5) synchrony in high‐frequency bands (beta and gamma) tend to be higher, but not statistically significant, in non‐artists than in artists.
Figure 2.
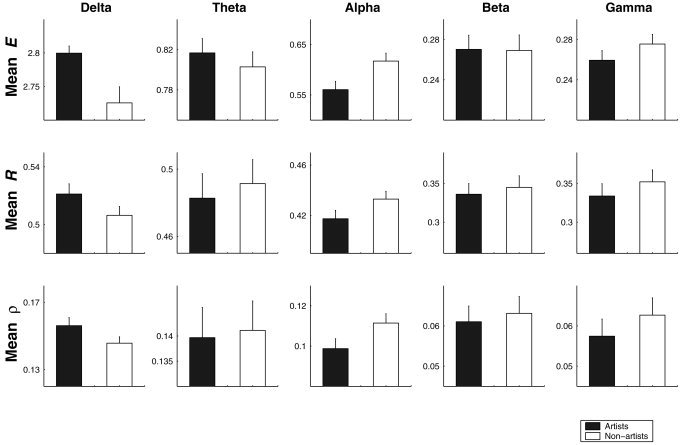
Measures of synchrony, in terms of E, R, and ρ, during the performance of creative imagery task for two groups: artists (black bars) and non‐artists (white bars). Results were pooled over subjects within each group, all possible electrode combinations, and nonoverlapping windows. Note the differences of the scale of synchrony measures of different frequency bands. Except theta, other frequency bands show a similar trend.
These results, however, are only indicative of a change in global synchronization. To obtain a statistically significant outcome for each electrode pair combination, synchrony values were compared between the two groups during mental drawing of pictures, and the number of those electrode pairs (long‐ and short‐range) showing significant (P mod < 0.0002) changes are plotted in Figure 3. The features that were similar across three measures were as follows: (1) many electrode pairs, both neighboring and distant, showed significantly stronger delta band synchrony for artists; (2) an almost exclusive decrease of alpha band synchrony was found in artists as compared to that in non‐artists; and (3) a similar number of electrode pairs showed changes in the beta band, but more electrode pairs showed higher gamma band synchrony in non‐artists compared to that in artists. A discrepancy between the three measures was only found in the theta band. If, however, differences between long‐ and short‐range synchrony are considered, the most conspicuous are found between the alpha and gamma bands, whereby in particular the latter presents more long‐ than short‐range synchronization in non‐artists.
Figure 3.
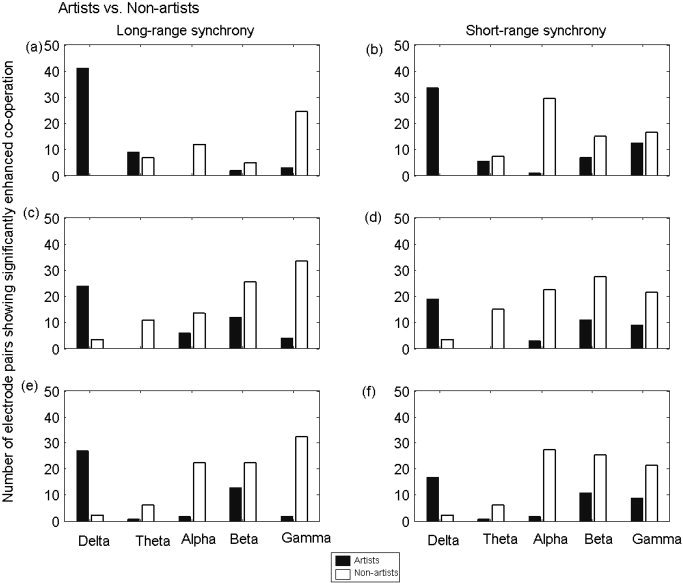
Statistical comparison in terms of long‐range (left column) and short‐range (right column) synchrony in different frequency bands, as expressed by the number of electrode pairs showing significant (P mod < 0.0002) changes between two groups: artists (black bars) and non‐artists (white bars). Results were shown for three different indices: E (upper panel), R (middle panel), and ρ (lower panel). Differences between two groups are found to be most prominent in delta (higher in artists) and alpha bands (higher in non‐artists).
To obtain topographic information, probability maps were obtained by statistically comparing the values of E between the two groups as shown in Figure 4. For better visual clarity, cutoff probability was set to P mod < 0.000001, which was much lower than the required corrected probability. The most conspicuous and significant increases were found in the delta band in the artists, as expected. Other noteworthy points were as follows. First, posterior occipitotemporal regions were more involved in the delta band in artists, showing short‐ and long‐range intra‐ and interhemispheric connections. Second, in the high‐frequency beta and gamma bands, only right temporal regions showed higher synchrony in the artists, whereas non‐artists showed significant increases in the frontal regions. Third, the degree of alpha band synchrony was exclusively higher in non‐artists than in artists; electrodes in the frontal cortex, bilaterally, were involved. Topographically, very similar results were found using the other two indices. No large significant differences were found between the two groups at the resting condition.
Figure 4.
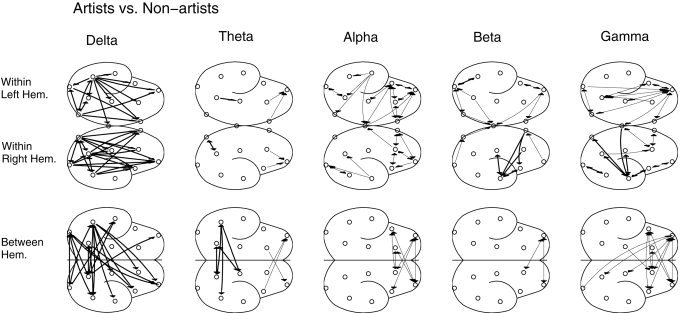
Significant probability (P mod < 0.000001) mapping or the topographic representations showing the comparison in the degree of synchrony (as measured by E) in different frequency bands between the groups of artists and non‐artists during mental composition of drawings. Significant increases for artists are indicated by thick lines between both electrode regions involved. Similarly, thin lines are due to significant increases in non‐artists. Two hemispheres are shown separately for showing intrahemispheric connections and the lowest scheme displays only interhemispheric connections. Note the significantly higher delta band synchrony for artists, whereas alpha band synchrony was stronger for non‐artists.
Task Versus Rest: Within‐Group Study
The indices were compared next between the task and resting (or baseline) condition within each group; significant (P mod < 0. 0002) increases are shown as probability maps in Figure 5 and 6 for the artists and non‐artists, respectively. Because an unmatched statistical comparison was used, for any electrode pair to be significant during task condition in a group, the associated synchrony values across subjects had to be significantly different from the synchrony values at rest for all subjects within the same group. Artists showed significantly higher delta band synchrony during mental composition of drawings compared to that in their resting conditions, and the effect was pronounced mostly in frontobasal regions bilaterally. Long‐range synchrony between frontal and posterior cortical regions was also found. Non‐artists showed higher frontal synchrony only in the beta and gamma band.
Figure 5.
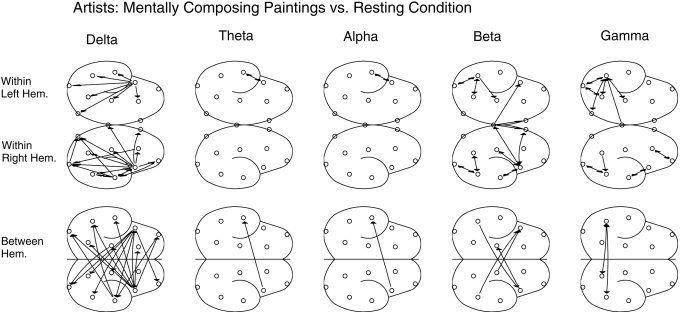
Significant probability mapping showing significant increases in the degree of synchronization in different frequency bands during mental composition of drawings as compared to the EEG at rest for the group of artists. An unmatched rank‐sum Wilcoxon test (P mod < 0. 0002) was used as statistical filter. Only increases (as compared to the resting condition) were reported. Most prominent is the extensive enhancement of delta band synchrony.
Figure 6.
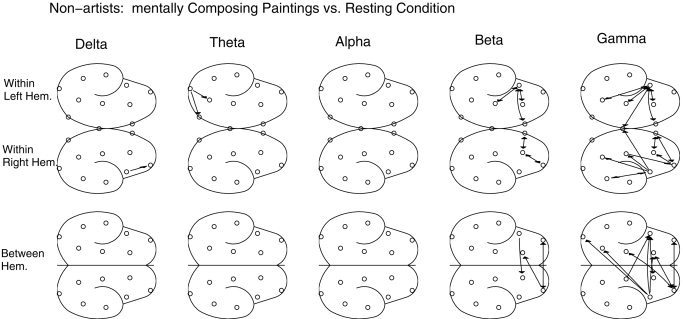
Same as in Figure 5 but for the group of non‐artists. Note enhancement of gamma band synchrony in frontal cortical regions.
Cerebral Dominance
The problem of hemispheric asymmetry or cerebral dominance during this task of creative imagery was also studied in both groups (Table I). In artists, the right hemisphere was found to present higher synchrony than the left did in various frequency bands, whereas strength of the right hemispheric dominance was found to be much less in non‐artists. Left hemispheric asymmetry (in the global hemispheric sense) was not reported in any case.
Table I.
Statistical comparison between strengths of synchronization, measured by E, of right and left hemisphere while mentally drawing
| Frequency band | Artists | Non‐artists |
|---|---|---|
| Delta | NS (R**) | NS (R***) |
| Theta | R** (R***) | NS (R*) |
| Alpha | R** (R***) | NS (R*) |
| Beta | R*** (R***) | NS (R**) |
| Gamma | R*** (R***) | NS (NS) |
Cerebral asymmetry is indicated by L (left hemispheric dominance) or R (right) followed by the probability measure. Statistical comparison was carried out using a nonparametric sign‐rank Wilcoxon test. Probabilities based on ρ are shown in brackets; results based on R are equivalent. Left hemispheric dominance was not found in any bands. For both groups, the right hemisphere presented higher synchrony than the left did, although the effect was more explicit for artists. Note the apparently higher threshold of cut‐off for the significance level. NS, not significant (P > 0.001).
1 × 10⁻⁶ < P < 1 × 10⁻³;
1 × 10⁻⁹ < P < 1 × 10⁻⁶;
P < 1 × 10⁻⁹.
DISCUSSION
Drawing From the Mind
Mental imagery, the generation and manipulation of mental representation in the absence of direct sensory input, has become increasingly popular in the field of cognitive neuroscience primarily fueled by the development of new behavioral and neuroscientific techniques [Cabeza and Nyberg, 2000; Farah, 1995; Kosslyn et al., 2001]. Unlike perception, where one utilizes the information registered directly through the senses, imagery exclusively relies on the information stored in memory; thus, it is an ideal example of top‐down processing. Most studies on mental imagery, however, are concerned with tasks of “laboratory‐imagination,” whereby subjects were asked to mentally visualize objects or string of letters, etc., shown before. With proper controlled experimental paradigms, one could thus study the neural correlates of underlying imagery processes of specific visual (or other sensory) parameters, such as size, shape, color, pattern, and location. However, in real‐life situations, imaginations are primarily spontaneous and creative in nature; mentally composing a piece of art is a suitable example of such creative imagery. Although this mental process is an intricate mixture of many hidden degrees of freedom, like other imagery process, it also can be divided broadly [Kosslyn, 1980] into three subprocesses: (1) use of long‐term visual memories from which many art patterns are recalled; (2) use of visual buffer or short‐term memory for maintaining these patterns; and (3) a possible image generation process whereby the visual buffer gets reactivated in accordance with the memory. In short, we tend to draw what we know [Gombrich, 2000] but to circumvent the constraints imposed by prior knowledge and brain structure, artists are trained to externalize their creative processes by the use of sketches, exercises, etc. [Fish and Scrivener, 1990; Frith and Dolan, 1997], which in turn enhances their capacity of abstract memory.
Artistic Creativity and Neural Systems
This earlier model of creative imagery fits well with the proposition of Damasio [2001], which states that the following subprocesses that are related with neural systems and functions would be necessary for artistic creativity.
Generation of representational diversity
One should have the ability to generate a diverse range of novel combinations of entities and parts of entities as images; such images can either be invoked by external stimuli or be prompted by internal representations. Of the vast number representational patterns, only a relevant few are retained whereas all others are discarded. The prefrontal cortex is assumed to play the primary role in the process of generating such representational diversity.
Manipulation of representational diversity
Working memory allows us not only to retrieve and create internal representations but also to actively hold, rearrange, and restructure such representations. A landmark signature of creativity is the ability to manipulate entities and parts of entities to create a novel combination from active representations held in working memory.
Recognition of novel representation
This is related with the ability to judge the aesthetic (or artistic) value of certain entities or combination of entities and to decide the novelty of the newly formed representation for future storage. Although the issue of aesthetic perception may be primarily subjective, a creative artist possesses the fine tuning ability to recognize when a particular novel configuration can evoke emotional response in himself as well as in others. This whole process is related intricately with the ability for effective decision making.
Functional Cooperation or Synchrony
Like any other complex cognitive task, each of the above‐mentioned subprocesses requires activation of multiple cortical regions [Frith and Law, 1995]; the use of adopted indices to detect the synchrony or functional cooperation are thus justified. Because the task was fairly indefinite, special emphasis should be placed on the findings that are convergent across indices.
The most conspicuous and convergent findings are: (1) a significant increase of delta band synchrony; and (2) a significant decrease in alpha band synchrony in the artists while composing drawings as compared to that during their resting condition or to that in non‐artists performing the same task.
Low‐frequency oscillations in the theta band are prominent in the hippocampus but are also recorded in other cortical and limbic structures [Kahana et al., 2001] and play a crucial role in functional coupling of widely separated structures responsible for different components of the memory system [Klimesch et al., 2001; Sarnthein et al., 1998; Tesche and Karhu, 2000]. As to low‐frequency oscillations in the delta band, research findings hint at functional correlates that are approximately similar to those for the theta band when the brain is involved in cognitive processing [Basar et al., 2000, 2001]. Increase of spectral power in EEG frequencies from 1.56 to 5.46 Hz was reported during the performance of mental arithmetic that requires attention to internal processing [Harmony et al., 1993]. Delta power was also found to be increased during other mental tasks demanding higher internal concentration [Dolce and Waldeier, 1974; Dostalek et al., 1979; Giannitrapani, 1971; Sviderskaia, 1977]. Recently, it was shown that delta power was increased globally when subjects mentally recalled emotional scenes from their personal experiences [Dan'ko et al., 2003]. When emotions were induced based on a presented situation or scenic material, delta power was also increased like the internal induction of emotion; however, the effect was stronger in actors than in non‐actors [Dan'ko et al., 2003].
Most published findings on the delta band were based on Fourier spectral power, a measure of local synchronization. Local synchrony occurs when neuronal assemblies recorded by a single EEG electrode transiently oscillate at the similar frequency range with a common phase, and their local electrical fields may sum algebraically to yield a burst of oscillatory spectral power in the EEG signal reaching the electrode [Lutz et al., 2002; Srinivasan et al., 1999]. Across local synchrony, the three measures of synchronization as employed in this study detect long‐range synchrony between distant brain regions that occurs when two neuronal populations recorded by two distant electrodes oscillate with a suitable phase relationships or with some form of coupling. The present study is one of the first to show the correlation between delta band long‐range synchrony and a mental task demanding internal processing.
Expert Performance
Experts in most domains show superior memory performances on recall tasks, indicating that accurate memory for important stimuli is a direct signature of expert processing [Ericsson and Lehmann, 1996]. The foundation of this theory was provided by investigating the superior memory of chess experts during anticipation of diverse chess patterns [Simon and Chase, 1973], whereby they could rapidly encode a particular type of material in long‐term memory by associating with stored knowledge and representations. This fast process of encoding and retrieval in chess experts, as compared to that in novice players, was reflected primarily in increased delta band coherence [Volke et al., 2002].
Accordingly, during this task of creative imagery, artists by training are able to recall a vast number of art patterns from their long‐term memory. The primary role of low‐frequency synchronization is to mediate access to these stored representations in long‐term memory distributed widely over cortex. In addition, delta band synchrony might be correlated with more elementary processes such as higher selective attention to internal processes, which is also crucial for efficient memory encoding and top‐down processing [Harmony et al., 1996]. Interestingly, similar higher delta band synchrony and alpha band desynchrony were also found in the artists as compared to that in non‐artists during the performances of visual perception (and imagery) of paintings [Bhattacharya and Petsche, 2002]. The decreased level of cooperation or desynchronization in the alpha band during the performance of higher mental tasks is well known [Klimesch et al., 1997; Molle et al., 2002]. This desynchronization in the artists is due most likely to their additional involvement of subcortical structures [Petsche et al., 1997] and enhanced involvement of multiple brain regions during creative imagery.
Topographic Information
When the two groups were compared, the degree of long‐range synchronization was found to be much higher in artists than in non‐artists. For the delta band, strong interconnections between temporooccipital and frontal cortical region were found with a slight accentuation toward left temporal electrode T5. There is evidence from brain lesion [Farah et al., 1988; Grossi et al., 1986] and imaging [Goldenberg et al., 1991] studies showing that the left temporooccipital area is critical for the visual image generation process. In alpha and upper bands, the decrease in connectivity in artists was found primarily in the prefrontal regions with strong accentuation at Fp1, which was similar when the two groups were compared during perception and imagery of paintings [Bhattacharya and Petsche, 2002]. The concurrent increase of low‐frequency oscillations and decrease of alpha waves in frontal cortex was claimed to correlate with successful transfer of information between working memory and long‐term memory systems [Sauseng et al., 2002]. Further, interfrontal alpha coherence could also decrease with the weakening of internal attentive mechanisms [Cantero et al., 1999, 2000]. Additionally, this interfrontal alpha desynchronization in the artists is likely to be affected by the frontal eye field (crucial for gaze control) because non‐artists made more inconsistent and irregular scans of the visual fields than artists did while looking at paintings [Nordine et al., 1993] or drawing portraits [Miall and Tchalenko, 2001].
When comparing creative imagery with the baseline condition within groups, two clear‐cut findings are: (1) artists showed extensively stronger delta band synchrony with many long‐range connections between frontal electrodes (F3, F6) and posterior electrodes; and (2) non‐artists showed an increase only in the gamma band and primarily between frontal electrodes. An early imaging study [Roland and Friberg, 1985] showed enhanced activations of superior prefrontal cortex during several kinds of creative thinking; in addition, there are prefrontal activations in many later imaging studies [Cabeza and Nyberg, 2000, and references therein]. Prefrontal EEG complexity was also found to be increased during imagery [Schupp et al., 1994] and divergent thinking tasks [Carlsson et al., 2000]. Combining the evidence, the present results support the common notion of the importance of prefrontal cortex in creative tasks. Furthermore, increases in long‐range coherence were reported during acquisition of bimanual motor skills [Andres et al., 1999], during associative learning [Miltner et al., 1999], or even in gifted individuals as compared to that in controls [Jausovec, 1996]. The enhanced synchronization between frontal and posterior regions for artists versus non‐artists is thus expected.
Hemispheric Asymmetry
Possible cerebral dominance in the two groups during this task should be mentioned briefly. During mental drawing, the right hemisphere consistently presented, across frequencies except the delta band, higher degrees of cooperation than was presented by the left hemisphere in artists. The degree of right hemispheric dominance is much weaker for non‐artists. Similar asymmetry was also reported during perception and imagery of visual art [Bhattacharya and Petsche, 2002]. Although this fits well with the popular role of the right hemisphere in creative drawing [Edwards, 1999], we want to emphasize that concerted actions of both hemispheres are crucially important for any complex and creative task, including the present one.
Critical Remarks
There are a few points that need some considerations.
The major result of the present study was obtained by computing the indices of synchrony of band‐pass filtered EEG signals. This is primarily based on the assumption that different frequency bands in the EEG are correlated with different kinds of cognitive information processing [Basar et al., 2001; von Stein and Sarnthein, 2000; Ward, 2003]. It is impossible to provide the accurate boundaries, if any, between the relevant frequencies; furthermore, there might also be preferential changes with subjects depending on cognitive strategies. Here, five broad‐frequency bands that are standard in the EEG literature were chosen [Basar, 2004; Petsche and Etlinger, 1998].
Results based on coherence or any synchronization measure, when applied on scalp EEG, are often faced with criticism due to volume conduction effect. This effect may not be severe for the electrode montage used in this study, however, because the estimated spatial resolution of EEG is approximately 5 cm [Nunez, 1995], whereas the average distance between two electrodes in our electrode montage within the same hemisphere was 13 cm. As a result, a volume conduction effect could be expected to bias the spatial distribution patterns of neural synchronization to adjacent or neighboring electrodes (e.g., Fp1–F3) but not between two electrodes (e.g., Fp1–O2) that are separated widely or are located in opposite hemispheres [Lachaux et al., 1999]. Furthermore, near and distant electrode pairs were treated in the same way by always comparing the values of identical electrode pairs.
As discussed in this work, the neuronal substrates of near‐zero lag synchrony between distant cortical regions (from same or from opposite hemisphere) are most possibly as follows: (a) the neuronal groups are connected reciprocally by mutually excitatory and inhibitory synapses; (b) neural assemblies in the two hemispheres communicate by corticortical connections via corpus callosum; and (c) a common contribution by subcortical (thalamocortical) structures [Roelfsema et al., 1997; Steriade and Llinas, 1988]. In addition, the mechanism of synchrony might also be frequency specific [Kopell et al., 2000]. Direct proof of the actual substrate is beyond our scope because scalp recordings do not allow the active neural sources, and the possible anatomic connections between them, to be localized. For interpretation, we used a generally adopted working scheme: if the synchrony index between two electrodes is high, the functional integration between the associated cortical regions, which may be mediated by either of the mechanisms listed above, will also be high. Although EEG was used as a “window” to assess cognitive functioning of the human brain, any local findings should not be interpreted as being due only to the underlying local morphologic and functional properties but as the involvement of multiple brain areas in the concerned act of thinking or imagination.
There can be some criticisms to our earlier interpretation that artists (or experts) differ from non‐artists (or non‐experts) by extended recruitment of cortical areas because fewer brain regions are likely to get activated in the brain of the experts or when a task is learned [Bransford et al., 1999; Haier et al., 1992; Raichle, 1998]. These findings of lesser activations, however, do not contradict our findings of enhanced synchronization for the following reasons. First, the concerned task of creative imagery cannot be categorized as an automatized task like those in earlier studies. Second, synchronization is not necessarily equivalent to coactivation; thus, it is indeed possible that activations of two cortical regions remain unchanged or even reduced when their functional cooperation, i.e., synchronization, is increased [Bhattacharya et al., 2001b].
In this study, we have purposefully avoided discussing the standard issues of imagery debate: propositional or symbolic representations, activation of primary visual cortex during visual imagery, etc. [Behrmann, 2000]. We found strong evidence, however, of similarities in terms of cortical connectivity patterns in different frequency bands between this task of creative imagery and the tasks of perception and imagery of visual art [Bhattacharya and Petsche, 2002]. This suggests a considerable although not complete correspondence between the underlying neural mechanisms associated with the creative imagery and with the perception of related stimuli.
The present study was comprised only of female subjects to avoid any gender‐related bias; however, there is reported evidences of gender‐related differences in EEG patterns during creative or divergent thinking [Razoumnikova, 2004]. It will be of interest in future research to conduct similar experiment on male subjects to validate the present findings on a general population level.
Finally, some comments on the adopted synchronization measures are in order. In recent years, primarily two types of nonlinear synchronization measures were proposed, the first based on nonlinear relationships between the state spaces (or generalized synchronization) and the second on relationships between the two phases (or phase synchronization). Consequently, three measures (E, R, and ρ) based on these various kinds of synchronization were applied to the concerned EEG data set. It is implicit that all these three measures point to the same hidden concept, i.e., neural synchronization. Despite differences in the definitions of these measures, in the assumptions based on which they are defined, and in their sensitivity to different characteristics of the time series, similar and convergent findings were obtained by all three [see Quian Quiroga et al., 2002 for a comparative study].
To summarize, we have presented neural correlates in terms of networks of large‐scale cortical cooperation produced by mental drawing in professional artists and non‐artists. Through the application of three measures based on nonlinear dynamical system theory, it has been shown that despite an indistinct task paradigm, meaningful topographic patterns were obtained. The presented results are encouraging and provide new insight into the cognitive mechanisms and the associated neural information processing of artistic creativity.
Acknowledgements
J. Bhattacharya thanks the Sloan‐Swartz Foundation for financial support during his stay at the California Institute of Technology, Pasadena, California. We thank S. Kaplan for technical assistance.
Results of this study were presented at the Annual Conference of Vision Science Society in Florida, 2002 [Bhattacharya et al., 2002].
REFERENCES
- Abarbanel HD, Brown R, Sidorowich JJ, Tsimring LS (1993): The analysis of observed chaotic data in physical systems. Rev Mod Physics 65: 1331–1392. [Google Scholar]
- Andres FG, Mima T, Schulman AE, Dichgans J, Hallett M, Gerloff C (1999): Functional coupling of human cortical sensorimotor areas during bimanual skill acquisition. Brain 122: 855–870. [DOI] [PubMed] [Google Scholar]
- Arnheim R (1969): Visual thinking. Berkeley and Los Angeles: University of California Press. [Google Scholar]
- Arnhold J, Grassberger P, Lehnertz K, Elger CE (1999): A robust method for detecting interdependencies: application to intracranially recorded EEG. Physica D 134: 419–430. [Google Scholar]
- Bahar S, Neiman A, Wilkens LA, Moss F (2002): Phase synchronization and stochastic resonance effects in the crayfish caudal photoreceptor. Phys Rev E Stat Nonlin Soft Matter Phys 65: 050901. [DOI] [PubMed] [Google Scholar]
- Basar E (2004): Memory and brain dynamics: oscillations, integrating attention, perception, learning, and memory. Boca Raton, FL: CRC Press. [Google Scholar]
- Basar E, Basar‐Eroglu C, Karakas S, Schurmann M (2000): Brain oscillations in perception and memory. Int J Psychophysiol 35: 95–124. [DOI] [PubMed] [Google Scholar]
- Basar E, Basar‐Eroglu C, Karakas S, Schurmann M (2001): Gamma, alpha, delta, and theta oscillations govern cognitive processes. Int J Psychophysiol 39: 241–248. [DOI] [PubMed] [Google Scholar]
- Behrmann M (2000): The mind's eye mapped onto the brain's matter. Psychol Sci 9: 50–54. [Google Scholar]
- Bendat JS, Piersol AG (2000): Random data: analysis and measurement procedure (2nd ed.). New York: John Wiley and Sons; 594 p. [Google Scholar]
- Bhattacharya J, Pereda E, Petsche H (2003): Efficient detection of coupling between bivariate experimental signals in the state space. IEEE Trans Syst Man Cybern B Cybern 33: 85–95. [DOI] [PubMed] [Google Scholar]
- Bhattacharya J, Petsche H (2001): Universality in the brain while listening to music. Proc R Soc Lond B Biol Sci 268: 2423–2433. [DOI] [PMC free article] [PubMed] [Google Scholar]
- Bhattacharya J, Petsche H (2002): Shadows of artistry: cortical synchrony during perception and imagery of visual art. Brain Res Cogn Brain Res 13: 179–186. [DOI] [PubMed] [Google Scholar]
- Bhattacharya J, Petsche H, Pereda E (2001a): Interdependencies in the spontaneous EEG while listening to music. Int J Psychophysiol 42: 287–301. [DOI] [PubMed] [Google Scholar]
- Bhattacharya J, Petsche H, Pereda E (2001b): Long‐range synchrony in the gamma band: role in music perception. J Neurosci 21: 6329–6337. [DOI] [PMC free article] [PubMed] [Google Scholar]
- Bhattacharya J, Petsche H, Shimojo S (2002): Painting by mind's eye [abstract]. J Vision 2: 360a. [Google Scholar]
- Bransford JD, Brown AL, Cocking RR, editors (1999): How people learn: brain, mind, and school. Washington, DC: National Academy Press. [Google Scholar]
- Bressler SL (1995): Large‐scale cortical networks and cognition. Brain Res Brain Res Rev 20: 288–304. [DOI] [PubMed] [Google Scholar]
- Bressler SL (2002): Understanding cognition through large‐scale cortical networks. Curr Direct Psychol Sci 11: 58–61. [Google Scholar]
- Cabeza R, Nyberg L (2000): Imaging cognition II: An empirical review of 275 PET and fMRI studies. J Cogn Neurosci 12: 1–47. [DOI] [PubMed] [Google Scholar]
- Cantero JL, Atienza M, Salas RM (2000): State‐modulation of cortico‐cortical connections underlying normal EEG alpha variants. Physiol Behav 71: 107–115. [DOI] [PubMed] [Google Scholar]
- Cantero JL, Atienza M, Salas RM, Gomez CM (1999): Alpha EEG coherence in different brain states: an electrophysiological index of the arousal level in human subjects. Neurosci Lett 271: 167–170. [DOI] [PubMed] [Google Scholar]
- Carlsson I, Wendt PE, Risberg J (2000): On the neurobiology of creativity. Differences in frontal activity between high and low creative subjects. Neuropsychologia 38: 873–885. [DOI] [PubMed] [Google Scholar]
- Damasio AR (1994): Descarte's error: emotion, reason and the human brain. New York: Putnam Press. [Google Scholar]
- Damasio AR (2001): Some notes on brain, imagination and creativity In: Pfenninger KH, Shubik VR, editors. The origins of creativity. Oxford: Oxford University Press; p 59–68. [Google Scholar]
- Dan'ko SG, Bekhtereva NP, Shemiakina NV, Antonova LV (2003): Electroencephalographic correlates of mental performance of emotional personal and scenic situations: I. characteristics of local synchronization. Hum Physiol 29: 263–272. [PubMed] [Google Scholar]
- Dolce G, Waldeier H (1974): Spectral and multivariate analysis of EEG changes during mental activity in man. Electroencephalogr Clin Neurophysiol 36: 577–584. [DOI] [PubMed] [Google Scholar]
- Dostalek C, Faber J, Krasa H, Roldan E, Vele F (1979): Yoga meditation effect on the EEG and EMG activity. Act Nerv Super (Praha) 21: 41. [PubMed] [Google Scholar]
- Edwards B (1999): The new drawing on the right side of the brain (3rd ed.). NY: J.P. Tarcher. [Google Scholar]
- Ericsson KA, Lehmann AC (1996): Expert and exceptional performance: evidence of maximal adaptation to task constraints. Annu Rev Psychol 47: 273–305. [DOI] [PubMed] [Google Scholar]
- Farah MJ (1995): The neural bases of mental imagery In: Gazzaniga MS, editor. The cognitive neuroscience. Boston: MIT Press; p 963–975. [Google Scholar]
- Farah MJ, Levine DN, Calvanio R (1988): A case‐study of mental‐imagery deficit. Brain Cogn 8: 147–164. [DOI] [PubMed] [Google Scholar]
- Fell J, Roschke J, Schaffner C (1996): Surrogate data analysis of sleep electroencephalograms reveals evidence for nonlinearity. Biol Cybern 75: 85–92. [DOI] [PubMed] [Google Scholar]
- Fish J, Scrivener S (1990): Amplifying the mind's eye: sketching and visual cognition. Leonardo 23: 117–126. [Google Scholar]
- Friston KJ (2001): Brain function, nonlinear coupling, and neuronal transients. Neuroscientist 7: 406–418. [DOI] [PubMed] [Google Scholar]
- Frith C, Dolan RJ (1997): Brain mechanisms associated with top‐down processes in perception. Philos Trans R Soc Lond B Biol Sci 352: 1221–1230. [DOI] [PMC free article] [PubMed] [Google Scholar]
- Frith C, Law J (1995): Cognitive and physiological processes underlying drawing skills. Leonardo 28: 203–205. [Google Scholar]
- Giannitrapani D (1971): Scanning mechanisms and the EEG. Electroencephalogr Clin Neurophysiol 30: 139–146. [DOI] [PubMed] [Google Scholar]
- Goldenberg G, Podreka I, Steiner M, Franzen P, Deecke L (1991): Contributions of occipital and temporal brain‐regions to visual and acoustic imagery—a spect study. Neuropsychologia 29: 695–702. [DOI] [PubMed] [Google Scholar]
- Gombrich EH (1994): The story of art. Englewood Cliffs, NJ: Prentice‐Hall. [Google Scholar]
- Gombrich EH (2000): Art and illusion: a study in the psychology of pictorial representation (6th ed.). Princeton, NJ: Princeton University Press; 512 p. [Google Scholar]
- Grossi D, Orsini A, Modafferi A, Liotti M (1986): Visuoimaginal constructional apraxia: on a case of selective deficit of imagery. Brain Cogn 5: 255–267. [DOI] [PubMed] [Google Scholar]
- Haier RJ, Siegel BV Jr, MacLachlan A, Soderling E, Lottenberg S, Buchsbaum MS (1992): Regional glucose metabolic changes after learning a complex visuospatial/motor task: a positron emission tomographic study. Brain Res 570: 134–143. [DOI] [PubMed] [Google Scholar]
- Harmony T, Fernandez T, Rodriguez M, Reyes A, Marosi E, Bernal J (1993): Test–retest reliability of EEG spectral parameters during cognitive tasks: I. Absolute and relative power. Int J Neurosci 68: 263–271. [DOI] [PubMed] [Google Scholar]
- Harmony T, Fernandez T, Silva J, Bernal J, Diaz‐Comas L, Reyes A, Marosi E, Rodriguez M, Rodriguez M (1996): EEG delta activity: an indicator of attention to internal processing during performance of mental tasks. Int J Psychophysiol 24: 161–171. [DOI] [PubMed] [Google Scholar]
- Jasper HH (1958): Report of the committee on methods of clinical examination in electroencephalography. Electroencephalogr Clin Neurophysiol 10: 371–375. [Google Scholar]
- Jausovec N (1996): Differences in EEG alpha activity related to giftedness. Intelligence 23: 159–173. [Google Scholar]
- Kahana MJ, Seelig D, Madsen JR (2001): Theta returns. Curr Opin Neurobiol 11: 739–744. [DOI] [PubMed] [Google Scholar]
- Keppel G (1991): Design and analysis: a researcher's handbook. Englewood Cliffs, NJ: Prentice‐Hall; 672 p. [Google Scholar]
- Klimesch W, Doppelmayr M, Schimke H, Ripper B (1997): Theta synchronization and alpha desynchronization in a memory task. Psychophysiology 34: 169–176. [DOI] [PubMed] [Google Scholar]
- Klimesch W, Doppelmayr M, Yonelinas A, Kroll NEA, Lazzara M, Rohm D, Gruber W (2001): Theta synchronization during episodic retrieval: neural correlates of conscious awareness. Brain Res Cogn Brain Res 12: 33–38. [DOI] [PubMed] [Google Scholar]
- Kopell N, Ermentrout GB, Whittington MA, Traub RD (2000): Gamma rhythms and beta rhythms have different synchronization properties. Proc Natl Acad Sci USA 97: 1867–1872. [DOI] [PMC free article] [PubMed] [Google Scholar]
- Kosslyn SM (1980): Image and Mind. Boston, MA: MIT Press; 500 p. [Google Scholar]
- Kosslyn SM, Ganis G, Thompson WL (2001): Neural foundations of imagery. Nat Rev Neurosci 2: 635–642. [DOI] [PubMed] [Google Scholar]
- Lachaux JP, Rodriguez E, Martinerie J, Varela FJ (1999): Measuring phase synchrony in brain signals. Hum Brain Mapp 8: 194–208. [DOI] [PMC free article] [PubMed] [Google Scholar]
- Lachaux JP, Rodriguez E, Van Quyen ML, Lutz A, Martinerie J, Varela FJ (2000): Studying single‐trials of phase synchronous activity in the brain. Int J Bifurcat Chaos 10: 2429–2439. [Google Scholar]
- Lutz A, Lachaux JP, Martinerie J, Varela FJ (2002): Guiding the study of brain dynamics by using first‐person data: synchrony patterns correlate with ongoing conscious states during a simple visual task. Proc Natl Acad Sci USA 99: 1586–1591. [DOI] [PMC free article] [PubMed] [Google Scholar]
- Miall RC, Tchalenko J (2001): A painter's eye movements: a study of eye and hand movement during portrait drawing. Leonardo 34: 35–40. [Google Scholar]
- Miller AI (1996): Insights of genius: imagery and creativity in science and art. Cambridge, MA: MIT Press. [Google Scholar]
- Miltner WH, Braun C, Arnold M, Witte H, Taub E (1999): Coherence of gamma‐band EEG activity as a basis for associative learning. Nature 397: 434–436. [DOI] [PubMed] [Google Scholar]
- Molle M, Marshall L, Fehm HL, Born J (2002): EEG theta synchronization conjoined with alpha desynchronization indicate intentional encoding. Eur J Neurosci 15: 923–928. [DOI] [PubMed] [Google Scholar]
- Mormann F, Lehnertz K, David P, Elger CE (2000): Mean phase coherence as a measure for phase synchronization and its application to the EEG of epilepsy patients. Physica D 144: 358–369. [Google Scholar]
- Nordine CF, Locher JP, Krupinski EA (1993): The role of formal art training on perception and aesthetic judgment of art composition. Leonardo 26: 219–227. [Google Scholar]
- Nunez P (1995): Neocortical dynamics and human EEG rhythms. New York: Oxford University Press. [Google Scholar]
- Otnes R, Enochson L (1972): Digital time series analysis. New York: John Wiley and Sons. [Google Scholar]
- Petsche H, Etlinger SC (1998): EEG and thinking. Vienna: Austrian Academy of Sciences Press. [Google Scholar]
- Petsche H, Kaplan S, von Stein A, Filz O (1997): The possible meaning of the upper and lower alpha frequency ranges for cognitive and creative tasks. Int J Psychophysiol 26: 77–97. [DOI] [PubMed] [Google Scholar]
- Pikovsky A, Rosenblum MG, Kurths J (2001): Synchronization: a universal concept in nonlinear sciences. Cambridge, UK: Cambridge University Press; 423 p. [Google Scholar]
- Posner MI, Petersen SE, Fox PT, Raichle ME (1988): Localization of cognitive operations in the human brain. Science 240: 1627–1631. [DOI] [PubMed] [Google Scholar]
- Pylyshyn ZW (1986): Computation and cognition. Cambridge, MA: MIT Press. [Google Scholar]
- Quian Quiroga R, Kraskov A, Kreuz T, Grassberger P (2002): Performance of different synchronization measures in real data: a case study on electroencephalographic signals. Phys Rev E Stat Nonlin Soft Matter Phys 65: 041903. [DOI] [PubMed] [Google Scholar]
- Raichle ME (1998): The neural correlates of consciousness: an analysis of cognitive skill learning. Philos Trans R Soc Lond B Biol Sci 353: 1889–1901. [DOI] [PMC free article] [PubMed] [Google Scholar]
- Razoumnikova OM (2004): Gender differences in hemispheric organization during divergent thinking: an EEG investigation in human subjects. Neurosci Lett 362: 193–195. [DOI] [PubMed] [Google Scholar]
- Roelfsema PR, Engel AK, Konig P, Singer W (1997): Visuomotor integration is associated with zero time‐lag synchronization among cortical areas. Nature 385: 157–161. [DOI] [PubMed] [Google Scholar]
- Roland PE, Friberg L (1985): Localization of cortical areas activated by thinking. J Neurophysiol 53: 1219–1243. [DOI] [PubMed] [Google Scholar]
- Rosenblum MG, Pikovsky AS, Kurths J (1996): Phase synchronization of chaotic oscillators. Phys Rev Lett 76: 1804–1807. [DOI] [PubMed] [Google Scholar]
- Rulkov NF, Sushchik MM, Tsimring LS, Abarbanel HD (1995): Generalized synchronization of chaos in directionally coupled chaotic systems. Phys Rev E 51: 980–994. [DOI] [PubMed] [Google Scholar]
- Sarnthein J, Petsche H, Rappelsberger P, Shaw GL, von Stein A (1998): Synchronization between prefrontal and posterior association cortex during human working memory. Proc Natl Acad Sci USA 95: 7092–7096. [DOI] [PMC free article] [PubMed] [Google Scholar]
- Sauer T, Yorke JA, Casdagli M (1991): Embedology. J Statist Phys 65: 579–616. [Google Scholar]
- Sauseng P, Klimesch W, Gruber W, Doppelmayr M, Stadler W, Schabus M (2002): The interplay between theta and alpha oscillations in the human electroencephalogram reflects the transfer of information between memory systems. Neurosci Lett 324: 121–124. [DOI] [PubMed] [Google Scholar]
- Schupp HT, Lutzenberger W, Birbaumer N, Miltner W, Braun C (1994): Neurophysiological differences between perception and imagery. Brain Res Cogn Brain Res 2: 77–86. [DOI] [PubMed] [Google Scholar]
- Simon HA, Chase WG (1973): Skill in chess. Am Sci 61: 394–403. [Google Scholar]
- Singer W (1999): Neuronal synchrony: a versatile code for the definition of relations? Neuron 24: 49–65. [DOI] [PubMed] [Google Scholar]
- Slutzky MW, Cvitanovic P, Mogul DJ (2002): Identification of determinism in noisy neuronal systems. J Neurosci Methods 118: 153–161. [DOI] [PubMed] [Google Scholar]
- Srinivasan R, Russell DP, Edelman GM, Tononi G (1999): Increased synchronization of neuromagnetic responses during conscious perception. J Neurosci 19: 5435–5448. [DOI] [PMC free article] [PubMed] [Google Scholar]
- Steriade M, Llinas RR (1988): The functional‐states of the thalamus and the associated neuronal interplay. Physiol Rev 68: 649–742. [DOI] [PubMed] [Google Scholar]
- Sviderskaia NE (1977): [EEG slow components during human mental activity]. Zh Vyssh Nerv Deiat Im I P Pavlova 27: 824–830. [PubMed] [Google Scholar]
- Tass P, Rosenblum MG, Weule J, Kurths J, Pikovsky A, Volkmann J, et al. (1998): Detection of n:m phase locking from noisy data: application to magnetoencephalography. Phys Rev Lett 81: 3291–3294. [Google Scholar]
- Tesche CD, Karhu J (2000): Theta oscillations index human hippocampal activation during a working memory task. Proc Natl Acad Sci USA 97: 919–924. [DOI] [PMC free article] [PubMed] [Google Scholar]
- Valladas H, Clottes J, Geneste JM, Garcia MA, Arnold M, Cachier H, Tisnerat‐Laborde N (2001): Paleolithic paintings. Evolution of prehistoric cave art. Nature 413: 479–479. [DOI] [PubMed] [Google Scholar]
- Varela F, Lachaux JP, Rodriguez E, Martinerie J (2001): The brainweb: phase synchronization and large‐scale integration. Nat Rev Neurosci 2: 229–239. [DOI] [PubMed] [Google Scholar]
- Volke HJ, Dettmar P, Richter P, Rudolf M, Buhss U (1999): Evoked coherences of EEG in mental load: An investigation in chess players. Zeitschrift Fur Psychologie 207: 233–262. [Google Scholar]
- Volke HJ, Dettmar P, Richter P, Rudolf M, Buhss U (2002): On‐coupling and off‐coupling of neocortical areas in chess experts and novices as revealed by evoked EEG coherence measures and factor‐based topological analysis—a pilot study. J Psychophysiol 16: 23–36. [Google Scholar]
- von Stein A, Sarnthein J (2000): Different frequencies for different scales of cortical integration: from local gamma to long range alpha/theta synchronization. Int J Psychophysiol 38: 301–313. [DOI] [PubMed] [Google Scholar]
- Ward LM (2003): Synchronous neural oscillations and cognitive processes. Trends Cogn Sci 7: 553–559. [DOI] [PubMed] [Google Scholar]