

Abstract
There are two basic types of photoreceptors in the retina: rods and cones. Using a single stimulus viewed at two different light levels, we tested whether input from rods and input from cones are topographically segregated at subsequent levels of human visual cortex. Here we show that rod‐mediated visual input produces robust activation in area MT+, and in the peripheral representations of multiple retinotopic areas. However, such activation was selectively absent in: (1) a cortical area selectively activated by colored stimuli (V8) and (2) the foveal representations of lower tier retinotopic areas. These cortical differences reflect corresponding differences in perception between scotopic and photopic conditions. Hum. Brain Mapping 9:55–63, 2000. © 2000 Wiley‐Liss, Inc.
Keywords: fmri, visual cortex, retinotopy, V8, rods, cones, fovea
INTRODUCTION
At the very first level of the retina, where light is transduced into neural signals, the photoreceptors can be subdivided into two distinct types: rods and cones. Rods and cones differ from each other based on a number of criteria, including photopigment, outer segment structure, postreceptoral connections, and retinal distribution.
In humans and many other animals, the rod system is most sensitive to light. Thus in dim light conditions—such as at night, away from manufactured light sources—only the rods are active. However, at higher light levels such as during daylight, the output of the rods becomes saturated, and vision is mediated mostly or entirely by the cones [Aguilar and Stiles, 1954].
Humans are diurnal creatures. We tend to be most active during the day, or we recreate these high light levels with manufactured sources when we are active at night. Thus most of human visual experience is mediated by cones. This cone dominance occurs despite a prominent anatomical bias: the human retina is 95% rods and only 5% cones [Curcio et al., 1987, 1990], and this minority of cones is concentrated in a tiny central portion of the retina, the fovea (see Fig. 1).
Figure 1.
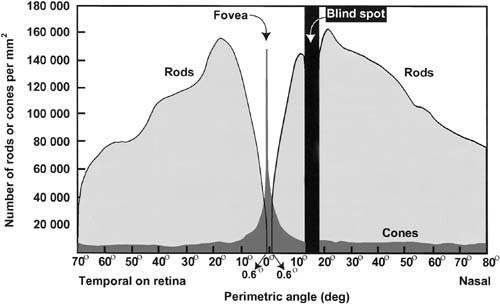
Distribution of rods and cones across the retina. The retina is shown schematically as a cross section from the nasal to the temporal side of the retina, scaled in degrees of visual (perimetric) angle, along the x‐axis. The y‐axis indicates the density of photoreceptors, for both rods and cones, per square millimeter of retinal surface at the corresponding eccentricity. The rods (light gray) are packed most densely ∼20° from the center (fovea) of the retina, but their numbers decrease progressively toward the fovea. Centered on the fovea there is a rod‐free region (radius = 0.6°), which is instead densely packed with cones (darker gray). The retinal cross section is taken through both the center of the fovea and the classical blind spot (optic nerve head), showing that the blind spot is much wider than the rod‐free region of the fovea. Diagram after Curcio et al. [1987].
Unlike many subtle distinctions in visual psychophysics, the difference between rod‐based and cone‐based vision is quite obvious even in daily life. During the day (photopic conditions), when vision is mediated almost entirely by cones, the world appears colored and sharply focused. During naturally occurring night time conditions without artificial illumination (scotopic conditions), when vision is mediated by rods, the same physical objects appear colorless and blurry.
The increased “blur” during scotopic conditions is due partly to the absence of rods in the central part of the fovea (see Fig. 1), where the most spatially detailed vision arises. The absence of rods in central vision is familiar to any stargazer who stares directly at a dim star. The relative insensitivity of foveal cones requires the stargazer to fixate the star eccentrically, to allow the star to fall on the region of the retina where rod density is maximal, before the star can be readily detected.
The chromatic differences in scotopic/photopic conditions arise because human color vision is generally based on comparisons between cones, but not rods [but see Arden and Frumkes, 1986]. Since cones are not activated in dim light, the scotopic world does not appear colored.
In Old World primates, one study [Purpura et al., 1988] suggests that inputs from rods and cones project selectively through M‐ and P‐type ganglion cells to the magnocellular and parvocellular layers, respectively, in the next level of visual processing, the lateral geniculate nucleus (LGN) [but see Lennie and Fairchild, 1994]. However, this segregation is complicated: M‐type ganglion cells also receive cone input, and they occur even in the rod‐free fovea [Silveira and Perry, 1991]. Beyond that, however, surprisingly little is known about the projection of these two fundamental photoreceptor types into the cortex, where conscious vision is thought to arise.
This lack of information about rod‐vs.‐cone inputs is particularly surprising in visual cortex, where several predictions are straightforward. First, the absence of foveal rods and the cortical magnification factor predict that a significant portion of V1 and other retinotopic cortical areas will be blind to visual input during scotopic conditions. In contrast, it could be that this scotopic “hole” in the retinotopic map is instead “filled in” within some of these cortical areas. For instance, in the retina, the classical blind spot (optic nerve head) is 3–4 times larger in diameter than the rod‐free fovea (Fig. 1). However, the projection of this classical blind spot can be “filled in” during monocular viewing, both perceptually and physiologically, within the cortical maps of extrastriate visual areas [Tootell et al., 1998]. This issue has implications for understanding the neural architecture underlying consciousness [Crick and Koch, 1995]; we can be frustratingly conscious of the absence of input from the rod‐free foveal region at night, yet we are normally unaware of the absence of input from the classical blind spot, even during monocular viewing conditions.
A second prediction is related to the fact that we can see colors at photopic light levels, but not at scotopic levels. Based on neurological patients with achromatopsia [for review, see Cavanagh et al., 1998; Damasio et al., 1980; Pearlman et al., 1979; Zeki et al., 1991] and on human neuroimaging data [Hadjikhani et al., 1998; Kleinschmidt et al., 1996; Lueck et al., 1989; McKeefry and Zeki, 1997], it has been suggested that one human cortical area (V8, formerly called V4) [Hadjikhani et al., 1998] plays a specific role in the perception of color. If this is true, then V8 should be selectively activated when wavelength‐varying stimuli are shown at photopic levels, when the stimuli appear colored. Correspondingly, V8 should be relatively less active when those same stimuli are viewed during scotopic conditions, when those same stimuli are perceptually achromatic.
A third prediction is in regard to differences in the relative influence from parvocellular and magnocellular layers of the LGN, which have been a topic of great interest in prior studies of primate visual cortex [DeYoe and Van Essen, 1988; Hubel and Livingstone, 1987; Martin, 1988; Maunsell and Newsome, 1987; Merigan and Maunsell, 1993; Shipp and Zeki, 1985; Ungerleider and Mishkin, 1982; Zeki and Shipp, 1988]. If the rods do project preferentially into the magnocellular LGN layers as suggested previously [Purpura et al., 1988], then cortical areas that receive dominant input from magnocellular LGN layers (such as MT) [Maunsell et al., 1990; Maunsell and van Essen, 1983] should also be selectively influenced by rod‐based input. We addressed all these questions by measuring brain activity produced by a single experimental stimulus, which was viewed at scotopic light levels, then at photopic light levels.
MATERIALS AND METHODS
MR images of brain activity were collected from normal subjects using a high‐field (3T) scanner, based on BOLD echo‐planar imaging. Data were analyzed in flattened cortical format, as described elsewhere [Dale et al., 1999; Fischl et al., 1999; Hadjikhani et al., 1998; Sereno et al., 1995; Tootell et al., 1997]. Informed written consent was obtained for each subject prior to the scanning session, and all procedures were approved by Massachusetts General Hospital Human Studies Protocol numbers 90‐7227 and 96‐7464. Data in this study were based on 67 scans (137,216 images) of photopic‐scotopic activity, 36 scans (73,728 images) of phase‐encoded retinotopy, and additional scans of related variables, from six well‐studied subjects. Subjects all used deep‐impression bite bars to minimize head motion. MR data were acquired using a customized, semicylindrical, quadrature send‐receive surface coil. Functional acquisitions were based on gradient echo sequences, using 16 contiguous slices (3–4 mm thick), an in‐plane resolution of 3.1 × 3.1 mm, and 2,048 images per scan. Data are shown in right‐hemisphere format for ease of comparison.
The location of cortical visual areas was also defined in the same subjects, based on additional scans using standardized tests for retinotopy (V1, V2, V3/VP, V3A, V4v and V8) [Hadjikhani et al., 1998; Sereno et al., 1995; Tootell et al., 1997] and other visual dimensions, e.g., MT+, as defined by De Yoe et al. [1996] and Tootell et al. [1997]. The level of MR modulation was sampled independently in each cortical visual area and in retinotopically specific regions within retinotopic areas. The measurements of surface area were made first in V1. The cortical surface corresponding to the majority of area V1 (0–30°) was based on field sign tests of cortical retinotopy, e.g., Sereno et al. [1995], Tootell et al. [1997, 1998] from each subject. The remaining small segment of peripheral V1 was extrapolated from previous maps. The rod‐sparse foveal region was defined based on the scotopic activity maps, thresholded according to the statistical values in Figure 2B. Surface area measurements were made similarly in extrastriate cortex.
Figure 2.
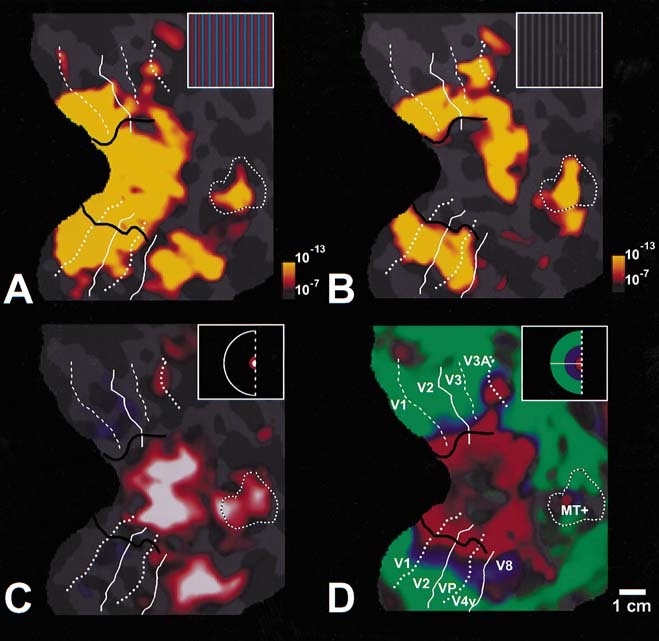
Maps of cortical activity produced by the same grating during photopic and scotopic conditions. All panels show the topography of MR activity in flattened cortical format, acquired from the same right hemisphere. The location of visual cortical areas V1, V2, V3/VP, V3A, V4v, V8, and MT+ is also labeled for comparison (see panel D; dotted white lines = upper vertical meridian; dashed white lines = lower vertical meridian; solid white lines = horizontal meridian), using largely automated criteria described in previous publications [Hadjikhani et al., 1998; Sereno et al., 1995; Tootell et al., 1997]. A shows the topography of MR activity produced during photopic conditions (140 cd/m2), when subjects viewed an equiluminant color‐varying grating, compared to that produced by viewing a uniform gray stimulus. B shows the topography of MR activity produced when viewing the same stimuli during scotopic conditions (1.4 × 10⁻⁴ cd/m2), otherwise as in B. The insets in the upper right of A and B illustrate the appearance of similar stimuli at these two luminance levels. In photopic conditions (A), the stimulus is brightly colored. In scotopic conditions (B), the stimulus appears achromatic, and it is invisible at the center of gaze. C and D show the activity from two retinotopic control stimuli. C shows the activity produced in cortical representations of the fovea, produced when the subject fixated a very small (radius = 0.8°) moving stimulus. D shows the representation of extrafoveal eccentricities, produced by thin phase‐encoded retinotopic stimuli [Tootell et al., 1997]. Logos illustrating the pseudocolor coding of eccentricities stimulated in each experiment are shown in the upper right corner of C and D. In D, the center of the red activation band corresponds to an eccentricity of ∼1.1°; blue is centered ∼3.8°, and green is centered ∼12°. The black line indicates the limit of rod‐mediated activity during scotopic conditions (B). It is centered on the foveal representation and extends to the representation of ∼1° eccentricity, in areas V1, V2, V3/VP, and V4v. Note that the pseudocolor scaling of activity is identical in A and B. Activity at a statistical significance (F‐test) with random probability <1 in 107 is shown in red, and activity at a higher significance range is shown in yellow (see logo to the bottom right of panels). Some visually driven activity did occur at significance levels lower than this (e.g., V4v, in the photopic condition), but this threshold level best illustrated the differences in activity that occurred in our tests. Area V8 was prominently activated during photopic conditions, but not during scotopic conditions. The extrafoveal representations in V1–V4v were robustly activated in both scotopic and photopic conditions. The motion‐selective areas MT+ and V3A were also activated robustly during scotopic conditions (see also Fig. 3).
The appearance of the stimulus at these two light levels was similar to that shown in the upper right inset of panels Figure 2A,B. First, we presented subjects with an equiluminant color‐varying grating of relatively high (photopic) luminance (140 cd/m2), extending over a relatively large area of the visual field (∼48° × 36°). The grating varied sinusoidally in color, but was of equal luminance throughout the stimulus. The spatial frequency of the grating was 0.3 cycles/degree, well within the normal spatial sensitivity in both scotopic and photopic conditions. The relative luminances of the stimulus colors was equated by motion null tests in each subject prior to scanning, using the same stimulus presentation system used later in the scanner. During scanning, the grating was presented in alternation with epochs of stimulation with a spatially uniform stimulus of equal mean luminance and chromaticity (gray).
RESULTS AND DISCUSSION
The resultant modulation of the MR signals revealed the level of activation produced by this stimulus, at this photopic luminance (140 cd/m2) (Fig. 2A). As expected, the activation extended across wide regions of cortex, including areas V1, V2, V3/VP, V3A, V4v, and MT+. This photopic activation also included an area that is selectively responsive to color stimuli, area V8 [Hadjikhani et al., 1998], formerly called V4 by several authors [Lueck et al. [1989]; McKeefry and Zeki [1977]; Zeki et al., 1989]. Additional cortical regions were also activated but have not yet been defined.
Next, we tested for activity produced by the same stimulus when viewed during scotopic conditions. This was done by: (1) removing all sources of light inside the scanning room except the stimulus projector, (2) drastically reducing the light output of the projector (by interposing a 6–7‐log unit neutral density filter in the light path), and (3) having subjects dark‐adapt for 35 min prior to stimulation and MR acquisition. These manipulations produced a rod‐mediated percept in which the grating became achromatic and invisible in the center of gaze. Although the color‐modulated gratings were equal in luminance at photopic levels, the grating was unequal in luminance at scotopic levels due to the shift in overall spectral sensitivity between photopic and scotopic levels. This made the stimulus visible as a luminance‐modulated grating during scotopic viewing.
The resultant map of scotopic activity is shown in Figure 2B. Note that it is shown using exactly the same pseudocolor activation values and format as in Figure 3A. Some regions of visual cortex showed little apparent drop in activity, despite the millionfold drop in mean luminance. Although somewhat counterintuitive, this result is consistent with much prior evidence showing that wide variations in mean luminance are largely factored out by the center‐surround organization of receptive fields at retinal and geniculate levels.
Figure 3.
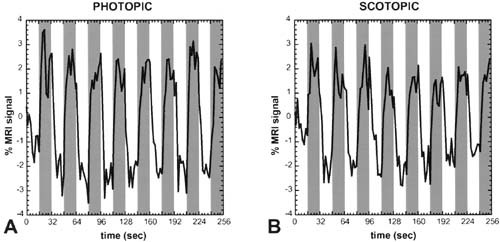
Human area MT+ responds robustly to both scotopic as well as to photopic stimuli. A and B show the time course of fMRI activity in response to the same grating stimulus, viewed at widely different luminance levels. The mean luminance of the stimulus during the photopic viewing conditions was 140 cd/m2, and the luminance during the scotopic condition was 7 log units dimmer, 1.4 × 10⁻⁵ cd/m2. At both luminance levels, the stimulus (similar to that in Fig. 2) was shown in 16‐sec epochs (indicated by gray columns) in alternation with epochs of a uniform gray stimulus, of equal mean chromaticity and luminance (indicated by gray columns). Both time courses were taken from a single region of interest in area MT+ in the same hemisphere, from the same scanning session. Despite the 10 millionfold drop in luminance from B to A, the MR response is still quite robust in MT+. This supports other evidence that human area MT+ receives prominent magnocellular inputs and that rods project strongly into the magnocellular information‐processing stream in Old World primates.
By comparing the results of retinotopic mapping experiments (Fig. 2C, D) to the present results (Fig. 2A, B), we found that the regions that remained active during this scotopic activation included the representations of the extrafoveal retina, in retinotopic areas V1, V2, V3/VP, and V4v. However, within the foveal representations of those same visual areas, activity decreased profoundly.
The retinal region that is completely free of rods is ∼1.25° in diameter [Curcio et al., 1990]. However the “fovea” is often considered to be larger than that in psychophysical experiments (2° diameter), because relatively few rods are present in the surrounding region as well (see Fig. 1). That psychophysically defined rod‐sparse region coincides well with the limits of activation by the scotopic stimuli in our experiment (black line, Fig. 2B), which lies at the representation of 1.04° eccentricity (diameter = 2.08°).
Of course, the latter value varies slightly, depending on the signal/noise ratio of the imaging data and the activation thresholds chosen. Nonetheless, this comparison helped us illustrate a specific point. Because the rod‐sparse region occurs in the fovea and because the representation of the fovea is greatly enlarged by the cortical magnification factor, the representation of this rod‐sparse central representation was quite large in cortex. In our data, it extended about 16 mm across the cortical surface (∼16% of the surface area) in V1, V2, V3/VP, and V4v.
Thus the rod‐blind retinal region is faithfully preserved in each of these cortical representations, instead of being filled‐in by information from surrounding, visually activated regions. This forms an interesting conter‐example to the representation of the classical retinal blind spot. That blind spot is 3–4 times larger in diameter than the rod‐free region in the retina, yet its projection is filled‐in at cortical levels beyond V1 [Tootell et al., 1998].
Why should there be such a difference in the projection of these two retinal lacunae? In cortex the length of the axonal connections required by the foveal magnification may not allow such a long‐distance filling‐in process across this rod‐free representation. Another difference is that in the classical blind spot, information from the blind region of the visual field is normally available from the retinotopically corresponding region of the other eye. However, during normal binocular viewing conditions, both rod‐free foveal regions are converged on the same retinotopic regions, so that analogous foveal information is unavailable from the alternate eye to “fill in” missing visual information.
The other perceptual difference between these two conditions is that the photopic world appears brightly colored, whereas the scotopic world appears achromatic. The fMRI data showed an obvious parallel to this difference in cortical area V8. At photopic light levels, previous studies have shown that V8 responds selectively to colored visual stimuli, more than to acromatic stimuli [Hadjikhani et al., 1998; Kleinschmidt et al., 1996; Lueck et al., 1989; McKeefry and Zeki, 1997; Zeki et al., 1991]. Consistent with those findings, fMRI activity in area V8 decreased significantly in the scotopic activity maps, relative to that in the photopic maps (Fig. 2A,B). It was noteworthy that such decreases occurred throughout the whole of V8—not just the foveal representation at the anterior border of V8 [e.g., Fig. 2D of Hadjikhani et al., 1998]. This relative decrease in activity supports the prior evidence that area V8 is in fact color‐selective, even in the very different experimental context described here. This is significant, because previous work left open the question of whether V8 is globally selective for color, or whether the color selectivity there was just a reflection of the foveal representation in V8, which is topographically displaced from other foveal representations [Hadjikhani et al., 1998]. The present work supports the idea that V8 is globally selective for stimulus color.
Evidence from nonhuman primates predicts that human MT+ should have dominant input from the magnocellular LGN layers [Maunsell, 1990; Maunsell and van Essen, 1983] and that this input should be rod‐selective [Purpura et al., 1988]. In both the activity maps (Fig. 2A,B) and in time courses extracted from that area (Fig. 3), human MT+ was prominently influenced by the rod‐driven input. Because the retinotopy in human area MT+ is not well differentiated [Sereno et al., 1995; DeYoe et al., 1996; Tootell et al., 1997], one cannot test for photopic/scotopic differences in foveal versus extrafoveal representations in that area.
The scotopic/photopic comparisons shown above can be criticized because they represent only two “snapshots” of activity at two different luminance levels. Our model of dichotomous neural activity at scotopic and photopic light levels would be even more convincing if we could show something akin to a “rod‐cone break,” as in previous studies of rod/cone function.
To do this, we produced a more extensive series of maps, otherwise similar to those described above. The stimuli in this more extensive series were presented over a 7‐log unit range of luminances, in 15 contiguous steps, each 0.5 log units apart. After dark adaptation, activity was measured sequentially, from the dimmest to the brightest light levels tested. The mean modulation of the MR signals at each luminance level is shown in Figure 4, for cortical regions of special interest (peripheral V1, foveal V1, area V8). We also collected subjective reports of whether the stimuli looked colored (which reflect the levels of rod/cone involvement), at each luminance level. Based on these reports, the approximate percept at each luminance level is also indicated in the background of Figure 4. In accord with the scotopic/photopic shift in spectral sensitivity, longer wavelengths in the stimulus, e.g., red, appeared colored at light levels 0.5–1 log units higher compared to shorter wavelengths, e.g., cyan. That is, the photochromatic interval was greater for longer compared to shorter wavelengths [Wald, 1945].
Figure 4.
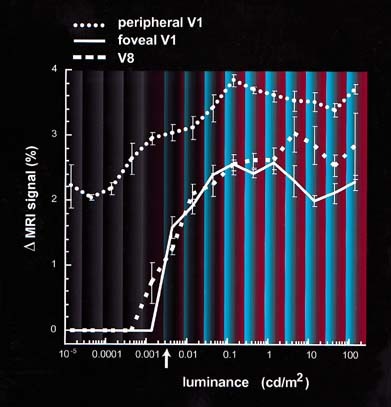
Functional MRI activity shows a rod‐cone “break” in foveal V1 and V8, but not in peripheral V1. This graph shows the level of MR modulation in response to the stimulus grating (as in Figs. 2 and 3), across a wide range of mean luminances. Data are shown for three different ROI: foveal V1, peripheral V1, and area V8. The dimmest light levels area shown to the left, and the brightest toward the right. The luminance level indicated by the white arrow on the x‐axis corresponds to 0.1 Troland, the foveal cone threshold [Stiles and Crawford, 1933a,1933b]. The brackets indicate 1 standard error for each data point. The reports of the stimulus color appearance are also approximated in the figure background. Activity is not measurable in foveal V1 and throughout V8 until a luminance level is reached where the subject begins to perceive stimulus color. This level also corresponds approximately to the cone threshold. Activity in peripheral V1 (and in MT+; see Fig. 3) is more constant across this range of stimulus luminance, i.e., it does not show such a rod‐cone “break.”
The results confirmed our earlier interpretation of the activity “snapshots” in Figure 2. Throughout the 2–3 log unit range of measured scotopic vision, activity was reasonably high outside the foveal representations of retinotopically specific primary visual cortex (V1). However, in the representation of the rod‐free fovea in the same visual area (V1), activity was not measurable until about the level when colors began to be perceived, i.e., when photopic levels were achieved. The light level where this cortical “rod‐cone break” occurred was reasonably consistent with previous measurements of psychophysical threshold in foveal cones (0.1 Td) [Stiles and Crawford, 1933a,1933b]. In foveal V1, MR modulation rose sharply at light levels above this point to near the level of modulation observed in extrafoveal V1. Area V8 had an activity profile similar to that in foveal V1, likewise showing no measurable activity during scotopic vision but rising sharply at brighter light levels. The fact that activity began rising in V8 at about the level where color is seen reinforced the other evidence that area V8 is selectively activated by color‐varying stimuli. Of course, a similar argument can be made to suggest that color‐selectivity is higher in foveal V1. That argument is consistent with the evidence from the distribution of cones in the retina [Curcio et al., 1987], from prior color psychophysics and from some imaging studies [Hadjikhani et al., 1998, see also Zeki et al., 1991].
CONCLUSION
The nature of the cortical projection of rods and cones forms an interesting counterpoint to the earlier data (and controversy) on separate but intermingled “streams” of information processing in primate visual cortex. Generally, that model suggested that different types of visual information are segregated into two anatomical compartments at one early stage, the magnocellular and parvocellular layers of the LGN. The model further suggested that the visual information changes, but remains partially segregated, in each of subsequent cortical stages such as V1, V2, MT, and even V4d [DeYoe et al., 1994; DeYoe and Van Essen, 1985; Maunsell and Newsome, 1987; Shipp and Zeki, 1985; Zeki and Shipp, 1988].
In contrast, the information arising from retinal rods and cones appears to remain relatively unchanged in these and additional cortical areas, at least in terms of its visual field projection and sensitivity. However, the rod‐cone projection does appear to be well integrated into the color‐processing mechanisms in area V8. Finally, the prominent rod input demonstrated in human area MT+ is consistent with the earlier reports from monkeys that rods project preferentially into the magnocellular layers of the LGN, which in turn send a relatively segregated projection eventually reaching MT.
Acknowledgements
We thank Anders Dale for the use of his cortical flattening code, and Bruce Fischl for helping with retinotopic calculations. We thank Patrick Cavanagh for help with the color stimuli and the psychophysical literature. We also thank Terrance Campbell for help with the scanning, and Bruce Rosen and the MR Center for institutional support. Tommy Vaughan furnished an excellent surface coil, and the Rowland Institute furnished valuable plastic hardware.
REFERENCES
- Aguilar M, Stiles WS. 1954. Saturation of rod mechanism at high levels of stimulation. Optica Acta 1:59–65. [Google Scholar]
- Arden GB, Frumkes TE. 1986. Stimulation of rods can increase cone flicker ERGs in man. Vision Res 26:711–721. [DOI] [PubMed] [Google Scholar]
- Cavanagh P, Hénaff MA, Michel F, Landis T, Troscianko T, Intriligator J. 1998. Complete sparing of high‐contrast color input to motion perception in cortical color blindness. Nature Neurosci 1:242–247. [DOI] [PubMed] [Google Scholar]
- Crick F, Koch C. 1995. Are we aware of neural activity in primary visual cortex? Nature 375:121–123. [DOI] [PubMed] [Google Scholar]
- Curcio CA, Sloan KR, Kalina RE, Hendrickson AE. 1990. Human photoreceptor topography. J Comp Neurol 292:497–523. [DOI] [PubMed] [Google Scholar]
- Curcio CA, Sloan KR Jr, Packer O, Hendrickson AE, Kalina RE. 1987. Distribution of cones in human and monkey retina: individual variability and radial asymmetry. Science 236:579–582. [DOI] [PubMed] [Google Scholar]
- Dale AM, Fischl B, Sereno MI. 1999. Cortical surface‐based analysis I: segmentation and surface reconstruction. NeuroImage 9:179–194. [DOI] [PubMed] [Google Scholar]
- Damasio A, Yamada T, Damasio H, Corbett J, McKee J. 1980. Central achromatopsia: behavioral, anatomic, and physiologic aspects. Neurology 30:1064–1071. [DOI] [PubMed] [Google Scholar]
- DeYoe EA, Felleman DJ, Van Essen DC, McClendon E. 1994. Multiple processing streams in occipitotemporal visual cortex [published erratum appears in Nature 1994 Oct 27;371:812]. Nature 371:151–154. [DOI] [PubMed] [Google Scholar]
- DeYoe EA, Van Essen DC. 1985. Segregation of efferent connections and receptive field properties in visual area V2 of the macaque. Nature 317:58–61. [DOI] [PubMed] [Google Scholar]
- DeYoe EA, Van Essen DC. 1988. Concurrent processing streams in monkey visual cortex. Trends Neurosci 11:219–226. [DOI] [PubMed] [Google Scholar]
- DeYoe EA, Carmann GJ, Bandettini P, Glickman S, Wieser J, Cox R, Miller D, Neitz L. 1996. Mapping striate and extrastriate visual areas in human cerebral cortex. Proc Natl Acad Sci USA 93:2382–2386. [DOI] [PMC free article] [PubMed] [Google Scholar]
- Fischl B, Sereno MI, Dale AM. 1999. Cortical surface‐based analysis. II: inflation, flattening, and a surface‐based coordinate system. NeuroImage 9:195–207. [DOI] [PubMed] [Google Scholar]
- Hadjikhani N, Liu AK, Dale AM, Cavanagh P, Tootell RBH. 1998. Retinotopy and color selectivity in human visual cortical area V8. Nature Neurosci 1:235–241. [DOI] [PubMed] [Google Scholar]
- Hubel DH, Livingstone MS. 1987. Segregation of form, color and stereopsis in primate area 18. J Neurosci 7:3378–3415. [DOI] [PMC free article] [PubMed] [Google Scholar]
- Kleinschmidt A, Lee BB, Requardt M, Frahm J. 1996. Functional mapping of color processing by magnetic resonance imaging of responses to selective P‐ and M‐pathway stimulation. Exp Brain Res 110:279–288. [DOI] [PubMed] [Google Scholar]
- Lennie P, Fairchild MD. 1994. Ganglion cell pathways for rod vivion. Vision Res 34:477–482. [DOI] [PubMed] [Google Scholar]
- Lueck CJ, Zeki S, Friston KJ, Deiber MP, Cope P, Cunningham VJ, Lammertsma AA, Kennard C, Frackowiak RS. 1989. The colour centre in the cerebral cortex of man. Nature 340:386–389. [DOI] [PubMed] [Google Scholar]
- Martin KA. 1988. From enzymes to visual perception: a bridge too far? Trends Neurosci 11:380–387. [DOI] [PubMed] [Google Scholar]
- Maunsell JH, Nealey TA, DePriest DD. 1990. Magnocellular and parvocellular contributions to responses in the middle temporal visual area (MT) of the macaque monkey. J Neurosci 10:3323–3334. [DOI] [PMC free article] [PubMed] [Google Scholar]
- Maunsell JH, Newsome WT. 1987. Visual processing in monkey extrastriate cortex. Annu Rev Neurosci 10:363–401. [DOI] [PubMed] [Google Scholar]
- Maunsell JH, van Essen DC. 1983. The connections of the middle temporal visual area (MT) and their relationship to a cortical hierarchy in the macaque monkey. J Neurosci 3:2563–2586. [DOI] [PMC free article] [PubMed] [Google Scholar]
- McKeefry DJ, Zeki S. 1997. The position and topography of the human colour centre as revealed by functional magnetic resonance imaging. Brain 120:2229–2242. [DOI] [PubMed] [Google Scholar]
- Merigan WH, Maunsell JH. 1993. How parallel are the primate visual pathways? Annu Rev Neurosci 16:369–402. [DOI] [PubMed] [Google Scholar]
- Pearlman AL, Birch J, Meadows JC. 1979. Cerebral color blindness: an acquired defect in hue discrimination. Annals Neurol 5:253–261. [DOI] [PubMed] [Google Scholar]
- Purpura K, Kaplan E, Shapley RM. 1988. Background light and the contrast gain of primate P and M retinal ganglion cells. Proc Natl Acad Sci USA 85:4534–4537. [DOI] [PMC free article] [PubMed] [Google Scholar]
- Sereno MI, Dale AM, Reppas JB, Kwong KK, Belliveau JW, Brady TJ, Rosen BR, Tootell RB. 1995. Borders of multiple visual areas in humans revealed by functional magnetic resonance imaging [see comments]. Science 268:889–893. [DOI] [PubMed] [Google Scholar]
- Shipp S, Zeki S. 1985. Segregation of pathways leading from area V2 to areas V4 and V5 of macaque monkey visual cortex. Nature 315:322–325. [DOI] [PubMed] [Google Scholar]
- Silveira LC, Perry VH. 1991. The topography of magnocellular projecting ganglion cells (M ganglion cells) in the primate retina. Neuroscience 40:217–237. [DOI] [PubMed] [Google Scholar]
- Stiles WS, Crawford BH. 1933a. The liminal brightness increment as a function of wave‐length for different conditions of the foveal and the parafoveal retina. Proc Royal Soc Lond B 113:496–530. [Google Scholar]
- Stiles WS, Crawford BH. 1933b. The luminous efficiency of rays entering the pupil at different points. Proc Royal Soc Lond B 112:428–450. [Google Scholar]
- Tootell RB, Hadjikhani NK, Vanduffel W, Liu AK, Mendola JD, Sereno MI, Dale AM. 1998. Functional analysis of primary visual cortex (V1) in humans. Proc Natl Acad Sci USA 95:811–817. [DOI] [PMC free article] [PubMed] [Google Scholar]
- Tootell RB, Mendola JD, Hadjikhani NK, Ledden PJ, Liu AK, Reppas JB, Sereno MI, Dale AM. 1997. Functional analysis of V3A and related areas in human visual cortex. J Neurosci 17:7060–7078. [DOI] [PMC free article] [PubMed] [Google Scholar]
- Ungerleider LG, Mishkin M. 1982. Analysis of visual behaviour. Cambridge: MIT Press. [Google Scholar]
- Wald G. 1945. Human vision and ths spectrum. Science 101:653–658. [DOI] [PubMed] [Google Scholar]
- Zeki S, Shipp S. 1988. The functional logic of cortical connections. Nature 335:311–317. [DOI] [PubMed] [Google Scholar]
- Zeki S, Watson JDG, Lueck CJ, Friston KJ, Kennard C, Frackowiak RSJ. 1991. A direct demonstration of functional specialization in human visual cortex. J Neuroscience 11:641–649. [DOI] [PMC free article] [PubMed] [Google Scholar]