Summary
Transposons have played a pivotal role in genome evolution1 and are believed to be the evolutionary progenitors of the RAG1-RAG2 recombinase2, an essential component of the adaptive immune system in jawed vertebrates3. Here we report one crystal and five cryo-electron microscopy structures of a RAG1-like transposase, HzTransib4,5, that capture the entire transposition process from the apo enzyme to the terminal strand transfer complex with transposon ends covalently joined to target DNA, at resolutions of 3.0–4.6 Å. These structures reveal a butterfly-shaped complex that undergoes two cycles of dramatic conformational changes in which the “wings” of the transposase unfurl to bind substrate DNA, close to execute cleavage, open to release the flanking DNA, and close again to capture and attack target DNA. HzTransib possesses unique structural elements that compensate for the absence of a RAG2 partner including a loop that interacts with the transposition target site and an accordion-like C-terminal tail that elongates and contracts to help control the opening and closing of the enzyme and assembly of the active site. Our findings reveal the reaction pathway of a eukaryotic cut-and-paste transposase in unprecedented detail and illuminate some of the earliest steps in the evolution of the RAG recombinase.
Keywords: RAG, V(D)J recombination, Transib, DNA transposition, strand transfer, evolution, X-ray crystallography, cryo-electron microscopy
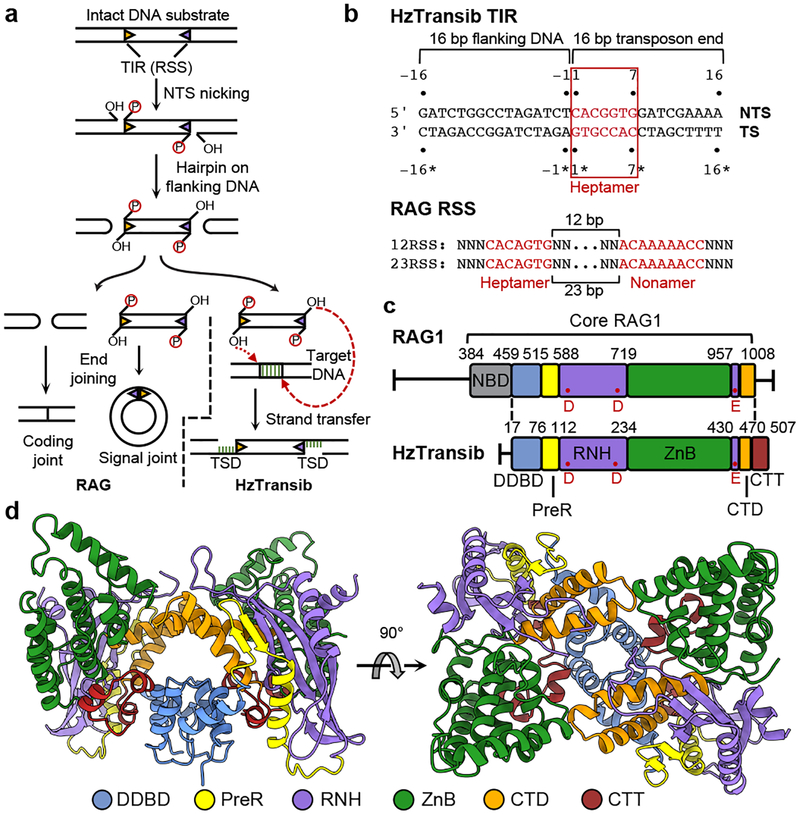
Transposons are present in all kingdoms of life and move within or between genomes using transposon-encoded transposases6. Many DNA transposases and retroviral integrases contain a conserved RNase H-like domain that uses three acidic residues (the DDE/D motif) to coordinate magnesium and catalyze DNA cleavage and integration7. The RAG1-RAG2 recombinase (RAG), which shares this RNase H catalytic domain8, generates DNA double-strand breaks at recombination signal sequences (RSSs) to initiate V(D)J recombination in developing lymphocytes of jawed vertebrates3,9. The RAG1 catalytic core and RSSs are thought to have evolved from the transposase and terminal inverted repeats (TIRs), respectively, of an ancient Transib transposon10. Acquisition of a RAG2-like gene by a Transib element is proposed to have generated a “RAG transposon” that subsequently played a key role in the evolution of RAG1-RAG2 loci and V(D)J recombination2. Unlike cut-and-paste transposition, which is an excision-and-integration reaction, V(D)J recombination is an excision-and-end joining reaction that rejoins the ends of the excised segment to protect the genome against hazardous insertions (Fig. 1a). Hence, RAG has been subject to different evolutionary constraints than its transposase ancestors, particularly in the events that occur after DNA cleavage.
Figure 1. Functional and structural overview of HzTransib.
a, Schematic of DNA recombination and transposition pathways of RAG and HzTransib. RSS or TIR are shown as triangles with wide side indicating heptamer sequence. TSD, target site duplication. b, Sequence and numbering of the HzTransib TIR substrate. Heptamer and nonamer sequences of TIR and RSS are shown in red. TS, transferred strand. NTS, non-transferred strand. The nicking site on HzTransib TIR is between T-1 and C1 on NTS. c, Domain organization of HzTransib in comparison with mouse RAG1. Domain boundaries are shown by residue number. Active site carboxylates are labeled in red. d, Front and top view of the apo HzTransib dimer crystal structure.
Transib from Helicoverpa zea (HzTransib) is an active transposon whose TIR resembles a portion of the RSS (Fig. 1b)4 and whose transposase (HzTransib) cleaves DNA by a nick-hairpin mechanism like that of RAG and the hAT family transposase Hermes5,11 (Fig. 1a). HzTransib5, Hermes12, and RAG13,14 are active in vitro for the subsequent strand transfer reaction that completes transposition but for RAG, this step is strongly suppressed in vivo2.
Recent advances in RAG structural biology have illuminated the molecular basis for RSS recognition and cleavage8,15–17. However, transposition mediated by DDE/D family enzymes that proceed via hairpinning is less well understood, particularly at the final step of integration into target DNA. In contrast to the availability of structures capturing the strand transfer complexes of bacteriophage Mu18 and retroviral integrases19–22, transposon integration has been visualized structurally for only one eukaryotic DNA transposase, Mos123,24, and Mos1 employs a catalytic mechanism that does not involve a hairpin intermediate25. As the only known active Transib transposase, HzTransib provides a unique opportunity for analysis of a RAG2-independent RAG1-family protein and for comparative insights into the impact of RAG2 on RAG1 function and RAG evolution.
Here we describe near-atomic resolution crystal or cryo-electron microscopy (cryo-EM) structures of HzTransib in the Apo form and complexed with intact TIR substrate, nicked TIR substrate, cleaved transposon ends, and transposon ends covalently joined to target DNA (Extended Data Fig. 1–4, Extended Data Table 1, 2). An additional complex, with HzTransib bound to transposon ends and target DNA prior to strand transfer, was also observed in and modeled from the cryo-EM data. These structures represent the most complete structural description to date of a eukaryotic cut-and-paste transposition reaction, explain the target site sequence preferences of RAG-family transposases, and reveal the conformational changes that enable the same catalytic center to perform both transposon excision and integration.
Opening of HzTransib upon TIR engagement
Apo HzTransib exhibits a modular domain arrangement similar to that of RAG18 (Fig. 1c, d). The N-terminal dimerization and DNA-binding domain (DDBD) serves as the dimerization interface and is connected by an extended pre-RNase H (PreR) loop to a split RNase H-like (RNH) domain containing three conserved catalytic carboxylates5 (D125, D224, and E435), all of which are required for activity5 (Extended Data Fig. 1c, d). E435 is separated from the rest of RNH by two zinc-binding domains, ZnC2 and ZnH2 (collectively, ZnB), which form a C2H2 zinc finger (Extended Data Fig. 5a), as in RAG18. The following C-terminal domain (CTD) folds back to interact with DDBD, and the protein ends with a ~30 amino acid C-terminal tail (CTT) made up of three short helices that bridge from DDBD to ZnB. The absence of a nonamer-binding domain (NBD) (Extended Data Fig. 5b) is consistent with the observation that HzTransib TIRs have sequence similarity to the heptamer but not the nonamer of the RSS (Fig. 1b)4,26.
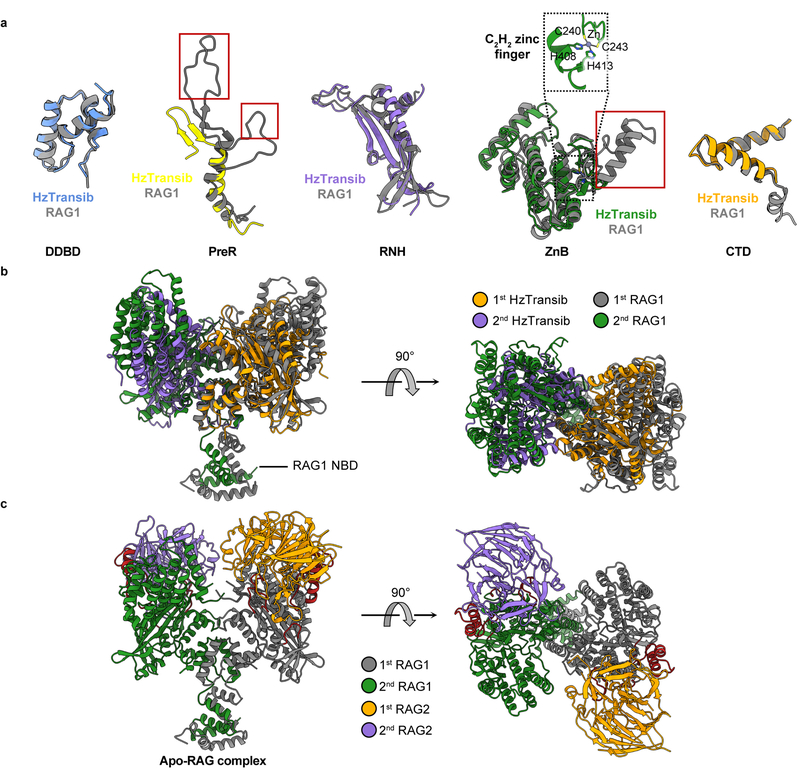
Despite low (16.4%) sequence identity between HzTransib and RAG1 core, individual domains from the two proteins are readily superimposable (Extended Data Fig. 5a), providing support for the model that Transib and RAG1 are evolutionarily related. These alignments also reveal several differences between HzTransib and RAG1, three of which (red boxes in Extended Data Fig. 5a) are extended structural elements in RAG1, absent from HzTransib, that together constitute a substantial portion of the RAG2-binding interface in RAG1 (Extended Data Fig. 5c). These three missing elements explain the absence of a RAG2-like entity in HzTransib and poor RAG2 binding by HzTransib in vitro4,26.
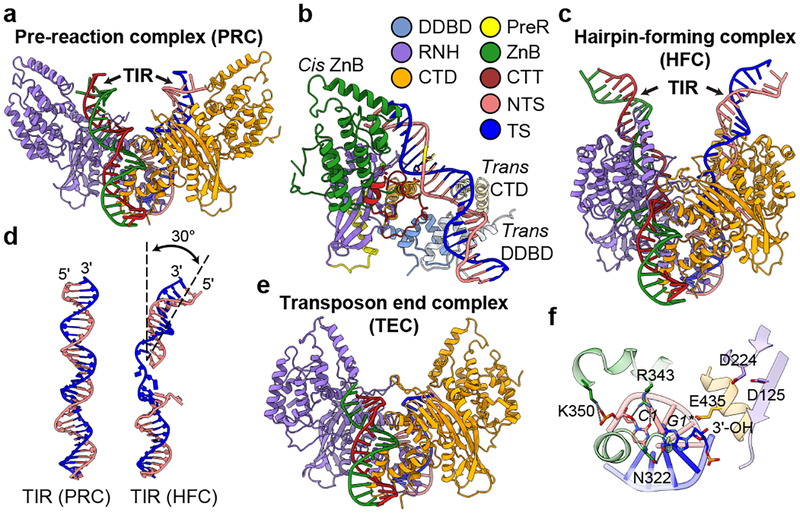
Binding of intact TIR substrate to form the pre-reaction complex (PRC) induces a dramatic relocation of the ZnB domains, from being tightly packed components of the enzyme core to lateral extensions that jut away from the core (Fig. 2a, Extended Data Fig. 6a and Supplementary Video 1). This 49° rotation and 26 Å centroid movement of ZnB exposes the TIR-binding grooves (Extended Data Fig. 6a) and is twice as large as the RAG1 ZnB domain movement that occurs upon intact RSS binding16. Viewed from the front, the HzTransib PRC resembles a butterfly with wings spread and DNA as antennae, with ZnB domain rotation constituting an “unfurling” of the wings, one from the back and one from the front of the butterfly (Fig. 2a, Extended Data Fig. 6a).
Figure 2. Structures of HzTransib-TIR complexes during transposon binding and excision.
a, Overall cryo-EM structure of HzTransib PRC with intact TIR substrates. Two HzTransib subunits are colored in orange and purple. b, Trans architecture of HzTransib-TIR complex. DDBD and CTD from trans HzTransib are in pale colors. Mg2+ ion, green sphere; catalytic carboxylates, red sticks; scissile phosphate is highlighted in yellow. c, Overall cryo-EM structure of HzTransib HFC with nicked TIR substrates. d, Comparison of TIR substrates from PRC and HFC. e, Overall cryo-EM structure of HzTransib TEC with catalytically cleaved transposon end DNAs. f, Transposon end nucleotides are stabilized by ZnB domain residues, but the 3’-OH is not coordinated for the subsequent strand transfer reaction.
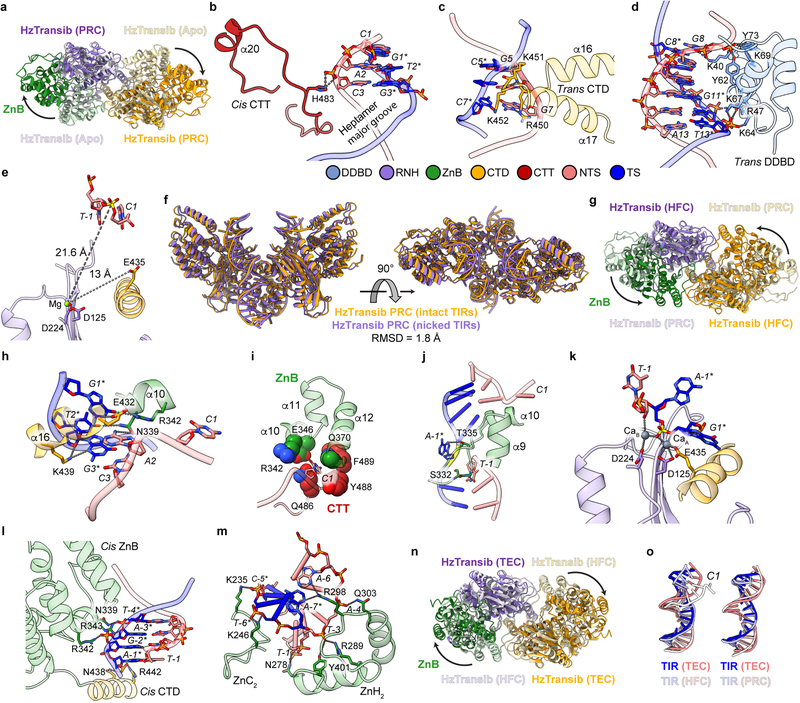
The HzTransib PRC adopts a trans architecture in which each TIR engages the active site of one HzTransib (the cis subunit) but is bound primarily by the other HzTransib (the trans subunit) (Fig. 2b), as for RAG and other DDE transposases and retroviral integrases7,15,16. CTT from the cis subunit tracks through the heptamer major groove and interacts with the backbone of TIR position 3 (Extended Data Fig. 6b). Trans DNA binding interactions include base-specific interactions between CTD and TIR positions 5–7 and between DDBD and the phosphate backbone at TIR positions 8–13 (Extended Data Fig. 6c, d). No interaction is observed beyond position 13, and consistent with this, serial 3’ truncations of the TIR demonstrate that cleavage in vitro is robust with only the first 13 bp of the TIR (Extended Data Fig. 1e).
The PRC is a cleavage-incompetent complex in which the scissile phosphate for nicking is far from the active site and E435 is not positioned for catalysis (Extended Data Fig. 6e). This indicates that a substantial structural alteration will be required before nicking of the NTS could take place.
HzTransib closure accompanies catalysis
Incubation of HzTransib with nicked TIR substrate at 30°C in Ca2+ yielded a complex that is poised for hairpin formation, referred to as the hairpin-forming complex (HFC). The HFC is more compact than the PRC, with the ZnB domains having undergone a major 51° inward rotation along an axis nearly perpendicular to that of the original outward movement (Fig. 2c, Extended Data Fig. 6g and Supplementary Video 1). The inward folding of the ZnB “wings” has been accompanied by several other changes in the complex. First, flanking DNA has rotated ~180° and tilted ~30° toward the cis ZnB domain, with bases C1 and A-1* becoming flipped out of the helix (Fig. 2d and Extended Data Fig. 6h–j). A similar DNA rotation is seen in RAG-nicked RSS structures15,16. Second, a ~6 Å movement of E435 has led to full assembly of the active site (Extended Data Fig. 6k). And third, HFC formation results in numerous new cis HzTransib-DNA contacts. The first 3 bp of the heptamer make extensive base-specific interactions with α10 and α16 of the cis subunit (Extended Data Fig. 6h) and the extrahelical C1 base is buried in a pocket formed by α10, α12 and a loop of CTT (Extended Data Fig. 6i). ZnB enfolds the flanking DNA (Fig. 2c) and interacts with the first 7 bp of flanking DNA; in the PRC, such interactions extended only to position −4 (Extended Data Fig. 6l, m). Due to its lack of a RAG2 subunit, interactions of HzTransib with flanking DNA are much less extensive than for RAG, where RAG2 contacts extend to position −15 in the PRC and HFC15,16.
HzTransib reopens upon DNA cleavage
The HzTransib transposon end complex (TEC) structure, in which hairpin formation and release of flanking DNA has occurred, provides a unique view of post-cleavage events for hAT/RAG family enzymes. Release of the flanking DNA hairpin ends is associated with a 26° rotation of the ZnB domains that partially spreads the “wings” of the complex (Fig. 2e, Extended Data Fig. 6n and Supplementary Video 1). C1 of the heptamer has now switched from its flipped-out position to base pair with G1* and transposon end DNA has become largely superimposable with that in the PRC (Extended Data Fig. 6o). In the absence of flanking DNA, the ZnB domains are able to tilt and interact with the exposed heptamer ends, physically sequestering them through interactions involving N322, R343 and K350 (Fig. 2f). The 3’-OH that will be the nucleophile for the target integration reaction is not in close proximity to the three active site carboxylates (Fig. 2f), indicating that substantial distortions of the transposon end and conformational changes in HzTransib will be necessary for the strand transfer reaction.
The TEC structure illustrates how HzTransib prepares for target capture and reveals several structural differences with RAG and other transposases. The substantial outward rotation of ZnB seen in the TEC exposes the DNA binding groove and likely facilitates flanking DNA release and target capture. No such movement is seen for RAG or Hermes12,15. In addition, HzTransib’s interactions with the cleaved transposon ends might shield the DNA from DNA repair enzymes and inhibit end joining. Similar interactions with the cleaved RSS ends are not seen in the RAG signal end complex (SEC)15, a difference that might reflect the different evolutionary constraints faced by HzTransib and RAG. Finally, dislocation of the 3’-OH nucleophile out of the HzTransib active site in the TEC is not observed in the RAG SEC or TEC of other transposases12,15,23,27.
Target DNA capture and strand transfer
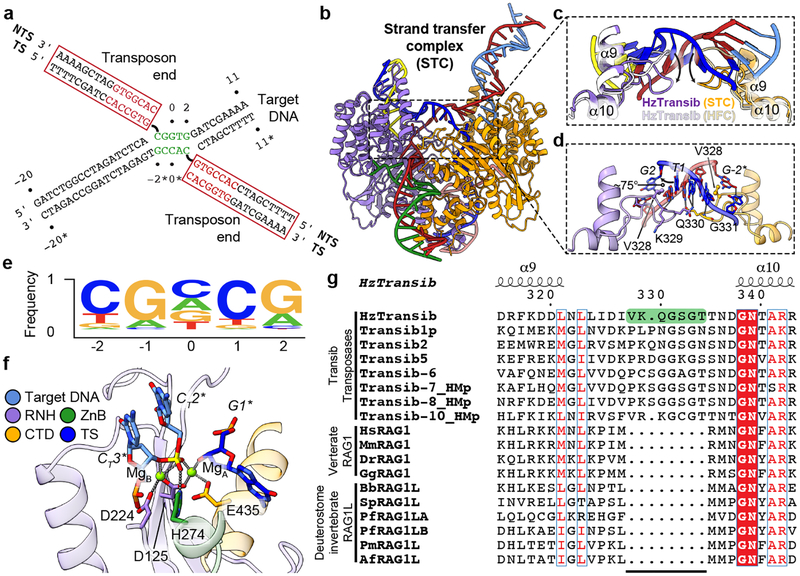
During transposition, hairpin formation and flanking DNA release are followed by non-covalent capture of target DNA to form the target capture complex (TCC) and then by the strand transfer reaction that covalently joins the transposon ends to target DNA to form the strand transfer complex (STC). The HzTransib TCC and STC were formed through cleavage of intact TIR substrates without the provision of a specific target DNA. One 3D class of HzTransib-TIR complexes contained clearly resolved density connecting the catalytic centers of the two HzTransib subunits (Extended Data Fig. 7a), which was determined (see Methods) to be the 5 bp target site generated after attack of the transposon ends at a 5’-CGGTG-3’ sequence in an additional TIR substrate molecule (Fig. 3a).
Figure 3. Transposon end integration and strand transfer complex.
a, Schematic of strand transfer product. Heptamer and target site sequences are colored red and green, respectively. b, Overall cryo-EM structure of HzTransib in complex with naturally generated strand transfer product. c, Different conformations of α9-α10 target site binding loop in STC and HFC. d, Interactions between α9-α10 loop and 5 bp target site. Hydrogen bonds are shown as dashed lines. e, Sequence logo representing nucleotide frequencies at HzTransib TIRs integration sites. f, Active site of the TCC model. Mg2+ ions, green spheres. Nucleotide residues in target DNA are indicated with “T” subscript. g, Sequence alignment of Transib transposases, vertebrate RAG1 and deuterostome invertebrate RAG1L proteins. Residue numbers and secondary structure annotation are for HzTransib. The α9-α10 loop in HzTransib is highlighted in green. Species name abbreviations are defined in the legend of Extended Data Fig. 7g.
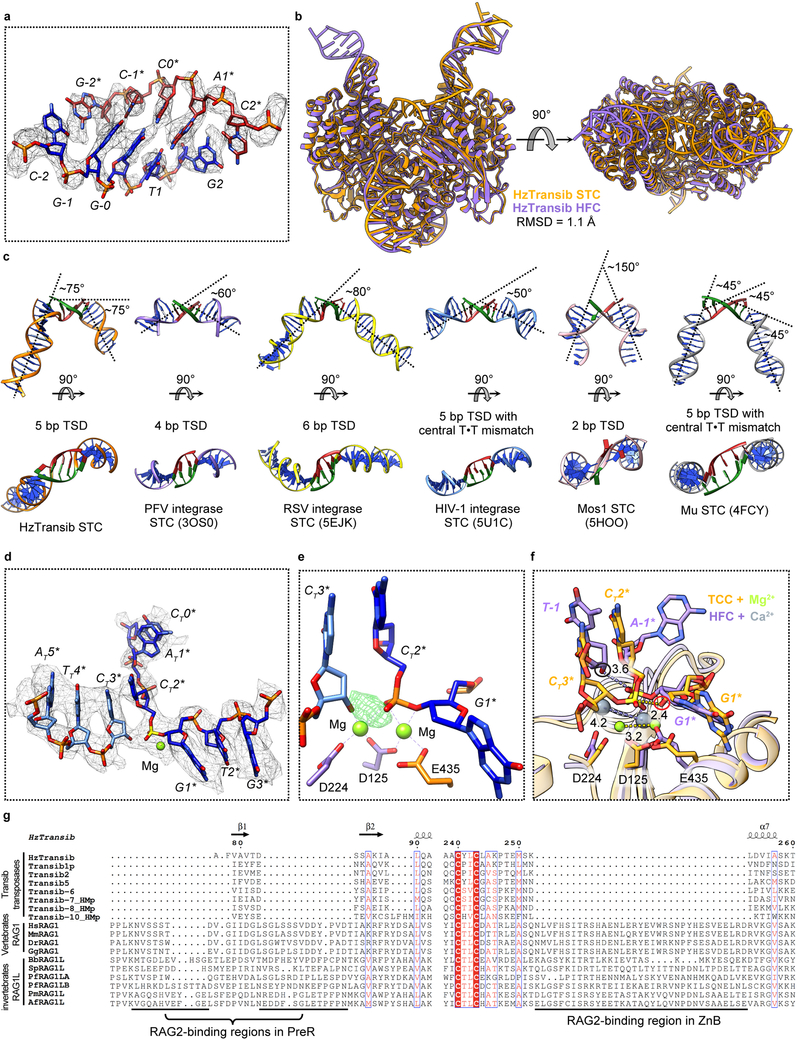
The STC structure reveals that engagement of target DNA triggers active site reassembly driven by rotational closure of the ZnB domains, which now enfold target DNA in much the same manner that they previously bound flanking DNA in the HFC (Fig. 3b, Extended Data Fig. 7b, and Supplementary Video 1). The α9-α10 loop has moved downward toward the RNH domain (Fig. 3c) and interacts extensively with target site DNA (Fig. 3d). Target site DNA exhibits sharp (~75°) bends one bp from each end, resulting in a ~150° overall directional change (Fig. 3b and Extended Data Fig. 7c). V328 fills the gaps left by the breaks in base stacking on the continuous strands, stabilizing the highly kinked DNA conformation (Fig. 3d).
HzTransib exhibits a 5’-CGNCG-3’ transposition target site consensus sequence and target sites almost always contain a 5’-YR-3’ dinucleotide step at one or both ends (Fig. 3e and Supplementary Table 1). This preference is likely due to the inherent deformability and reduced base-stacking of a pyrimidine-purine step28. Notably, HzTransib’s GC-rich target site DNA remains fully base-paired in the STC despite its highly distorted duplex structure.
A trifurcation of density observed at the transposon end-target DNA junction suggested that the cryo-EM map represented a mixture of HzTransib in complex with target DNA before (TCC) and after (STC) transposon end integration (Extended Data Fig. 7d). Indeed, calculation of the difference map between the cryo-EM reconstruction and the STC model suggested that a portion of the particles contain uncleaved target DNA (Extended Data Fig. 7e) and allowed modeling of intact target DNA in the cryo-EM density. In this TCC model, the active site captures two Mg2+ ions (Fig. 3f), while none are observed in the disassembled active site of the TEC (Fig. 2f). One non-bridging oxygen is hydrogen bonded with H274 (Fig. 3f). This histidine, which is conserved in several eukaryotic transposase superfamilies29,30, has been proposed to be a key component of a DDHE/D (as opposed to DDE/D) enzyme active site30, and our data are consistent with this proposal. The distances separating the scissile phosphate and the attacking oxygen and the two metal ions in the TCC model strongly argue that the active site could catalyze the strand transfer reaction31 (Extended Data Fig. 7f).
CTT helps drive HzTransib domain closure
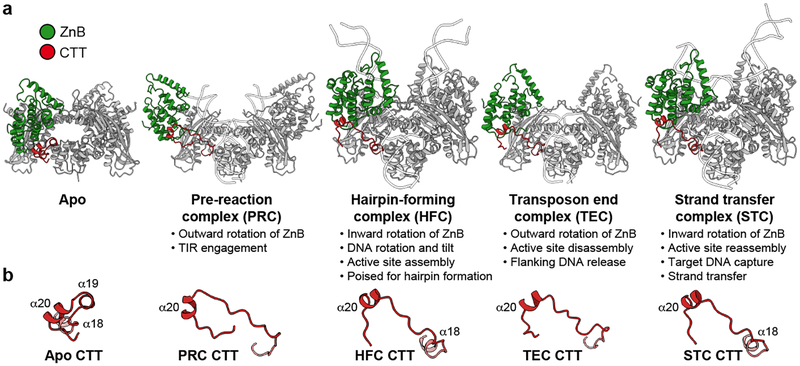
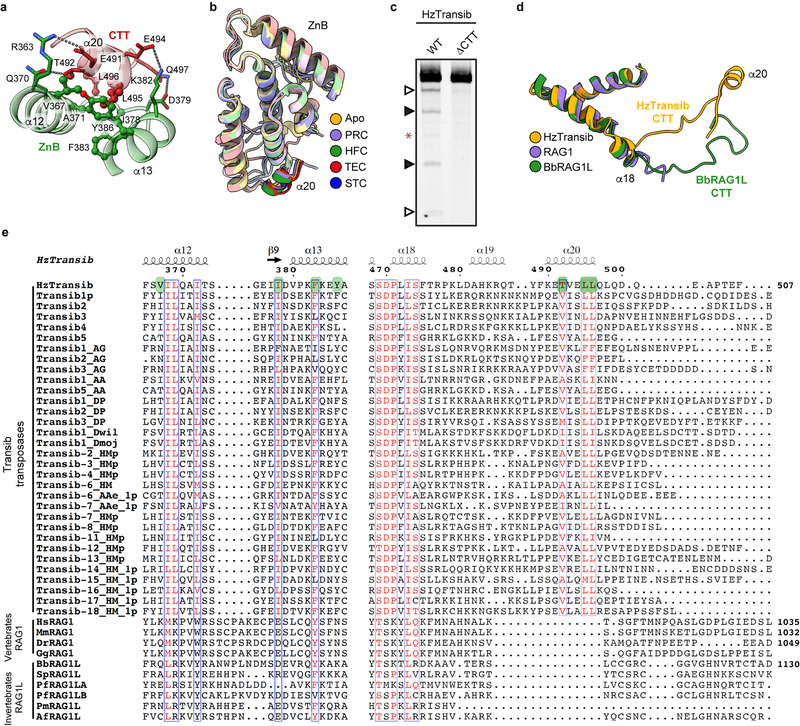
During HzTransib’s two cycles of opening and closing, CTT acts as an accordion-like element that extends and refolds in concert with the unfurling and furling of HzTransib’s “wings” (Fig. 4a, b and Supplementary Video 1). In apo-HzTransib, CTT is a compact bundle of three short helices, α18–α20 (Fig. 4b). α20 is anchored through interactions to α12 and α13 of ZnB and stays almost static relative to ZnB throughout the transposition cycle (Extended Data Fig. 8a, b). In contrast, α18 and α19 drastically alter their secondary structures during the structural gymnastics of HzTransib. The large rotation of ZnB that accompanies binding of intact TIR DNA dramatically elongates and deforms α18 and α19 (Fig. 4a, b). This CTT coil might help drive the inward movement of ZnB and closure of the HzTransib dimer in the subsequent PRC to HFC transition, during which α18 reforms (Fig. 4a, b). α18 becomes deformed again during HzTransib opening and flanking DNA release in the TEC and then reforms during HzTransib closure and target DNA engagement in the STC (Fig. 4a, b). α18 is particularly well conserved across Transib proteins and the hydrophobic residues that anchor α20 to ZnB also exhibit sequence conservation (Extended Data Fig. 8e). Hence, CTT is likely an ancient and functionally conserved component of many Transib transposases, and its deletion from HzTransib almost abolished DNA cleavage activity (Extended Data Fig. 8c).
Figure 4. HzTransib CTT conformational changes during transposition.
a, b, Side-by-side comparison of five HzTransib structures, with ZnB and CTT domains colored in green and red, respectively.
The C-terminal tails of jawed vertebrate RAG1 and invertebrate RAG1-like (RAG1L) proteins, including the BbRAG1L subunit of the ProtoRAG transposase from amphioxus32, show sequence similarity only with α18 of HzTransib CTT (Extended Data Fig. 8e) and are unlikely to perform functions similar to that of CTT. The RAG1 C-terminal tail is dispensable for activity, and the functionally-important BbRAG1L C-terminal tail interacts with TIR DNA downstream of the heptamer and not with ZnB, and shares no structural similarity with HzTransib CTT33 (Extended Data Fig. 8d). Hence, the CTT module of RAG1 family proteins has apparently been readily adapted during evolution to address different functional imperatives.
RAG2 acquisition and transposase evolution
The lack of structural information for Transib has made it difficult to explore the structural and functional implications of the acquisition of a RAG2-like subunit by RAG1 early in evolution. The absence of RAG2 is likely of particular relevance for the large domain excursions that characterize the HzTransib transposition reaction (Fig. 4a). The ZnB outward rotation that accompanies initial DNA binding in the PRC provides extensive access to DNA binding surfaces, thereby helping to compensate for the lack of stabilizing RAG2-flanking DNA interactions15,16. The subsequent dramatic domain closure that yields the HzTransib HFC creates ZnB-flanking DNA interactions (Extended Data Fig. 6m) that are contributed predominantly by RAG2 in the RAG HFC15,16. Inter-dimer interactions mediated by RAG2 stabilize the closed configuration of the RAG HFC15 and their absence might help explain the need for a unique CTT to help drive inward rotation during HzTransib HFC formation.
Perhaps most strikingly, the α9-α10 target site-interaction loop of HzTransib (Fig. 3c, d), a nearly ubiquitous feature of predicted Transib proteins, is lacking in RAG1 and invertebrate RAG1-like proteins predicted to have a RAG2-like partner (Fig. 3g). By stabilizing target DNA in the TCC and STC, the HzTransib target site interaction loop likely compensates for the absence of stabilizing RAG2-DNA interactions. We propose that acquisition of a RAG2-like gene by a Transib transposon to give rise to the first RAG1/RAG2 transposon2 set in motion two linked evolutionary processes in RAG1: acquisition of new RAG2 binding interfaces (Extended Data Fig. 5a and 7g) and loss of the target site interaction loop, which was now no longer needed for stabilization of target DNA.
The structure of the HzTransib STC reveals distinctive structural and mechanistic features of cut-and-paste transposition. The large overall target DNA distortion created by the deep binding pocket of HzTransib contrasts with the relatively mild target DNA bend and flat target DNA binding groove in retroviral integrases19–22 (Extended Data Fig. 7c). A second distinctive feature of HzTransib is the large protein conformational change that occurs during target DNA capture (Fig. 4a and Supplementary Video 1). In contrast, Mos123,24 and retroviral integrases19,21,34 adopt very similar structures before and after target DNA capture. Finally, the HzTransib STC structure helps explain multiple features of RAG-family transposition: the preferred 5 bp target site duplication length, GC-rich target sites5,10,13,32, target site hotspot sequence preferences13,35, and the ability of mismatches and other DNA distortions to stimulate transposition by RAG35,36.
Methods
No statistical methods were used to predetermine sample size. The experiments were not randomized, and investigators were not blinded to allocation during experiments and outcome assessment.
Cloning of HzTransib transposase and substrates.
The full length or an N-terminal truncated fragment (residues 17–507) of HzTransib transposase fused to a C-terminal His6 tag or an N-terminal maltose-binding protein (MBP) tag were cloned into pFastBac1 expression vector (ThermoFisher Scientific) between BamHI and HindIII restrictive sites. pB-5’/3’TIR, a derivative of pBR322 containing the TIR substrate for ProtoRAG transposases, was described previously33. To generate TIR substrate for HzTransib transposases, the ProtoRAG 5’TIR and 3’TIR of pB-5’/3’TIR were substituted by the first 51 bp and 50 bp of HzTransib transposon 5’TIR and 3’TIR, respectively, using In-Fusion cloning (Clontech). The PCR amplified and linearized HzTransib substrate contains a HzTransib 5’TIR and 3’TIR separated by 411 bp between their tips, 126 bp of DNA flanking 5’TIR and 276 bp of DNA flanking 3’TIR. The whole substrate was depleted of 5’-CAC-3’ sequence instances except for those contained in 5’TIR and 3’TIR regions.
Protein expression and purification.
MBP- or His6-tagged HzTransib transposase was expressed in Sf9 insect cells using the Bac-to-Bac Baculovirus Expression System according to the manufacturer’s protocol (ThermoFisher Scientific). Cells expression His6-tagged HzTransib transposase were re-suspended in lysis buffer (20 mM Tris-HCl, pH7.5, 500 mM NaCl, 1 mM dithiothreitol (DTT)) and lysed by six passes through an Emulsiflex C3 homogenizer (Avestin). Cell lysate was cleared by centrifugation at 40,000 r.p.m (~146,000 x g) using a Type 50.2 Ti rotor (Beckman Coulter) for 1 h at 4 °C and was mixed with pre-equilibrated Ni-NTA Agarose resin (Qiagen) for 2 h with continual rotation. The resin was loaded onto a gravity flow column, washed with 5x column volume (CV) of lysis buffer and protein eluted with 5x CV of elution buffer (20 mM Tris-HCl, pH7.5, 200 mM NaCl, 20 mM Imidazole, 1 mM DTT). The elute was further purified and buffer exchanged using a Superdex 200 Increase 10/300 GL size-exclusion chromatography column (GE Healthcare) in 20 mM Tris-HCl, pH 7.5, 200 mM NaCl and 1 mM Tris(2-carboxyethyl) phosphine hydrochloride (TCEP-HCl). Cells expression MBP-tagged HzTransib transposase were re-suspended in lysis buffer (20 mM Tris-HCl, pH7.5, 500 mM NaCl, 1 mM DTT) and purified using amylose resin (New England BioLabs) in 20 mM Tris-HCl, pH7.5, 200 mM NaCl, 1 mM DTT, followed by size-exclusion chromatography purification in 20 mM Tris-HCl, pH 7.5, 200 mM NaCl and 1 mM TCEP. Both forms of HzTransib protein are a dimer in solution and an active TIR-dependent nuclease (Extended Data Fig. 1).
Mutant HzTransib proteins with active site residue mutations or C-terminal tail (CTT) truncation (removal of residues 478–507) were fused to MBP tag and purified in the same way as MBP-tagged wild-type HzTransib transposase.
His6-tagged human HMGB1 with C-terminal truncation (residues 1–165) was expressed in E.coli BL21 (DE3) and purified as previously described15.
Sf9 cells were obtained from Thermo Fisher Scientific. Cells lines used were not authenticated or tested for mycoplasma contamination.
Crystallization and data collection.
Purified His6-tagged HzTransib transposase was concentrated to ~6.3 mg/ml and used in crystallization screening. HzTransib crystals were grown by sitting-drop vapor diffusion at 20°C in 100 mM HEPES, pH 7.0, 0.7–0.8 M NaH2PO4 and 0.75 M KH2PO4. Crystals were cryo-protected in crystallization solution supplemented with 17.5% glycerol and flash frozen in liquid nitrogen. Heavy atom derivatives of HzTransib crystals were prepared by soaking crystals in cryo-protection solution supplemented with 1 M NaBr for 2–5 min, 0.5 M NaI for 2–5 min, 2.5 mM K2OsCl6 for 2 h, 2.5 mM K2PtCl4 for 2 h, or 2.5 mM ethylmercury thiosalicylate (EMTS) for 2h. Data were collected at 100 K at beamline 24ID-E and 24ID-C of the Advanced Photon Source (APS) at Argonne National Laboratory. The dataset of the native crystal was collected at 0.9792 Å. The datasets for Br-, I-, Os-, Pt- and Hg-derivative crystals were collected at 0.9197 Å, 1.4586 Å, 1.1398 Å, 1.0718 Å and 1.0087 Å, respectively. All X-ray diffraction data were indexed, integrated and scaled with the XDS package37 (Extended Data Table 1).
Crystal structure determination and refinement.
Phases were determined with native crystal dataset and five heavy atom-derivative datasets by multiple isomorphous replacement with anomalous scattering (MIRAS) method. Heavy atom sites were identified using SHELXD38 and the structure was determined using AutoSol39. The initial model was built automatically using AutoBuild40 of PHENIX software package and manually rebuilt in COOT41. The model was refined in PHENIX42 with non-crystallographic symmetry (NCS) restraints. The final structure was refined to 3.0 Å with Rwork and Rfree of 22.0% and 27.7%, respectively. Due to poor electron densities, residues 17–20, 235–238, 247–264 and 502–507 were not included in the final model. The structure was validated with MolProbity43. 92.98% of residues are in the favoured regions of the Ramachandran plot, 6.47% in additional allowed regions, and 0.56% in the disallowed region.
HzTransib-TIR complex assembly.
24 bp intact TIR substrate was generated by annealing equimolar amounts of two complementary oligonucleotides: 5’-CTAGATCTCACGGTGGATCGAAAA-3’ and 5’- TTTTCGATCCACCGTG*AGATCTAG-3’ (heptamer sequence is underlined. * indicates a phosphorothioate bond introduced between the two nucleotide residues). 32 bp intact TIR substrate was generated by annealing equimolar amounts of the two oligonucleotides: 5’- GATCTGGCCTAGATCTCACGGTGGATCGAAAA-3’ and 5’-TTTTCGATCCACCGTGAGATCTAGGCCAGATC-3’. 32 bp nicked TIR substrate was generated by annealing equimolar amounts of the following three oligonucleotides: 5’-GATCTGGCCTAGATCT-3’, 5’-CACGGTGGATCGAAAA-3’ and 5’-TTTTCGATCCACCGTGAGATCTAGGCCAGATC-3’ (a phosphorothioate bond was introduced between the heptamer and flanking DNA on transferred strand for the nicked TIR substrates used in HzTransib-TIR complex reconstitution in the present of Mg2+). To reconstitute the HzTransib-intact TIR complex, purified MBP-tagged HzTransib was mixed with 24 bp intact TIR substrate and HMGB1 in a 1:2:2 molar ratio in the presence of Mg2+ at 4°C for 1 h, followed by size-exclusion chromatography purification in 20 mM Tris-HCl, pH 7.5, 50 mM KCl, 10 mM MgCl2, 1 mM TCEP. HzTransib-nicked TIR complex was reconstituted by mixing MBP-tagged HzTransib, 32 bp nicked TIR substrate and HMGB1 in a 1:2:2 molar ratio in the present of Mg2+ at 4°C or in the presence of Ca2+ at 30°C for 1 h, followed by size-exclusion chromatography purification. Catalytically active HzTransib-TIR complex was reconstituted by mixing MBP-tagged HzTransib with 32 bp intact TIR substrate and HMGB1 in a 1:2:2 molar ratio in the presence of Mg2+, and was allowed to react at 30°C for 50 min before being frozen on cryo-EM grids.
Cryo-EM sample preparation and data acquisition.
Purified HzTransib-TIR complex (3.5 μl at ~1.2 μM) was applied to freshly glow-discharged Quantifoil 300 mesh or 200 mesh holey carbon grids with R 1.2/1.3 hole pattern (Electron Microscopy Sciences). Grids were blotted for 5.5 s under 100% humidity and plunge-frozen in liquid nitrogen-cooled liquid ethane using a Vitrobot Mark IV (ThermoFisher Scientific). Cryo-EM datasets were collected on a Titan Krios G2 electron microscope (Yale University) operated at 300 kV equipped with a GIF Quantum LS imaging filter (Gatan, lnc.) and a K2 summit direct electron detector (Gatan, lnc.) in super-resolution mode. The image stacks were collected at a nominal magnification of 130,000x, corresponding to 0.525 Å per super-resolution pixel, at a dose rate of 7.0–7.5 e–/physical pixel/s. The total exposure time for each movie was 8 s, thus leading to a total accumulated dose of 50.8–54.4 e–/Å2, which was fractionated into 40 frames. All movies were recorded with a defocus ranging from −1.5 to −2.5 μm. The statistics of cryo-EM data acquisition are summarized in Extended Data Table 2.
Image processing.
Dose-fractionated super-resolution movies were binned over 2×2 pixels, yielding a pixel size of 1.05 Å, then subjected to motion correction and dose-weighting using MotionCorr244. The non-dose-weighted aligned images were used for contract transfer function estimation by CTFFIND-4.1.1045. The dose-weighted images were used for autopicking, classification and reconstruction. For HzTransib-TIR complex datasets, roughly 40,000 particles were automatically picked using a Laplacian-of-Gaussian blob detection in RELION-3.046, followed by a round of 2D classification to generate templates for a new round of autopicking. The newly autopicked particles were subjected to multiple rounds of 2D classification in RELION-3.0 to remove junk particles. Particles in good 2D classes were extracted for initial model generation in RELION-3.0. The initial model was low-pass filtered to 50 Å to serve as a starting reference for 3D auto-refinement in RELION-3.0 using all particles in good 2D classes. The signal corresponding to MBP regions was then subtract, followed by 3D classification with a mask encompassing the HzTransib transposases dimer plus TIRs DNA region. Good 3D classes were selected and iteratively refined to yield high-resolution maps in RELION-3.0 with either C1 or C2 symmetry. To improve the map quality and interpretability of the HzTransib ZnB domains in HzTransib-TIR PRC, the particles from good 3D class(es) were symmetry-expanded and subjected to masked 3D classification with residual signal subtraction focusing on the HzTransib ZnB domain using a previously published procedure47. All refinements followed the gold-standard procedure, in which two half datasets were refined independently. The overall resolution was estimated based on the Fourier shell correlation (FSC) cutoff at 0.143 between the two half-maps, after a soft mask was applied to mask out solvent region. The final maps were sharpened within RELION-3.0. Local resolution variation was estimated from the two half-maps using ResMap48.
Cryo-EM model building and refinement.
The crystal structure of HzTransib dimer was rigid-fitted into the HzTransib-TIR complexes cryo-EM maps in UCSF Chimera49. Due to large domain movements, the HzTransib ZnB domains were fitted separately from the other part of the structural model. The DNA fragments corresponding to heptamer plus the first 16 bp of coding flank from RAG-RSS PRC (PDB 6CIK) or HFC (PDB 5ZE0) structures were first fitted into HzTransib PRC or HFC cryo-EM map, respectively, and mutated to the input TIR sequence in COOT. The complex resulting from incubation of HzTransib with nicked TIR substrate at 4°C in the presence of Mg2+ adopted a catalytically incompetent conformation very similar to that of the HzTransib-intact TIR complex (Extended Data Fig. 6f). This complex is referred to as the PRC with nicked TIRs. For HzTransib STC structure, the modeling and sequence registers of the target DNA are based on the following observations. (1) The well-defined cryo-EM density for the target site suggests a 5’-YRRYR-3’ motif (Y stands for pyrimidine, R stands for purine) (Extended Data Fig. 7a), 5’-CGGTG-3’ is the only match throughout the entire sequence of the input TIR substrate DNA. (2) HzTransib prefers GC-rich target site for integration. In vitro transposition has shown that HzTransib can mediate transposon integration at target sites with an exact 5’-CGGTG-3’ sequence (Supplementary Table 1). (3) Reconstruction of HzTransib STC cryo-EM map without imposing C2 symmetry shows asymmetric DNA helix density at two flanking DNA-binding regions in the HzTransib dimer. The cryo-EM density for two flanking site DNA helices exhibits a 7–9 bp difference in length, which coincides with 18-bp and 9-bp flanking DNA on two sides of the 5’-CGGTG-3’ sequence in our TIR DNA substrate. By contrast, reconstructing the cryo-EM map of other HzTransib-TIR complexes without C2 symmetry results in a map with nearly perfect two-fold symmetry. (4) The sequence registers for target DNA in this model is also largely supported by the cryo-EM density features. The structural models were manually adjusted and rebuilt in COOT and refined using PHENIX real-space refinement with secondary structure restraints, rotamer restraints, Ramachandran restraints and NCS constraints (except for HzTransib-TIR STC, in which no NCS was applied). The final structures were validated with MolProbity. The final HFC and STC structures contain amino acid residues 21–500 of HzTransib and most TIR DNA nucleotides, except for the two most distal base-pairs of the transposon end-flanking DNA and 5’ end of target DNA. In PRC structures, residues 17–20, 131–141, 245–252 of HzTransib and the most distal base-pair of the transposon end-flanking DNA are not modeled due to poor density. The TEC model contains all 16 bp of transposon end DNA. HzTransib residues 17–20, 136–141, 245–265 are disordered and are not included in the final TEC model. No HMGB1 density was seen in any of the cryo-EM density maps, and thus was not included in the cryo-EM atomic models. All molecular representations were generated in UCSF Chimera and UCSF ChimeraX50. Sequence alignments were performed in Clustal Omega51 and displayed using the online server of Espript 3.052.
In vitro DNA cleavage assay.
Linear substrate DNA used in the cleavage experiments was generated by PCR using the pBR322-based vectors as template and purified by agarose gel electrophoresis. Wild-type or mutant HzTransib (300 nM final concentration), substrate DNA (final concentration 30 nM) were incubated in reaction buffer (25 mM MOPS, pH7.0, 50 mM KCl, 2 mM DTT, 5 mM MgCl2; 16 μl final reaction volume) at 30°C for 1 h. Reactions were stopped by adding 1.25 μl 2.5% SDS, 5 μl proteinase K (200 μg/ml) and 2 μl 0.5 M EDTA followed by incubation at 55°C for 3 h. Samples were briefly centrifuged and the supernatant mixed with 6 μl 5x high density TBE sample buffer (ThermoFisher Scientific) and loaded on a non-denaturing 1x Tris-borate-EDTA (TBE) buffered polyacrylamide gel (Bio-Rad or ThermoFisher Scientific). After 35 min electrophoresis at 160V, gels were stained with SYBR gold (ThermoFisher Scientific) in 1xTBE buffer for 1 h and imaged using a PharosFX Plus (Bio-Rad).
In vitro transposition assay.
Linear donor DNA with tetracycline-resistant gene was amplified by PCR using the pBR322-based vector as template and purified by agarose gel electrophoresis. 0.05 pmol donor DNA and 0.1 pmol pECFP-1 target plasmid were mixed with 150 ng wild-type HzTransib protein in reaction buffer (25 mM MOPS, pH7.0, 50 mM KCl, 2 mM DTT, 5 mM MgCl2) and incubated at 30°C for 1 h. After protease K digestion, DNA was ethanol-precipitated. 200 ng of DNA was transformed into electrocompetent MC1061 bacterial cells that were spread onto plates containing kanamycin or kanamycin + tetracycline + streptomycin (KTS)13. Plasmids from 54 colonies from KTS plates were sequenced to determine the integration location on the plasmid and target-site duplication (TSD) sequence. Sequence logo representing nucleotide frequencies of HzTransib TSD were generated and visualized with kpLogo web server53.
Data availability
Atomic coordinates of six HzTransib or HzTransib-TIR DNA complex structures have been deposited in PDB under accession number 6PQN (HzTransib Apo), 6PQR (HzTransib-intact TIR PRC), 6PQU (HzTransib-nicked TIR PRC), 6PQX (HzTransib-TIR HFC), 6PQY (HzTransib-TIR TEC) and 6PR5 (HzTransib-TIR STC). Five cryo-EM density maps of HzTransib complexed with different TIR DNA have been deposited in the Electron Microscopy Data Bank under accession number EMD-20452, EMD-20453, EMD-20455, EMD-20456, EMD-20457, respectively.
Extended Data
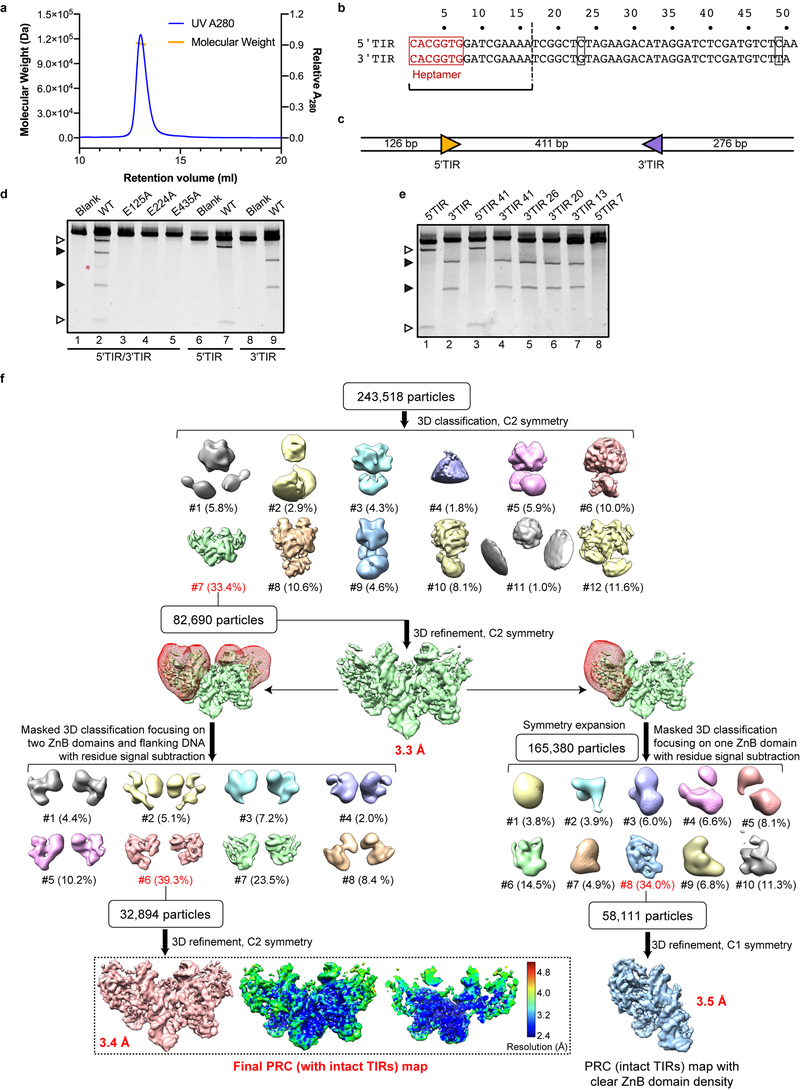
Extended Data Fig. 1. Biochemical characterization of HzTransib transposase and single-particle cryo-EM analysis of HzTransib in complex with intact TIR substrates.
a, Size-exclusion chromatography-multiple angle light scattering (SEC-MALS) analysis of purified HzTransib protein, indicating that it forms a dimer in solution. Size-exclusion chromatography was repeated three times and similar profiles were obtained. MALS experiment was not repeated. b, Numbering and sequence of endogenous left end (5’TIR) and right end (3’TIR) of the HzTransib transposon with nucleotide differences in black boxes. The first 16 bp of the TIR sequence are the same as the 16 bp transposon end of the TIR substrates used in structure determination. c, Schematic of the TIR substrate DNA used in the in vitro DNA cleavage assay. 5’TIR and 3’TIR are shown as yellow and purple triangles, respectively. d, Cleavage of DNA substrates bearing one or two TIRs by MBP-tagged wild-type or mutant HzTransib transposases, each with the N-terminal 16 amino acids removed. The experiment was repeated three times and similar results were obtained. For gel source data, see Supplementary Figure 1. e, Cleavage of DNA substrates bearing either full length (lanes 1 and 2) or truncated (lanes 3–8) 5’TIR or 3’TIR, with site of truncation indicated in the substrate name. The experiment was repeated three times and similar results were obtained. Open and closed arrowheads indicate single 5’TIR and single 3’TIR cleavage products, respectively. Red asterisk marks the double cleavage band. The DNA cleavage products were resolved in 5% Tris-borate-EDTA (TBE) polyacrylamide gels and stained with SYBR Gold. f, Flowchart of cryo-EM structure determination of HzTransib in complex with intact TIR substrates. After the first round of 3D classification, 3D auto-refinement using all of the particles in the best class generated a 3.3 Å map. Further 3D classifications focusing on either two ZnB plus flanking DNA regions or on one ZnB domain with symmetry expansion were used to obtain the final 3.4 Å map or a 3.5 Å map with clear ZnB domain density. All three maps were used for cross-references in model building. The final map and accompanying local resolution illustrations are enclosed in the dashed black box.
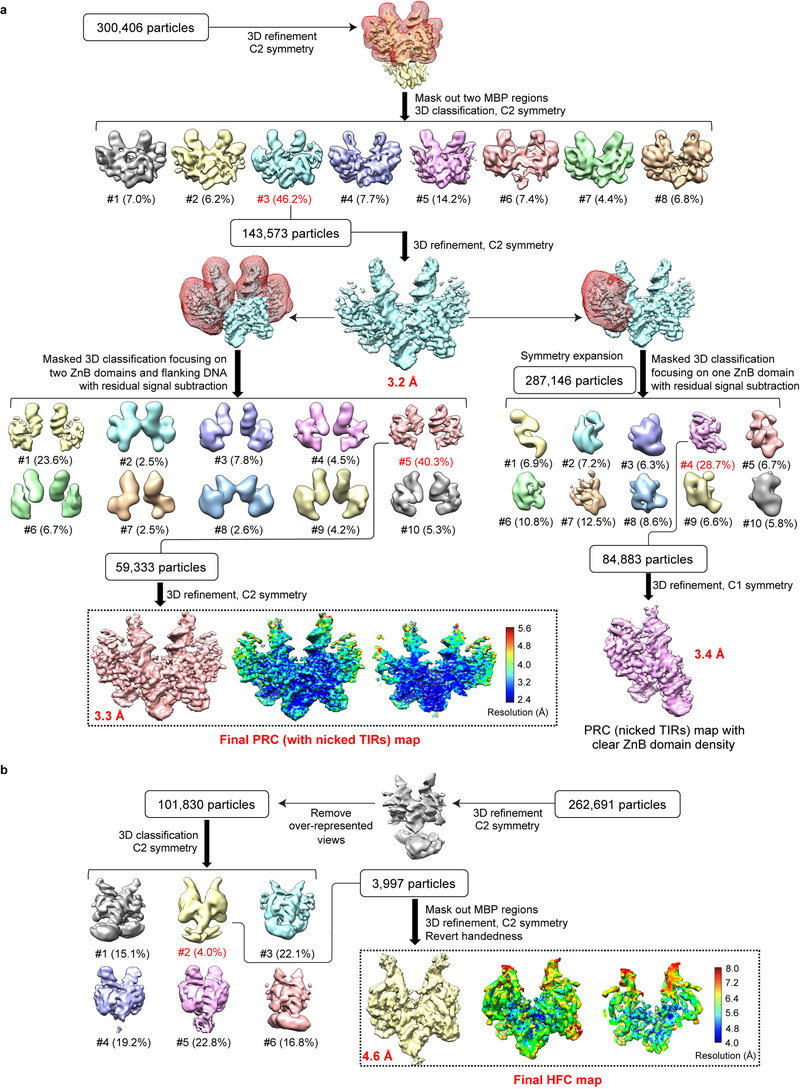
Extended Data Fig. 2. Single-particle cryo-EM analysis of HzTransib in complex with nicked TIR substrates.
a. Flow chart of cryo-EM image processing for HzTransib PRC with nicked TIR substrates. After the first round of 3D classification with two MBP regions masked, 3D auto-refinement using all of the particles in the best class generated a 3.2 Å map. Further 3D classifications focusing on either two ZnB plus flanking DNA regions or on one ZnB domain with symmetry expansion were used to obtain the final 3.3 Å map or a 3.4 Å map with clear ZnB domain density. All three maps were used for cross-references in model building. b. Flow chart of cryo-EM image processing for HzTransib HFC with nicked TIR substrates. After initial 3D auto-refinement, particles in the over-represented 2D classes were manually adjusted to alleviate the preferred particle orientation problem. Subsequent 3D classification and auto-refinement yielded a 4.6 Å map with even angular distribution. The final maps and accompanying local resolution illustrations are enclosed in the dashed black box.
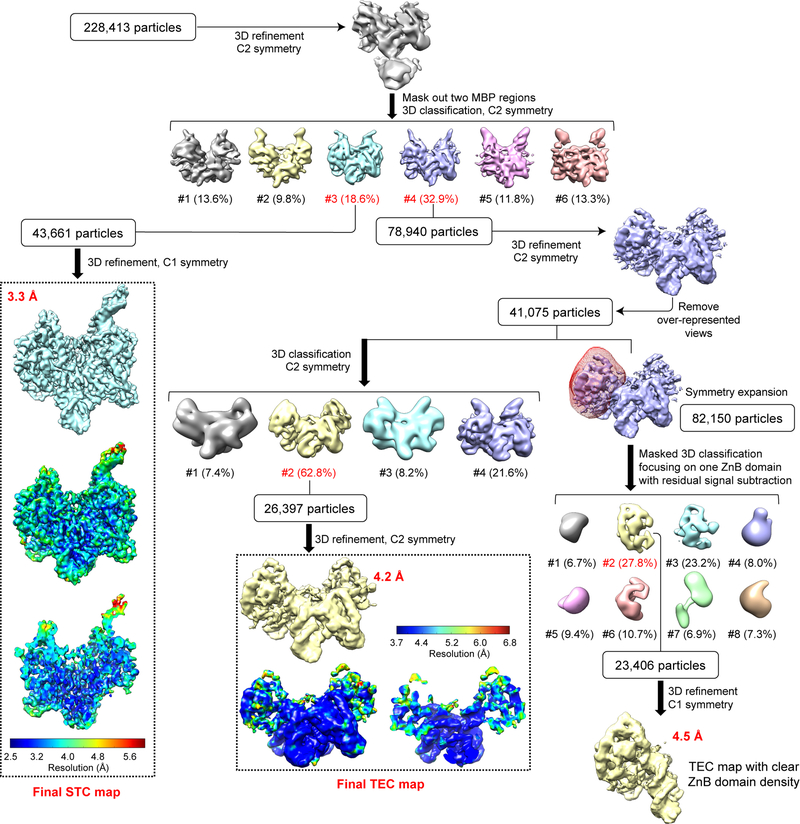
Extended Data Fig. 3. Single-particle cryo-EM analysis of HzTransib in complex with TIR substrates in reaction conditions that support catalysis.
Flow chart for HzTransib TEC and STC map reconstructions from HzTransib-intact TIR DNA complex prepared at 30°C in the presence of Mg2+. Different subsets of particle images were selected from different classification schemes to produce three refined cryo-EM maps: final STC map at 3.3 Å, final TEC map at 4.2 Å and a 4.5 Å map encompassing one HzTransib and TIR protomer in TEC with clear ZnB domain density. The two TEC maps were used for cross-references in model building. The final STC and TEC maps and accompanying local resolution illustrations are enclosed in the dashed black box.
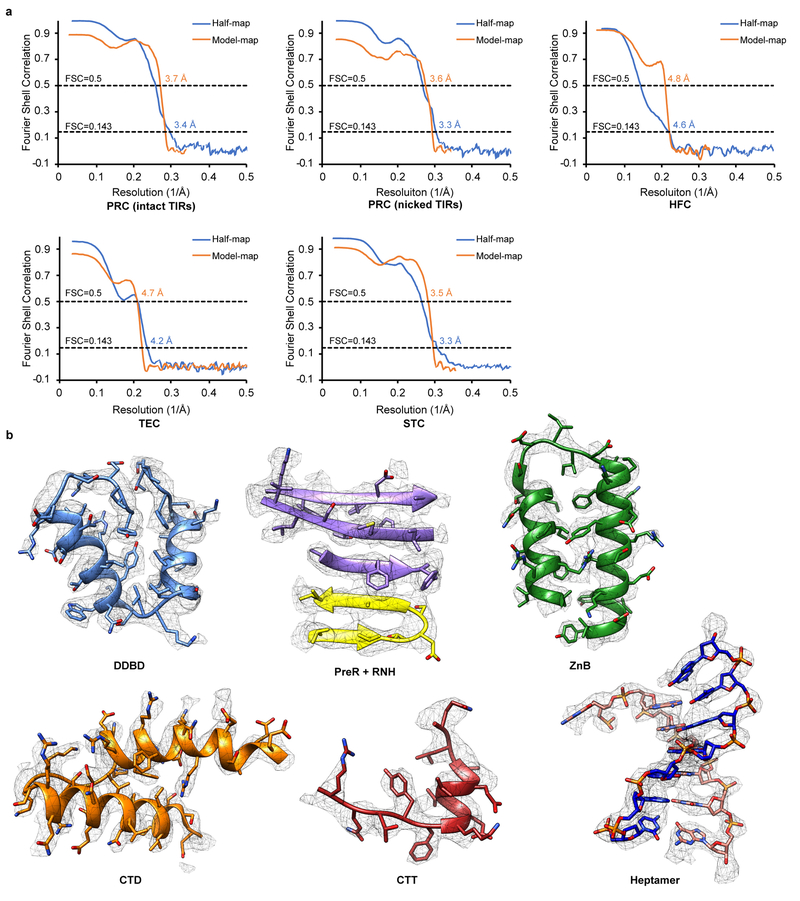
Extended Data Fig. 4. Validation of cryo-EM structural models.
a. Half-map FSC and model-map FSC curves of five cryo-EM maps from this study are generated from MolProbity. Gold-standard FSC curves between the two half maps with indicated resolution at FSC = 0.143 are in blue. FSC curves between the atomic model and the final map with indicated resolution at FSC = 0.5 are in orange. b. Cryo-EM densities superimposed with the atomic model for representative regions of HzTransib and TIR complexes.
Extended Data Fig. 5. Structural comparison of HzTransib with RAG1.
a. Superimposition of individual domains from HzTransib and RAG1 structures. Because the ZnC2 portion of the ZnB domain is missing from the HzTransib Apo structure, ZnB domain from HzTransib STC was used for structural superimposition. Three structural motifs in RAG1 that are responsible for RAG2 interactions are highlighted in red boxes. b, The front and top views of HzTransib and RAG1 dimer superimposed by their DDBD domains. c. Front and top view of the apo RAG1-RAG2 heterotetramer structure (PDB 4WWX)8.
Extended Data Fig. 6. TIR recognition in HzTransib PRC, HFC and TEC.
a, Superimposition of HzTransib dimer in PRC (dark colors) and apo (pale colors) structures by their DDBD illustrates the large conformational changes of ZnB domains (green in one subunit). b–e, TIR recognition in HzTransib PRC. b, Interactions between HzTransib CTT and the heptamer. Hydrogen bonds are shown as gray dotted lines. Labels for nucleotide residues are italic. c, Interactions between HzTransib and last three base pairs of heptamer. d, Interactions between HzTransib and transposon end DNA downstream of heptamer. e, Active site of HzTransib PRC structure. Distances between Mg2+ ion and scissile phosphate or E435 are indicated. f, The front and top views of two HzTransib PRC structures (incubated with either intact or nicked TIRs at 4°C) superimposed by their DDBD domains. The HzTransib nicked PRC complex is referred to as a PRC because of its strong structural resemblance to the intact DNA PRC. Depending on reaction conditions (temperature and divalent cation; see Methods), the nicked TIR substrate can be incorporated into either a nicked PRC or the HFC. g, Superimposition of HzTransib dimer in HFC and PRC structures by their DDBD shows the inward movements of ZnB domains and dimer closure. h–k, TIR recognition in HzTransib HFC. h, Interactions between HzTransib and the first three base pairs of heptamer. i, The first nucleotide of the heptamer (C1) is flipped out and buried in a pocket. j, Interactions between HzTransib α9-α10 loop and TIR at heptamer-flanking DNA junction. k, Active site of HzTransib HFC structure. l, Interactions between HzTransib and TIR flanking DNA in PRC. m, Interactions between HzTransib ZnB domain and TIR flanking DNA in HFC. n, Superimposition of HzTransib dimer in TEC and HFC structures by their DDBD shows the outward movements of ZnB domains. o, Comparison of transposon end DNA in TEC to that in HFC or in PRC. Mg2+ and Ca2+ ions are green and slate gray, respectively; other structure elements are colored as in Fig. 2b. Scissile phosphate in each structure is highlighted in yellow.
Extended Data Fig. 7. Validation and analysis of HzTransib STC structure.
a, Superimposition of 5 bp TSD region with the cryo-EM map contoured at 5.5 σ. b, Front and top views of HzTransib STC structure superimposed with HzTransib HFC structure. c, Comparison of target DNA from HzTransib, retrovirus integrases, Mos1 transposase and Mu transposase STC structures. Target site DNAs are shown as green and red. The approximate degree of bending in each target DNA is indicated. HzTransib is the only DDE/D-family transposase/integrase for which a STC structure has been reported that lacks a bend or base unpairing at the center of the target site DNA. Instead, HzTransib strongly bends target DNA near both edges of the target site DNA (between position −2 and −1, and position 1 and 2), leading to a total ~ 150° directional change of target DNA. Target DNAs in retroviral integrase STC structures exhibit relatively mild bends with one backbone kink at the center of target site DNA, regardless of its length (ranging from 4 bp in PFV integrase to 6 bp in RSV integrase). The sharp bending (~ 150°) at the center of the Mos1 target DNA is achieved by flipping of the adenines in the TA target site. The target DNA in Mu STC exhibits a more continuous bending pattern through the 5 bp target site DNA, with one bend before the target site (between position −3 and −2), one at the center, and one immediately after the target site DNA (between position 2 and 3). The central bend is facilitated by the T·T mismatch in the target site. d, Transposon end-target DNA junction region of the HzTransib STC model superimposed with cryo-EM map contoured at 5.5 σ. Nucleotide residues in target DNA are labeled with a “T” subscript. e. Difference density between the HzTransib STC cryo-EM map and the model showing the uncleaved target DNA phosphodiester bond in a portion of the particles used for cryo-EM map reconstruction. The difference map was contoured at 6 σ. f, Superimposition of HzTransib TCC (protein in orange and metal ions in green) active site with HzTransib HFC active site (protein in purple and metal ions in gray). Distances are in Å. Attacking oxygen atoms in HFC and TCC are highlighted in black and red circles, respectively. In TCC, the phosphorus is 2.4 Å from the attacking oxygen and the two metal ions are 3.2 Å apart. These distances are 3.6 Å and 4.2 Å in HFC. g, Sequence alignment of Transib transposases, vertebrate RAG1 and deuterostome invertebrate RAG1L proteins, showing the regions corresponding to three RAG2-binding interfaces in RAG1. Residue numbers are for HzTransib. Species name abbreviations used in this paper: Hs, Homo sapiens (human); Mm, Mus musculus (mouse); Dr, Danio rerio (zebrafish); Gg, Gallus gallus (chicken); Bb, Branchiostoma belcheri (amphioxus); Sp, Strongylocentrotus purpuratus (purple sea urchin); Pf, Ptychodera flava (acorn worm); Pm, Petromyzon marinus (sea lamprey); Af, Asterias forbesi (sea star).
Extended Data Fig. 8. Structural insights into the function and evolution of HzTransib CTT.
a, Interactions between HzTransib CTT α20 and ZnB domain α12-α13. Residues in CTT and ZnB are colored red and green, respectively. Residues involved in hydrophobic interactions are shown as ball-and-stick. b, Superimposition of ZnB domain (pale colors) together with CTT α20 (dark colors) from the structures representing five steps in transposition. c, Cleavage of DNA substrates bearing a 5’TIR/3’TIR pair by MBP-tagged wild-type or CTT truncated mutant HzTransib transposases, each with N-terminal 16 amino acids removed. The DNA cleavage products were resolved on a 6% Tris-borate-EDTA (TBE) polyacrylamide gel and stained with SYBR Gold. Open and closed arrowheads indicate single 5’TIR and single 3’TIR cleavage products, respectively. Red asterisk marks the double cleavage band. The experiment was repeated at least three times independently and similar results were obtained. For gel source data, see Supplementary Figure 1. d, Superimposition of HzTransib, RAG1 and BbRAG1L structures by the first two helices of their CTDs. HzTransib and BbRAG1L CTT extend from the structurally conserved CTD and point in different directions.
e, Sequence alignment of HzTransib CTT with vertebrate RAG1 CTT and deuterostome invertebrate RAG1L CTT showing highly divergent sequences among the three groups. Residues mediating the hydrophobic interactions between ZnB α12–α13 and CTT α20 are highlighted in green. Residue numbers and secondary structure elements at the top of the sequence alignment are for HzTransib. The residue number for the final aa in the sequence alignment is indicated for selected sequences.
Extended Data Table 1.
Statistics of crystal data collection, phasing and refinement
| HzTransib apo native (PDB 6PQN) | HzTransib apo Br derivative | HzTransib apo I derivative | HzTransib apo Os derivative | HzTransib apo Pt derivative | HzTransib apo Hg derivative | |
|---|---|---|---|---|---|---|
| Data collection | ||||||
| Space group | P6122 | P6122 | P6122 | P6122 | P6122 | P6122 |
| Cell dimensions | ||||||
| a, b, c (Å) | 160.292, | 159.315, | 159.797, | 160.238, | 160.912, | 160.353, |
| 160.292, | 159.315, | 159.797, | 160.238, | 160.912, | 160.353, | |
| 235.858 | 236.805 | 238.293 | 235.817 | 236.643 | 236.264 | |
| α, β, γ (°) | 90, 90, 120 | 90, 90, 120 | 90, 90, 120 | 90, 90, 120 | 90, 90, 120 | 90, 90, 120 |
| Resolution (Å) | 200.0–3.01 | 200.0–3.84 | 200.0–3.81 | 200.0–3.18 | 200.0–3.96 | 200.0–3.14 |
| (3.19–3.01)* | (4.30–3.84) | (4.17–3.81) | (3.35–3.18) | (4.42–3.96) | (3.31–3.14) | |
| Rsym or Rmerge | 0.086 (1.829) | 0.280 (3.748) | 0.196 (3.157) | 0.135 (3.403) | 0.141 (2.482) | 0.134 (3.983) |
| I/σI | 14.47 (0.75) | 21.46 (0.9) | 19.87 (1.2) | 21.18 (0.9) | 22.45 (1.1) | 21.4 (0.9) |
| Completeness (%) | 99.3 (99.3) | 99.7 (99.1) | 100.0 (99.8) | 100.0 (100.0) | 99.7 (99.1) | 99.8 (99.0) |
| Redundancy | 7.7 (7.6) | 12.7 (12.7) | 19.2(19.9) | 19.3 (19.1) | 12.7 (13.3) | 19.5 (20.0) |
| Refinement | ||||||
| Resolution (Å) | 80.15–3.01 | |||||
| (3.117–3.01) | ||||||
| No. reflections | 35894 (3455) | |||||
| Rwork / Rfree | 0.220/0.277 | |||||
| No. atoms | ||||||
| Protein | 7288 | |||||
| Ligand/ion | 83 | |||||
| Water | 28 | |||||
| B-factors | ||||||
| Protein | 147.85 | |||||
| Ligand/ion | 183.99 | |||||
| Water | 108.59 | |||||
| R.m.s deviations | ||||||
| Bond lengths (Å) | 0.004 | |||||
| Bond angles (°) | 0.77 |
One crystal was used for each dataset.
Values in parentheses are for highest-resolution shell.
Extended Data Table 2.
Statistics of cryo-EM data collection, refinement and validation
| PRC (intact TIR) (EMD-20452) (PDB 6PQR) | PRC (nicked TIR) (EMD-20453) (PDB 6PQU) | HFC (EMD-20455) (PDB 6PQX) | TEC (EMD-20456) (PDB 6PQY) | STC (EMD-20457) (PDB 6PR5) | |
|---|---|---|---|---|---|
| Data collection and processing | |||||
| Magnification | 130,000 | 130,000 | 130,000 | 130,000 | 130,000 |
| Voltage (kV) | 300 | 300 | 300 | 300 | 300 |
| Electron exposure (e−/Å2) | 50.8 | 52.2 | 52.2 | 54.4 | 54.4 |
| Defocus range (μm) | −1.5–−2.5 | −1.5–−2.5 | −1.5–−2.5 | −1.5–−2.5 | −1.5–−2.5 |
| Pixel size (Å) | 1.05 | 1.05 | 1.05 | 1.05 | 1.05 |
| Symmetry imposed | C2 | C2 | C2 | C2 | C1 |
| Initial particle images (no.) | 243,518 | 300,406 | 262,691 | 228,413 | 228,413 |
| Final particle images (no.) | 32,984 | 59,333 | 3,997 | 26,397 | 43,661 |
| Map resolution (Å) | 3.4 | 3.3 | 4.6 | 4.2 | 3.3 |
| FSC threshold | 0.143 | 0.143 | 0.143 | 0.143 | 0.143 |
| Map resolution range (Å) | 2.4–5.2 | 2.4–5.6 | 4.0–8.0 | 3.7–6.8 | 2.5–5.6 |
| Refinement | |||||
| Initial model used (PDB code) | 6PQN | 6PQN | 6PQN | 6PQN | 6PQN |
| Model resolution (Å) | 3.7 | 3.6 | 4.8 | 4.7 | 3.5 |
| FSC threshold | 0.5 | 0.5 | 0.5 | 0.5 | 0.5 |
| Model resolution range (Å) | 2.4–5.2 | 2.4–5.6 | 4.0–8.0 | 3.7–6.8 | 2.5–5.6 |
| Map sharpening B factor (Å2) | −90 | −90 | −126 | −120 | −90 |
| Model composition | |||||
| Non-hydrogen atoms | 9266 | 10004 | 10116 | 8690 | 10194 |
| Protein residues | 936 | 936 | 960 | 920 | 960 |
| Nucleotides | 88 | 124 | 120 | 64 | 124 |
| Ligands | 6 | 6 | 4 | 0 | 6 |
| B factors (Å2) | |||||
| Protein | 105.51 | 74.58 | 89.52 | 182.34 | 59.68 |
| Nucleic acid | 104.92 | 131.57 | 160.90 | 158.19 | 91.35 |
| Ligand | 109.58 | 93.13 | 81.45 | 69.54 | |
| R.m.s. deviations | |||||
| Bond lengths (Å) | 0.009 | 0.008 | 0.006 | 0.007 | 0.008 |
| Bond angles (°) | 0.830 | 0.890 | 0.984 | 0.980 | 0.768 |
| Validation | |||||
| MolProbity score | 1.91 | 2.04 | 2.39 | 2.35 | 1.64 |
| Clashscore | 16.01 | 23.12 | 16.06 | 24.55 | 13.64 |
| Poor rotamers (%) | 0.24 | 1.21 | 2.35 | 0.49 | 0.71 |
| Ramachandran plot | |||||
| Favored (%) | 96.74 | 97.39 | 94.14 | 92.51 | 98.33 |
| Allowed (%) | 3.26 | 2.39 | 5.23 | 6.83 | 1.36 |
| Disallowed (%) | 0 | 0.22 | 0.63 | 0.66 | 0.31 |
Supplementary Material
Acknowledgements
We thank W. Eliason for assistance with size-exclusion chromatography-multiple angle light scattering; K. Zhou for assistance in freezing the cryo-EM grids of HzTransib-intact TIR complex; S. Wu for help with cryo-EM data collection at Yale West Campus; the staff of the Advanced Photon Source beamlines 24-ID-C and 24-ID-E for technical assistance with X-ray crystallography data collection; N. Craig for critical reading of and many helpful comments on the manuscript. We are particularly grateful for Dr. Thomas Steitz’s advice, mentoring, and support during the early phases of this work; this paper is dedicated to his memory. This work was supported by NIH grant R01 AI137079 (D.G.S.), Yale University School of Medicine James Hudson Brown-Alexander Brown Coxe Postdoctoral Fellowship (C.L.), and NVIDIA GPU Grant Program (C.L. and Y.Y.).
Footnotes
Competing interests
The authors declare no competing interests.
References
- 1.Feschotte C & Pritham EJ DNA transposons and the evolution of eukaryotic genomes. Annu. Rev. Genet 41, 331–368, (2007). [DOI] [PMC free article] [PubMed] [Google Scholar]
- 2.Carmona LM & Schatz DG New insights into the evolutionary origins of the recombination-activating gene proteins and V(D)J recombination. FEBS J 284, 1590–1605, (2017). [DOI] [PMC free article] [PubMed] [Google Scholar]
- 3.Gellert M V(D)J recombination: RAG proteins, repair factors, and regulation. Annu. Rev. Biochem 71, 101–132, (2002). [DOI] [PubMed] [Google Scholar]
- 4.Chen S & Li X Molecular characterization of the first intact Transib transposon from Helicoverpa zea. Gene 408, 51–63, (2008). [DOI] [PubMed] [Google Scholar]
- 5.Hencken CG, Li X & Craig NL Functional characterization of an active Rag-like transposase. Nat. Struct. Mol. Biol 19, 834–836, (2012). [DOI] [PMC free article] [PubMed] [Google Scholar]
- 6.Craig NL A Moveable Feast: An Introduction to Mobile DNA in Mobile DNA III (eds Craig NL et al. ) 3–39 (ASM Press, 2015). [Google Scholar]
- 7.Montano SP & Rice PA Moving DNA around: DNA transposition and retroviral integration. Curr. Opin. Struct. Biol 21, 370–378, (2011). [DOI] [PMC free article] [PubMed] [Google Scholar]
- 8.Kim MS, Lapkouski M, Yang W & Gellert M Crystal structure of the V(D)J recombinase RAG1-RAG2. Nature 518, 507–511, (2015). [DOI] [PMC free article] [PubMed] [Google Scholar]
- 9.Schatz DG & Swanson PC V(D)J recombination: mechanisms of initiation. Annu. Rev. Genet 45, 167–202, (2011). [DOI] [PubMed] [Google Scholar]
- 10.Kapitonov VV & Jurka J RAG1 core and V(D)J recombination signal sequences were derived from Transib transposons. PLoS Biol 3, e181, (2005). [DOI] [PMC free article] [PubMed] [Google Scholar]
- 11.Zhou L et al. Transposition of hAT elements links transposable elements and V(D)J recombination. Nature 432, 995–1001, (2004). [DOI] [PubMed] [Google Scholar]
- 12.Hickman AB et al. Structural basis of hAT transposon end recognition by Hermes, an octameric DNA transposase from Musca domestica. Cell 158, 353–367, (2014). [DOI] [PMC free article] [PubMed] [Google Scholar]
- 13.Agrawal A, Eastman QM & Schatz DG Transposition mediated by RAG1 and RAG2 and its implications for the evolution of the immune system. Nature 394, 744–751, (1998). [DOI] [PubMed] [Google Scholar]
- 14.Hiom K, Melek M & Gellert M DNA transposition by the RAG1 and RAG2 proteins: a possible source of oncogenic translocations. Cell 94, 463–470, (1998). [DOI] [PubMed] [Google Scholar]
- 15.Ru H et al. Molecular Mechanism of V(D)J Recombination from Synaptic RAG1-RAG2 Complex Structures. Cell 163, 1138–1152, (2015). [DOI] [PMC free article] [PubMed] [Google Scholar]
- 16.Kim MS et al. Cracking the DNA Code for V(D)J Recombination. Mol. Cell 70, 358–370 e354, (2018). [DOI] [PMC free article] [PubMed] [Google Scholar]
- 17.Ru H et al. DNA melting initiates the RAG catalytic pathway. Nat. Struct. Mol. Biol 25, 732–742, (2018). [DOI] [PMC free article] [PubMed] [Google Scholar]
- 18.Montano SP, Pigli YZ & Rice PA The mu transpososome structure sheds light on DDE recombinase evolution. Nature 491, 413–417, (2012). [DOI] [PMC free article] [PubMed] [Google Scholar]
- 19.Maertens GN, Hare S & Cherepanov P The mechanism of retroviral integration from X-ray structures of its key intermediates. Nature 468, 326–329, (2010). [DOI] [PMC free article] [PubMed] [Google Scholar]
- 20.Yin Z et al. Crystal structure of the Rous sarcoma virus intasome. Nature 530, 362–366, (2016). [DOI] [PMC free article] [PubMed] [Google Scholar]
- 21.Ballandras-Colas A et al. A supramolecular assembly mediates lentiviral DNA integration. Science 355, 93–95, (2017). [DOI] [PMC free article] [PubMed] [Google Scholar]
- 22.Passos DO et al. Cryo-EM structures and atomic model of the HIV-1 strand transfer complex intasome. Science 355, 89–92, (2017). [DOI] [PMC free article] [PubMed] [Google Scholar]
- 23.Richardson JM, Colloms SD, Finnegan DJ & Walkinshaw MD Molecular architecture of the Mos1 paired-end complex: the structural basis of DNA transposition in a eukaryote. Cell 138, 1096–1108, (2009). [DOI] [PMC free article] [PubMed] [Google Scholar]
- 24.Morris ER, Grey H, McKenzie G, Jones AC & Richardson JM A bend, flip and trap mechanism for transposon integration. eLife 5, (2016). [DOI] [PMC free article] [PubMed] [Google Scholar]
- 25.Dawson A & Finnegan DJ Excision of the Drosophila mariner transposon Mos1. Comparison with bacterial transposition and V(D)J recombination. Mol. Cell 11, 225–235, (2003). [DOI] [PubMed] [Google Scholar]
- 26.Carmona LM, Fugmann SD & Schatz DG Collaboration of RAG2 with RAG1-like proteins during the evolution of V(D)J recombination. Genes Dev 30, 909–917, (2016). [DOI] [PMC free article] [PubMed] [Google Scholar]
- 27.Davies DR, Goryshin IY, Reznikoff WS & Rayment I Three-dimensional structure of the Tn5 synaptic complex transposition intermediate. Science 289, 77–85, (2000). [DOI] [PubMed] [Google Scholar]
- 28.Lankas F, Sponer J, Langowski J & Cheatham TE 3rd. DNA basepair step deformability inferred from molecular dynamics simulations. Biophys. J 85, 2872–2883, (2003). [DOI] [PMC free article] [PubMed] [Google Scholar]
- 29.Yuan YW & Wessler SR The catalytic domain of all eukaryotic cut-and-paste transposase superfamilies. Proc. Natl. Acad. Sci. USA 108, 7884–7889, (2011). [DOI] [PMC free article] [PubMed] [Google Scholar]
- 30.Hickman AB et al. Structural insights into the mechanism of double strand break formation by Hermes, a hAT family eukaryotic DNA transposase. Nucl. Acids Res 46, 10286–10301, (2018). [DOI] [PMC free article] [PubMed] [Google Scholar]
- 31.Yang W, Lee JY & Nowotny M Making and breaking nucleic acids: two-Mg2+-ion catalysis and substrate specificity. Mol. Cell 22, 5–13, (2006). [DOI] [PubMed] [Google Scholar]
- 32.Huang S et al. Discovery of an Active RAG Transposon Illuminates the Origins of V(D)J Recombination. Cell 166, 102–114, (2016). [DOI] [PMC free article] [PubMed] [Google Scholar]
- 33.Zhang Y et al. Transposon molecular domestication and the evolution of the RAG recombinase. Nature 569, 79–84, (2019). [DOI] [PMC free article] [PubMed] [Google Scholar]
- 34.Hare S, Gupta SS, Valkov E, Engelman A & Cherepanov P Retroviral intasome assembly and inhibition of DNA strand transfer. Nature 464, 232–236, (2010). [DOI] [PMC free article] [PubMed] [Google Scholar]
- 35.Tsai CL, Chatterji M & Schatz DG DNA mismatches and GC-rich motifs target transposition by the RAG1/RAG2 transposase. Nucl. Acids Res 31, 6180–6190, (2003). [DOI] [PMC free article] [PubMed] [Google Scholar]
- 36.Lee GS, Neiditch MB, Sinden RR & Roth DB Targeted transposition by the V(D)J recombinase. Mol. Cell Biol 22, 2068–2077, (2002). [DOI] [PMC free article] [PubMed] [Google Scholar]
- 37.Kabsch W Xds. Acta Crystallogr. D Biol. Crystallogr 66, 125–132, (2010). [DOI] [PMC free article] [PubMed] [Google Scholar]
- 38.Sheldrick GM A short history of SHELX. Acta Crystallogr A 64, 112–122, (2008). [DOI] [PubMed] [Google Scholar]
- 39.Terwilliger TC et al. Decision-making in structure solution using Bayesian estimates of map quality: the PHENIX AutoSol wizard. Acta Crystallogr D Biol Crystallogr 65, 582–601, (2009). [DOI] [PMC free article] [PubMed] [Google Scholar]
- 40.Terwilliger TC et al. Iterative model building, structure refinement and density modification with the PHENIX AutoBuild wizard. Acta Crystallogr D Biol Crystallogr 64, 61–69, (2008). [DOI] [PMC free article] [PubMed] [Google Scholar]
- 41.Emsley P, Lohkamp B, Scott WG & Cowtan K Features and development of Coot. Acta Crystallogr. D Biol. Crystallogr 66, 486–501, (2010). [DOI] [PMC free article] [PubMed] [Google Scholar]
- 42.Adams PD et al. PHENIX: a comprehensive Python-based system for macromolecular structure solution. Acta Crystallogr. D Biol. Crystallogr 66, 213–221, (2010). [DOI] [PMC free article] [PubMed] [Google Scholar]
- 43.Chen VB et al. MolProbity: all-atom structure validation for macromolecular crystallography. Acta Crystallogr. D Biol. Crystallogr 66, 12–21, (2010). [DOI] [PMC free article] [PubMed] [Google Scholar]
- 44.Zheng SQ et al. MotionCor2: anisotropic correction of beam-induced motion for improved cryo-electron microscopy. Nat. Methods 14, 331–332, (2017). [DOI] [PMC free article] [PubMed] [Google Scholar]
- 45.Rohou A & Grigorieff N CTFFIND4: Fast and accurate defocus estimation from electron micrographs. J Struct Biol 192, 216–221, (2015). [DOI] [PMC free article] [PubMed] [Google Scholar]
- 46.Zivanov J et al. New tools for automated high-resolution cryo-EM structure determination in RELION-3. Elife 7, (2018). [DOI] [PMC free article] [PubMed] [Google Scholar]
- 47.Bai XC, Rajendra E, Yang G, Shi Y & Scheres SH Sampling the conformational space of the catalytic subunit of human gamma-secretase. Elife 4, (2015). [DOI] [PMC free article] [PubMed] [Google Scholar]
- 48.Kucukelbir A, Sigworth FJ & Tagare HD Quantifying the local resolution of cryo-EM density maps. Nat. Methods 11, 63–65, (2014). [DOI] [PMC free article] [PubMed] [Google Scholar]
- 49.Pettersen EF et al. UCSF Chimera--a visualization system for exploratory research and analysis. J. Comput. Chem 25, 1605–1612, (2004). [DOI] [PubMed] [Google Scholar]
- 50.Goddard TD et al. UCSF ChimeraX: Meeting modern challenges in visualization and analysis. Protein Sci 27, 14–25, (2018). [DOI] [PMC free article] [PubMed] [Google Scholar]
- 51.Sievers F & Higgins DG Clustal omega. Curr Protoc Bioinformatics 48, 3 13 11–16, (2014). [DOI] [PubMed] [Google Scholar]
- 52.Robert X & Gouet P Deciphering key features in protein structures with the new ENDscript server. Nucleic Acids Res 42, W320–324, (2014). [DOI] [PMC free article] [PubMed] [Google Scholar]
- 53.Wu X & Bartel DP kpLogo: positional k-mer analysis reveals hidden specificity in biological sequences. Nucl. Acids Res 45, W534–W538, (2017). [DOI] [PMC free article] [PubMed] [Google Scholar]
Associated Data
This section collects any data citations, data availability statements, or supplementary materials included in this article.
Supplementary Materials
Data Availability Statement
Atomic coordinates of six HzTransib or HzTransib-TIR DNA complex structures have been deposited in PDB under accession number 6PQN (HzTransib Apo), 6PQR (HzTransib-intact TIR PRC), 6PQU (HzTransib-nicked TIR PRC), 6PQX (HzTransib-TIR HFC), 6PQY (HzTransib-TIR TEC) and 6PR5 (HzTransib-TIR STC). Five cryo-EM density maps of HzTransib complexed with different TIR DNA have been deposited in the Electron Microscopy Data Bank under accession number EMD-20452, EMD-20453, EMD-20455, EMD-20456, EMD-20457, respectively.


