Abstract
Purpose
With rapidly evolving treatment options in cancer, the complexity in the clinical decision-making process for oncologists represents a growing challenge magnified by oncologists’ disposition of intuition-based assessment of treatment risks and overall mortality. Given the unmet need for accurate prognostication with meaningful clinical rationale, we developed a highly interpretable prediction tool to identify patients with high mortality risk before the start of treatment regimens.
Methods
We obtained electronic health record data between 2004 and 2014 from a large national cancer center and extracted 401 predictors, including demographics, diagnosis, gene mutations, treatment history, comorbidities, resource utilization, vital signs, and laboratory test results. We built an actionable tool using novel developments in modern machine learning to predict 60-, 90- and 180-day mortality from the start of an anticancer regimen. The model was validated in unseen data against benchmark models.
Results
We identified 23,983 patients who initiated 46,646 anticancer treatment lines, with a median survival of 514 days. Our proposed prediction models achieved significantly higher estimation quality in unseen data (area under the curve, 0.83 to 0.86) compared with benchmark models. We identified key predictors of mortality, such as change in weight and albumin levels. The results are presented in an interactive and interpretable tool (www.oncomortality.com).
Conclusion
Our fully transparent prediction model was able to distinguish with high precision between highest- and lowest-risk patients. Given the rich data available in electronic health records and advances in machine learning methods, this tool can have significant implications for value-based shared decision making at the point of care and personalized goals-of-care management to catalyze practice reforms.
INTRODUCTION
With the growing nuances of cancer management, the calculus of data integration and clinical intuition over time complicates physicians’ decision-making capacities. Considering each new treatment line, especially within the context of noncurative-intent treatments, clinicians must account for potentially incremental benefits of a treatment against comprehensive mortality risk, given such factors as performance status, previous treatments, aggregate toxicities, and patients’ evolving goals of care across their disease trajectory. Factually, physicians overestimate prognosis in cancer,1,2 and patient preferences are sensitive to these estimates.3-5 Organizations, including the National Quality Forum and ASCO, have identified chemotherapy administration to patients with no clinical benefit as the most pervasive and superfluous practice in oncology.6,7 Indeed, unqualified treatment of progressive disease increases symptom burden, aggregate adverse events, and costly interventions that have little morbidity or mortality benefit.8-11
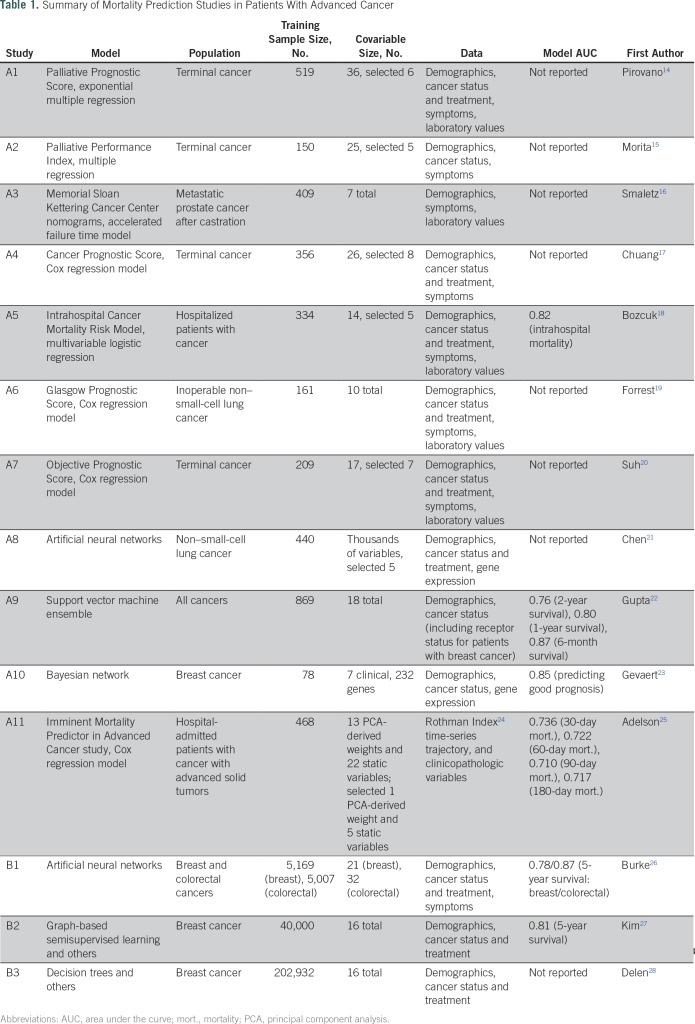
Mortality prediction is a keystone of clinical decision making. Table 1 lists key studies on mortality prediction in cancer.12,13 These studies fall under two broad categories. Studies A1-A11 predicted mortality using detailed patient information in relatively small patient cohorts. Studies B1-B3 used the large-scale SEER registry database with clinical characteristics at the time of diagnoses and treatments. Reported areas under the curve (AUC) range from 0.71 to 0.87. In recent years, some prediction models have been made accessible as online tools, which has allowed the results from prognostic research to be readily available for use at the point of care. Although such tools offer potential convenience to users, the underlying data and models limit the potential for higher prediction quality while maintaining interpretability. Most tools are based on cancer registry cohorts and are limited to a small number of characteristics at the time of diagnosis, overlooking critical information from clinical trajectories with implications for patients’ prognoses. Even with more detailed data sets, a tool interface requires learning accurate models with few variable inputs. Black-box models, such as artificial neural networks (B1) or gradient boosted trees that rely on large numbers of predictors, would not be suitable for such interactive tools. Furthermore, those methods offer little explanation to physicians regarding why such predictions were made. These practical points highlight critical concerns that explain the limited use of available prognostic tools in daily clinical workflows.
Table 1.
Summary of Mortality Prediction Studies in Patients With Advanced Cancer
In our study, we used patient electronic health record (EHR) data from a tertiary cancer center and a novel team-constructed algorithm to develop a predictive tool that estimates the probability of mortality for an individual patient being proposed their next treatment. The tool’s practical value lies in being:
Personalized: The tool uses EHR inputs for patients, their cancer, and the proposed treatment to output a mortality risk adjusted for these characteristics.
Clinically cogent: Physicians easily understand the reasoning behind the algorithm’s outputs through interpretable decision trees that illustrate key variable predictors.
Evidence and data driven: The tool is informed by over 23,000 patient records with ≥ 400 predictors drawn from demographics, comorbidities, treatments, laboratory values, and genomic results, and so on.
Actionable: Clinicians can compare between proposed treatments for a patient with respect to mortality risk estimates to make informed recommendations and decisions.
Validated and accurate: The accuracy and AUC in unseen patient data show encouraging results compared with competing approaches.
On the basis of novel machine learning: The methodology leverages two optimization algorithms developed by our team: (1) predictive classification trees,29 and (b) predictive statistical methods for missing data imputation.30
The following sections detail our approach to developing the predictive model and tool.
METHODS
Patients
We retrospectively obtained patient data from the EHR and linked Social Security Administration mortality data for patients at the Dana-Farber/Brigham and Women’s Cancer Center from 2004 through 2014. Study eligibility required that patients be at least 18 years old at cancer diagnosis and have received at least one anticancer treatment over the course of their care. The primary outcomes were mortality rates at 60, 90 and 180 days after initiation of an anticancer regimen, including chemotherapy, immunotherapy, and targeted therapy. If the patient’s date of death was missing and the last known date alive was before the cutoff, that patient’s record was censored for predicting that outcome. Each observation corresponded to a patient initiating an anticancer regimen, which was systematically recorded in the EHR.
Data
We considered 401 predictive features, including demographics, diagnoses, treatments, vital signs, laboratory results, and so on (Data Supplement). Missing values were imputed using the optimal-impute algorithm,30 which frames the imputation task as a family of optimization problems and solves directly. We chose this algorithm because the data had many key predictors that had a large number of observations missing, a scenario in which traditional methods, such as complete-case analysis and mean imputation, often give poor predictions in the end, whereas this algorithm had demonstrated significant improvement in downstream prediction tasks compared with classic methods. The quality of imputation was evaluated in a sensitivity analysis against alternative methods. We used treatment lines initiated from 2004 to 2011 as the training set and assessed each model’s predictive performance using those initiated from 2012 to 2014 as the validation set. The institutional review boards of Dana-Farber Cancer Institute/Partners Healthcare and the Massachusetts Institute of Technology approved this study.
Model and Tool Development
The mortality predictions are based on a novel decision tree algorithm, optimal classification trees.29 We selected decision trees for their advantage in interpretability, where the predictions are based on a few decision splits on variables of high importance. Such tree structures can readily model nonlinearities and interactions between variables. However, classic decision tree methods typically cannot achieve the same level of accuracy as their less interpretable counterparts, such as artificial neural networks and gradient boosted trees. To mitigate the trade-off between interpretability and prediction accuracy, we made use of the optimal classification trees algorithm that trains a single decision tree with state-of-the-art performance, achieving high accuracy without the need to sacrifice interpretability.
During the training process, we tuned the parameters to maximize performance on a separate holdout set to avoid overfitting. After training the model, for interpretation and verification, we generated the following: (1) a decision tree visualization, whereby experts could trace the algorithm’s logic and predict mortality risks to corroborate clinical relevance; and (2) feature importance scores, which provided an estimate of the relative importance of key variables in the mortality predictions.
We next built the interactive tool for physicians on the basis of the trained decision trees. The tool is made available as a Web-based application (www.oncomortality.com) in the format of a patient characteristics questionnaire. The clinician user has the option to select 60-, 90-, or 180-day mortality predictions and cancer types (all cancers, breast, lung, ovarian, and so on.).
The user is then prompted to answer a short series of adaptive questions corresponding to the decision splits in the trained decision tree, until the tool ultimately generates a predicted mortality risk specific to the patient at hand. Examples are provided in Results.
Performance Comparisons
We evaluated the performance of optimal classification trees in unseen patient data for the quality of mortality predictions. To demonstrate our improvement in prognostic quality, we sought to ideally compare our model against established prognostic studies on the same patient populations. For such comparisons, the outcome variables (short-term mortality) needed to be aligned, and the predictor variables from prior studies needed to be available. Unfortunately, among the identified studies, no such comparison could be conducted. As proxies, a variety of other machine learning models were trained and validated on the same set of data for comparisons (comparative models detailed in the Data Supplement). We report the prediction accuracy (number of correctly classified positive and negative samples over total samples) on the basis of a default 50% threshold and the positive predictive value (PPV), a clinically relevant measure, at a fixed sensitivity level of 0.6. For further assessment of the model at varying thresholds, we report the AUC for each model in addition to plotting the receiver operating characteristic curves and the PPV against sensitivity for various thresholds. The analyses were repeated for each of the three time horizons (60-, 90-, and 180-day mortality) and subgrouped by cancer type.
RESULTS
Patient and Treatment Characteristics
A total of 23,983 patients were selected in the cohort, spanning a spectrum of breast (26.7%), lung (14.9%), ovarian (7.7%), colorectal (5.9%), and other solid tumors and hematologic malignancies. Among those, 14,427 (60.2%) were in the training set and 9,556 (39.8%) were in the validation set. These patients initiated 46,646 total treatment lines; 2,619 (5.6%) of new treatment line starts were followed by the patient’s death within 60 days, and 44,027 (94.4%) were not. Baseline characteristics of groups are presented in the Data Supplement. Overall, new treatment lines that led to mortality were associated with more malignant cancers (eg, lung and pancreatic cancer) and heavier prior resource utilization. Patients in this group on average also had higher disease burden and staging, as well as a higher number of prescribed medications, inpatient/outpatient visits, and blood infusions. The treatment lines that led to mortality were also associated with more comorbid conditions, such as congestive heart failure, stroke, diabetes. Finally, the laboratory test results for those lines that led to mortality were often significantly worse than the ones that did not lead to mortality (lower weight and albumin, higher tumor markers, suppressed blood counts, and so on.). The median survival was 514 days for all patients.
Interpretable Tool on the Basis of Machine Learning
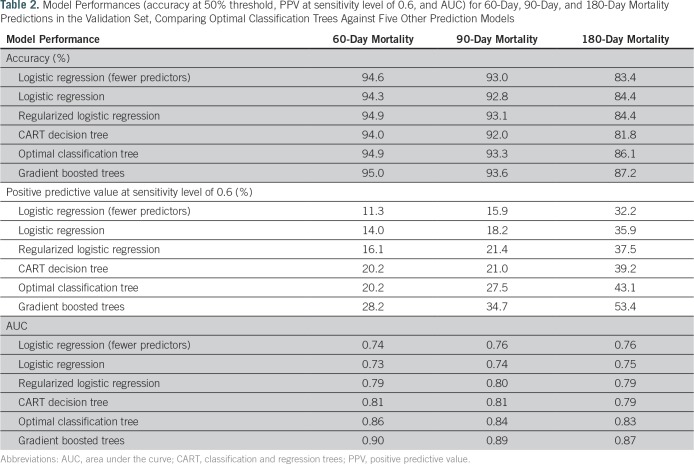
We trained the optimal classification trees to predict the 60-, 90-, and 180-day mortality. The model produced predictions with accuracies of 94.9%, 93.3%, and 86.1% at a 50% threshold, and AUCs of 0.86, 0.84, and 0.83, respectively. We further trained the model to predict the mortality for each subgroup of cancer sites, achieving similarly high estimation qualities, with AUCs ranging from 0.77 to 0.90 (Data Supplement).
On the basis of the prediction algorithm, we developed the tool, which is available online (screenshot depicted in Fig 1). Once the clinician enters the desired time horizon and cancer type, his or her answers to adaptive questions concludes with the tool output of a risk estimation. In this example, in response to the 60-day mortality risk for a patient with lung cancer, the tool adaptively prompts the clinician to input the percentage change in weight and the albumin levels. With these two input values, the tool presents a final risk for 60-day mortality of 46.79%.
Fig 1.
Screenshot of the cancer mortality prediction questionnaire. The clinician enters responses to a few questions regarding the patient’s medical history, many of which can be automatically populated via electronic health record integration, and the tool will immediately generate predictions. Available online at www.oncomortality.com.
Model Interpretation
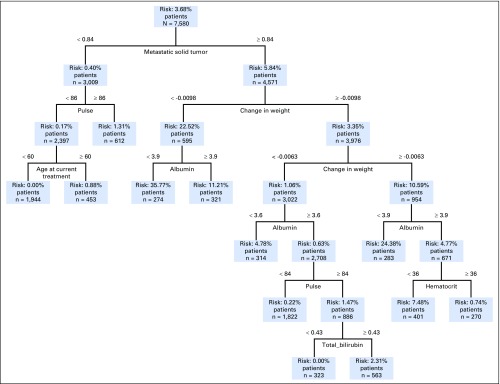
Each model trained with optimal classification trees presents a highly interpretable decision tree on which the tool is based. A tree stratifies patients into risk groups on the basis of values of a sequence of key variables, the selection of which is learned automatically by the model. As an example, Figure 2 presents the tree that predicts the 60-day mortality for patients with breast cancer. The total number of metastatic solid tumors is the first splitting variable, patients with few metastatic solid tumors (left of the tree), are placed into the lower-risk branch (0.4%) compared with the higher-risk one (5.84%). Within each branch, patients are further stratified on the basis of other variables. For example, in the lower-risk branch, if the pulse is above 86 beats per minute, the patient has a mortality risk of 1.31%; if the pulse is below 86 beats per minute, depending on the age (younger or older than 60 years), the risk is 0% and 0.88%, respectively. In the higher-risk branch, many of the decisions are based on change in weight, albumin, and other laboratory test results.
Fig 2.
Mortality prediction tree for patients with breast cancer for 60-day mortality. Patients are stratified on the basis of a sequence of variables and are eventually placed into a mortality risk bin.
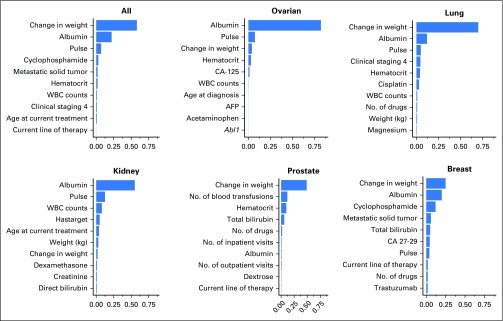
This model also produces feature importance rankings in mortality prediction (Fig 3). In tree-based models, the feature importance score measures the relative contribution of a particular feature in the model on the basis of the frequency this variable is selected for splitting and the improvement in model performance at each split; the score of all variables sum up to 1.29 Among all patients, percentage change in weight from a patient’s moving average over the past 90 days is the most important predictive feature of mortality (a more drastic decrease is associated with higher risk of mortality). Albumin level, pulse, WBC counts, total bilirubin, and weight were the next predictive variables.
Fig 3.
Feature importance in 60-day mortality prediction for patients (all cancer and by cancer sites). The importance score is based on the relative contribution to the model performance of each feature during the optimal classification trees training process. The 10 most important predictors are shown in this figure. Abl1, Abelson murine leukemia viral oncogene homolog 1 gene (ABL proto-oncogene 1); AFP, alpha-fetoprotein; CA, cancer antigen.
Although the feature importance does not demonstrate the interaction across predictive variables, the relationship was evidently characterized by the tree structure. As an example, the Data Supplement depicts a case where the change in weight interacts with albumin in the predictions of mortality.
Machine Learning Models Comparison of Performance
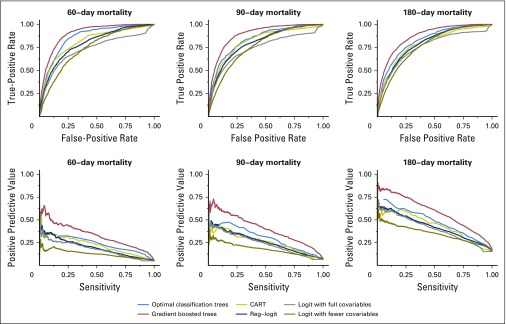
Among all the transparent machine learning models being compared against, optimal classification trees achieved the best performance in validation (Table 2). The only method that improves over optimal classification trees is the black-box method of gradient boosted trees. The receiver operating characteristic curves and PPV against sensitivity curves for each of the methods (Fig 4) both showed consistently strong predictive power across all thresholds at all time horizons. In the subgroup analyses, we found a similar performance for our method (detailed model comparison results and subgroup breakdowns provided in the Data Supplement).
Table 2.
Model Performances (accuracy at 50% threshold, PPV at sensitivity level of 0.6, and AUC) for 60-Day, 90-Day, and 180-Day Mortality Predictions in the Validation Set, Comparing Optimal Classification Trees Against Five Other Prediction Models
Fig 4.
Receiver operating characteristic curves and positive predictive value versus sensitivity plots for 60-day, 90-day, and 180-day mortality predictions, comparing the following methods: optimal classification trees, CART (classification and regression trees), logistic regression with fewer variables, logistic regression with all variables, regularized logistic regression, and gradient boosted trees.
DISCUSSION
Within the context of the growing momentum toward value-based health care delivery,6 we developed a clinically actionable prognostic tool for individual mortality prediction among patients with cancer before initiating a systemic treatment. Developed with the intent to augment physicians’ clinical decision making at the point of care, our tool necessarily accounts across the entirety of a patient’s cancer treatment journey to provide personalized prognostic insight. Moreover, such insight can address an unmet need by catalyzing the proper engagement of a physician, a patient, and his or her caregiver(s) in a personal, objectively assessed reflection on the implications of a proposed treatment in relation to the overall goals of care.
Our predictive tool uses novel machine learning methods to support the movement toward fully personalized, evidence-based treatment decisions. The prediction model’s accuracy draws from the combination of (1) a large cohort of general patients with cancer, (2) longitudinal EHR data that provide extensive and nuanced information compared with registry and claims data, (3) novel machine learning methods with high interpretability and state-of-the-art performance, and (4) curated clinical intuition and substantiated knowledge from experienced oncologists on the team that facilitated the model class selection and feature engineering process. The optimal classification trees model we used is fully transparent and interpretable, and produces highly accurate results. More importantly, decision trees closely resemble a human approach to decision making and, as a result, our machine learning–based approach to medical decision support is consistent with physicians’ mental process of identifying patterns from experience, but doing so using a much broader and more representative cohort of patient base. Because of the transparency and interpretability inherent in our model, as technology continues to develop and more data are collected, the model will improve while maintaining its resemblance to physicians’ decision-making processes.
Operationally, given the complexity of knowledge management in evolving precision oncology care practices,31we envision our tool’s adaptive information curation system seamlessly integrating with EHRs as a value-driven component of a chemotherapy-order-entry workflow to augment clinical decision making and informed consent. Because curated information is automatically populated from data repositories, physicians verify populated inputs and acknowledge mortality risk outputs transpiring within real time. On the back end, the novel optimal-impute30 method fulfills the necessary preprocessing characteristic of a nimble data platform that facilitates accurate results in the sensitive downstream tasks of mortality prediction and knowledge-based practices.31
The rich data constitute the other key reason for our high prediction quality. Because this study predicts mortality in a large population with available EHR data, we were able to study a much broader set of covariables than typical mortality prediction studies. We studied 401 covariables in total, including 289 variables encoding gene mutation results, 52 on recent treatments, and 18 on recent laboratory and vital test results. We acknowledge that because of the sparsity of data collection on gene mutation results, these variables were not selected by the models, but as more genomic data are collected consistently in the future, we believe these predictors will play a more important role and further improve the models. The longitudinal nature of the EHR data used in this study further enables the study of patient characteristics through time. For instance, we included the percentage change in weight from the 90-day moving average weight measurement, a predictor not used in previous mortality prediction work.
Performing head-to-head comparisons against existing prognostic studies and online tools is of interest. However, among identified short-term mortality studies, differences in patient populations and subjective clinical variables that our data do not contain make definitive comparison of results difficult. Nonetheless, the IMPAC (Imminent Mortality Predictor for Advanced Cancer)25 study’s comparative metrics of mortality prediction specifically within the hospital setting are notable for their improved accuracy, thereby highlighting potential predictive benefits to analyzing carefully curated patient cohorts and care episodes. Significantly, both studies achieve high levels of predictive performance that provide a benchmark for future studies across the cancer care continuum.
Our study has several limitations. As a single-institution retrospective study, it is subject to data selection and measurement biases. In addition, validation was performed using an internal data set, which underscores our plans to test prospectively in an external cohort. Looking forward, despite the continuing importance of chemotherapies in the cancer treatment arsenal, we already anticipate the need to refactor our model in light of novel drugs and changing treatment paradigms. Nonetheless, disparities in care resources and access to treatments persist in certain geodemographic and sociodemographic areas where our tool may hold relevance. Encouragingly, as precision-based molecular and genomic sequencing data are collected in more patients along the disease trajectory, our model and performance are expected to improve. To this end, the iterative process of the model’s learning, calibration, and validation is essential to its prognostic performance and continued relevance to clinical practice. Further prospective studies with this tool are being planned to demonstrate the clinical utility of this tool as part of a platform measuring the impact on informed consent engagement, mortality, and patient experience metrics, including hospital length of stay, earlier hospice enrollment, and quality of life.
In conclusion, we developed a clinically actionable tool for mortality prediction for patients with cancer initiating systemic therapy. Such capability leveraging machine learning, temporally nuanced data, and clinical expertise presents the opportunity for value capture at point of care.
Footnotes
Supported by funding from the Dana-Farber Cancer Institute (A.A.E.) and a National Science Foundation Predoctoral Fellowship (C.P.).
AUTHOR CONTRIBUTIONS
Conception and design: Dimitris Bertsimas, Alexander Weinstein, Aymen A. Elfiky
Financial support: Aymen A. Elfiky
Administrative support: Ying Daisy Zhuo
Collection and assembly of data: Ying Daisy Zhuo, Aymen A. Elfiky
Data analysis and interpretation: All authors
Manuscript writing: All authors
Final approval of manuscript: All authors
Accountable for all aspects of the work: All authors
AUTHORS' DISCLOSURES OF POTENTIAL CONFLICTS OF INTEREST
The following represents disclosure information provided by authors of this manuscript. All relationships are considered compensated. Relationships are self-held unless noted. I = Immediate Family Member, Inst = My Institution. Relationships may not relate to the subject matter of this manuscript. For more information about ASCO's conflict of interest policy, please refer to www.asco.org/rwc or ascopubs.org/jco/site/ifc.
Dimitris Bertsimas
No relationship to disclose
Jack Dunn
No relationship to disclose
Colin Pawlowski
No relationship to disclose
John Silberholz
No relationship to disclose
Alexander Weinstein
Employment: Celgene/Juno (I)
Stock and Other Ownership Interests: Celgene (I)
Ying Daisy Zhuo
No relationship to disclose
Eddy Chen
No relationship to disclose
Aymen A. Elfiky
No relationship to disclose
REFERENCES
- 1.Glare P, Virik K, Jones M, et al. : A systematic review of physicians’ survival predictions in terminally ill cancer patients. BMJ 327:195-198, 2003 [DOI] [PMC free article] [PubMed] [Google Scholar]
- 2.Stone PC, Lund S: Predicting prognosis in patients with advanced cancer. Ann Oncol 18:971-976, 2007 [DOI] [PubMed] [Google Scholar]
- 3.Brundage MD, Davidson JR, Mackillop WJ: Trading treatment toxicity for survival in locally advanced non-small cell lung cancer. J Clin Oncol 15:330-340, 1997 [DOI] [PubMed] [Google Scholar]
- 4.Silvestri G, Pritchard R, Welch HG: Preferences for chemotherapy in patients with advanced non-small cell lung cancer: Descriptive study based on scripted interviews. BMJ 317:771-775, 1998 [DOI] [PMC free article] [PubMed] [Google Scholar]
- 5.Hirose T, Yamaoka T, Ohnishi T, et al. : Patient willingness to undergo chemotherapy and thoracic radiotherapy for locally advanced non-small cell lung cancer. Psychooncology 18:483-489, 2009 [DOI] [PubMed] [Google Scholar]
- 6.Schnipper LE, Smith TJ, Raghavan D, et al. : American Society of Clinical Oncology identifies five key opportunities to improve care and reduce costs: The top five list for oncology. J Clin Oncol 30:1715-1724, 2012 [DOI] [PubMed] [Google Scholar]
- 7.National Quality Forum : Endorsement summary: Cancer measures. https://www.qualityforum.org/News_And_Resources/Endorsement_Summaries/Cancer_Measures_Endorsement_Summary.aspx
- 8.Wright AA, Zhang B, Keating NL, et al. : Associations between palliative chemotherapy and adult cancer patients’ end of life care and place of death: Prospective cohort study. BMJ 348:g1219, 2014 [DOI] [PMC free article] [PubMed] [Google Scholar]
- 9.de Gramont A, Figer A, Seymour M, et al. : Leucovorin and fluorouracil with or without oxaliplatin as first-line treatment in advanced colorectal cancer. J Clin Oncol 18:2938-2947, 2000 [DOI] [PubMed] [Google Scholar]
- 10.Emanuel EJ, Young-Xu Y, Levinsky NG, et al. : Chemotherapy use among Medicare beneficiaries at the end of life. Ann Intern Med 138:639-643, 2003 [DOI] [PubMed] [Google Scholar]
- 11.Greer JA, Pirl WF, Jackson VA, et al. : Effect of early palliative care on chemotherapy use and end-of-life care in patients with metastatic non-small-cell lung cancer. J Clin Oncol 30:394-400, 2012 [DOI] [PubMed] [Google Scholar]
- 12.Glare P, Sinclair C, Downing M, et al. : Predicting survival in patients with advanced disease. Eur J Cancer 44:1146-1156, 2008 [DOI] [PubMed] [Google Scholar]
- 13.Kourou K, Exarchos TP, Exarchos KP, et al. : Machine learning applications in cancer prognosis and prediction. Comput Struct Biotechnol J 13:8-17, 2014 [DOI] [PMC free article] [PubMed] [Google Scholar]
- 14.Pirovano M, Maltoni M, Nanni O, et al. : A new palliative prognostic score: A first step for the staging of terminally ill cancer patients. J Pain Symptom Manage 17:231-239, 1999 [DOI] [PubMed] [Google Scholar]
- 15.Morita T, Tsunoda J, Inoue S, et al. : Survival prediction of terminally ill cancer patients by clinical symptoms: Development of a simple indicator. Jpn J Clin Oncol 29:156-159, 1999 [DOI] [PubMed] [Google Scholar]
- 16.Smaletz O, Scher HI, Small EJ, et al. : Nomogram for overall survival of patients with progressive metastatic prostate cancer after castration. J Clin Oncol 20:3972-3982, 2002 [DOI] [PubMed] [Google Scholar]
- 17.Chuang RB, Hu WY, Chiu TY, et al. : Prediction of survival in terminal cancer patients in Taiwan: Constructing a prognostic scale. J Pain Symptom Manage 28:115-122, 2004 [DOI] [PubMed] [Google Scholar]
- 18.Bozcuk H, Koyuncu E, Yildiz M, et al. : A simple and accurate prediction model to estimate the intrahospital mortality risk of hospitalised cancer patients. Int J Clin Pract 58:1014-1019, 2004 [DOI] [PubMed] [Google Scholar]
- 19.Forrest LM, McMillan DC, McArdle CS, et al. : Evaluation of cumulative prognostic scores based on the systemic inflammatory response in patients with inoperable non-small-cell lung cancer. Br J Cancer 89:1028-1030, 2003 [DOI] [PMC free article] [PubMed] [Google Scholar]
- 20.Suh SY, Choi YS, Shim JY, et al. : Construction of a new, objective prognostic score for terminally ill cancer patients: A multicenter study. Support Care Cancer 18:151-157, 2010 [DOI] [PubMed] [Google Scholar]
- 21.Chen YC, Ke WC, Chiu HW: Risk classification of cancer survival using ANN with gene expression data from multiple laboratories. Comput Biol Med 48:1-7, 2014 [DOI] [PubMed] [Google Scholar]
- 22.Gupta S, Tran T, Luo W, et al. : Machine-learning prediction of cancer survival: A retrospective study using electronic administrative records and a cancer registry. BMJ Open 4:e004007, 2014 [DOI] [PMC free article] [PubMed] [Google Scholar]
- 23.Gevaert O, De Smet F, Timmerman D, et al. : Predicting the prognosis of breast cancer by integrating clinical and microarray data with Bayesian networks. Bioinformatics 22:e184-e190, 2006 [DOI] [PubMed] [Google Scholar]
- 24.Rothman MJ, Rothman SI, Beals J, IV: Development and validation of a continuous measure of patient condition using the electronic medical record. J Biomed Inform 46:837-848, 2013 [DOI] [PubMed] [Google Scholar]
- 25.Adelson K, Lee DKK, Velji S, et al. : Development of Imminent Mortality Predictor for Advanced Cancer (IMPAC), a tool to predict short-term mortality in hospitalized patients with advanced cancer. J Oncol Pract 14:e168-e175, 2018 [DOI] [PubMed] [Google Scholar]
- 26.Burke HB, Goodman PH, Rosen DB, et al. : Artificial neural networks improve the accuracy of cancer survival prediction. Cancer 79:857-862, 1997 [DOI] [PubMed] [Google Scholar]
- 27.Kim J, Shin H: Breast cancer survivability prediction using labeled, unlabeled, and pseudo-labeled patient data. J Am Med Inform Assoc 20:613-618, 2013 [DOI] [PMC free article] [PubMed] [Google Scholar]
- 28.Delen D, Walker G, Kadam A: Predicting breast cancer survivability: A comparison of three data mining methods. Artif Intell Med 34:113-127, 2005 [DOI] [PubMed] [Google Scholar]
- 29.Bertsimas D, Dunn J: Optimal classification trees. Mach Learn 106:1039-1082, 2017 [Google Scholar]
- 30.Bertsimas D, Pawlowski C, Zhuo YD. From predictive methods to missing data imputation: An optimization approach. J Mach Learn Res (in press) [Google Scholar]
- 31.Elfiky A, Zhang D, Krishnan Nair HK: Practice innovation: The need for nimble data platforms to implement precision oncology care. Discov Med 20:27-32, 2015 [PubMed] [Google Scholar]


