Abstract
Objectives
The aim of the study was to evaluate the CT features of adrenal tumors in an effort to identify features specific to pheochromocytomas and second, to define a feasible probability calculation model.
Methods
This multicentric retrospective study included patients from the period 2003 to 2017 with an appropriate CT examination and a histological diagnosis of an adrenal adenoma, pheochromocytoma, adrenocortical carcinoma, or metastasis. In total, 346 patients were suitable for the CT image analysis, which included evaluation of the largest diameter, the shape of the lesion, the presence of central necrosis and its margins, and the presence of anenhancing peripheral rim (“ring sign”).
Results
Pheochromocytomas have a significantly more spherical shape (P<0.001), whereas an elliptical shape significantly reduces the probability of a pheochromocytoma (odds ratio = 0.015), as does another shape (odds ratio = 0.006). A “ring sign” is also more frequent in pheochromocytomas compared to other adrenal tumors (P=0.001, odds ratio = 6.49).
A sharp necrosis also increases the probability of a pheochromocytoma more than unsharp necrosis (odds ratio 231.6 vs. 20.2). The probability calculation model created on the basis of the results confirms a high sensitivity and specificity (80% and 95%).
Conclusion
This study confirms the value of anatomical features in the assessment of adrenal masses with the ability to significantly improve the identification of pheochromocytomas. Advanced assessment of the tumor shape was defined and a original comprehensive calculating tool of the pheochromocytoma probability was created on the basis of the results presented here and could be used in clinical routine.
Keywords: Helical Computed Tomography, Adrenocortical Adenoma, Pheochromocytoma, Adrenocortical Carcinoma, Metastasis
Brief summary
This was a multicenter international study, to identify typical CT characteristics of an uncommon adrenal tumour-pheochromocytoma. We created and tested a mathematical model to determine the shape of lesions that can be used in anatomical imaging. We found that pheochromocytomas typically present as spherical in shape, with a sharp, central necrosis and “ring sign” compared to other adrenal tumors. We created a simple imaging tool, which will be freely available on the Internet, to calculate the probability of a pheochromocytoma on the basis of selected imaging features.
Introduction
Incidentally discovered adrenal masses represent an emerging clinical problem because of the overall increasing use of CT in diagnostic procedures. Computed tomography (CT) scanning is also able to determine the biological nature of the most frequent adrenal pathologies, including their morphological differentiation. The most accepted imaging characteristic that distinguishes a benign from a malignant lesion is the mean attenuation on non-contrast scans measured in Hounsfield units (HU). Unenhanced attenuation of adenomas is low because of the higher content of lipids in the cytoplasm, whereas the attenuation of metastases, adrenocortical carcinomas, and pheochromocytomas is higher since the occurrence of lipids in these lesions is rare. Unenhanced attenuation of ≤ 10 HU is generally recognized as the cut-off value between adrenal adenomas and non-adenomas1–3. Approximately 30% of adenomas, however, have a mean attenuation higher than 10 HU (ref.4,5). In such cases, it is impossible to reliably distinguish a lipid-poor adenoma from a pheochromocytoma, adrenocortical carcinoma, or metastasis by means of unenhanced attenuation.
Many efforts have been made to further evaluate the nature of undetermined adrenal lesions using various imaging modalities, but with questionable outcome6–14. A correct diagnosis is especially important in pheochromocytomas15,16 and adrenocortical carcinomas17,18 since hormonal activity or early metastatic spread, respectively, can lead to significant morbidity and mortality19–21. Although some studies considered the appearance of pheochromocytomas rather unspecific22–25, we hypothesized that some anatomic parameters of pheochromocytomas are different from those of other adrenal masses.
Thus, the aim of the present study was to evaluate CT examinations in patients with resected adrenal tumors and find out whether predefined anatomic features (i.e., size, shape, margin, and the presence of necrosis and the “ring sign”) could distinguish pheochromocytomas from other adrenal tumors. In the next step we attempted to define a dedicated mathematical model for the calculation of the probability of a pheochromocytoma according to the results of the analysis of CT features. This would also represent a real benefit for routine diagnostic procedures.
Materials and methods
Study design and patient selection
A retrospective multicenter study was organized in cooperation with eight institutions. Lists of patients who underwent andrenalectomy as a result of CT examination in the time period from 2003 to 2017 were collected and assessed according to predefined criteria.
The inclusion criteria were: 1) a pre-operative CT scan including both unenhanced and contrast-enhanced phase; 2) a final histological result of an adenoma, an adrenocortical carcinoma, a pheochromocytoma, or an adrenal metastasis. The exclusion criteria were: 1) a lesion with a mean unenhanced attenuation of 10 HU and less; 2) non-optimal image quality.
The study was approved by the Ethics Committee, and obtaining informed consent retrospectively was not required. The data from all the centers were anonymized.
CT data selection and analysis
The CT data were obtained with scanners from multiple vendors using different scan protocols. All the scans performed with a collimation of 1.5 mm or less and image series with a slice width of 1.5 mm or less were used for the image analysis.
The image analysis was performed using dedicated workstations (GE workstation) separately by two experienced radiologists (with eight and fifteen years experience), who were blinded to the definite histological diagnosis. Their results were compared, the concordant results were declared as definitive, and in the event of a discrepancy re-evaluation in consensus was performed. All the measurements were performed using multiplanar reformations with a 3–5-mm slice width.
Size and mean attenuation
The maximum diameter and two perpendicular diameters were measured. The mean attenuation was measured by drawing a circular region of interest inside a lesion to cover as large an area as possible, with the exclusion of peripheral parts of the lesion to avoid any artificial partial volume effect of the surrounding tissues.
Margin
Two types of lesion margin were defined – smooth and irregular. A lesion with a smooth margin was considered to be an expansion with a clearly defined sharp border with surrounding fatty tissue or adjacent organs visible over the entire surface of the tumor. A lesion with an irregular margin was considered when the surface was partly or entirely ill-defined with regard to the adjacent retroperitoneal fat with a spiculated rim.
Central necrosis
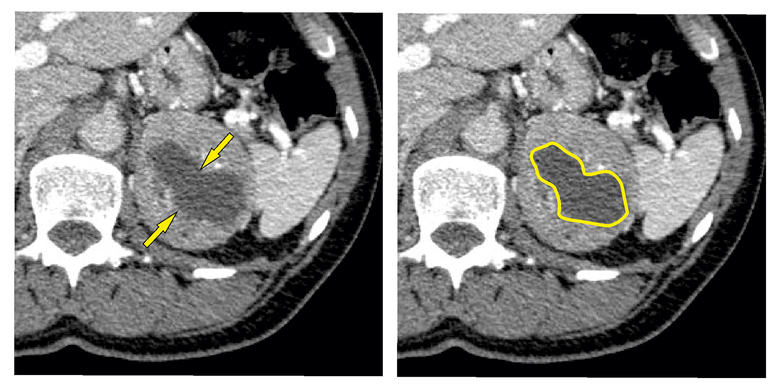
A central necrosis was defined as a hypodense area with a mean attenuation of 0–20 HU in the center of a lesion that increased its attenuation by less than 10 HU after the intravenous application of a contrast agent. The character of the necrosis was also assessed – sharp or unsharp. A sharp necrosis was presented with an explicit border between necrotic and vital tissue, i.e., the reviewers were able to clearly define the border between necrotic and non-necrotic tissue, so that, for simple use in practice, the necrosis can be defined by an uninterrupted closed line (Figure 1).
Fig. 1. Sharp necrosis.
The arrows point to the borders of the sharp necrosis. The uninterrupted closed line defines the borders of the sharp necrosis.
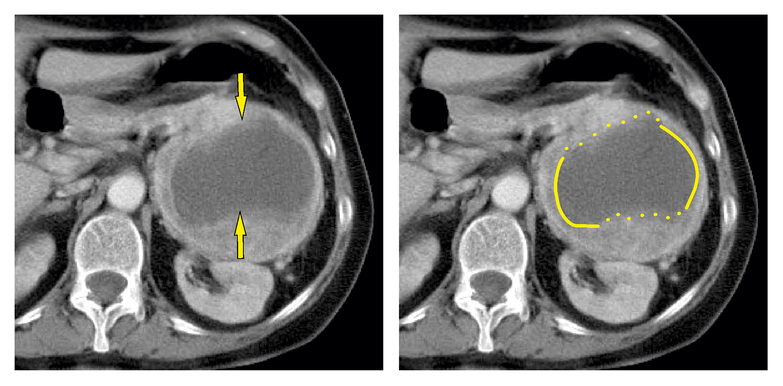
An unsharp necrosis was presented as poorly defined and with a blurry margin, i.e., there was a gradual transition of density between necrotic and vital tissue. For simple use in practice, the necrotic part cannot be defined by an uninterrupted closed line (Figure 2).
Fig. 2. Unsharp necrosis.
The arrows point to the irregular borders. The uninterrupted closed line defines the borders of the sharp necrosis. The interrupted line defines the borders of the unsharp necrosis.
Peripheral rim enhancement – the “ring sign”
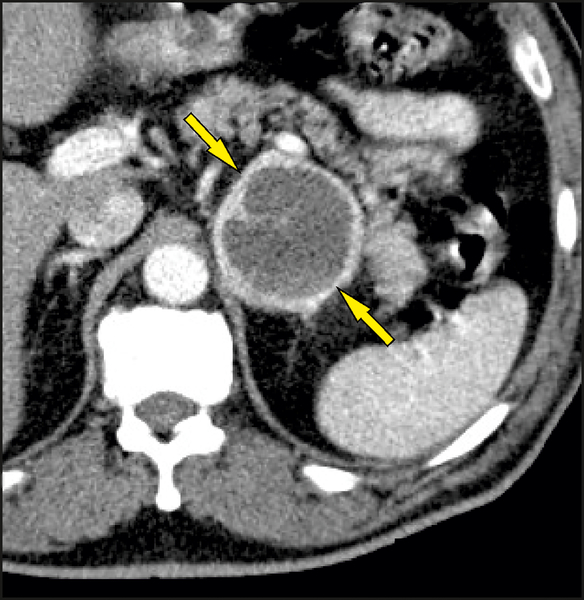
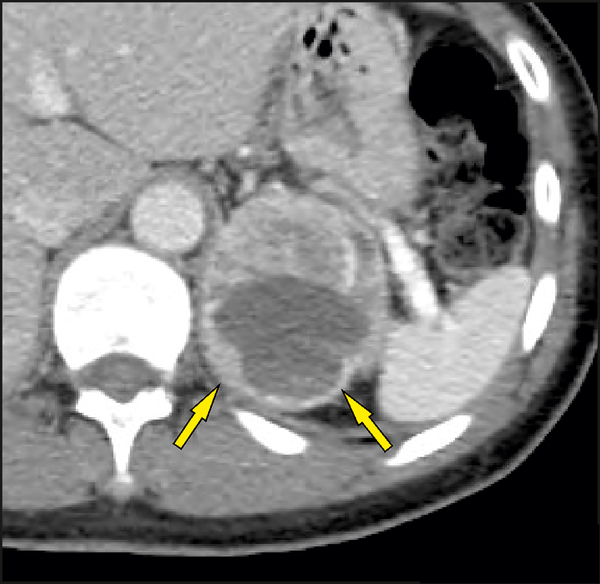
The “ring sign” was defined as strong enhancement in the peripheral rim of vital soft tissue surrounding a non-enhancing central necrosis on a contrast scan. Only an enhancing rim around the entire surface of a lesion was considered positive with respect to the presence of the “ring sign” (Figure 3). An incomplete rim (partial “ring sign”) was considered negative with respect to the presence of the “ring sign” (Figure 4).
Fig. 3. Ring sign.
The arrows point to the thin enhancing rim around the entire surface of a lesion.
Fig. 4. Partial ring sign.
The arrows point to the incomplete enhancing rim around a portion of the surface of a lesion.
Shape
All the lesions were assessed according to predefined shape criteria and assigned to a specific type of lesion: 1 – spherical lesions (with the shape of a sphere), 2 – elliptical lesions (with the shape of a spheroid, or ellipsoid of revolution), and 3 – other lesions (inappropriate for inclusion in the first two groups).
A sphere is a set of all the points that are the same distance from a given point; the distance is the radius of the sphere and the point is the center of the sphere. Analogously, an ellipsoid is a solid figure formed by the set of all the points of the space whose position towards the given point (center S) meets the requirements of the equation in the coordinate system (S, x, y, z), where a, b, and c are positive real numbers determining the half-axis. In the case of our research we have to add the condition that a=b=c is not valid.
We considered any two dimensions x, y of a lesion equal if it held that (they differed by less than 5%). We chose the level of accuracy on the grounds of the possible error in the measurement of the dimensions of a lesion. The accuracy of the measurement can be equal to the maximum accuracy of the calibrated instruments, which means 95%.
We predicted that the optimal relation is the one that compares the ratio of the dimensions of lesions. We can order all the dimensions of each lesion according to size and denote them by . Now we can focus on the comparison of individual dimensions. If the ratio of the dimensions is , we can state (with the chosen accuracy) that it is a sphere. In the worst situation, the smallest dimension can differ from the largest one by 9.75%.
In the event that only one of the conditions is fulfilled, the section of the lesion is a circle and the third dimension is longer or shorter than the diameter. We can state (with the chosen accuracy) that it is an ellipsoid of revolution. If no condition is fulfilled, it is “other shape”. For the analysis of the shapes a spreadsheet with the built-in IFS function IF(condition;yes;no) was used. The final command can be written as follows:
=IF(MIN(MIN(L5:N5)/LARGE(L5:N5;2);LARGE(L5:N5;2)/MAX(L5:N5))>$V$3;1;IF(MAX(MIN(L5:N5)/LARGE(L5:N5;2);LARGE(L5:N5;2)/MAX(L5:N5))>=$V$3;2;3)).
Statistical analysis
The statistical analysis and data processing were performed using the IBM SPSS Statistics 23 program. A P-value of 0.05 or lower was considered to be statistically significant. Tests of normality (the Shapiro-Wilk test) revealed non-normal distribution of the data; therefore, the Kruskal-Wallis test was used to evaluate possible age differences and maximum lesion dimensions. The differences between genders were compared by means of Fisher’s exact test. Differences in the shapes of tumors and the presence of necrosis were evaluated by a chi-square test and differences in margins, and the presence of the “ring sign” by Fisher’s exact test. These tests were followed by post hoc tests with Bonferroni correction.
Results
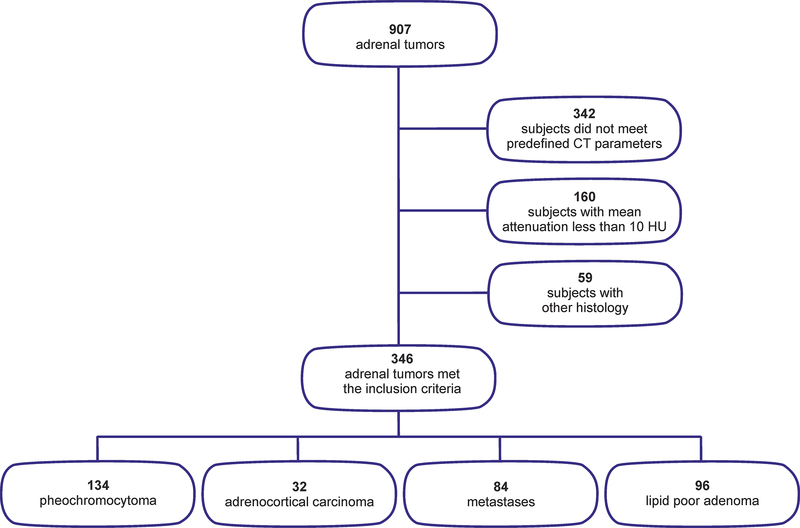
In total, 907 adrenal tumors were collected for the analysis from the participating centers. Out of these, 561 did not meet the inclusion criteria: 342 subjects lacked the predefined CT scan parameters (e.g., only unenhanced CT or only contrast-enhanced CT). 160 subjects had typical benign lesions with a mean attenuation less than 10 HU (128 lipid-rich adenomas and 32 myelolipomas), and 59 subjects had other types of histology (e.g., 11 hematomas, 15 cysts of different kinds, five hemangiomas, four PEComas, four lymphangiomas, one atypical myelolipoma, other rare soft tissue tumors, etc.). Thus, 346 adrenal tumors met the inclusion criteria and were analyzed in the study (Figure 5).
Fig. 5.
Flowchart summary of the study design.
The clinical and histological characteristics of the adrenal tumors are summarized in Table 1. Our set showed significant differences for age (P<0.0001) and sex (P<0.002). Post hoc multiple comparison indicates a predominance of males for metastatic lesions in comparison to pheochromocytomas and adenomas. The patients with metastases were also older than the others.
Table 1.
The clinical, histological and CT characteristics of the adrenal tumors.
| Pheochromocytoma | Adenoma | Metastasis | Carcinoma | Total | |
|---|---|---|---|---|---|
| Number of subjects | 134 | 96 | 84 | 32 | 346 |
| Male/female (number) | 63/71 | 37/59 | 56/28 | 15/17 | 171/175 |
| Age (years) median (range) | 57 (20–80) | 58 (21–74) | 63 (35–84) * ** | 51 (20–73) | 59 (20–84) |
| Maximal diameter (mm) median (range) | 43 (11–250) | 28 (6–100) | 39 (11–207) | 93 (34–211) | 39 (6–250) |
| Shape number (%) | |||||
| Spherical | 52 (38.8 %) | 2 (2.1 %) | 0 (0 %) | 0 (0 %) | 54 (15.6 %) |
| Oval | 50 (37.3 %) | 38 (39.6 %) | 20 (23.8 %) | 10 (31.3 %) | 118 (34.1 %) |
| Other | 32 (23.9 %) | 56 (58.3 %) | 64 (76.2 %) | 22 (68.8 %) | 174 (50.3 %) |
| Margins number (%) | |||||
| Smooth | 129 (97 %) | 95 (100 %) | 73 (88 %) | 32 (100 %) | 329 (95.9 %) |
| Irregular | 4 (3 %) | 0 (0 %) | 10 (12 %) | 0 (0 %) | 14 (4.1 %) |
| Necrosis number (%) | |||||
| No necrosis | 9 (6.7 %) | 83 (86.5 %) | 49 (58.3 %) | 8 (25 %) | 149 (43.1 %) |
| “Sharp” necrosis | 75 (56 %) | 1 (1 %) | 4 (4.8 %) | 1 (1.3 %) | 81 (23.4 %) |
| “Unsharp” necrosis | 50 (37.3 %) | 12 (12.5 %) | 31 (36.9 %) | 23 (71.9 %) | 116 (33.5 %) |
| Ring sign | |||||
| With ring sign | 57 (42.5%) | 2 (2.1%) | 2 (2.4%) | 1 (3.1%) | 62 (17.9%) |
| Without ring sign | 77 (57.5%) | 94 (97.9%) | 82 (97.6%) | 31 (96.9%) | 284 (82.1%) |
Fisher’s exact test proved that the set of tumors differs significantly according to sex (p=0.002), and post hoc multiple comparison tests with Bonferroni correction indicate that there are many more men in the set of metastatic patients than in the set with pheochromocytomas and adenomas.
The Kruskal-Wallis test proved that the sets differ significantly in terms of age (p<0.0001). Post hoc multiple comparison tests with Bonferroni correction proved that patients with metastases are significantly older than the patients in the other sets.
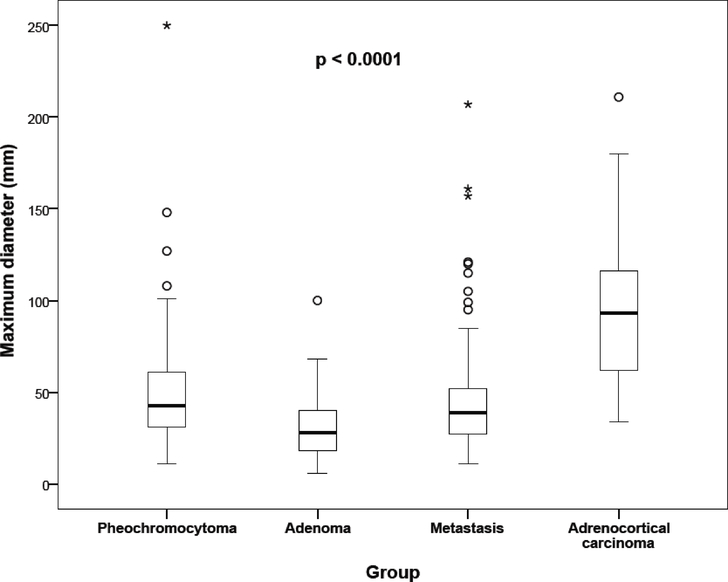
The Kruskal-Wallis test indicates that the sets differ significantly in terms of the maximum lesion dimensions (P<0.001). Significant differences in sizes were found, except between pheochromocytomas and metastases (Fig. 6). Significant differences between histological types were found in terms of shape (P < 0.0001), margins (P = 0.0005), necrosis (P < 0.0001), and the presence of peripheral “ring-like” enhancement (P < 0.0001). Post hoc tests with Bonferroni correction showed that pheochromocytomas presented with a more spherical shape, sharp-edged necrosis, and “ring-like” enhancement in comparison to other adrenal tumors. On the other hand, metastases presented with significantly more irregular margins in comparison to other adrenal tumors, including pheochromocytoma. The complete CT characteristics are summarized in Table 1.
Fig. 6. Maximum diameter of adrenal masses in different histological groups.
Legend: the thick line represents the median, the bottom of the box stands for the first quartile, the top of the box for the third quartile, and the whiskers display the minimum and maximum non-distant values. The circles represent outliers and stars show extreme values.
Development of the regression model
For this model we used four main predictors: maximum dimensions, shape, necrosis, and “ring sign”. The elliptical shape significantly reduced the probability of the occurrence of a pheochromocytoma (OR = 0.015; 95% CI 0.002–0.086), and another shape also lowers the probability of the occurrence of this type of tumor in comparison with the spherical shape (OR = 0.006; 95% CI 0.001–0.035). Sharp-edged necrosis increased the probability of the occurrence of a pheochromocytoma (OR = 231.6; 95% CI 52.7–1017.5) and unsharp necrosis also increased the probability of the occurrence of a pheochromocytoma (OR = 20.2; 95% CI 6.4–63.3) in comparison with the no-necrosis situation. The ring sign increased the probability of the occurrence of a pheochromocytoma (OR = 6.5; 95% CI 1.9–21.7). Larger dimensions of a tumor, however, reduced the probability of the occurrence of a pheochromocytoma (OR=0.984; 95% CI 0.972–0.996); unit 1 mm). The probability of the occurrence of a pheochromocytoma was calculated as follows:
If the p(pheo) values were higher than 0.5, then the data favored the presence of a pheochromocytoma with a sensitivity of 80%, specificity of 95%, and Nagelkerke R2 = 0.763. Here we also provide a link using the above-mentioned imaging characteristics to calculate the probability of a pheochromocytoma: http://pheochromocytoma.upol.cz/
Discussion
The usual route to the diagnosis of a pheochromocytoma is to have a clinical suspicion of this type of tumor and then direct the biochemical and imaging testing accordingly. However, the situation in patients with “clinically silent pheochromocytomas” (about 8%) is more complicated26. In patients without clinical symptoms and a mass found incidentally on imaging modality the current guideline on the management of adrenal incidentalomas should be strictly followed3. However, in the event of a suspicion of pheochromocytoma on imaging modality, the radiologist should advise the clinician to perform immediate full biochemical testing to exclude this type of tumor, since a falsely excluded pheochromocytoma could lead to life-threatening complications during anesthesia27. Thus the correct performance of biochemical testing is crucial for the diagnosis, but the whole procedure is complicated and time-consuming3. In the event of high radiological suspicion and negative biochemical testing, it would also be recommended to repeat the biochemical testing before definitely excluding the diagnosis. The correct diagnosis of a pheochromocytoma is also important as it leads to proper staging in cases of synchronous tumor multiplicity28.
Thus, in the present study we focused on morphological parameters to further characterize adrenal lesions and to introduce the algorithm (or approach) together with a mathematical model that would reliably predict the presence of a pheochromocytoma. We focused on the size of the lesions, which is a generally accepted parameter in the assessment of adrenal tumors with a predictive value of malignancy25,29. In our study, we did not measure lesion volumes because the largest diameter is easier to measure in practice, and previous publications have shown that there will be no statistically significant error if the maximum size measurements are used instead of volume measurements of the lesion2. Despite the fact that the maximum diameter of carcinomas was significantly larger and the maximum diameter of adenomas was significantly smaller compared to pheochromocytomas, there was a substantial overlap between these groups with regard to this parameter (Figure 6). Furthermore, there was no statistical difference between pheochromocytomas and metastases. Thus, our data suggest that maximum diameter alone is not a reliable feature to distinguish a pheochromocytoma from other adrenal masses.
Other features that are analyzed are more complex and are currently included in the still more frequent radiomics analysis. Nevertheless, we tried to utilize these parameters (shape, margin, and central necrosis) using a more available approach that could be usable in clinical routine. Irregular margins were present in metastases significantly more often than in adrenal adenomas but not other adrenal tumors, including pheochromocytomas. Therefore, we conclude that the presence of a specific margin is, therefore, a very unspecific feature and can only support other diagnostic clues.
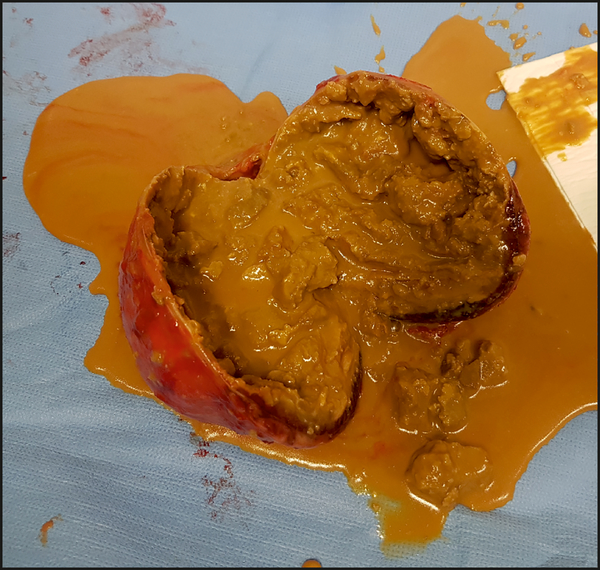
We share this opinion with other researchers30,31. Central necrosis is an expression commonly used by radiologists to describe a hypodense area inside a lesion that reveals no enhancement, but the central cavity could be filled with fluid or blood (Figure 7). Pheochromocytomas have previously been reported as frequently including a central necrosis31. In our study, the presence of central necrosis was frequently found in pheochromocytomas (90%) and carcinomas (75%). Significantly, a rare presence of central necrosis was observed in adenomas (13.5%). Furthermore, 56% of the pheochromocytomas had a central necrosis with a sharp boundary and this was significantly more frequent than in all the other groups, in which an unsharp type of central necrosis was present. Despite the relatively subjective evaluation of this feature, determining the type of central necrosis was found to be useful in distinguishing pheochromocytomas from other adrenal masses. Central necrosis is directly associated with another morphological pattern – the “ring sign”. This pattern was previously described as a dense tumor blush with a central lucent area resembling a ring in the capillary and venous phases during renal angiography in four necrotic pheochromocytomas32. To the best of our knowledge, this term was not subsequently adopted into reports on other imaging methods and studies. In our study, we defined the “ring sign” as a strong contrast-enhanced rim of peripheral soft tissue over the entire surface of a lesion. This feature was observed in more than 40% of pheochromocytomas, compared to 2–3% in all other adrenal tumors, suggesting that this imaging characteristic could be specific to pheochromocytomas.
Fig. 7. Photo of gross surgical postoperative specimen.
demonstrates spherical shape, smooth margin, central necrosis, and peripheral rim of vital tissue.
To the best of our knowledge, the shape of adrenal masses has never been approached systematically; only a vague classification of adrenal masses according to their shape into “sustained” and “not sustained” has previously been published33. The mathematical calculation for advanced assessment of the shape was created exclusively for the purposes of our study. Furthemore, the probability calculation model of the pheochromocytoma was created on the basis of our results using regression model analysis including these predictors: maximum diameter, shape, presence of central necrosis, and the presence of the “ring sign”. The model was back-tested using our patients and reached high sensitivity and specificity of pheochromocytoma identification (80% and 95%).
Our study has several limitations. The first is the retrospective study design, leading to the exclusion of one half of the surgically removed tumors because of incomplete or inappropriate imaging protocols with respect to the purpose of the study. Furthermore, CT scans fulfilling the inclusion criteria were performed over a long time period using a wide spectrum of CT scanners and protocols; however, the quality of the imaging data was consistent and sufficient for our analysis. It should also be noted that two of the morphological features (the type of central necrosis and margin of the lesion) are based on more subjective visual evaluation, for which the inter-observer variability was not determined.
Conclusions
The results confirm the benefit of anatomical features in the assessment of adrenal masses, with the ability to significantly improve the identification of pheochromocytomas. Advanced assessment of the tumor shape was defined and a original comprehensive calculating tool of the pheochromocytoma probability was created on the basis of the results presented here and could be used in clinical routine.
Supplementary Material
Acknowledgement
The present study was supported by the Ministry of Health of the Czech Republic (grant no. 17-31847A).
Footnotes
Conflict of interest statement
The authors state that there are no conflicts of interest regarding the publication of this article.
References
- 1.Korobkin M, Brodeur FJ, Yutzy GG, et al. Differentiation of adrenal adenomas from nonadenomas using CT attenuation values. AJR Am J Roentgenol. 1996;166(3):531–536. [DOI] [PubMed] [Google Scholar]
- 2.Čtvrtlík F, Heřman M, Študent V, Tichá V, Minařík J. Differential diagnosis of incidentally detected adrenal masses revealed on routine abdominal CT. European Journal of Radiology. 2009;69(2):243–252. [DOI] [PubMed] [Google Scholar]
- 3.Fassnacht M, Arlt W, Bancos I, et al. Management of adrenal incidentalomas: European Society of Endocrinology Clinical Practice Guideline in collaboration with the European Network for the Study of Adrenal Tumors. European Journal of Endocrinology. 2016;175(2):G1–G34. [DOI] [PubMed] [Google Scholar]
- 4.Ganeshan D, Bhosale P, Kundra V. Current update on cytogenetics, taxonomy, diagnosis, and management of adrenocortical carcinoma: what radiologists should know. AJR Am J Roentgenol. 2012;199(6):1283–1293. [DOI] [PubMed] [Google Scholar]
- 5.Szolar DH, Korobkin M, Reittner P, et al. Adrenocortical carcinomas and adrenal pheochromocytomas: mass and enhancement loss evaluation at delayed contrast-enhanced CT. Radiology. 2005;234(2):479–485. [DOI] [PubMed] [Google Scholar]
- 6.Mayo-Smith WW, Song JH, Boland GL, et al. Management of Incidental Adrenal Masses: A White Paper of the ACR Incidental Findings Committee. J Am Coll Radiol. 2017;14(8):1038–1044. [DOI] [PubMed] [Google Scholar]
- 7.Schieda N, Siegelman ES. Update on CT and MRI of adrenal nodules. American Journal of Roentgenology. 2017;208(6):1206–1217. [DOI] [PubMed] [Google Scholar]
- 8.de Melo-Leite AF, Elias PCL, Teixeira SR, et al. Adrenocortical neoplasms in adulthood and childhood: distinct presentation. Review of the clinical, pathological and imaging characteristics. J Pediatr Endocrinol Metab. 2017;30(3):253–276. [DOI] [PubMed] [Google Scholar]
- 9.Feral CC, Tissot FS, Tosello L, et al. 18F-fluorodihydroxyphenylalanine PET/CT in pheochromocytoma and paraganglioma: relation to genotype and amino acid transport system L. Eur J Nucl Med Mol Imaging. 2017;44(5):812–821. [DOI] [PMC free article] [PubMed] [Google Scholar]
- 10.Park SY, Park BK, Park JJ, Kim CK. CT sensitivity for adrenal adenoma according to lesion size. Abdom Imaging. 2015;40(8):3152–3160. [DOI] [PubMed] [Google Scholar]
- 11.Northcutt BG, Trakhtenbroit MA, Gomez EN, Fishman EK, Johnson PT. Adrenal Adenoma and Pheochromocytoma: Comparison of Multidetector CT Venous Enhancement Levels and Washout Characteristics. J Comput Assist Tomogr. 2016;40(2):194–200. [DOI] [PubMed] [Google Scholar]
- 12.Wale DJ, Wong KK, Viglianti BL, Rubello D, Gross MD. Contemporary imaging of incidentally discovered adrenal masses. Biomed Pharmacother. 2017;87:256–262. [DOI] [PubMed] [Google Scholar]
- 13.Woo S, Suh CH, Kim SY, Cho JY, Kim SH. Pheochromocytoma as a frequent false-positive in adrenal washout CT: A systematic review and meta-analysis. Eur Radiol. 2018;28(3):1027–1036. [DOI] [PubMed] [Google Scholar]
- 14.Mohammed MF, ElBanna KY, Ferguson D, Harris A, Khosa F. Pheochromocytomas Versus Adenoma: Role of Venous Phase CT Enhancement. AJR Am J Roentgenol. 2018;210(5):1073–1078. [DOI] [PubMed] [Google Scholar]
- 15.Lenders JWM, Duh Q-Y, Eisenhofer G, et al. Pheochromocytoma and paraganglioma: an endocrine society clinical practice guideline. J Clin Endocrinol Metab. 2014;99(6):1915–1942. [DOI] [PubMed] [Google Scholar]
- 16.Neumann HPH, Young WF, Eng C. Pheochromocytoma and Paraganglioma. New England Journal of Medicine. 2019;381(6):552–565. [DOI] [PubMed] [Google Scholar]
- 17.Else T, Kim AC, Sabolch A, et al. Adrenocortical Carcinoma. Endocr Rev. 2014;35(2):282–326. [DOI] [PMC free article] [PubMed] [Google Scholar]
- 18.Fassnacht M, Dekkers OM, Else T, et al. European Society of Endocrinology Clinical Practice Guidelines on the management of adrenocortical carcinoma in adults, in collaboration with the European Network for the Study of Adrenal Tumors. European Journal of Endocrinology. 2018;179(4):G1–G46. [DOI] [PubMed] [Google Scholar]
- 19.Sauneuf B, Chudeau N, Champigneulle B, et al. Pheochromocytoma Crisis in the ICU: A French Multicenter Cohort Study With Emphasis on Rescue Extracorporeal Membrane Oxygenation. Crit Care Med. 2017;45(7):e657–e665. [DOI] [PubMed] [Google Scholar]
- 20.Donatini G, Kraimps JL, Caillard C, et al. Pheochromocytoma diagnosed during pregnancy: lessons learned from a series of ten patients. Surg Endosc. 2018; [DOI] [PubMed] [Google Scholar]
- 21.Pacak K, Del Rivero J. Pheochromocytoma [Updated 2013 Jun 10]. In: De Groot LJ, Beck-Peccoz P, Chrousos G, et al. , editors. Endotext. South Dartmouth (MA): MDText.com, Inc.; 2000http://www.ncbi.nlm.nih.gov/books/NBK278970/. Accessed November 18, 2015. [Google Scholar]
- 22.Leung K, Stamm M, Raja A, Low G. Pheochromocytoma: the range of appearances on ultrasound, CT, MRI, and functional imaging. AJR Am J Roentgenol. 2013;200(2):370–378. [DOI] [PubMed] [Google Scholar]
- 23.McDermott S, McCarthy CJ, Blake MA. Images of pheochromocytoma in adrenal glands. Gland Surg. 2015;4(4):350–358. [DOI] [PMC free article] [PubMed] [Google Scholar]
- 24.Northcutt BG, Raman SP, Long C, et al. MDCT of adrenal masses: Can dual-phase enhancement patterns be used to differentiate adenoma and pheochromocytoma? AJR Am J Roentgenol. 2013;201(4):834–839. [DOI] [PubMed] [Google Scholar]
- 25.Kim DW, Yoon SK, Kim SH, Kang EJ, Kwon HJ. Assessment of clinical and radiologic differences between small and large adrenal pheochromocytomas. Clin Imaging. 2017;43:153–157. [DOI] [PubMed] [Google Scholar]
- 26.Sunil Kumar K, Siva Krishna K, Sandip P, Kirtikumar DM. Pheochromocytoma: An Uncommon Presentation of an Asymptomatic and Biochemically Silent Adrenal Incidentaloma. Malays J Med Sci. 2012;19(2):86–91. [PMC free article] [PubMed] [Google Scholar]
- 27.Gupta N, Brau K, Sasson A, Goldner W. Biochemically Silent Pheochromocytoma Presenting with Hypertensive Crisis During Surgery. AACE Clinical Case Reports. 2016;2(4):e333–e336. [Google Scholar]
- 28.Veverková L, Čtvrtlík F, Buriánková E, et al. Breast cancer and pheochromocytoma - a case report about rare synchronous tumor occurence. Česká radiologie. 2018;72(1):42–47. [Google Scholar]
- 29.Mantero F, Terzolo M, Arnaldi G, et al. A survey on adrenal incidentaloma in Italy. Study Group on Adrenal Tumors of the Italian Society of Endocrinology. J Clin Endocrinol Metab. 2000;85(2):637–644. [DOI] [PubMed] [Google Scholar]
- 30.Hamrahian AH, Ioachimescu AG, Remer EM, et al. Clinical utility of noncontrast computed tomography attenuation value (hounsfield units) to differentiate adrenal adenomas/hyperplasias from nonadenomas: Cleveland Clinic experience. J Clin Endocrinol Metab. 2005;90(2):871–877. [DOI] [PubMed] [Google Scholar]
- 31.Petersenn S, Richter P-A, Broemel T, et al. Computed tomography criteria for discrimination of adrenal adenomas and adrenocortical carcinomas: analysis of the German ACC registry. Eur J Endocrinol. 2015;172(4):415–422. [DOI] [PubMed] [Google Scholar]
- 32.Motta-Ramirez GA, Remer EM, Herts BR, Gill IS, Hamrahian AH. Comparison of CT Findings in Symptomatic and Incidentally Discovered Pheochromocytomas. American Journal of Roentgenology. 2005;185(3):684–688. [DOI] [PubMed] [Google Scholar]
- 33.Velasquez G, Nath PH, Zollikofer C, et al. The “ring sign” of necrotic pheochromocytoma. Radiology. 1979;131(1):69–71. [DOI] [PubMed] [Google Scholar]
Associated Data
This section collects any data citations, data availability statements, or supplementary materials included in this article.


