

SUMMARY
CXCR5 is a key marker of follicular helper T (TFH) cells. Using primary lymph nodes (LNs) from HIV-infected patients, we identified a population of CXCR5− CD4+ T cells with TFH-cell-like features. This CXCR5− subset becomes expanded in severe HIV infection and is characterized by the upregulation of activation markers and high PD-1 and ICOS surface expression. Integrated analyses on the phenotypic heterogeneity, functional capacity, T cell receptor (TCR) repertoire, transcriptional profile, and epigenetic state of CXCR5−PD-1+ICOS+ T cells revealed a shared clonal relationship with TFH cells. CXCR5−PD-1+ICOS+ T cells retained a poised state for CXCR5 expression and exhibited a migratory transcriptional program. TCR sequence overlap revealed a contribution of LN-derived CXCR5−PD-1+ICOS+ T cells to circulating CXCR5− CD4+ T cells with B cell help function. These data link LN pathology to circulating T cells and expand the current understanding on the diversity of T cells that regulate B cell responses during chronic inflammation.
In Brief
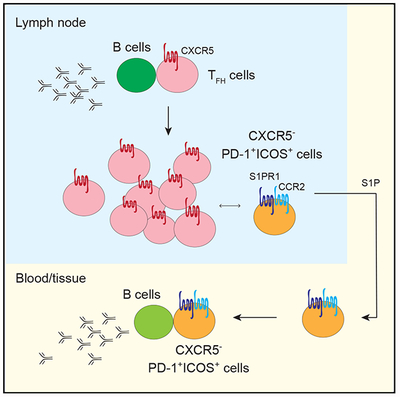
Follicular helper T (TFH) cells are critical for antibody production. Del Alcazar et al. showed that TFH cells can lose their characteristic chemokine receptor, giving rise to migratory populations of CXCR5− T cells that retain B cell help function and are poised for CXCR5 expression.
Graphical Abstract
INTRODUCTION
T cell activation is a hallmark of chronic HIV infection (Hunt et al., 2016; Sereti and Altfeld, 2016). T cells from HIV+ patients express increased levels of activation markers, CD38 and HLA-DR, which predict more rapid progression to AIDS in advanced HIV infection (Balagopal et al., 2015; Giorgi et al., 1993; Karim et al., 2013; Langford et al., 2007). Even with effective anti-retroviral therapy, T cell activation remains elevated in HIV- infected individuals, likely as a result of viral persistence (Hunt et al., 2016; Lorenzo-Redondo et al., 2016). Lymphoid tissues are a major reservoir of HIV infection (Hufert et al., 1997; Kohler et al., 2016). Viral infection leads to disrupted lymphoid architectures and altered cellular differentiation (Hong et al., 2016). In particular, studies of human primary lymph nodes (LNs) from untreated HIV patients have revealed an expansion of follicular helper T (TFH) cells (Lindqvist et al., 2012; Perreau et al., 2013), which are classically identified by the expression of CXCR5, a chemokine receptor that enables proper follicular localization in the LN (Crotty, 2014; Haynes et al., 2007). TFH cells are necessary for the development of affinity-matured broadly neutralizing antibody-producing B cells (Havenar-Daughton et al., 2017). However, despite an increase in the abundance of TFH cells in the LN, protective antibody responses to vaccines are generally diminished in the setting of HIV infection (Crum-Cianflone et al., 2011; de Armas et al., 2017). TFH cells from HIV+ patients acquire a skewed functional phenotype and limited T cell receptor (TCR) diversity under persistent antigen stimulation (Wendel et al., 2018). Functional assays performed in vitro also showed TFH cells from HIV-infected LNs were less effective at providing help to B cells (Cubas et al., 2013).
Due to the importance of TFH cells in generating protective antibody responses, there have been substantial efforts to understand and manipulate TFH cells for better vaccine efficacy. By comparison, much less is known about other cell types in inflamed LNs. Because HIV-driven immune hyperactivation broadly impact T cells in lymphoid tissues (Biancotto et al., 2007), we hypothesized that a more comprehensive understanding of the complexity of activated T cells in the lymphoid compartment could provide insights into dysregulated T:B cell interactions. Unique functional and phenotypic states identified in this setting may be harnessed for the improvement of efficacious protective antibody responses. In this study, we combined a number of high-dimensional and functional approaches to examine activated T cells in primary human LNs from HIV-infected individuals, with the goal of discovering T cell populations that contribute to abnormal responses in the lymphoid environment during chronic viral infection.
RESULTS
High-Dimensional Phenotypic Analyses Revealed an Accumulation of Activated CXCR5− CD4+ T Cells in HIV-Infected LNs
T cell activation in chronic HIV infection predicts increased mortality in severe disease (Giorgi et al., 1999). To better understand the heterogeneity of activated T cells in the LN, we performed mass cytometry with a 36-marker panel using LNs from eight virally active HIV+ patients. Cryopreserved LN cells were stimulated with phorbol-12-myristate-13-acetate (PMA) and ionomycin in the presence of brefeldin A and monensin for 5 h, stained with metal-conjugated antibodies, and analyzed on the mass cytometer, cytometry by time of flight 2 (CyTOF2). Data normalization was performed using a bead-based standards to minimize variations due to batch and machine performance (Finck et al., 2013). We defined activated T cells by CD38 and HLA-DR expression and compared double-positive T cells to quiescent CD38−HLA-DR− CD3+T cells (Figure 1A). Activated or quiescent CD3+ T cells were further divided into CD4+ αβ, CD8+ αβ, or γδ T cells. The majority of CD3+ cells expressed αβ TCRs, mostly CD4+ in the CD38−HLA-DR− subset but predominantly CD8+ in the CD38+HLA-DR+ subset (Figure 1A). Activated T cells were enriched in memory and effector molecules, whereas markers indicative of a less differentiated state, TCF1 and CCR7, were more highly expressed in quiescent T cells (Figure 1B). Although activated T cells contained a lower relative frequency of CD4+ T cells, CD38+HLA-DR+ CD4+ T cells were more abundant in patients with more severe HIV infection (Figure S1A).
Figure 1. High-Dimensional Analyses of Activated T Cells in HIV-Infected LNs.

(A–E) CyTOF analyses of 8 HIV-infected LNs.
(A) Representative plot and bar graph show the relative contribution of major T cell subsets in HIV-infected LNs by TCR and co-receptor expression.
(B) Plot summarizes fold change over mean signal intensity for differentially expressed markers between CD38−HLA-DR− and CD38+HLA-DR+ CD3+ T cells.
(C) UMAP displays of PD-1 and CXCR5 staining on CD4+ T cells using concatenated data from 8 HIV LN samples.
(D) Heatmap shows the average staining signal of individual markers for each CD4+ T cell subset as indicated. Markers used to select input cells were excluded.
(E) Representative plot showing PD-1 and CD38 co-staining.
(F–J) Flow cytometry analyses of 7 HC and 9 HIV LNs.
(F) Plots showing subdivision of CD4+ T cells by CXCR5 and PD-1 staining on a representative HC or HIV-infected LN sample.
(G) Bar graph quantifies the frequency of each phenotypic subset in HC or HIV-infected LNs.
(H) The frequency of CD38+ T cells within each manually gated CD4+ T cell subset.
(I) The frequency of CD38+ T cells within ICOS− versus ICOS+ subset of CXCR5−PD-1++ T cells.
(J) Correlation between peripheral CD4:CD8 ratio of 22 HIV+ donors and the frequency of CXCR5−PD-1+ICOS+ subset of CD4+ T cells in their LNs.
For (B) and (G), differentially expressed markers were selected using multiple t tests and corrected using Holm-Sidak method. For (H), Friedman test was performed and corrected using Dunnett’s multiple comparisons test. For (I), paired t test was used. Association for (J) was measured by Pearson correlation. Data are represented as mean ± SEM.
Also see Figures S1 and S2.
To further examine CD4+ T cells for activation-associated changes relevant to HIV infection, equal numbers of manually gated CD4+ T cells from each donor were combined, and nonlinear dimensional reduction was performed using Uniform Manifold Approximation and Projection (UMAP; Figures S1B–S1C) (Becht et al., 2018). We observed a substantial population of Foxp3+ cells and heterogeneous interferon gamma (IFN-γ), interleukin-2 (IL-2), and tumor necrosis factor alpha (TNF-α) expression, but few cells with positive IL-4, IL-13, or IL-17 staining (Figure S1C). While CXCR5 and PD-1 co-expression classically defines TFH cells, PD-1 staining covered a broader region on UMAP and included areas with little CXCR5 signal (Figure 1C). PD-1+ cells with weak or absent CXCR5 expression were concentrated in areas with higher CD38, ICOS, and Ki67 staining (Figure S1C). To better delineate cellular heterogeneity with respect to PD-1 and CXCR5, we subdivided CXCR5+ and CXCR5− cells by high (++), intermediate (+), or negative (−) PD-1 expression (Figure S1D). The mean intensity of individual markers expressed by each subset was grouped in a heatmap by hierarchical clustering. This separated CD4+ T cells by the level of PD-1 expression, with PD-1++ cells staining most strongly for other markers of T cell activation, including CD38, Ki67, CD71, ICOS, and HLA-DR (Figures 1D and 1E). To validate the findings above, we performed fluorescent cytometry on a separate set of LN cells from HIV+ patients and healthy controls (HCs) and subdivided CD4+ T cells as in the CyTOF dataset (Figure 1F). Compared to HCs, CD4+ T cells expressing intermediate or high levels of PD-1 were significantly elevated in HIV-infected LNs (Figure 1G). CXCR5−PD-1++ lymphocytes contained a high frequency of CD38+ T cells, which was further increased in the ICOS+ subset (ICOS−: 31.5%, ICOS+: 68.2%, Figure 1I). Our data were consistent with prior work by Perreau et al. (2013), which also demonstrated an expansion of activated CXCR5−PD-1+ T cells in HIV-infected LNs. However, the significance of this population within the context of HIV infection remains unclear. Using a previously acquired CyTOF dataset from a larger set of HIV-infected LN samples (Wendel et al., 2018), we showed that CXCR5− memory CD4+ T cells with double PD-1 and ICOS expression were associated with more severe HIV infection by low blood CD4:CD8 ratio and CD4+ T cell count (Figures 1J and S2A–S2D). Identification of activated PD-1-expressing CXCR5− T cells by positive CD38 staining revealed similar associations (Figures S2E–S2G). Taken together, our data provided a broad overview of T cells in HIV-infected LNs and revealed pathologic accumulation of activated CXCR5− CD4+ T cell population with high levels of PD-1 expression during chronic HIV infection.
CXCR5−PD-1+ CD4+ T Cells Express Co-inhibitory Receptors but Retain Cytokine-Producing Potential
PD-1 is a co-inhibitory receptor expressed by TFH cells and up-regulated by exhausted T cells. Thus, we initially hypothesized that PD-1 expression on CXCR5− T cells marked a population of exhausted CD4+ T cells driven by the depleted CD4+ T cell niche and chronic antigen stimulation by HIV infection. To test this, we stained HIV-infected LN cells for additional co-inhibitory receptors, Lag-3, TIGIT, 2B4, Tim-3, and CD39 (Crawford et al., 2014; Simoni et al., 2018). This showed an increased expression of 2B4, Lag-3, and TIGIT on PD-1-expressing T cells, irrespective of CXCR5 expression. In addition, CXCR5−PD-1++ T cells also expressed a higher level of Tim-3 and CD39 compared to the PD-1 negative subsets (Figures 2A and S3A). To examine differences in functional potential, we first broadly divided cells into PD-1− or PD-1+/++ subsets. This showed TNF-α and/or IFN-γ production by PD-1-expressing T cells following PMA and ionomycin stimulation (Figure 2B). To refine this analysis, Boolean gates for IL-2, IFN-γ, and TNF-α were applied onto individual CD4+ subsets to identify all combinations of cytokine production (Figure S3B). Compared to the CXCR5−PD-1− subset, CXCR5−PD-1++ T cells contained a significantly higher frequency of IFN-γ-producing cells, including single IFN-γ-secreting cells (4.26%); double IFN-γ and TNF-α producers (17.04%); and triple IFN-γ+TNF-α-+IL-2-producing T cells (7.23%, Figures 2C and S3C). To determine if CXCR5−PD-1++ T cells can also produce IL-21, a critical mediator of B cell selection and differentiation in the LN, we analyzed a previously acquired CyTOF dataset on HIV-infected LNs that included IL-21 staining (Wendel et al., 2018). This identified IL-21 production in a substantial fraction of memory CD4+ T cells with CXCR5−PD-12++ phenotype (CXCR5−PD-1−: 2.90%, CXCR5−PD-1++: 12.09%, CXCR5+PD-1++: 8.92%, Figures 2D and S4A). Staining by flow cytometry also showed IL-21 secretion was not restricted to CXCR5+ T cells (Figures S4B and S4C). Collectively, these data demonstrated preservation of cytokine-producing potential in a subset of CXCR5− CD4+ T cells that displayed increased co-inhibitory receptor expression.
Figure 2. Co-inhibitory Receptor Expression and the Functional Potential of CD4+ T Cell Subsets in HIV-Infected LNs.

(A) Relative expression of the indicated co-inhibitory receptors as a percentage of indicated subsets (n = 8).
(B) Representative staining for IFN-γ and TNF-α in PD-1− and PD-1+/++ T cells. PD-1− cells combined CXCR5−PD-1− and CXCR5+PD-1− subsets. PD-1+/++ cells included both CXCR5− and CXCR5+ cells of intermediate (PD-1+) and high PD-1 expression (PD-1++).
(C) The frequency of cells in individual subsets that positively stained for the indicated cytokines after PMA and ionomycin stimulation (n = 8).
(D) The frequency of IL-21+ T cells in the indicated subsets following stimulation as measured by CyTOF (n = 25).
For (A), Friedman test was applied and corrected using Dunn’s multiple comparison test. For (C), two-way ANOVA was performed. Mean of each subset were compared to that of CXCR5−PD-1− T cells and corrected using Dunnett’s multiple comparisons test. For (D), one-way ANOVA was performed and corrected using Holm-Sidak method. Data are represented as mean ± SEM.
Also see Figures S3 and S4A–S4C.
CXCR5−PD-1+ICOS+ T Cells Express TFH-Associated Proteins and Function
The ability to produce IL-21 under stimulation suggested the possibility that the CXCR5− population may be more similar to TFH cells than exhausted T cells or other types of conventional CD4+ T cells. To evaluate additional TFH-cell-related protein expression, we examined CXCR5− T cells for upregulation of BCL6, Maf, and CD84. BCL6 and Maf are key transcriptional regulators of TFH cell specification and function (Bauquet et al., 2009; Yu et al., 2009), whereas CD84 belongs to signaling lymphocyte activation molecule (SLAM) family of receptors that transduces adhesion signals to drive germinal center differentiation (Cannons et al., 2010). Herein, we included ICOS and CD45RO to more precisely define TFH cells (Figure S5A). We also added ICOS to the selection of PD-1-expressing CXCR5− T cells because it enriched for the activation phenotype and identified a subset of CXCR5− T cells that correlated with more severe HIV infection (Figures 1I and 1J). PD-1+ICOS+ memory cells were compared to PD-1−ICOS− memory cells and naive CD4+ T cells. Analyses of BCL6, Maf, and CD84 staining in CXCR5−PD-1+ICOS+ T cells showed higher expression for all three proteins relative to non-TFH cells but a weaker staining for BCL6 and Maf compared to TFH cells (Figures 3A and S4D).
Figure 3. CXCR5−PD-1+ICOS+ T Cells in HIV-Infected LNs Express TFH-Cell-Related Proteins and Function.

(A) Histograms showing fluorescent intensity of BCL6, Maf, and CD84 staining in naive (1), CXCR5−PD-1−ICOS− (2), CXCR5−PD-1+ICOS+ (3), and TFH cells (4). Plots summarize data from 8 HIV LNs.
(B) Plasma cell phenotype of B cells cocultured with the indicated T cell subsets without or with SEB.
(C-E) Quantification of total IgG (n = 13) (C), plasma cells (n = 15) (D), or CD4+ T cells (n = 15) (E) on the 7th day of each coculture condition.
(F) IFN-γ level in the supernatant of wells containing TFH cells or CXCR5−PD-1+ICOS+ T cells (n = 9).
(G) Example gate for T-bet+ B cells. Naive IgD+CD27− B cells were excluded. Scatterplot quantifies T-bet+ B cells in 7 HC and 25 HIV-infected LNs.
(H) Correlation between IFN-γ expression in CXCR5−PD-1+ICOS+ T cells and T-bet+ B cell frequency in HIV-infected LN samples.
For (A) and (C)–(E), Friedman test was performed and corrected using Dunn’s multiple comparisons test. For (F), Wilcoxon matched-pairs signed rank test was used. For (G), Mann-Whitney test was used. For (H), association was measured by Spearman correlation. Data are represented as mean ± SEM.
Also see Figures S4D and S5A.
To determine if the partial resemblance between CXCR5−PD-1+ICOS+ T cells and TFH cells extended to a similar functional program, we performed T:B coculture assays to assess the potential for B cell helper function. Naive, CXCR5−PD-1−ICOS−, CXCR5−PD-1+ICOS+, and TFH cells were sorted and cultured with autologous B cells at 1:1 ratio and stimulated with Staphylococcal Enterotoxin B (SEB). CXCR5−PD-1+ICOS+ T cells drove plasma cell differentiation and immunoglobulin G (IgG) production similar to the level observed in TFH cells (Figures 3B–3D). Interestingly, B cells cocultured with CXCR5−PD-1−ICOS− memory T cells also produced significantly more antibodies compared to naive T cells, at a level comparable to or exceeding that of B cells cocultured with TFH cells in one-third of the samples (5/15). This observation may be a nonspecific feature of the experimental condition or could reflect a broader range of B cell helper activity by other types CD4+ T cells. The ability of CXCR5−PD-1−ICOS− T cells to survive and expand better in vitro likely also contributed to this finding (Figure 3E).
Next, we examined the in vivo relevance of CXCR5−PD-1+ICOS+ T cells by measuring correlative changes in B cell differentiation in primary LN samples. In the context of Toll-like receptor (TLR) engagement, IFN-γ has been shown to induce a distinct effector B cell subset characterized by T-bet expression (Barnett et al., 2016; Knox et al., 2017; Rubtsova et al., 2013). Because CXCR5−PD-1++ T cells exhibited an IFN-γ-dominant functional profile (Figure 2C) and produced a higher level of IFN-γ in the supernatant compared to TFH cells (Figure 3F), we hypothesized that IFN-γ-producing CXCR5−PD-1+ICOS+ T cells could promote B cell differentiation toward the T-bet+ subset. Using T-bet and CXCR3 co-expression to identify T-bet+ B cells, we showed higher T-bet+ B cell frequency in HIV-infected LNs compared to cells from HCs, which positively correlated with the frequency of IFN-γ-producing CXCR5−PD-1+ICOS+ T cells (Figures 3G and 3H). Collectively, the in vitro functionality of CXCR5−PD-1+ICOS+ T cells and the associated B cell changes in primary LNs provide supportive evidence for regulation of B cell responses by CXCR5−PD-1+ICOS+ T cells during chronic HIV infection.
CXCR5−PD-1+ICOS+ Subset Contains HIV-Specific T Cells that Drive B Cell Responses In Vitro
Past studies have found an expansion of HIV-specific TFH cells during chronic HIV infection (Lindqvist et al., 2012; Perreau et al., 2013; Wendel et al., 2018). Given the functional and phenotypic similarity between CXCR5−PD-1+ICOS+ T cells and TFH cells, next we determined if the CXCR5−PD-1+ICOS+ subset was also enriched for HIV-specific T cells. We stimulated total LN cells with overlapping pools of Gag peptides for 18 h and identified peptide-specific T cells within naive, CXCR5−PD-1−ICOS−, CXCR5−PD-1+ICOS+, or TFH cells by CD25 and OX40 upregulation (Dan et al., 2016). The frequency of CD25 and OX40 double-positive T cells in DMSO-vehicle-treated backgrounds were subtracted from Gag peptide stimulated cultures to calculate the frequency of Gag-reactive T cells. On average, 1.86% of CXCR5−PD-1+ICOS+ (0%–4.2%) and 0.83% of TFH cells (0%–3.20%) expressed OX40 and CD25 in response to peptide stimulation, whereas negligible numbers of CD25+OX40+ cells were detected in the naive and CXCR5−PD-1−ICOS− subsets (Figures 4A and 4B).
Figure 4. CXCR5−PD-1+ICOS+ T Cells Contain HIV-Specific T Cells that Are Capable of Promoting Both HIV-Specific and Non-HIV-Specific Antibody Responses.

(A) Gag-specific T cells within CXCR5−PD-1+ICOS+ T cells or TFH cells were identified by OX40 and CD25 expression in LN cells stimulated with pooled Gag peptides for 18 h. Plots show representative data from one HIV LN.
(B) Quantification of CD25hiOX40hi T cell frequency. Background level of CD25hiOX40hi T cells in vehicle-treated wells was subtracted from Gag-stimulated wells (n = 7).
(C) Plasma cell phenotype of B cells cocultured with the indicated T cell subsets in the presence of Gag/Env peptides for 7 days. Representative data from one individual is shown.
(D and E) Quantification of IgG concentration (D) or plasma cell number (E) in T:B cell cocultures after 7 days of Gag/Env peptide stimulation (n = 15).
(F) Summary plot comparing total IgG antibody concentration with concentration of antibodies that recognize Gag/Env peptides or proteins. Cocultures contained either CXCR5−PD-1+ICOS+ T cells or TFH cells and were stimulated by Env/Gag peptides.
(G) Bar graphs show the concentration of antibodies specific for Gag/Env protein asapercentage of total IgG produced by B cells in the presence of HIV peptide-stimulated CXCR5−PD-1+ICOS+ T cells or TFH cells. Each bar indicates one individual.
Friedman test was performed and corrected using Dunn’s multiple comparisons test. Data are represented as mean ± SEM.
Also see Figure S6.
To examine the functional activity of HIV-specific T cells within the naive, CXCR5−PD-1−ICOS−, CXCR5−PD-1+ICOS+, or TFH cell fraction, sort purified T cell subsets were cultured with B cells and stimulated by Gag and Env peptides. B cell response was absent in naive and CXCR5−PD-1−ICOS− T cell cocultures. In contrast, sufficient numbers of CXCR5−PD-1+ICOS+ and TFH cells responded to HIV peptides to drive plasma cell differentiation and IgG production by B cells, despite a lower overall survival of these cells in culture (Figures 4C–4E; Figure S6A). Analyses of antibody specificity showed limited recognition of recombinant Gag/Env proteins and no binding to Gag/Env peptides. HIV-specific antibodies accounted for 4% (0%–10%) of total IgG antibodies in the supernatant from TFH cell cocultures and 10% (0%–49%) of the antibodies generated in the presence of CXCR5−PD-1+ICOS+ T cells (Figures 4F and 4G). Consistent with this, HIV peptide-stimulated CXCR5−PD-1+ICOS+ T cells induced antibody secreting cells (ASCs) by enzyme-linked immune absorbent spot assay (ELISPOT), which contained rare, but appreciable, B cell responses against Gag/Env proteins (Figures S6B–S6D). Collectively, these data identified HIV-specific T cells within the CXCR5−PD-1+ICOS+ phenotypic subset and provide evidence for their ability to promote B cell response in vitro.
CXCR5−PD-1+ICOS+ T Cells Are Clonally Related to TFH Cells and Share a Similar Epigenetic Landscape
The enrichment of T cells reactive to the same antigens suggested the possibility that CXCR5−PD-1+ICOS+ cells and TFH cells shared overlapping TCR repertoires. We tracked the clonal relationship between CXCR5−PD-1+ICOS+ T cells and TFH cells by taking advantage of TCR sequence as a unique T cell identifier. T cells expressing the identical TCR sequences are necessarily generated from the same precursors, and thus we can use TCR sequences to infer the relatedness between phenotypically distinct populations. We performed TCR repertoire sequencing on sorted naive, CXCR5−PD-1−ICOS−, CXCR5−PD-1+ICOS+, and TFH cells (Figure S5A). Common sequences shared between CXCR5−PD-1+ICOS+ and other T cell subsets were shown as connecting lines on circos plots and quantified by the Bhattacharyya Coefficient as an index of sequence similarity (Bhattacharyya, 1943) (Figure 5A). Analysis of the combined TCR sequencing data from 9 donors showed that the clonal overlap between CXCR5−PD-1+ICOS+ T cells and other T cell subsets was highest with TFH cells, which significantly exceeded the repertoire similarities with naive cells or CXCR5−PD-1−ICOS− T cells (Figure 5B).
Figure 5. CXCR5−PD-1+ICOS+ T Cells Are Clonally Related to TFH Cells and Exhibit Epigenetic Similarities.

(A) Circos plots of TCR sequence overlap among different populations. Each thin slice of the arc represents a unique TCR sequence, ordered by the clone size (darker green for larger clones, inner circle). Outer circle indicate TCR sequences found in naive, CXCR5−PD-1−ICOS−, CXCR5−PD-1+ICOS+, and TFH cells. Each plot represents data from one individual.
(B) Bhattacharyya coefficient measurement for the TCR repertoire similarity between CXCR5−PD-1+ICOS+ T cells and other populations within LN. Grey lines connect samples from the same patient (n = 9).
(C) Principal-component analysis of ATAC-seq data of LN CD4+ T cell subsets from 6 HIV+ donors. Each symbol represents cells from one donor; cells of the same type are coded by the same color.
(D) Representative chromatin accessibility at the CXCR5 upstream region for each CD4+ T cell subset.
(E) Example plots showing TCF1 and CD38 staining.
(F) Quantification of activated TCF1− T cells among CXCR5−PD-1+ICOS+ T cells and TFH cells in HIV+ LNs (n = 8).
(G) Sorted TFH cells were labeled with carboxyfluorescein succinimidyl ester (CFSE) and treated with SEB or DMSO for 7 days in the presence of B cells. Bar graph quantifies the fluorescence intensity of CXCR5 staining on TFH cells. Cell division was measured by dilution of CFSE staining (n = 6).
For (B) and (G), Friedman test was performed and corrected using Dunn’s multiple comparisons test. For (F), paired t test was used. Data are represented as mean ± SEM.
Also see Figures S5A, S5B, S4E, and S4F.
The overlap in TCR sequence repertoire between CXCR5−PD-1+ICOS+ and TFH cells could reflect variable CXCR5 expression between cells along a single differentiation trajectory and/or divergent differentiation from a shared CXCR5− precursor population. To distinguish between these possibilities, transposase-accessible chromatin with sequencing (ATAC-seq) was performed to provide a glimpse into the differentiation history of CXCR5−PD-1+ICOS+ T cells. We anticipated CXCR5−PD-1+ICOS+ T cells to have open chromatin region around CXCR5 promoter region if these cells had previously expressed CXCR5 and remained transcriptionally permissive for CXCR5 expression. Alternatively, we would expect to find a closed CXCR5 promoter region if CXCR5−PD-1+ICOS+ T cells did not go through a CXCR5+ state or if changes in the chromatin structure were short-lived. We generated a chromatin accessibility map for naive, CXCR5−PD-1−ICOS−, CXCR5−PD-1+ICOS+, and TFH cells. Principal-component analysis (PCA) separated naive and CXCR5−PD-1−ICOS− T cells from CXCR5−PD-1+ICOS+ T cells along the first and second principal components (PCs) (Figure 5C). Notably, CXCR5−PD-1+ICOS+ cells and TFH cells occupied overlapping PCA space, indicating highly similar epigenetic landscapes between these cell subsets irrespective of CXCR5 expression. Focusing on CXCR5, we observed an accessible open chromatin state around the CXCR5 promoter region in CXCR5−PD-1+ICOS+ T cells, suggesting that CXCR5−PD-1+ICOS+ T cells had previously been CXCR5+ and/or are poised for CXCR5 expression (Figure 5D).
Next, we used TCF1 expression to construct a probable progression between CXCR5 positive and negative states. The transcriptional factor TCF1 is expressed at high levels by naive cells and decreases during effector cell differentiation in a cell-cycle-dependent manner (Danilo et al., 2018; Nish et al., 2017). Compared to TFH cells, approximately twice as many CXCR5−PD-1+ICOS+ T cells were CD38+TCF1− (23.2% versus 11.3%), suggesting that the CXCR5−PD-1+ICOS+ phenotype enriched for activated T cells in a more differentiated state (Figures 5E and Figures 5F). In culture conditions, CXCR5 expression was unstable on TFH cells and became downregulated following SEB-induced T cell stimulation and cell division (Figures 5G, S4E, and S4F). These data support a shared differentiation program between CXCR5−PD-1+ICOS+ T cells and TFH cells and suggest downregulation of CXCR5 as a potential mechanism that contributes to the accumulation of CXCR5−PD-1+ICOS+ T cells in inflamed LNs.
Transcriptomic Analyses Capture a Unique Set of Gene Signature Expressed by CXCR5−PD-1+ICOS+ T Cells
To begin to elucidate the functional program of CXCR5− T cells, we performed transcriptomic profiling of naive, CXCR5−PD-1−ICOS−, CXCR5−PD-1+ICOS+, and TFH cells by RNA sequencing (RNA-seq). PCA of the RNA-seq dataset partitioned CXCR5−PD-1+ICOS+T cells in a region neighboring TFH cells on the PCA space, indicating considerable similarity in the global transcriptomics between these two populations (Figure 6A). To identify gene programs that are unique to CXCR5−PD-1+ICOS+ T cells, we used gene set enrichment analysis (GSEA) to identify the Gene Ontology (GO) biological pathways enriched in CXCR5−PD-1+ICOS+ T cells compared to TFH cells. In parallel, we identified 344 genes differentially expressed between CXCR5−PD-1+ICOS+ T cells and TFH cells using DEseq2. We then used GOrilla to find GO biological pathways enriched by this gene set. The results from GSEA and differential gene expression analyses were combined to identify GO terms common to both analyses methods, which were consolidated by REVIGO to remove redundancy (Supek et al., 2011) (Figure S7). The pathways revealed by these analyses included processes involved in cell migration, T cell activation, and differentiation (Figure 6B). Expectedly, the absence of CXCR5 protein expression predicted a low CXCR5 transcripts level in CXCR5−PD-1+ICOS+ T cells (Figure 6C). In addition, CXCR5−PD-1+ICOS+ T cells showed decreased expression of other TFH-related genes, including BCL6 and its upstream regulator IKZF3 (Read et al., 2017), as well as key molecules necessary for stable T cell:B cell interaction, SLAM Associated Protein/SH2 Domain Protein 1A (SH2D1A), and CD40LG (Armitage et al., 1992; Qi et al., 2008). Instead, Th1-associated genes TBX21, RUNX3, and ID2 were elevated in CXCR5−PD-1+ICOS+ T cells (Djuretic et al., 2007; Shaw et al., 2016; Szabo et al., 2000). The list of differentially expressed pathways was also notable for migration-related processes. The transcript level of sphingosine-1-phosphate receptor 1 (S1PR1) receptor and its upstream regulator KLF2 were both increased in CXCR5−PD-1+ICOS+ T cells compared to TFH cells (Skon et al., 2013). In addition, CXCR5−PD-1+ICOS+ T cells expressed high levels of genes encoding adhesion molecules, ITGB1 and SELPLG, as well as pro-inflammatory chemokine receptors that mediate migration to sites of inflammation, including CCR2, CXCR6, CCR5, CCR9, and CCR10. In spite of global transcriptomic similarities between CXCR5−PD-1+ICOS+ T cells and TFH cells, CXCR5−PD-1+ICOS+ T cells were more similar to CXCR5−PD-1−ICOS− and naive T cells in a targeted analysis of genes encoding trafficking-related receptors and showed the strongest upregulation of CCR5, CXCR6, and CCR2 compared to the other CD4+ T cell subsets (Figures 6D and S7). These results indicate that CXCR5−PD-1+ICOS+ T cells are transcriptionally similar to TFH cells on a global level but differed from TFH cells by the upregulation of genes involved in cellular trafficking and a shifting balance between Th1 and TFH transcriptional programs.
Figure 6. CXCR5−PD-1+ICOS+ T Cells from HIV-Infected LNs Exhibit a Distinct Gene Expression Profile.

(A) Principal-component analysis of RNA-seq data from different CD4+ T cell subsets.
(B) A list of Gene Ontologies based on significantly variant genes compared between CXCR5−PD-1+/CXCR5+PD-1+ T cells called by both GSEA and GOrilla. Normalized enrichment score (NES) and false discovery rate (FDR) were generated from GSEA. A positive enrichment score indicates gene set enrichment in CXCR5−PD-1+ICOS+ T cells.
(C) Volcano plot for comparison between TFH cells and CXCR5−PD-1+ICOS+ cells. The differentially expressed genes were defined with cutoff adjusted p value < 0.05, log2 |foldchange| > 1.5.
(D) Heatmap representing differentially expressed trafficking-related receptors in 4 cell subsets. Gene expression values were normalized and scaled with DESeq2.
Also see Figure S7.
CXCR5−PD-1+ICOS+ T Cells Express a Migratory Gene Program and Contribute to CXCR5−PD-1+ICOS+ T Cells in the Peripheral Blood
Because the transcriptional signatures of CXCR5−PD-1+ICOS+ T cells is dominated by migration-related genes, including the G-protein coupled receptor S1PR1 required for lymphocyte egress (Cyster and Schwab, 2012), we hypothesized that CXCR5−PD-1+ICOS+ T cells in the LNs contribute to a circulating pool of CXCR5−PD-1+ICOS+ T cells in the blood. To test this, we sorted CXCR5−PD-1+ICOS+ T cells from peripheral blood mononuclear cells (PBMCs) and compared TCR sequences from PBMC and LN cells from the same donors (Figure S5C). We hypothesized that we could capture identical TCR sequences in distinct compartments if there is trafficking of cells between blood and LNs. A comparison of the TCR repertoires showed the similarity index were indeed the highest between the TCR repertoires of blood and LN-derived CXCR5−PD-1+ICOS+ T cells (Figures 7A and 7B). In addition, TCRs expressed by circulating CXCR5−PD-1+ICOS+ T cells also shared a significant overlap with the TCRs expressed by TFH cells in the LN, suggesting a direct or indirect contribution from the TFH cells.
Figure 7. CXCR5−PD-1+ICOS+ T Cells in the Blood Are Clonal Relatives of Cells in the LNs.

(A) Circos plots of TCR sequence overlap among different populations. Each thin slice of the arc represents a unique TCR sequence. Each plot represents data from one individual.
(B) Bhattacharyya coefficient measurement for the TCR repertoire similarity between CXCR5−PD-1+ICOS+ T cells in the PBMC and the indicated T cell subsets from the LN. Similarity with naive cells was used as the baseline for comparison (n = 6).
(C) Correlation between CXCR5−PD-1+ICOS+ T cells in the PBMC versus different LN subsets (n = 12 paired PBMC and LNs).
(D) Correlation between CXCR5−PD-1+ICOS+ T cells in the PBMC and CD4:CD8 ratio. Data are from 12 HIV+ patients.
(E) Sorted CD4+ T cell subsets from the PBMCs of HIV-infected individuals were cultured with B cells in the presence of SEB for 7 days. Plots show representative staining for plasma cells in cocultures.
(F) Scatterplot quantifies IgG level and plasma cell number in cocultures with naive T cells (n = 11), CXCR5−PD-1−ICOS− T cells (n = 10), CXCR5−PD-1+ICOS+ T cells (n = 9), or cTFH cells (n = 7).
For (B), Friedman test was performed and corrected using Dunn’s multiple comparisons test. For (C) and (D), association was measured by Pearson correlation.
For (F), Kruskal-Wallis test was performed and corrected using Dunn’s multiple comparisons test. Data are represented as mean ± SEM.
Next, we quantified the frequency of CXCR5−PD-1+ICOS+ T cells in PBMC and compared it with different T cell subsets in the LN. We found that relatedness by TCR repertoire sequencing predicted shared abundance across compartments. For example, the abundance of circulating CXCR5−PD-1+ICOS+ T cells correlated with that of CXCR5−PD-1+ICOS+ T cells and TFH cells in the LN. In contrast, the frequency of CXCR5−PD-1+ICOS+ T cells in the blood did not correlate with the frequency of lymphoid CXCR5−PD-1−ICOS− T cells, with which there was little TCR overlap (Figure 7C). The circulating CXCR5−PD-1+ICOS+ population also showed similar clinical correlation as CXCR5−PD-1+ICOS+ T cells in the LN and was associated with peripheral CD4+ T cell depletion during chronic HIV infection (Figure 7D). Collectively, these data suggest that changes detected in the PBMC were reflective of the related populations in the LN.
To determine if CXCR5−PD-1+ICOS+ T cells isolated from the PBMC can also modulate B cell responses, naive, CXCR5−PD-1−ICOS−, CXCR5−PD-1+ICOS+, or CXCR5+PD-1+ICOS+ (cTFH) cells were sorted from PBMCs and cocultured with B cells in the presence of SEB. Consistent with past studies, the CXCR5+ subset in the PBMCs provided B cell help (Locci et al., 2013; Morita et al., 2011) (Figures 7E and 7F). We also found a significantly higher level of antibody production and plasma cell differentiation by B cells in the presence of PBMC-derived CXCR5−PD-1+ICOS+ T cells. Taken together, these data link CXCR5−PD-1+ICOS+ T cells in the LN with cells in the blood and suggest that a migratory CXCR5− T cell population from the LN contribute to the B cell help functionality in the PBMCs.
DISCUSSION
According to the prevailing model of TFH cell differentiation, CXCR5 is expressed in early TFH cells, and it remains expressed during progressive stages of TFH cell differentiation (Crotty, 2014). CD4+ T cells in the LNs that lacked CXCR5 expression have generally been categorized as non-TFH cells. The focus on CXCR5 as a key TFH cell marker is explained by its critical role in guiding T cells to the B cell zone to promote B cell differentiation and affinity maturation (Arnold et al., 2007; Haynes et al., 2007). CXCR5 is also the major marker used to identify circulating TFH cells in the blood (Bentebibel et al., 2013; Chevalier et al., 2011; He et al., 2013; Locci et al., 2013; Morita et al., 2011; Vella et al., 2019). The link between blood and LN-derived CXCR5+ T cells is supported by data from Heit et al., (2017), which utilized TCR sequencing to demonstrate shared clonal relationship between CXCR5+PD-1+ T cells in the blood and TFH cells from the tonsils of matched donors. A recent study by Vella et al. (2019) further showed that CXCR5+ TFH cells can traffic into blood via the thoracic duct. By analyzing primary LNs obtained from a cohort of mostly untreated HIV+ patients as an effort to understand T cell activation in the lymphoid environment, we provided evidence for an alternative differentiation state that gives rise to a migratory population of TFH-cell-related CXCR5− T cells during chronic inflammation.
The existence of CXCR5− CD4+ T cell subset that displayed TFH-cell-like features has been previously described by Perreau et al. (2013). Using LN cells from HIV-infected patients, Perreau et al. (2013) highlighted TFH cells as a viral reservoir of HIV infection, but intriguingly the same dataset also showed the accumulation of a CXCR5−PD-1+ population that was enriched for HIV-specific T cells, produced IL-21, and exhibited B cell helper activity in vitro. Our data build on these earlier observations to elucidate the functional relevance of activated CXCR5−PD-1+ICOS+ T cells and their relationship to other CD4+ T cells within LNs. We had initially hypothesized that CXCR5−PD-1+ICOS+ T cells in HIV-infected LNs reflected T cell exhaustion from chronic antigen stimulation. While CXCR5−PD-1+ICOS+ T cells indeed expressed higher levels of co-inhibitory receptors, these T cells retained the ability to produce cytokines, including IL-21. CXCR5−PD-1+ICOS+ T cells, including those that were HIV specific, also displayed functional capacity to promote plasma cell differentiation and antibody production in vitro. Because CXCR5−PD-1+ICOS+ T cells exhibited Th1-skewed functional characteristics, we further investigated whether accumulation of CXCR5−PD-1+ICOS+ T cells in inflamed LNs was associated with an increase in T-bet+ B cells. T-bet+ B cells mediate effective viral clearance in murine models of chronic infection (Barnett et al., 2016; Rubtsova et al., 2013). In humans, the contribution of T-bet+ B cells to anti-viral protection is less clear, but these B cells accumulate in the PBMCs of HIV-infected individuals and encompass the majority of measurable anti-Env B cell responses during HIV infection (Knox et al., 2017; Moir et al., 2008). The correlation between the frequencies of T-bet+ B cells and IFN-γ-producing CXCR5−PD-1+ICOS+ T cells in our dataset suggests the possibility that CXCR5−PD-1+ICOS+ T cells may promote B cell differentiation toward the T-bet+ subset, which will require experimental validation in future studies.
Several lines of evidence suggested that CXCR5−PD-1+ICOS+ and TFH cells share a common clonal lineage. First, ATAC-seq analyses showed a similar epigenetic landscape between CXCR5−PD-1+ICOS+ T cells and TFH cells and revealed an accessible open chromatin state around CXCR5 promoter region for CXCR5−PD-1+ICOS+ T cells; second, the TCR repertoire from CXCR5−PD-1+ICOS+ T cells overlapped with the repertoire of TFH cells, with identical TCR beta chain (TCRβ) complementarity-determining region 3 (CDR3) sequences found in both CXCR5+ and CXCR5− subsets; and third, CXCR5 expression became downregulated by T cell activation in vitro. The parsimonious explanation for our data is that activation-dependent downregulation of CXCR5 on TFH cells led to the accumulation of CXCR5−PD-1+ICOS+ T cells. Flexibility in CXCR5 expression is consistent with studies in mice that showed the emergence of a small population of CXCR5− effectors after lymphocytic choriomeningitis virus (LCMV) infection from adoptively transferred antigen-specific CXCR5+ T cells (Hale et al., 2013). The open chromatin state around CXCR5 promoter further indicates that CXCR5−PD-1+ICOS+ T cells remain permissible for CXCR5 expression and suggest the potential for reversibility of CXCR5 expression in CXCR5− T cells. Our data do not rule out the possibility for the coexistence of additional processes that may be non-TFH-cell related. Differences in the source of precursor cells and/or the chosen differentiation pathway may further contribute to the heterogeneity of phenotypic subsets within CXCR5−PD-1+ICOS+ T cells, which remains to be fully elucidated.
The LN-derived CXCR5− CD4+ T cells in our analyses appear phenotypically similar to a recently discovered peripheral CXCR5− CD4+ T cell population characterized by CCR2 and HLA-DR expression and have the ability to promote B cell responses (Rao et al., 2017). These cells were found to localize in close proximity to B cells in the synovial lymphoid aggregates of patients with seropositive rheumatoid arthritis and have been suggested to drive ectopic antibody responses in chronically inflamed tissues (Rao et al., 2017). Another study from Christophersen et al. (2019) identified CXCR5−PD-1+ gluten-specific T cells in the intestines and blood of patients with celiac disease. Notably, these gluten-specific T cells were enriched for CD38, HLA-DR, ICOS, and CD39 expression, which were also highly expressed by the CXCR5−PD-1+ICOS+ population in our dataset. As the majority of circulating CXCR5+ cells do not become CXCR5− in vitro (Rao et al., 2017), the origin of peripheral CXCR5−PD-1+ T cells remains unknown. Our data on LN samples linked cells in the lymphoid and peripheral compartments by demonstrating that a population of CXCR5−PD-1+ICOS+ T cells acquires a migratory program in chronically inflamed LNs. Movement of expanded CXCR5−PD-1+ICOS+ T cells from the LN into blood could establish a pool of circulating CXCR5− T cells that are poised for CXCR5 expression. Building on the insights generated by Rao et al. (2017) and Christophersen et al. (2019), we suggest that these lymphoid-derived circulating CXCR5− T cells likely infiltrate inflamed tissue sites, and their unique cytokine profile could further modify the quality and the potency of ectopic B cell responses.
In summary, we have uncovered an accumulation of activated CXCR5− CD4+ T cell subset marked by high PD-1 expression in HIV-infected LNs. Our results linked LN pathology to changes in circulating T cells. As chronic inflammatory state is a shared feature across infection and autoimmunity, the accumulation of CXCR5−PD-1+ICOS+ T cells in the LN may represent a general state of lymphoid dysregulation that contributes to inflammatory responses in peripheral compartments.
STAR★METHODS
LEAD CONTACT AND MATERIALS AVAILABILITY
Further information and requests for resources and reagents should be directed to and will be fulfilled by the Lead Contact, Laura F. Su (Laurasu@upenn.edu). This study did not generate new unique reagents.
EXPERIMENTAL MODEL AND SUBJECT DETAILS
Study Subjects
LNs and PBMCs were obtained from HIV+ patients undergoing excision of palpable cervical LNs for clinical diagnostic workup in Mexico. Additional PBMCs were obtained from a second cohort of patients at the University of Pennsylvania. LNs from HIV negative donors were obtained from organ transplant donors or surgical samples. Sample sizes were not pre-specified and were dictated by the availability of the samples, which were collected over four years. All samples were de-identified and obtained with IRB regulatory approval from the University of Pennsylvania. Recruitment of HIV+ Mexican study subjects was additionally approved by the Comité de Ciencia y de Ética en Investigación and the Comité de Investigación of the Instituto Nacional de Enfermedades Respiratorias (INER) in México city. Subject characteristics are shown in Table S1.
Cell culture
Cell cultures were performed using cryopreserved cells, which were thawed in RPMI media (Mediatech) containing 0.025 unit/mL of benzonase (Sigma). Please refer to individual sections below for the specific stimulation condition used for each assay. Cells were incubated in standard conditions: 37°C with 5% CO2.
METHOD DETAILS
CyTOF staining and data analyses
Cryopreserved cells were thawed, washed, and stimulated with 5ng/ml of PMA (Sigma) and 50ng/ml ionomycin (Sigma) in the presence of 2mM Monensin (Sigma) and 5ug/ml Brefeldin A (Sigma) at 37°C for 5 hours. After stimulation, cells were washed and incubated in 1uM cisplatin (Fluidigm) for 5 min, followed by staining with surface antibody cocktail for 30 minutes at room temperature (Table S2). For intracellular staining, cells were permeabilized and fixed using Foxp3 staining buffer set (eBioscience) and incubated with the intracellular antibody cocktail for 1 hour at room temperature (Table S2). Metal conjugation of CyTOF antibodies was performed according to the manufacturer protocol using the X8 Maxpar kit (Fluidigm). Antibody stained cells were mixed with normalization beads and acquired on CyTOF2. Bead standards were used to normalize CyTOF runs with the MATLAB-based Nolan lab normalizer (Finck et al., 2013). Iridium+Cisplatin− cells were excluded for doublets and beads. From each sample, equal numbers of manually gated CD19−CD3+TCRγδ−TCRαβ+CD4+ cells were downsampled, and exported using FlowJo (Treestar). Using the R package “cytofkit,” the expression values from all of the exported FCS files were arcsinh transformed and combined into a single CSV file. From this CSV file, dimensionality reduction was performed using the Python implementation of the UMAP algorithm (n = 40,000, n_neighbors = 15, metric = Euclidian, minimum distance = 0.2). The expression values of the following markers were used as the input for UMAP: CD25, IL-2, ICOS, Ki67, TCF1, PD-1, CCR7, CD45RO, CCR5, CD71, IL-4, Foxp3, CD57, perforin, CD5, granzyme B, IFN-γ, CD69, TNF-α, CD27, CXCR4, CXCR5, CD103, CCR4, CCR6, IL-13, IL-17A, CD38, and HLA-DR. The heatmap was generated using the “gplot” package in R and show the raw staining intensity of each marker after arcsinh transformation. Heatmap dendograms were clustered by Euclidean distance.
Cell sorting and staining by flow cytometry
For surface staining, cells were stained with antibody cocktails for 30 minutes at room temperature. Fixable aqua dye (ThermoFisher) staining was used for live/dead discrimination. T cell stimulation was performed as described above by adding PMA and ionomycin for 5 hours in the presence monensin and Brefeldin A. For intracellular cytokine or transcription factor staining, cells were permeabilized and fixed using Foxp3 staining buffer set and stained in permeabilization buffer according to vendor protocol (eBioscience). Samples were acquired on LSRII (BD Biosciences). For cell sorting, freshly thawed LN cells were separated into ICOS high or ICOS low subset by positive enrichment using a magnetic column (Miltenyi Biotec). See Figure S5 for the gates used for sorting T cells and B cells. Cell sorting was performed using FACSAria III (BD Biosciences). Analyses were performed using FlowJo 10.0.8 (Tree Star).
T:B coculture assays and antigen-specific analyses
Memory B cells (5,000 cells/well) were cultured with T cells (5,000 cells/well) in a V-bottom plate with media supplemented with the anti-retroviral drugs Raltegravir (1uM, Cayman Chemical) and Efavorez (1uM, Cayman Chemical). For a subset of experiments that examined stability of CXCR5 expression, TFH cells were stained with CFSE (3uM, Invitrogen) after sorting and prior to coculture. Cells were treated with DMSO, SEB (1ug/mL, Toxin Technology), or Gag and Env peptide pools (0.25ug/mL of #12425 and #12540, NIH AIDS Reagent Program). Measurements of IgG level, B and T cell phenotypes were assayed after 7 days in culture. IFN-γ level in the supernatant was measured using Luminex by the Human Immunology Core at the University of Pennsylvania. For detection of HIV-specific T cells, LN cells were incubated with 0.25ug/mL of Gag peptide pools and analyzed for OX40 and CD25 co-expression after 18 hours.
ELISA and ELISPOT assays
ELISA and ELISPOT were performed according to standard protocols with minor modifications (Rouers et al., 2017; Saletti et al., 2013). Briefly, anti-human IgG (1:100, Bethyl), pooled Gag and Env peptides (5ug/mL, #12425 and #12540 NIH AIDS Reagent Program) or recombinant Gag and Env proteins (0.4ug/mL, #7749, #11784, #12028, #13126, #12577 NIH AIDS Reagent Program) were coated on 96-well MaxiSorp-Immuno microplates (Nunc). Plate bound IgG from the culture supernatants or IgG standards (Sigma) were detected using biotinylated anti-IgG (1:2000, BD), followed by streptavidin-HRP (1:2000, Southern Biotech) and the addition of TMB substrate (Biolegend) for colorimetric readout at OD450 using the Synergy HT plate reader (Biotek). Polyclonal goat antiserum (2:1000, #38 NIH AIDS Reagent Program) was used as positive control for HIV-specificity and detected using anti-Goat Igg-HRP (1:1000, Santa Cruz Biotech). For ELISPOT, 96-well MultiScreenHTS IP Filter plates (Millipore) were coated with goat anti-human kappa/lambda (Southern Biotech), Gag/Env peptide pool (#12425 and #12540, NIH AIDS Reagent Program), or HIV-1 recombinant proteins (#7749, #11784, #12028, #13126, #12577, NIH AIDS Reagent Program) at the final concentration of 5ug/mL in PBS and blocked using RPMI 1640 containing 10% fetal calf serum (FCS). On day 5 of cocultures, B cells from each stimulation condition were equally distributed across PBS or antigen-coated wells and incubated for 6 hours at 37°C. ASC were detected using biotinylated mouse anti-human IgG antibody (1:1000, BD), followed by streptavidin-HRP (1:1000, Southern Biotech). Spots were developed using TMB substrate (Mabtech) and enumerated with an automated Immunospot S6 core analyzer and software (Cellular Technology).
TCRβ sequencing and analyses
TCR library generation and sequencing on FACS-sorted T cells was performed as previously described (Wendel et al., 2018). Briefly, FACS-sorted cells were lysed, and total RNA was purified using AllPrep DNA/RNA Micro Kit (QIAGEN). 30% of the purified RNA was used for library generation and sequencing. Consensus sequences were constructed within each molecular identifier (MID) group (Ma et al., 2018). Consensus TCR sequences were subjected to the CDR3 blast module of MIGEC (Shugay et al., 2014) to assign V and J alleles and parse out the CDR3 sequence. Bhattacharyya coefficient was used to measure TCR repertoire similarity between CXCR5−PD-1+ICOS+ T cells with other populations within LN and between CXCR5−PD-1+ICOS+ T cells in the PBMC and LN subsets (Bhattacharyya, 1943). Circos plots were generated using circlize R package to visualize clones shared between T cell subsets.
ATAC-seq and analyses
ATAC-seq was performed as previously described with minor modifications (Buenrostro et al., 2013). In brief, sorted T cells were pelleted and resuspended in 50uL lysis buffer (10 mM Tris-HCl [pH 7.4], 10 mM NaCl,3 mM MgCl2, 0.1% IGEPAL CA-630). Transposition reaction was carried out immediately in a 25uL reaction with 1.25uL of Tn5 transposase (Illumina) in a 37°C water bath for 37 minutes to tag and fragment accessible chromatin. Tagmented DNA was purified using a MinElute Reaction Cleanup Kit (QIAGEN) and amplified with 12 cycles of PCR. Libraries were purified using Agencourt AMPure XP kit (Axygen). Sample quality was determined using a Tapestation 2200 system (Agilent). Library concentrations were determined using Qubit dsDNA HS Assay Kit (Invitrogen). Libraries were paired-end sequenced on a NextSeq 550 (Illumina). All the reads are quality-trimmed with trimmomatic-0.36-5 (see Table S3). The paired-end reads were aligned to human assembly hg19 using bowtie alignment tool (bowtie2-2.3.4.1). The peaks were called using callpeaks function in MACS2. Peaks called with a q-value cutoff of 0.05 (Benjamin-Hochberg correction) were analyzed with DiffBind R package. The intervals for peak comparison were re-centered around the most enriched points with a 500-bp window. The consensus peaksets were then normalized and used as input for differential analysis by DESeq2 with a significance cutoff FDR at 0.05 (Benjamin-Hochberg correction). DiffBind was used to generate the PCA plot.
RNA sequencing and analyses
Sorted T cells were pelleted and resuspended in Buffer RLT Plus (QIAGEN) with 10% 2-Mercaptoethanol (Sigma). Total RNA from each sample was isolated using the RNeasy Plus Micro Kit (QIAGEN). RNA integrity was determined using a 2100 Bioanalyzer (Agilent). Reverse transcription and cDNA synthesis was performed using the SMART-Seq v4 Ultra Low Input RNA Kit for Sequencing (Clontech). cDNA qualities were determined by a Tapestation 2200 system (Agilent) and concentrations were determined using Qubit dsDNA HS Assay Kit (Invitrogen). DNA libraries were prepared using Nextera XT Library Prep Kit (Illumina) and sequenced on NextSeq 550 (Illumina). All the reads are quality-trimmed with trimmomatic-0.36-5. The paired-end reads were aligned to human assembly hg19 using STAR alignment tool (STAR 2.6). For finding differential expressed genes between samples, DESeq2 R packaged was used to calculate variation, with a significance cutoff padj at 0.05 (Benjamin-Hochberg correction). PCA analysis was performed using plotPCA function in DESeq2 R package. The variant genes were then submitted to GOrilla for gene ontology analysis. Gene Set Enrichment Analysis (GSEA) was performed to compare the enriched genes in CXCR5+PD-1+ / CXCR5−PD-1+ T cells. The significant hit from GSEA and Gorilla were matched to generate a list of enriched gene ontologies consistently identified by both methods. The GO list was then revised by removing redundant terms with REVIGO (Supek et al., 2011), shortening the list from 25 to 8. Scaled normalized expression values were used as input for generating supervised hierarchical clustering heatmap for differentially expressed genes that contributed to the GO terms and for generating the volcano plot.
QUANTIFICATION AND STATISTICAL ANALYSIS
Assessment of normality was performed using D’Agostino-Pearson test. Pearson or Spearman correlation was used depending on the normality of the data to measure the degree of association. The best-fitting line was calculated using least-squares fit regression. Statistical comparisons were performed using two-tailed Student’s t test, Mann-Whitney U test, or Wilcoxon signed-rank test, using a p value of < 0.05 as a cutoff to determine statistical significance. Multiple-way comparisons were performed using ANOVA or nonparametric tests (Friedman test for matched measures or Kruskal-Wallis test for unmatched measures). Statistical analyses were performed using GraphPad Prism. Lines and bars represent mean, variability is represented by standard error of the mean (SEM). * p < 0.05; ** p < 0.005; *** p < 0.0005. **** p < 0.0005.
DATA AND CODE AVAILABILITY
The data for this study have been deposited in the database dbGAP under accession number phs001548.v1.p1 (dbGAP: phs001548.v1.p1).
Supplementary Material
KEY RESOURCES TABLE
| REAGENT or RESOURCE | SOURCE | IDENTIFIER |
|---|---|---|
| Antibodies | ||
| anti-human ICOS, APC, clone C398.4A | Biolegend | Cat# 313510; RRID:AB_416334 |
| anti-human PD1, BV785, clone: EH12.2H7 | Biolegend | Cat# 329930; RRID:AB_2563443 |
| anti-human CXCR5, PE/Dazzle 594, clone J252D4 | Biolegend | Cat# 356928; RRID:AB_2563689 |
| anti-human CD19, PE/cy5, clone HIB19 | Biolegend | Cat# 302210; RRID:AB_314240 |
| anti-human CD45RO, BV421, clone UCHL1 | Biolegend | Cat# 304224; RRID:AB_2563817 |
| anti-human CD45RA, PE, clone HI100 | Biolegend | Cat# 304146; RRID:AB_2564079 |
| anti-human CD4, FITC, clone OKT4 | Biolegend | Cat# 317408; RRID:AB_571951 |
| anti-human CD27, APC/Fire 750, clone M-T271 | Biolegend | Cat# 356428; RRID:AB_2616711 |
| anti-human CCR7, PE/Cy7, clone G043H7 | Biolegend | Cat# 353226; RRID:AB_11126145 |
| anti-human CD3, AF700, clone UCHT1 | Biolegend | Cat# 300424; RRID:AB_493741 |
| anti-human CD8, BV605, clone RPA-T8 | Biolegend | Cat# 301040; RRID:AB_2563185 |
| anti-human CD20, BV650, clone 2H7 | Biolegend | Cat# 302336; RRID:AB_2563806 |
| anti-human IgD, BV605, clone IA6-2 | Biolegend | Cat# 348232; RRID:AB_2563337 |
| anti-human CD3, FITC, clone UCHT1 | Biolegend | Cat# 300440; RRID:AB_2562046 |
| anti-human CD4, PE, clone OKT4 | Biolegend | Cat# 317410; RRID:AB_571955 |
| anti-human CD38, PE/Cy7, clone HIB7 | Biolegend | Cat# 356608; RRID:AB_2561904 |
| anti-human CD38, AF700, clone HIB7 | Biolegend | Cat# 303524; RRID:AB_2072781 |
| anti-human CD40L, PE/Cy7, clone 24-31 | Biolegend | Cat# 310832; RRID:AB_2563017 |
| anti-human TIM3, SuperBright 702, clone F38-2E2 | eBioscience | Cat# 67-5870-82; RRID:AB_2744892 |
| anti-human CD39, APC/Cy7, clone A1 | Biolegend | Cat# 303534; RRID:AB_2561605 |
| anti-human TIGIT, PE, clone A15153G | Biolegend | Cat# 372704; RRID:AB_2632730 |
| anti-human 2b4, PerCP/Cy5.5, clone C1.7 | Biolegend | Cat# 329516; RRID:AB_10919138 |
| anti-human PD1, BV605, clone EH12.2H7 | Biolegend | Cat# 329924; RRID:AB_2563212 |
| anti-human CD45RO, BV785, clone UCHL1 | Biolegend | Cat# 304234; RRID:AB_2563819 |
| anti-human CD84, FITC, clone CD84.1.21 | Invitrogen | Cat# A15762; RRID:AB_2534542 |
| anti-human CCR2, PE/Cy7, clone K036C2 | Biolegend | Cat# 357212; RRID:AB_2562619 |
| anti-human ICOS, PE, clone C398.4A | Biolegend | Cat# 313508; RRID:AB_416332 |
| anti-human HLA-DR, APC, clone L234 | Biolegend | Cat# 307610; RRID:AB_314688 |
| anti-human CD3, APC/Cy7, clone UCHT1 | Biolegend | Cat# 300426; RRID:AB_830755 |
| anti-human CD4, BV650, clone OKT4 | Biolegend | Cat# 317436; RRID:AB_2563050 |
| anti-human BCL6, BV421, clone K112-91 | BD | Cat# 563363; RRID:AB_2738159 |
| anti-human c-Maf, PerCP-eFluor 710, clone sym0F1 | Invitrogen | Cat# 46-9855-42; RRID:AB_2573908 |
| anti-human Ox40, PerCP/Cy5.5, clone Ber-ACT35 (ACT35) | Biolegend | Cat# 350018; RRID:AB_2571938 |
| anti-human CD25, BV650, clone BC96 | Biolegend | Cat# 302634; RRID:AB_2563807 |
| anti-human CD3, BV605, clone UCHT1 | Biolegend | Cat# 300460; RRID:AB_2564380 |
| anti-human TCR gamma/delta, PE, clone 5A6.E9 | Invitrogen | Cat# MHGD04; RRID:AB_10374518 |
| anti-Human IgG-F(ab’)2 Fragment cross-adsorbed Antibody, polyclonal | Bethyl | Cat# A80-249A; RRID:AB_10630752 |
| anti-human IgG, Biotinylated, clone G18-145 | BD | Cat# 555785; RRID:AB_396120 |
| anti-human IgM, PerCP/Cy5.5, clone MHM-88 | Biolegend | Cat# 314512; RRID:AB_2076098 |
| anti-human IgG, APC, clone M1310G05 | Biolegend | Cat# 410712; RRID:AB_2565790 |
| anti-human CD11c, BV421, clone 3.9 | BD | Cat# 565806 |
| anti-human CD85j, PE/Cy7, clone GHI/75 | Biolegend | Cat# 333712; RRID:AB_2564606 |
| anti-human Tbet, PE, clone 4B10 | Biolegend | Cat# 644810; RRID:AB_2200542 |
| anti-human Kappa, Unconjugated, polyclonal | Southern Biotech | Cat# 2060-01; RRID:AB_2795716 |
| anti-human Lambda, Unconjugated, polyclonal | Southern Biotech | Cat# 2070-01; RRID:AB_2795749 |
| anti-human CD57, clone HCD57 | Biolegend | Cat# 322325; RRID:AB_2563757 |
| anti-human CD3, clone UCHT1 | Biolegend | Cat# 300402; RRID:AB_314056 |
| anti-human CD5, clone UCHT2 | Biolegend | Cat# 300602; RRID:AB_314088 |
| anti-human CD8, clone SK1 | Biolegend | Cat# 344702; RRID:AB_1877104 |
| anti-human CD4, clone SK3 | Biolegend | Cat# 344602; RRID:AB_1937277 |
| anti-human CD19, clone HIB19 | Biolegend | Cat# 302202; RRID:AB_314232 |
| anti-human Granzyme B, clone CLB-GB11 | eBioscience | Cat# MA1-10338; RRID:AB_11154492 |
| anti-human IFNg, clone 4S.B3 | eBioscience | Cat# 14-7319-81; RRID:AB_468477 |
| anti-human HLA-DR, clone L243 | Biolegend | Cat# 307602; RRID:AB_314680 |
| anti-human CD14, clone M5E2 | Biolegend | Cat# 301802; RRID:AB_314184 |
| anti-human CD69, clone FN50 | Biolegend | Cat# 310902; RRID:AB_314837 |
| anti-human CD38, clone HB-7 | Biolegend | Cat# 356602; RRID:AB_2561794 |
| anti-human TNFa, clone MAb11 | Biolegend | Cat# 502902; RRID:AB_315254 |
| anti-human CD45RO, clone UCHL1 | Biolegend | Cat# 304202; RRID:AB_314418 |
| anti-human CD27, clone LG.7F9 | eBioscience | Cat# 14-0271-82; RRID:AB_467183 |
| anti-human TCRab, clone T10B9.1A-31 | BD | Cat# 555546; RRID:AB_395930 |
| anti-human CCR5, clone J418F1 | Biolegend | Cat# 359102; RRID:AB_2562457 |
| anti-human CD71, clone CY1G4 | Biolegend | Cat# 334102; RRID:AB_1134247 |
| anti-human CXCR4, clone 12G5 | Biolegend | Cat# 306502; RRID:AB_314608 |
| anti-human IL4, clone 8D4-8 | BD | Cat# 556917; RRID:AB_398620 |
| anti-human CD25, clone M-A251 | BD | Cat# 555430; RRID:AB_395824 |
| anti-human IL2, clone MQ1-17H12 | Biolegend | Cat# 500302; RRID:AB_315089 |
| anti-human ICOS, clone c398-4A | Biolegend | Cat# 313502; RRID:AB_416326 |
| anti-human Ki-67, clone B56 | BD | Cat# 556003; RRID:AB_396287 |
| anti-human Foxp3, clone PCH101 | eBioscience | Cat# 14-4776-82; RRID:AB_467554 |
| anti-human TCF1, clone C63D9 | Cell Signaling | Cat# 2203; RRID:AB_2199302 |
| anti-human PD1, clone EH12.2H7 | Biolegend | Cat# 329902; RRID:AB_940488 |
| anti-human CCR7, clone G043H7 | Biolegend | Cat# 353202; RRID:AB_10945157 |
| anti-human CXCR5, clone RF8B2 | BD | Cat# 552032; RRID:AB_394324 |
| anti-phycoerythrin (PE), clone PE001 | Biolegend | Cat# 408102; RRID:AB_2168924 |
| anti-human CD103, clone B-Ly7 | eBioscience | Cat# 14-1038-82; RRID:AB_467412 |
| anti-human CCR4, clone 1G1 | BD | Cat# 551121; RRID:AB_2074502 |
| anti-human CCR6, clone G034E3 | Biolegend | Cat# 353402; RRID:AB_10918625 |
| anti-human IL13, clone JES10-5A2 | Biolegend | Cat# 501902; RRID:AB_315197 |
| anti-human Perforin, clone DG9 | Biolegend | Cat# 308102; RRID:AB_314700 |
| anti-human IL17A, clone BL168 | Biolegend | Cat# 512302; RRID:AB_961399 |
| mouse anti-goat IgG-HRP | Santa Cruz Biotec | Cat# sc-2354; RRID:AB_628490 |
| Anti-HIV-1 IIIB gp120 Polyclonal goat serum | NIH AIDS Reagent Program | Cat# 38 |
| Biological Samples | ||
| LN and PBMC samples, see Table S1 | This paper | N/A |
| Chemicals, Peptides, and Recombinant Proteins | ||
| Phorbol 12-myristate 13-acetate (PMA) | Sigma-Aldrich | Cat# P8139 |
| Antibody Stabilizer | Candor | Cat# 131050 |
| Ionomycin | Sigma-Aldrich | Cat# I0634 |
| BrefeldinA | Sigma-Aldrich | Cat# B7651-5MG |
| Monesin | Sigma-Aldrich | Cat# M5273-1G |
| Iridium (Cell-ID Intercalator-Ir 500 μM) | Fluidigm | Cat# 201192B |
| Paraformaldehyde 16% | Fisher | Cat# 50-980-487 |
| TCEP | Thermofisher | Cat# PI77720 |
| Cell-ID Cisplatin | Fluidigm | Cat# 201064 |
| DPBS without Ca2+ & Mg++ | Invitrogen | Cat# 14190136 |
| FBS | Sigma-Aldrich | Cat# F2442-500ML |
| EDTA | Invitrogen | Cat# 15575020 |
| Non-essential Amino Acids | Invitrogen | Cat# 11140050 |
| Sodium Pyruvate | Invitrogen | Cat# 11360070 |
| HEPES Buffer | Invitrogen | Cat# 15630080 |
| Pen/Strep Solution | Invitrogen | Cat# 15140122 |
| RPMI | Mediatech | Cat# MT10-040-CM |
| Raltegravir | Cayman Chemical | Cat# 16071 |
| Efavorez | Cayman Chemical | Cat# 14412 |
| Staphylococcal Enterotoxin B | Toxin Technology | Cat# BT202 |
| Bovine Serum Albumin | Sigma-Aldrich | Cat# A7906 |
| Tween 20 | Sigma-Aldrich | Cat# P1379 |
| Phosphoric acid (H3PO4) | Sigma-Aldrich | Cat# Y0626-250G |
| 2-Mercaptoethanol | Sigma-Aldrich | Cat# M6250-100ML |
| Tris-HCl | Invitrogen | Cat# 15567-027 |
| NaCl | Sigma-Aldrich | Cat# S5886-1KG |
| MgCl2 | Sigma-Aldrich | Cat# M8266-100G |
| IGEPAL CA-630 | Sigma-Aldrich | Cat# I8896-50ML |
| Gag peptide pool | NIH AIDS Reagent Program | Cat# 12425 |
| Env peptide pool | NIH AIDS Reagent Program | Cat# 12540 |
| HIV-1 CN54 GP120 Recombinant protein | NIH AIDS Reagent Program | Cat# 7749 |
| HIV-1 IIIB gp120 Recombinant protein | NIH AIDS Reagent Program | Cat# 11784 |
| HIV-1 IIIB p24 Recombinant protein | NIH AIDS Reagent Program | Cat# 12028 |
| HIV-1 HXB2 p24 Recombinant protein | NIH AIDS Reagent Program | Cat# 13126 |
| HIV-1 gp140 Recombinant protein | NIH AIDS Reagent Program | Cat# 12577 |
| Critical Commercial Assays | ||
| LIVE/DEAD Fixable Aqua Dead Cell Stain Kit | Invitrogen | Cat# L34957 |
| FoxP3 Transcription factor staining kit | Thermofisher | Cat# A25866A |
| Maxpar X8 Multimetal Labeling Kit | Fluidigm | Cat# 201300 |
| EQ Four Element Calibration Beads | Fluidigm | Cat# 201078 |
| Anti-APC MicroBeads | Miltenyi | Cat# 130-090-855 |
| LS Columns | Miltenyi | Cat# 130-042-401 |
| MACS MultiStand | Miltenyi | Cat# 130-042-303 |
| QuadroMACS Separator | Miltenyi | Cat# 130-090-976 |
| CellTrace CFSE Cell Proliferation Kit | Invitrogen | Cat# C34554 |
| SA-HRP | Southern Biotech | Cat# 7100-05 |
| TMB Substrate Set | Biolegend | Cat# 421101 |
| Buffer RLT Plus | QIAGEN | Cat# 1053393 |
| RNeasy Plus Micro Kit | QIAGEN | Cat# 74034 |
| Arcturus Picopure RNA Isolation Kit | Applied Biosystems | Cat# KIT0204 |
| SMART-Seq® v4 Ultra® Low Input RNA Kit for Sequencing | Takara | Cat# 634894 |
| Qubit dsDNA HS Assay Kit | Invitrogen | Cat# Q32851 |
| Nextera XT Library Prep Kit | Illumina | Cat# FC-131-1096 |
| Nextseq 500/550 High Output Kit v2 (75 cycles) | Illumina | Cat# FC-404-2005 |
| Agencourt AMPure XP kit | Beckman Coulter | Cat# A63880 |
| Nextera DNA Library Prep Kit | Illumina | Cat# FC-121-1030 |
| MinElute Reaction Cleanup Kit | QIAGEN | Cat# 28204 |
| Agencourt AMPure XP kit | Beckman Coulter | Cat# A63880 |
| Nextseq 500/550 High Output Kit v2 (75 cycles) | Illumina | Cat# FC-404-2005 |
| Allprep DNA/RNA micro kit | QIAGEN | Cat# 80284 |
| Superscript III Reverse Transcriptase | Invitrogen | Cat# 18080093 |
| Exonuclease I | New England Biolabs | Cat# M0293S |
| Takara Ex Taq HS DNA Polymerase | Clontech | Cat# RR006B |
| MiniElute Reaction Cleanup Kit | QIAGEN | Cat# 28204 |
| E-Gel NGS 0.8% Agarose Gels | Invitrogen | Cat# A25798 |
| TMB substrate | Mabtech | Cat# 3651-10 |
| Deposited Data | ||
| dbGAP | This paper | phs001548.v1.p1 |
| Oligonucleotides | ||
| TCR sequencing primers, see Table S4 | This paper | N/A |
| Software and Algorithms | ||
| Synergy HT Plate Reader | Biotek | 7091000 |
| FlowJo v10.0.8 | Treestar | N/A |
| GraphPad Prism v6.0c | https://www.graphpad.com/ | N/A |
| Cytof Bead Normalizer | Finck et al., 2013 | N/A |
| Cytofkit | Chen et al., 2016 | https://www.ncbi.nlm.nih.gov/pubmed/27662185 |
| gplots | https://rdrr.io/cran/gplots/ | |
| UMAP | Becht et al., 2018 | https://arxiv.org/pdf/1802.03426.pdf |
| Immunospot S6 core analyzer | Cellular Technology | N/A |
| MIGEC | Shugay et al., 2014 | https://www.nature.com/articles/nmeth.2960 |
| Circlize | Gu et al., 2014 | https://www.ncbi.nlm.nih.gov/pubmed/24930139 |
| trimmomatic-0.36-5 | Bolger et al., 2014 | https://www.ncbi.nlm.nih.gov/pmc/articles/PMC4103590/ |
| bowtie2-2.3.4.1 | Langmead and Salzberg, 2012 | https://www.ncbi.nlm.nih.gov/pmc/articles/PMC3322381/ |
| DiffBind | http://bioconductor.org/packages/release/bioc/html/DiffBind.html | |
| DESeq2 | Love et al., 2014 | https://genomebiology.biomedcentral.com/articles/10.1186/s13059-014-0550-8 |
| STAR 2.6 | Dobin and Gingeras, 2015 | https://currentprotocols.onlinelibrary.wiley.com/doi/abs/10.1002/0471250953.bi1114s51 |
| GOrilla | Eden et al., 2009 | https://bmcbioinformatics.biomedcentral.com/articles/10.1186/1471-2105-10-48 |
| REVIGO | Supek et al., 2011 | https://journals.plos.org/plosone/article?id=10.1371/journal.pone.0021800 |
| GSEA | Subramanian et al., 2015 | https://www.pnas.org/cgi/content/abstract/102/43/15545 |
| MACS2 | Zhang et al., 2008 | https://genomebiology.biomedcentral.com/articles/10.1186/gb-2008-9-9-r137 |
| DiffBind | Stark and Brown, 2011 | http://bioconductor.org/packages/release/bioc/vignettes/DiffBind/inst/doc/DiffBind.pdf |
| Other | ||
| Amicon 30kDa Ultrafiltraition spin columns | Millipore | Cat# UFC503096 |
| Amicon 3kDa Ultrafiltraition spin columns | Millipore | Cat# UFC500396 |
| Falcon Tube with Cell Strainer Cap | Fisher | Cat# 877123 |
| OneComp eBeads | eBioscience | Cat# 01-1111-41 |
| V-bottom 96 well plate | Greiner | Cat# 651-180 |
| Maxisorp Immuno plates | Nunc | Cat# 460984 |
| DNA LoBind Tubes | Eppendorf | Cat# 022431021 |
| 96-well MultiScreen IP filter plates | Millipore | Cat# MSIPN4510 |
Highlights.
High-dimensional profiling of CD4+ T cells in HIV-infected lymph nodes
A subset of CXCR5− CD4+ T cells in lymph nodes are clonally related to TFH cells
CXCR5−PD-1+ICOS+ CD4+ T cells exhibit TFH-like functional features
TFH-like CXCR5− T cells contribute to circulating T cells with B cell help function
ACKNOWLEDGMENTS
We thank Dr. Ke-Yue Ma for helping with TCR sequencing run. We also thank the NIH AIDS Reagent Program and Penn Center for AIDS Research (P30 AI 045008) for providing reagents and samples. Thanks also to the Human Pancreas Analysis Program (HPAP) and Cooperative Human Tissue Network (CHTN) for providing LN cells from non-HIV-infected donors. This work was supported by Veterans Affairs (VA) Merit Award IMMA-020-15F (L.F.S.); NIH R01AI134879 (L.F.S.) and R00AG040149 and S10OD020072 (N.J.); and the Welch Foundation grant F1785 (N.J.).
Footnotes
SUPPLEMENTAL INFORMATION
Supplemental Information can be found online at https://doi.org/10.1016/j.celrep.2019.08.037.
DECLARATION OF INTERESTS
N.J. is a scientific advisor for ImmuDX, LLC, and Immune Arch, Inc. All other authors declare no competing interests.
REFERENCES
- Armitage RJ, Fanslow WC, Strockbine L, Sato TA, Clifford KN, Macduff BM, Anderson DM, Gimpel SD, Davis-Smith T, Maliszewski CR, et al. (1992). Molecular and biological characterization of a murine ligand for CD40. Nature 357, 80–82. [DOI] [PubMed] [Google Scholar]
- Arnold CN, Campbell DJ, Lipp M, and Butcher EC (2007). The germinal center response is impaired in the absence of T cell-expressed CXCR5. Eur. J. Immunol 37, 100–109. [DOI] [PubMed] [Google Scholar]
- Balagopal A, Asmuth DM,Yang WT, Campbell TB, Gupte N, Smeaton L, Kanyama C, Grinsztejn B, Santos B, Supparatpinyo K, et al. ; ACTG PEARLS and NWCS 319 Study team (2015). Pre-cART Elevation of CRP and CD4+ T-Cell Immune Activation Associated With HIV Clinical Progression in a Multinational Case-Cohort Study. J. Acquir. Immune Defic. Syndr 70, 163–171. [DOI] [PMC free article] [PubMed] [Google Scholar]
- Barnett BE, Staupe RP, Odorizzi PM, Palko O, Tomov VT, Mahan AE, Gunn B, Chen D, Paley MA, Alter G, et al. (2016). Cutting Edge: B Cell-Intrinsic T-bet Expression Is Required To Control Chronic Viral Infection. J. Immunol 197, 1017–1022. [DOI] [PMC free article] [PubMed] [Google Scholar]
- Bauquet AT, Jin H, Paterson AM, Mitsdoerffer M, Ho IC, Sharpe AH, and Kuchroo VK (2009). The costimulatory molecule ICOS regulates the expression of c-Maf and IL-21 in the development of follicular T helper cells and TH-17 cells. Nat. Immunol 10, 167–175. [DOI] [PMC free article] [PubMed] [Google Scholar]
- Becht E, McInnes L, Healy J, Dutertre CA, Kwok IWH, Ng LG, Ginhoux F, and Newell EW (2018). Dimensionality reduction for visualizing single-cell data using UMAP. Nat. Biotechnol [DOI] [PubMed] [Google Scholar]
- Bentebibel SE, Lopez S, Obermoser G, Schmitt N, Mueller C, Harrod C, Flano E, Mejias A, Albrecht RA, Blankenship D, et al. (2013). Induction of ICOS+CXCR3+CXCR5+ TH cells correlates with antibody responses to influenza vaccination. Sci. Transl. Med 5, 176ra32. [DOI] [PMC free article] [PubMed] [Google Scholar]
- Bhattacharyya A (1943). On a measure of divergence between two statistical populations defined by their probability distribution. Bull. Calcutta Math. Soc 35, 99–110. [Google Scholar]
- Biancotto A, Grivel JC, Iglehart SJ, Vanpouille C, Lisco A, Sieg SF, Debernardo R, Garate K, Rodriguez B, Margolis LB, and Lederman MM (2007). Abnormal activation and cytokine spectra in lymph nodes of people chronically infected with HIV-1. Blood 109, 4272–279. [DOI] [PMC free article] [PubMed] [Google Scholar]
- Bolger AM, Lohse M, and Usadel B (2014). Trimmomatic: a flexible trimmer for Illumina sequence data. Bioinformatics 30, 2114–2120. [DOI] [PMC free article] [PubMed] [Google Scholar]
- Buenrostro JD, Giresi PG, Zaba LC, Chang HY, and Greenleaf WJ (2013). Transposition of native chromatin for fast and sensitive epigenomic profiling of open chromatin, DNA-binding proteins and nucleosome position. Nat. Methods 10, 1213–1218. [DOI] [PMC free article] [PubMed] [Google Scholar]
- Cannons JL, Qi H, Lu KT, Dutta M, Gomez-Rodriguez J, Cheng J, Wakeland EK, Germain RN, and Schwartzberg PL (2010). Optimal germinal center responses require a multistage T cell:B cell adhesion process involving integrins, SLAM-associated protein, and CD84. Immunity 32, 253–265. [DOI] [PMC free article] [PubMed] [Google Scholar]
- Chen H, Lau MC, Wong MT, Newell EW, Poidniger M, and Chen J (2016). Cytofkit: A Bioconductor Package for an Integrated Mass Cytometry Data Analysis Pipeline. PLoS Comput. Biol 12, e1005112. [DOI] [PMC free article] [PubMed] [Google Scholar]
- Chevalier N, Jarrossay D, Ho E, Avery DT, Ma CS, Yu D, Sallusto F, Tangye SG, and Mackay CR (2011). CXCR5 expressing human central memory CD4 T cells and their relevance for humoral immune responses. J. Immunol 186, 5556–5568. [DOI] [PubMed] [Google Scholar]
- Christophersen A, Lund EG, Snir O, Sola E, Kanduri C, Dahal-Koirala S, Zuhlke S, Molberg O, Utz PJ, Rohani-Pichavant M, et al. (2019). Distinct phenotype of CD4(+) T cells driving celiac disease identified in multiple autoimmune conditions. Nat Med. 25, 734–737. [DOI] [PMC free article] [PubMed] [Google Scholar]
- Crawford A, Angelosanto JM, Kao C, Doering TA, Odorizzi PM, Barnett BE, and Wherry EJ (2014). Molecular and Transcriptional Basis of CD4(+) T Cell Dysfunction during Chronic Infection. Immunity 40, 289–302. [DOI] [PMC free article] [PubMed] [Google Scholar]
- Crotty S (2014). T follicular helper cell differentiation, function, and roles in disease. Immunity 41, 529–542. [DOI] [PMC free article] [PubMed] [Google Scholar]
- Crum-Cianflone NF, Iverson E, Defang G, Blair PJ, Eberly LE, Maguire J, Ganesan A, Faix D, Duplessis C, Lalani T, et al. (2011). Durability of antibody responses after receipt of the monovalent 2009 pandemic influenza A (H1N1) vaccine among HIV-infected and HIV-uninfected adults. Vaccine 29, 3183–3191. [DOI] [PMC free article] [PubMed] [Google Scholar]
- Cubas RA, Mudd JC, Savoye AL, Perreau M, van Grevenynghe J, Metcalf T, Connick E, Meditz A, Freeman GJ, Abesada-Terk G Jr., et al. (2013). Inadequate T follicular cell help impairs B cell immunity during HIV infection. Nat. Med 19, 494–99. [DOI] [PMC free article] [PubMed] [Google Scholar]
- Cyster JG, and Schwab SR (2012). Sphingosine-1-phosphate and lymphocyte egress from lymphoid organs. Annu. Rev. Immunol 30, 69–94. [DOI] [PubMed] [Google Scholar]
- Dan JM, Lindestam Arlehamn CS, Weiskopf D, da Silva Antunes R, Havenar-Daughton C, Reiss SM, Brigger M, Bothwell M, Sette A, and Crotty S (2016). A Cytokine-Independent Approach To Identify Antigen-Specific Human Germinal Center T Follicular Helper Cells and Rare Antigen-Specific CD4+ T Cells in Blood. J. Immunol 197, 983–993. [DOI] [PMC free article] [PubMed] [Google Scholar]
- Danilo M, Chennupati V, Silva JG, Siegert S, and Held W (2018). Suppression of Tcf1 by Inflammatory Cytokines Facilitates Effector CD8 T Cell Differentiation. Cell Rep. 22, 2107–2117. [DOI] [PubMed] [Google Scholar]
- de Armas LR, Pallikkuth S, George V, Rinaldi S, Pahwa R, Arheart KL, and Pahwa S (2017). Reevaluation of immune activation in the era of cART and an aging HIV-infected population. JCI Insight 2, 95726. [DOI] [PMC free article] [PubMed] [Google Scholar]
- Djuretic IM, Levanon D, Negreanu V, Groner Y, Rao A, and Ansel KM (2007). Transcription factors T-bet and Runx3 cooperate to activate Ifng and silence Il4 in T helper type 1 cells. Nat. Immunol 8, 145–153. [DOI] [PubMed] [Google Scholar]
- Dobin A, and Gingeras TR (2015). Mapping RNA-seq Reads with STAR. Curr. Protoc. Bioinformatics 51, 1–19, 11.14. [DOI] [PMC free article] [PubMed] [Google Scholar]
- Eden E, Navon R, Steinfeld I, Lipson D, and Yakhini Z (2009). GOrilla: a tool for discovery and visualization of enriched GO terms in ranked gene lists. BMC Bioinformatics 10, 48. [DOI] [PMC free article] [PubMed] [Google Scholar]
- Finck R, Simonds EF, Jager A, Krishnaswamy S, Sachs K, Fantl W, Pe’er D, Nolan GP, and Bendall SC (2013). Normalization ofmass cytometry data with bead standards. Cytometry A 83, 483–494. [DOI] [PMC free article] [PubMed] [Google Scholar]
- Giorgi JV, Liu Z, Hultin LE, Cumberland WG, Hennessey K, and Detels R (1993). Elevated levels of CD38+ CD8+ T cells in HIV infection add to the prognostic value of low CD4+ T cell levels: results of 6 years of follow-up. The Los Angeles Center, Multicenter AIDS Cohort Study. J. Acquir. Immune Defic. Syndr 6, 904–912. [PubMed] [Google Scholar]
- Giorgi JV, Hultin LE, McKeating JA, Johnson TD, Owens B, Jacobson LP, Shih R, Lewis J, Wiley DJ, Phair JP, et al. (1999). Shorter survival in advanced human immunodeficiency virus type 1 infection is more closely associated with T lymphocyte activation than with plasma virus burden or virus chemokine coreceptor usage. J. Infect. Dis 179, 859–870. [DOI] [PubMed] [Google Scholar]
- Gu Z, Gu L, Eils R, Schlesner M, and Brors B (2014). circlize Implements and enhances circular visualization in R. Bioinformatics 30, 2811–2812. [DOI] [PubMed] [Google Scholar]
- Hale JS, Youngblood B, Latner DR, Mohammed AU, Ye L, Akondy RS, Wu T, Iyer SS, and Ahmed R (2013). Distinct memory CD4+ T cells with commitment to T follicular helper- and T helper 1-cell lineages are generated after acute viral infection. Immunity 38, 805–817. [DOI] [PMC free article] [PubMed] [Google Scholar]
- Havenar-Daughton C, Lee JH, and Crotty S (2017). Tfh cells and HIV bnAbs, an immunodominance model of the HIV neutralizing antibody generation problem. Immunol. Rev 275, 49–61. [DOI] [PubMed] [Google Scholar]
- Haynes NM, Allen CD, Lesley R, Ansel KM, Killeen N, and Cyster JG (2007). Role of CXCR5 and CCR7 in follicular Th cell positioning and appearance of a programmed cell death gene-1 high germinal center-associated subpopulation. J. Immunol 179, 5099–5108. [DOI] [PubMed] [Google Scholar]
- He J, Tsai LM, Leong YA, Hu X, Ma CS, Chevalier N, Sun X, Vandenberg K, Rockman S, Ding Y, et al. (2013). Circulating precursor CCR7(lo)PD-1(hi) CXCR5+ CD4+ T cells indicate Tfh cell activity and promote antibody responses upon antigen reexposure. Immunity 39, 770–781. [DOI] [PubMed] [Google Scholar]
- Heit A, Schmitz F, Gerdts S, Flach B, Moore MS, Perkins JA, Robins HS, Aderem A, Spearman P, Tomaras GD, et al. (2017). Vaccination establishes clonal relatives of germinal center T cells in the blood of humans. J. Exp. Med 214, 2139–2152. [DOI] [PMC free article] [PubMed] [Google Scholar]
- Hong JJ, Chang KT, and Villinger F (2016). The Dynamics of T and B Cells in Lymph Node during Chronic HIV Infection: TFH and HIV, Unhappy Dance Partners? Front. Immunol 7, 522. [DOI] [PMC free article] [PubMed] [Google Scholar]
- Hufert FT, van Lunzen J, Janossy G, Bertram S, Schmitz J, Haller O, Racz P, and von Laer D (1997). Germinal centre CD4+ T cells are an important site of HIV replication in vivo. AIDS 11, 849–857. [DOI] [PubMed] [Google Scholar]
- Hunt PW, Lee SA, and Siedner MJ (2016). Immunologic Biomarkers, Morbidity, and Mortality in Treated HIV Infection. J. Infect. Dis 214 (Suppl 2), S44–S50. [DOI] [PMC free article] [PubMed] [Google Scholar]
- Karim R, Mack WJ, Stiller T, Operskalski E, Frederick T, Landay A, Young MA, Tien PC, Augenbraun M, Strickler HD, and Kovacs A (2013). Association of HIV clinical disease progression with profiles of early immune activation: results from a cluster analysis approach. AIDS 27, 1473–1481. [DOI] [PMC free article] [PubMed] [Google Scholar]
- Knox JJ, Buggert M, Kardava L, Seaton KE, Eller MA, Canaday DH, Robb ML, Ostrowski MA, Deeks SG, Slifka MK, et al. (2017). T-bet+B cells are induced by human viral infections and dominate the HIV gp140 response. JCI Insight 2, 92943. [DOI] [PMC free article] [PubMed] [Google Scholar]
- Kohler SL, Pham MN, Folkvord JM, Arends T, Miller SM, Miles B, Meditz AL, McCarter M, Levy DN, and Connick E (2016). Germinal Center T Follicular Helper Cells Are Highly Permissive to HIV-1 and Alter Their Phenotype during Virus Replication. J. Immunol 196, 2711–2722. [DOI] [PMC free article] [PubMed] [Google Scholar]
- Langford SE, Ananworanich J, and Cooper DA (2007). Predictors of disease progression in HIV infection: a review. AIDS Res. Ther 4, 11. [DOI] [PMC free article] [PubMed] [Google Scholar]
- Langmead B, and Salzberg SL (2012). Fast gapped-read alignment with Bowtie2. Nat. Methods 9, 357–359. [DOI] [PMC free article] [PubMed] [Google Scholar]
- Lindqvist M, van Lunzen J, Soghoian DZ, Kuhl BD, Ranasinghe S, Kranias G, Flanders MD, Cutler S, Yudanin N, Muller MI, et al. (2012). Expansion of HIV-specific T follicular helper cells in chronic HIV infection. J. Clin. Invest 122, 3271–3280. [DOI] [PMC free article] [PubMed] [Google Scholar]
- Locci M, Havenar-Daughton C, Landais E, Wu J, Kroenke MA, Arlehamn CL, Su LF, Cubas R, Davis MM, Sette A, et al. ; International AIDS Vaccine Initiative Protocol C Principal Investigators (2013). Human circulating PD-1+CXCR3-CXCR5+ memory Tfh cells are highly functional and correlate with broadly neutralizing HIV antibody responses. Immunity 39, 758–769. [DOI] [PMC free article] [PubMed] [Google Scholar]
- Lorenzo-Redondo R, Fryer HR, Bedford T, Kim EY, Archer J, Pond SLK, Chung YS, Penugonda S, Chipman J, Fletcher CV, et al. (2016). Persistent HIV-1 replication maintains the tissue reservoir during therapy. Nature 530, 51–56. [DOI] [PMC free article] [PubMed] [Google Scholar]
- Love MI, Huber W, and Anders S (2014). Moderated estimation of fold change and dispersion for RNA-seq data with DESeq2. Genome Biol. 15, 550. [DOI] [PMC free article] [PubMed] [Google Scholar]
- Ma KY, He C, Wendel BS, Williams CM, Xiao J, Yang H, and Jiang N (2018). Immune Repertoire Sequencing using Molecular Identifiers Enables Accurate Clonality Discovery and Clone Size Quantification. Front. Immunol 9, 33. [DOI] [PMC free article] [PubMed] [Google Scholar]
- Moir S, Ho J, Malaspina A, Wang W, DiPoto AC, O’Shea MA, Roby G, Kottilil S, Arthos J, Proschan MA, et al. (2008). Evidence for HIV-associated B cell exhaustion in a dysfunctional memory B cell compartment in HIV-infected viremic individuals. J. Exp. Med 205, 1797–1805. [DOI] [PMC free article] [PubMed] [Google Scholar]
- Morita R, Schmitt N, Bentebibel SE, Ranganathan R, Bourdery L, Zurawski G, Foucat E, Dullaers M, Oh S, Sabzghabaei N, et al. (2011). Human blood CXCR5(+)CD4(+) T cells are counterparts of T follicular cells and contain specific subsets that differentially support antibody secretion. Immunity 34, 108–121. [DOI] [PMC free article] [PubMed] [Google Scholar]
- Nish SA, Zens KD, Kratchmarov R, Lin WW, Adams WC, Chen YH, Yen B, Rothman NJ, Bhandoola A, Xue HH, et al. (2017). CD4+ T cell effector commitment coupled to self-renewal by asymmetric cell divisions. J. Exp. Med 214, 39–7. [DOI] [PMC free article] [PubMed] [Google Scholar]
- Perreau M, Savoye AL, De Crignis E, Corpataux JM, Cubas R, Haddad EK, De Leval L, Graziosi C, and Pantaleo G (2013). Follicular helper T cells serve as the major CD4 T cell compartment for HIV-1 infection, replication, and production. J. Exp. Med 210, 143–156. [DOI] [PMC free article] [PubMed] [Google Scholar]
- Qi H, Cannons JL, Klauschen F, Schwartzberg PL, and Germain RN (2008). SAP-controlled T-B cell interactions underlie germinal centre formation. Nature 455, 764–769. [DOI] [PMC free article] [PubMed] [Google Scholar]
- Rao DA, Gurish MF, Marshall JL, Slowikowski K, Fonseka CY, Liu Y, Donlin LT, Henderson LA, Wei K, Mizoguchi F, et al. (2017). Pathologically expanded peripheral T helper cell subset drives B cells in rheumatoid arthritis. Nature 542, 110–114. [DOI] [PMC free article] [PubMed] [Google Scholar]
- Read KA, Powell MD, Baker CE, Sreekumar BK, Ringel-Scaia VM, Bachus H, Martin RE, Cooley ID, Allen IC, Ballesteros-Tato A, and Oestreich KJ (2017). Integrated STAT3 and Ikaros Zinc Finger Transcription Factor Activities Regulate Bcl-6 Expression in CD4+ Th Cells. J. Immunol 199, 2377–2387. [DOI] [PMC free article] [PubMed] [Google Scholar]
- Rouers A, Klingler J, Su B, Samri A, Laumond G, Even S, Avettand-Fenoel V, Richetta C, Paul N, Boufassa F, et al. ; ANRS CO21 Cohort (2017). HIV-Specific B Cell Frequency Correlates with Neutralization Breadth in Patients Naturally Controlling HIV-Infection. EBioMedicine 21, 158–169. [DOI] [PMC free article] [PubMed] [Google Scholar]
- Rubtsova K, Rubtsov AV, van Dyk LF, Kappler JW, and Marrack P (2013). T-box transcription factor T-bet, a key player in a unique type of B-cell activation essential for effective viral clearance. Proc. Natl. Acad. Sci. USA 110, E3216–E3224. [DOI] [PMC free article] [PubMed] [Google Scholar]
- Saletti G, Çuburu N, Yang JS, Dey A, and Czerkinsky C (2013). Enzyme-linked immunospot assays for direct ex vivo measurement of vaccine-induced human humoral immune responses in blood. Nat. Protoc 8, 1073–1087. [DOI] [PubMed] [Google Scholar]
- Stark R, and Brown G (2011). DiffBind: Differential Binding Analysis of ChIP-Seq Peak Data. Bioconductor. http://bioconductor.org/packages/release/bioc/html/DiffBind.html.
- Sereti I, and Altfeld M (2016). Immune activation and HIV: an enduring relationship. Curr. Opin. HIV AIDS 11, 129–130. [DOI] [PMC free article] [PubMed] [Google Scholar]
- Shaw LA, Bélanger S, Omilusik KD, Cho S, Scott-Browne JP, Nance JP, Goulding J, Lasorella A, Lu LF, Crotty S, and Goldrath AW (2016). Id2 reinforces TH1 differentiation and inhibits E2A to repress TFH differentiation. Nat. Immunol 17, 834–843. [DOI] [PMC free article] [PubMed] [Google Scholar]
- Shugay M, Britanova OV, Merzlyak EM, Turchaninova MA, Mamedov IZ, Tuganbaev TR, Bolotin DA, Staroverov DB, Putintseva EV, Plevova K, et al. (2014). Towards error-free profiling of immune repertoires. Nat. Methods 11, 653–655. [DOI] [PubMed] [Google Scholar]
- Simoni Y, Becht E, Fehlings M, Loh CY, Koo SL, Teng KWW, Yeong JPS, Nahar R, Zhang T, Kared H, et al. (2018). Bystander CD8+ T cells are abundant and phenotypically distinct in human tumour infiltrates. Nature 557, 575–579. [DOI] [PubMed] [Google Scholar]
- Skon CN, Lee JY, Anderson KG, Masopust D, Hogquist KA, and Jameson SC (2013). Transcriptional downregulation of S1pr1 is required for the establishment of resident memory CD8+ T cells. Nat. Immunol 14, 1285–1293. [DOI] [PMC free article] [PubMed] [Google Scholar]
- Subramanian A, Tamayo P, Mootha VK, Mukherjee S, Ebert BL, Gillette MA, Paulovich A, Pomeroy SL, Golub TR, Lander ES, and Mesirov JP (2015). Gene set enrichment analysis: a knowledge-based approach for interpreting genome-wide expression profiles. Proc. Natl. Acad. Sci. USA 102, 15545–15550. [DOI] [PMC free article] [PubMed] [Google Scholar]
- Supek F, Bošnjak M, Škunca N, and Šmuc T (2011). REVIGO summarizes and visualizes long lists of gene ontology terms. PLoS ONE 6, e21800. [DOI] [PMC free article] [PubMed] [Google Scholar]
- Szabo SJ, Kim ST, Costa GL, Zhang X, Fathman CG, and Glimcher LH (2000). A novel transcription factor, T-bet, directs Th1 lineage commitment. Cell 100, 655–669. [DOI] [PubMed] [Google Scholar]
- Vella LA, Buggert M, Manne S, Herati RS, Sayin I, Kuri-Cervantes L, Bukh Brody I, O’Boyle KC, Kaprielian H, Giles JR, et al. (2019). T follicular helper cells in human efferent lymph retain lymphoid characteristics. J. Clin. Invest 129, 3185–3200. [DOI] [PMC free article] [PubMed] [Google Scholar]
- Wendel BS, Del Alcazar D, He C, Del Rio-Estrada PM, Aiamkitsumrit B, Ablanedo-Terrazas Y, Hernandez SM, Ma KY, Betts MR, Pulido L, et al. (2018). The receptor repertoire and functional profile of follicular T cells in HIV-infected lymph nodes. Sci. Immunol 3, eaan8884. [DOI] [PMC free article] [PubMed] [Google Scholar]
- Yu D, Rao S, Tsai LM, Lee SK, He Y, Sutcliffe EL, Srivastava M, Linterman M, Zheng L, Simpson N, et al. (2009). The transcriptional repressor Bcl-6 directs T follicular helper cell lineage commitment. Immunity 31, 457–468. [DOI] [PubMed] [Google Scholar]
- Zhang Y, Liu T, Meyer CA, Eeckhoute J, Johnson DS, Bernstein BE, Nusbaum C, Myers RM, Brown M, Li W, and Liu XS (2008). Model-based analysis of ChIP-Seq (MACS). Genome Biol 9, R137. [DOI] [PMC free article] [PubMed] [Google Scholar]
Associated Data
This section collects any data citations, data availability statements, or supplementary materials included in this article.
Supplementary Materials
Data Availability Statement
The data for this study have been deposited in the database dbGAP under accession number phs001548.v1.p1 (dbGAP: phs001548.v1.p1).