Abstract
Bacterial cells in nature are frequently exposed to changes in their chemical environment1,2. For such stimuli, the response mechanisms of isolated cells have been investigated in great detail. By contrast, little is known about the emergent multicellular responses to environmental changes, such as antibiotic exposure3–7, which may hold the key to understanding the structure and functions of the most common bacterial communities: biofilms. Here, by monitoring all individual cells in Vibrio cholerae biofilms during exposure to commonly administered antibiotics for cholera infections, we discovered that translational inhibitors cause strong effects on cell size and shape, as well as biofilm architectural properties. We identified that single-cell-level responses result from the metabolic consequences of protein synthesis inhibition, and that the community-level responses result from an interplay of matrix composition, matrix dissociation, and mechanical interactions between cells. We further discovered that the antibiotic-induced changes in biofilm architecture have substantial effects on biofilm population dynamics and community assembly, by enabling invasion of biofilms by bacteriophages and intruder cells of different species. These mechanistic causes and ecological consequences of biofilm exposure to antibiotics are an important step towards understanding collective bacterial responses to environmental changes, with implications for the effects of antimicrobial therapy on the ecological succession of biofilm communities.
An important stimulus for bacteria is exposure to antibiotics, which is likely to be ubiquitous inside patients receiving antibiotic therapy, as well as in the broader environment, where biofilm formation and antibiotic-mediated microbial warfare are common3–7. Understanding community-scale effects of antibiotic treatment in biofilms is important, given that antibiotic-tolerant infections are currently among the largest emerging global health threats8–15, in part due to the increased tolerance of biofilms to antibiotics16–24.
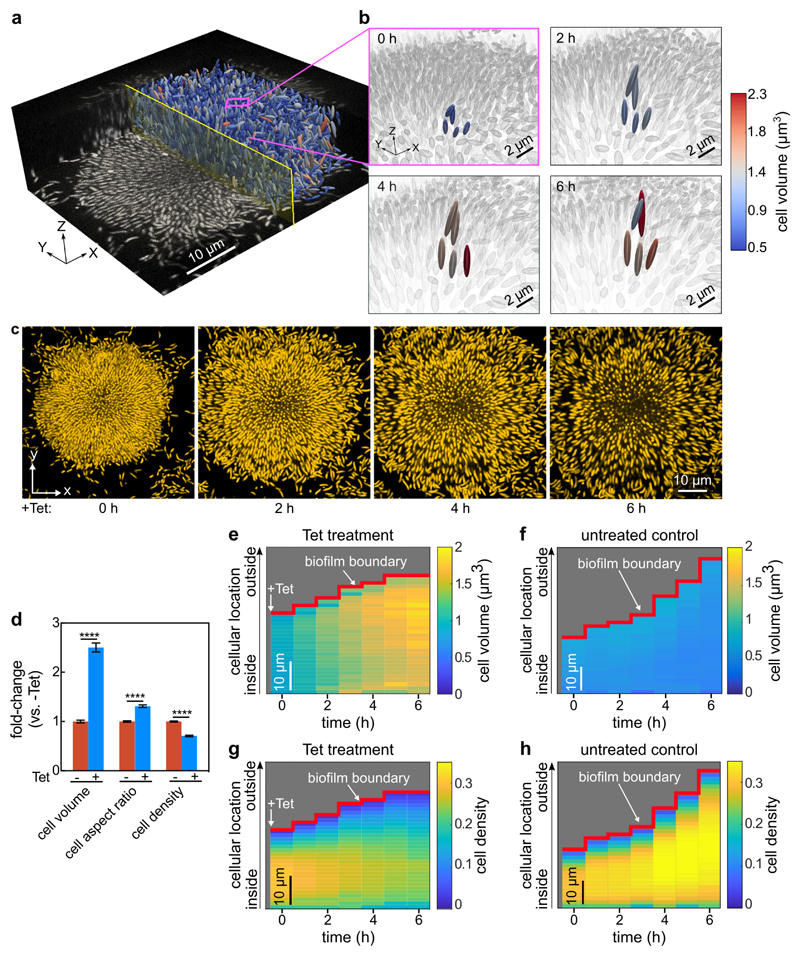
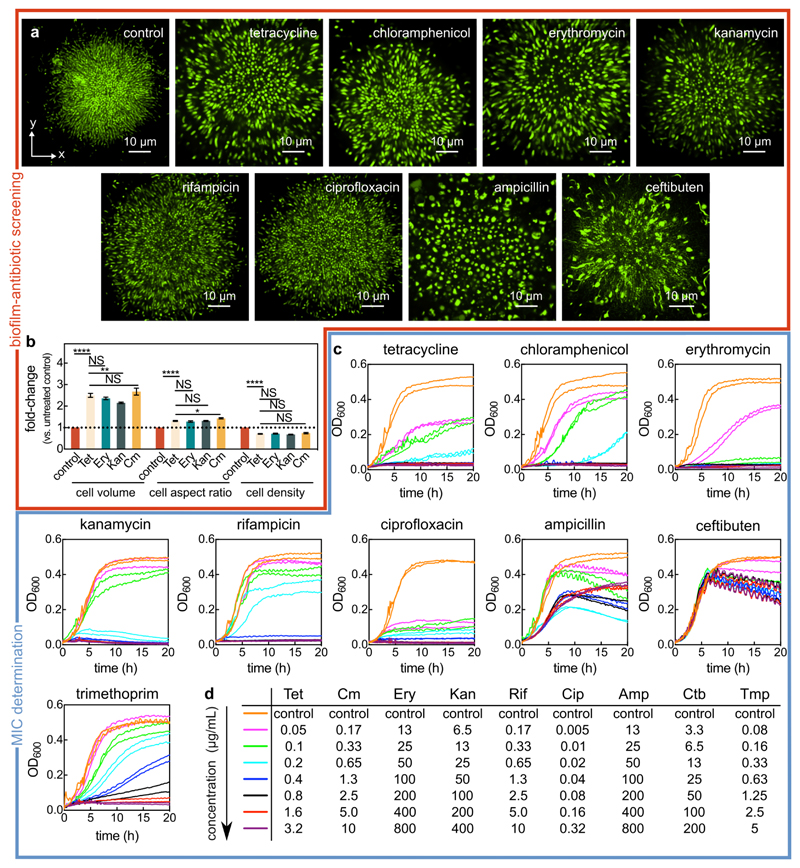
To investigate the emergent community-level responses of antibiotic exposure on biofilm populations, mature V. cholerae biofilms were subjected to antibiotics with the major mechanisms of action (Extended Data Fig. 1), including the most commonly used antibiotic classes against cholera infections25. Our recently developed single-cell imaging system for biofilm dynamics26–28 allowed us to discover architectural changes of biofilms in response to antibiotic treatment above the minimum inhibitory concentration (MIC), which were particularly striking for translational inhibitors, such as tetracycline (Fig. 1a-c, Extended Data Fig. 1). We observed modifications in cell morphology and biofilm architecture during tetracycline treatment for several parameters, including dramatic changes in both the cell volume and cell packing density (Fig. 1, Extended Data Fig. 2, Supplementary Videos 1, 2). Without single-cell level imaging of biofilms, the expansion of biofilm size caused by antibiotic treatment above the MIC (Fig. 1) would likely have been misinterpreted as antibiotic-induced biofilm formation (see data from classical crystal violet assays in Extended Data Fig. 3 for tetracycline and other antibiotics). To explore the detailed mechanisms and ecological consequences of antibiotic-induced biofilm architectural changes, additional experiments were performed only with tetracycline (Tet), an antibiotic commonly used to treat cholera infections25, unless indicated otherwise.
Figure 1. Inhibition of protein synthesis triggers strong architectural changes of biofilms.
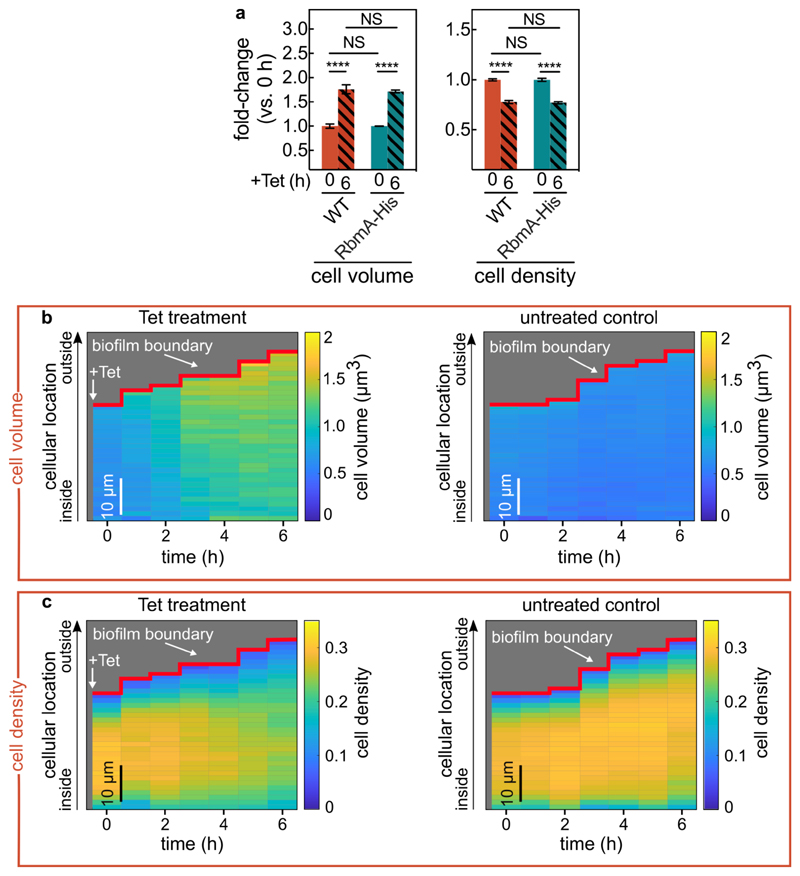
(a) Raw microscopy image based on mKOκ fluorescence of a 24-h old biofilm, and 3D visualization of cells as ellipsoids after segmentation, separated by a central plane with yellow outline. (b) The box outlined in pink in panel a is enlarged in the four images, showing 5 cells, which are tracked in 3D during 6 h of tetracycline treatment above the minimum inhibitory concentration. These 5 cells are coloured according to their volume, all other cells in the background are coloured grey. Tetracycline treatment results in increased cell volume and decreased cell density volume fraction. (c) Snapshots of biofilm architecture dynamics (showing only one confocal xy-slice located 2 µm above the coverslip) during a tetracycline-treatment time series. See also Movie S1. Cells are visualized using a constitutively expressed mKOκ fluorescent protein. (d) Fold-change of cell volume, cell aspect ratio, and cell density (measured as volume fraction) of tetracycline-treated biofilms in comparison with untreated biofilms grown for the same time without antibiotics. Data shown as mean ± SEM (n = 15 samples for -Tet and n = 9 for +Tet; each sample corresponds to a different biofilm). Statistical significances were calculated in relation of control biofilms using a two-sided unpaired t-test (**** indicates p < 0.0001). (e-h) Spatiotemporal changes of the average cell volume (panel e for Tet treatment and panel f for untreated control) and cell density (panel g for Tet treatment and panel h for untreated control), as a function of time during tetracycline treatment and position inside the biofilm. Each pixel in these heatmaps is coloured according to the average cell volume or cell density at a given time and spatial position in the biofilm. Cell volumes and cell density values are averaged over all cells with similar distances from the interface of the biofilm and the growth medium (i.e. the biofilm boundary). Heatmaps are representative of n = 5 different biofilms.
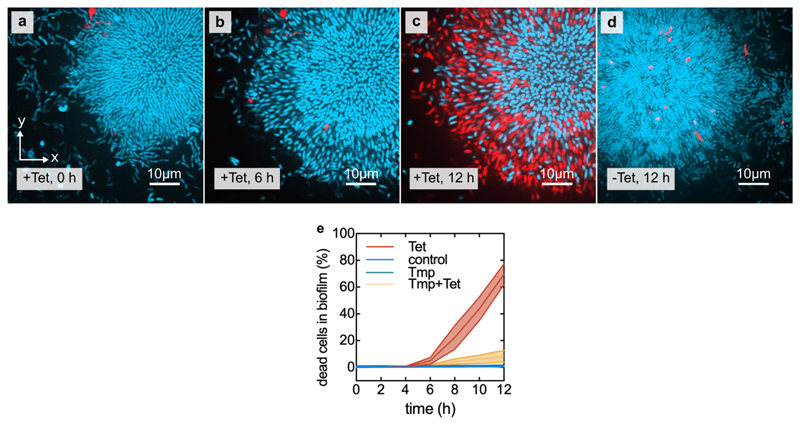
Modifications to the biofilm architecture appeared within the first 6 h of Tet exposure, well before the time at which significant cell death became evident (>10 h, Extended Data Fig. 4), indicating that other processes were reorganizing biofilms during inhibition of protein translation. During 6 h of Tet treatment, cells within biofilms increased in volume 2.5-fold on average, and the mean cell density decreased by 29% (Fig. 1d). The cell volume increase, and the timing of this increase, did not depend on cellular location within the biofilm (Fig. 1e-h), indicating that Tet diffuses into all regions of the biofilm quickly, on a shorter time scale than that of the physiological response to translational inhibition.
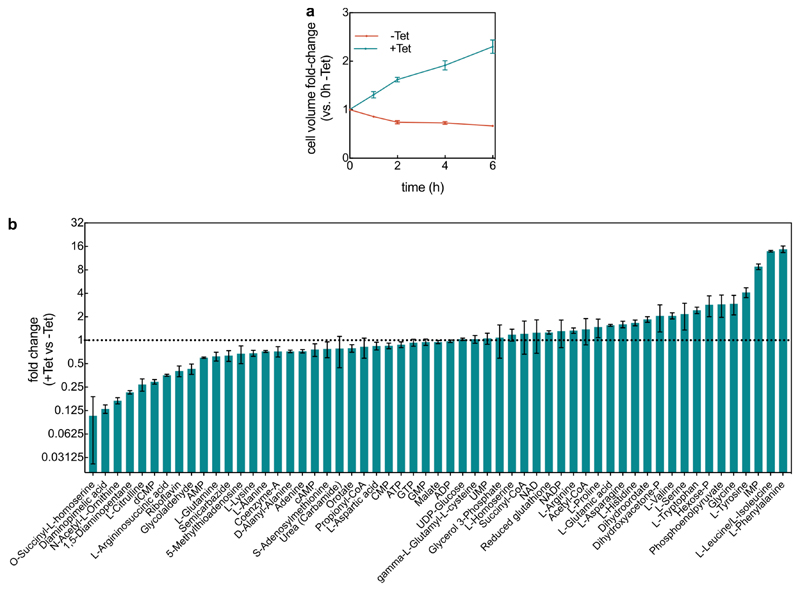
While the observed decrease in cell density is an alteration of the multicellular arrangement within the biofilms, the increase in cell volume is a single-cell level alteration that could potentially also occur outside the biofilm context following Tet exposure. To test whether similar cell shape changes also occur during Tet treatment outside biofilms, we treated single cells attached to glass and planktonic cells grown in liquid culture, and observed that these individual cells also increased in volume (Fig. 2a, Extended Data Fig. 5a). We next sought to understand the underlying causes of this cell volume increase.
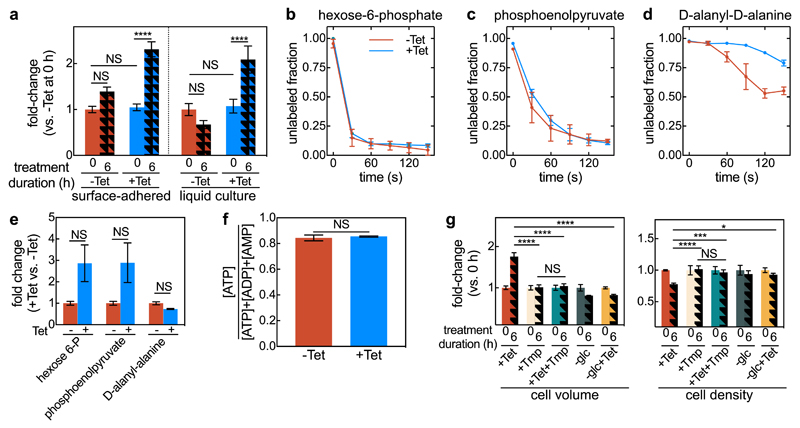
Figure 2. Continued metabolic activity of tetracycline-treated cells results in cell volume expansion.
(a) Fold-change of cell volume of surface-attached isolated cells grown in a microfluidic device, and planktonic cells grown in liquid culture with or without tetracycline (Tet) treatment, normalized to the untreated cell volume at 0 h. Values are displayed as means ± SEM, n = 3 independent biological replicates. (b) Tetracycline-treated cells are metabolically active, as shown by unlabelled ratios of hexose-6-phosphate (first intermediate of glycolysis), (c) phosphoenolpyruvate (late glycolysis intermediate) and (d) D-alanyl-D-alanine (cell wall precursor). Cells treated for 2 h with tetracycline (blue) or untreated control cells (red) were washed with C13-labeled medium for different times, ranging from 0-150 s (means ± SD, n = 3 independent biological replicates). (e) Fold-change in hexose-6-phosphate, phosphoenolpyruvate, and D-alanyl-alanine concentration between Tet-treated and untreated cells (means ± SE, n = 3 independent biological replicates). (f) Energy state for Tet treated and control cells (mean ± SEM, n = 3 independent biological replicates). (g) Fold-changes in cell volume and cell density (measured as volume fraction) for biofilms treated with Tet, trimethoprim (Tmp), Tet and Tmp, glucose removal (-glc), glucose removal and Tet treatment (-glc+Tet). Data shown as mean ± SEM, sample size (n) are 17, 5, 6, 3, 4, for +Tet, +Tmp, +Tet+Tmp, -glc, -glc+Tet, respectively; each sample corresponds to a different biofilm. For each treatment, the fold-change is calculated in relation to the 0 h treatment. For panels a and g statistical significances were calculated using a one-way ANOVA with Bonferroni’s correction for multiple comparisons. For panels e and f statistical significances were calculated using a two-sided unpaired t-test. Statistically non-significant differences (NS) in panel a correspond to p = 0.067, 0.99, 0.24, 0.78 (left to right), in panel e to p = 0.076, 0.071, 0.99 (left to right), in panel f to p = 0.70, in panel g to p = 0.99. *, ***, and **** indicate p <0.05, <0.001, and <0.0001 respectively.
To test whether Tet-treated cells increase in volume passively due to osmotic effects, or actively due to a particular response, we first investigated whether the cells remain metabolically active and continue to produce new cell wall components during Tet exposure. To this end, we followed the incorporation of C13-labeled glucose into the metabolites hexose-6-P (such as glucose-6-P, upper glycolysis, Fig. 2b), phosphoenolpyruvate (lower glycolysis, Fig. 2c), and the cell wall precursor D-alanyl-D-alanine (Fig. 2d). Labelling of both glycolysis metabolites was almost identical with and without Tet-treatment and their absolute concentrations were even higher in Tet-treated cells (Fig. 2e; for fold-changes of 57 other metabolites see Extended Data Fig. 5b). This indicates that Tet-treated cells remain metabolically active and that they catabolize glucose at least with the same rate compared with untreated cells. Cell wall precursors were also continuously produced after Tet-treatment, as observed via the isotope label in D-alanyl-D-alanine (Fig. 2d). The cellular energy state remained unchanged between the Tet-treated and untreated cells (Fig. 2f). Despite their high metabolic activity and production of cell wall, the Tet-treated cells do not divide, as they cannot synthesize new divisome proteins29. If there is a causal connection between metabolic activity and cell volume increase, we expected that the simultaneous inhibition of biosynthetic pathways and protein synthesis should stop the cell volume increase. Indeed, exposing biofilms to the folate-biosynthesis-inhibitor trimethoprim abolished the increase in cell volume during Tet treatment (Fig. 2g). Similarly, cells for which glucose was removed at the same time that tetracycline was added, the cell volume also did not increase. Together, these experiments show that continued metabolic activity without cell division is necessary for the observed increase in cell volume.
Interestingly, biofilms treated with trimethoprim and tetracycline together also did not display a change in cell packing density (Fig. 2g), suggesting that the cell volume increase is necessary for the cell density decrease in the wild-type. Applying Tet treatment to biofilms at the same time as removing glucose from the medium yielded results identical to those of trimethoprim treatments (Fig. 2g). These results imply that the observed decrease in cell density during Tet treatment cannot be caused by a chemical interaction between tetracycline and the biofilm matrix, or by an effect of tetracycline on the activity of enzymes that are present at the time of the antibiotic exposure. What, then, causes the decreased cell density following Tet treatment?
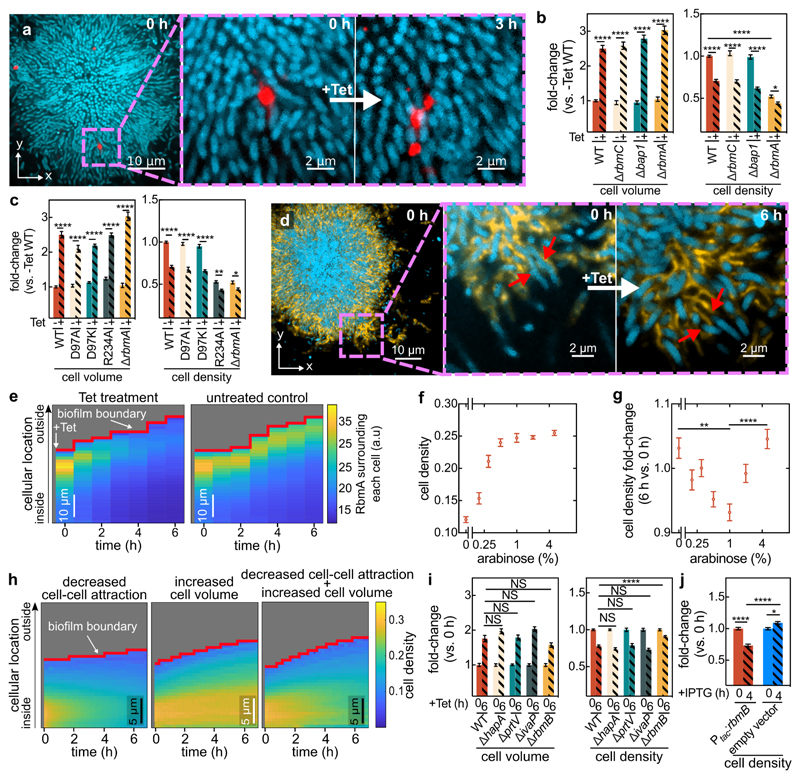
The cell packing density in biofilms is likely determined by the local biofilm matrix composition and structure11,28,30. By tracking nanometer-sized beads embedded in the matrix during Tet treatment, we observed that the matrix is sheared during the decrease of the cell density (Fig. 3a), indicating strong rearrangements of the matrix. To test whether particular matrix components have an effect on the cell density decrease, we investigated deletion mutants of the known V. cholerae matrix proteins: RbmA, RbmC, and Bap131. Only ∆rbmA biofilms displayed a different phenotype from the wild-type: even though ∆rbmA cells within mature biofilms show the increase in cell volume, they lacked a strong decrease in cell density during Tet treatment (Fig. 3b), likely because the untreated biofilms already displayed a low cell density initially. This result suggests that the architectural role of RbmA in wild-type biofilms is connected to the decrease in cell density during Tet treatment. RbmA has recently been shown to assume one of two conformational states, open and closed, the former of which is associated with binding neighbouring cells together32. The amino acid substitutions D97A or D97K lock RbmA in the open state, whereas R234A locks RbmA in the closed state32. We determined that only biofilms composed of cells with RbmA locked in the open state, which exhibit a similar biofilm architecture to the wild-type, exhibit a decrease in cell density during Tet-treatment (Fig. 3c), indicating that RbmA-based cell-cell binding is important for the Tet-induced changes in biofilm cell density.
Figure 3. Antibiotic-induced architectural breakdown of biofilms.
(a) Matrix movement during antibiotic-treatment is visualized by fluorescent beads attached to the matrix. Cells expressing the sfGFP fluorescent protein (shown in cyan) were grown in medium containing fluorescent beads of diameter 0.1 μm (red). Occasionally, beads incorporated into the biofilm matrix. During Tet treatment, no new beads entered the biofilm. Magnified inset shows the separation of the red bead-cluster during tetracycline treatment, revealing differential movement in the matrix. Images are representative of n = 3 different biofilms. (b) Cell volume and cell density (measured as volume fraction) fold-changes of biofilms of matrix-protein deletion mutants in comparison to untreated biofilms. Data shown as mean ± SEM, n = 15, 9, 10, 10, 15, 8, 18, 11 for WT (-Tet), WT (+Tet), ∆rbmC (-Tet), ∆rbmC (+Tet), ∆bap1 (-Tet), ∆bap1 (+Tet), ∆rbmA (-Tet), ∆rbmA (+Tet) respectively; samples correspond to different biofilms. (c) Cell volume and cell density fold-changes of RbmA mutants (RbmA-D97A, D97K, R234A) with different conformations of RbmA structure. Data shown as mean ± SEM, n = 15, 16, 19, 19, 10, 18, 11 for WT (-Tet), WT (+Tet), D97A (-Tet), D97A (+Tet), D97K (-Tet), D97K (+Tet), ∆rbmA (-Tet), ∆rbmA (+Tet), respectively; samples correspond to different biofilms. (d) During antibiotic exposure cells (labelled cyan, using mTFP1) separate from the matrix (labelled yellow, using a fluorescent antibody against RbmA-His). Magnified inset shows individual cells detaching from RbmA during Tet treatment (indicated by red arrows, which show the same region of the biofilm in both panels). Images are representative of n = 5 different biofilms. (e) Heatmaps show the average RbmA-His immunofluorescence surrounding each cell, as a function of time and cellular distance from the biofilm boundary, for Tet-treated (left) and untreated control (right) biofilms. Heatmaps are representative of n = 5 different biofilms. (f) Cell density of ∆rbmA PBAD:rbmA biofilms as a function of arabinose concentration. Data shown as mean ± SEM, n = 7, 12, 11, 16, 10, 18, 14 samples for arabinose concentrations of 0%, 0.2%, 0.3%, 0.5%, 1%, 2%, 5%, respectively; samples correspond to different biofilms. (g) Cell density fold-change (comparing 6 h and 0 h of Tet treatment) of biofilms grown from the ∆rbmA PBAD:rbmA strain, as a function of arabinose concentration. Data shown as mean ± SEM, n = 5, 12, 11, 16, 10, 18, 14 samples for arabinose concentrations of 0%, 0.2%, 0.3%, 0.5%, 1%, 2%, 5%, respectively; samples correspond to a different biofilms. (h) Heatmaps of simulated biofilms that were subject to a linear decrease in cell-cell attraction over 7 h (left panel), a linear increase in cell volume over 6 h (middle panel) or both effects in combination (right panel), n = 3 simulation runs. (i) Fold-changes in cell volume and cell density of tetracycline-treated biofilms grown from strains that lack proteases that are involved in the processing of the matrix protein RbmA (∆hapA, ∆prtV, ∆ivaP), or the enzyme RbmB (mean ± SEM, n = 17, 8, 16, 3, 15 for WT, ∆hapA, ∆prtV, ∆ivaP, ∆rbmB, respectively). (j) Fold-changes in cell density of WT biofilms carrying the Ptac:rbmB construct on a plasmid or an empty vector, in the presence of IPTG induction (mean ± SEM, n = 16 for Ptac:rbmB, n = 11 for empty control). For panels i-j each sample corresponds to a different biofilm. Statistical significances were calculated using a one-way ANOVA with Bonferroni’s correction. Statistically non-significant differences (NS) in panel i correspond to p = 0.43, 0.99, 0.59, 0.34, 0.99, 0.99, 0.99 (left to right). *, **, ***, and **** indicate p <0.05, <0.01, <0.001, and <0.0001 respectively. Images in panels a and d were acquired 2 μm above the coverslip.
Using immunostaining to visualize RbmA localization, we discovered that during Tet treatment, gaps emerge between cells and their surrounding matrix material (Fig. 3d, Extended Data Fig. 6), indicating detachment of cells from RbmA. Immunofluorescence quantification clearly illustrates that the RbmA levels surrounding each cell rapidly decrease upon antibiotic treatment, in contrast to the untreated control (Fig. 3e). To further dissect how RbmA is related to cell density decreases during Tet treatment, we used an inducible RbmA construct in a ∆rbmA background to vary the amount of RbmA produced during biofilm growth prior to Tet exposure. In the absence of antibiotic treatment, the average cell density increases with increasing RbmA concentration (Fig. 3f, Extended Data Fig. 7). Remarkably, we observed that during Tet treatment, the relationship between RbmA levels and the decrease in cell density has a pronounced minimum (Fig. 3g). This suggests that the number of RbmA-mediated cell-cell bonds in the biofilm prior to Tet exposure could be the key to understanding the cause of the cell density alteration during Tet exposure.
We hypothesized that the detachment of cells from the matrix and each other is due to breakdown of matrix components. Unfortunately, deletion of known RbmA-processing proteases (HapA, PrtV, and IvaP33) had no effect on cell density (Fig. 3i). However, RbmA has been shown to bind to the polysaccharide component of the matrix, VPS32,33, presumably acting as a crosslinker for the VPS matrix. This suggests that the RbmA-mediated adhesion between cells can be affected by cleaving VPS. To test this hypothesis, we exposed biofilms that lack the putative VPS-degrading polysaccharide hydrolase RbmB34 to tetracycline. In contrast to biofilms comprising the wild-type, ∆rbmB biofilms hardly decreased in cell density during Tet treatment (Fig. 3i), indicating that the presence of this enzyme is necessary for the decreased cell density that is normally seen in the wild-type. However, wild-type RbmB levels are not sufficient to cause a decrease in cell density without a simultaneous increase in cell volume, as reflected in our trimethoprim and glucose removal experiments in which the rbmB locus was intact (Fig. 2g). But we found that overexpression of rbmB did decrease the cell density, similar to what was observed after Tet treatment (Fig. 3j), without requiring a cell volume change. This shows that when present at high levels, the activity of RbmB is sufficient to alter cell density, yet at wild-type RbmB levels a cell volume increase must accompany the activity of RbmB in order to cause the dissociation of the cells from the matrix, presumably because a cell volume increase with a simultaneous lack of new protein synthesis results in a dilution of the number of cell-RbmA bonds per cell surface area.
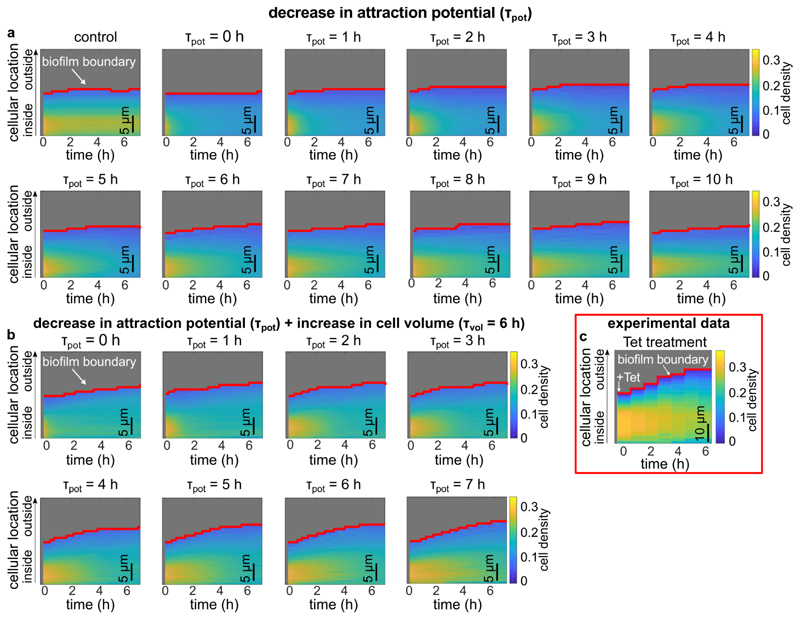
For several species, it has been shown that the pressure generated by growth-induced expansion of biovolume within biofilms is counteracted by the adhesion of the matrix, resulting the net effect of compression35. Microscopically, this is achieved by a balance between attractive and repulsive interactions between cells28. For V. cholerae, cell-cell attraction is primarily mediated by RbmA, whereas cell-cell repulsion is mediated by osmotic effects and the secretion of Vibrio polysaccharides (VPS)28,36. Should the RbmA-mediated bonds between cells be broken, e.g. due to a reduced number of RbmA bonds per cell surface area following the cell volume increase, the balance between attraction and repulsion should be tipped, and the cell density would decrease. To test this hypothesis, we used individual-based simulations which use an accurate and calibrated representation of mechanical cell-cell interactions in V. cholerae biofilms, allowing us to tune key parameters including cell volume as well as cell-cell attraction and repulsion28. With these simulations, we determined that a reduction in cell-cell attraction does cause a lower cell density, but this alteration alone was not sufficient to recapitulate the pattern of biofilm volume expansion seen experimentally (Fig. 3h, left panel, Extended Data Fig. 8a,c). Likewise, only increasing the cell volume without modifying the cell-cell attraction also fails to recapitulate the architectural changes seen in live biofilms (Fig. 3h, middle panel). However, when the cell-cell attraction is decreased and simultaneously the cell volume is increased, our simulations reproduce the architectural changes in experimental biofilms treated with antibiotics (Fig. 3h, right panel, and Extended Data Fig. 8b,c). These results indicate that after the cells detach from the matrix, the observed changes in the biofilm architecture are primarily due to changes of the mechanical interactions between cells during Tet treatment and the accompanying increase in cell volume.
The profound changes in biofilm architecture that result from transient antibiotic exposure could potentially open up niches for external cells to colonize and invade the inside of antibiotic-treated biofilms. Similarly, the dissociation of cells from their matrix during antibiotic exposure may also enable phage entry into the biofilm, which is otherwise prevented by matrix37.
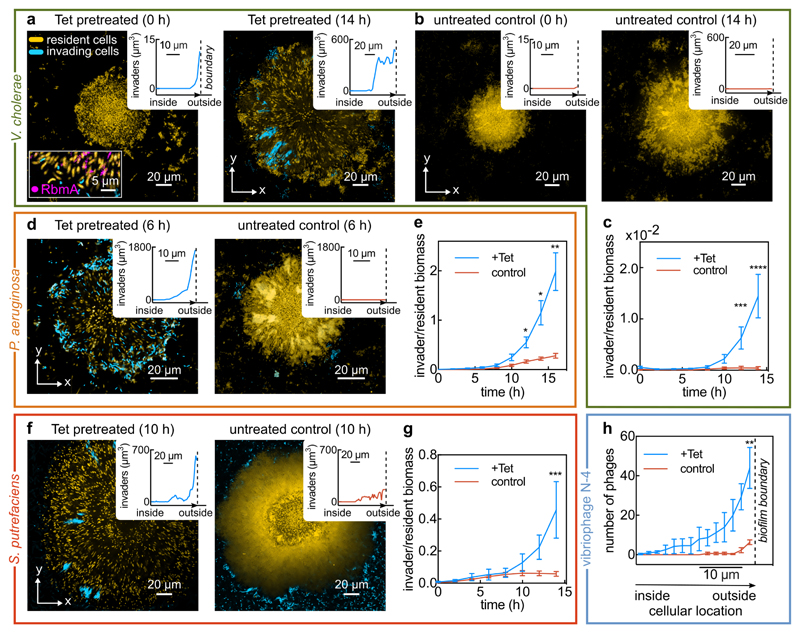
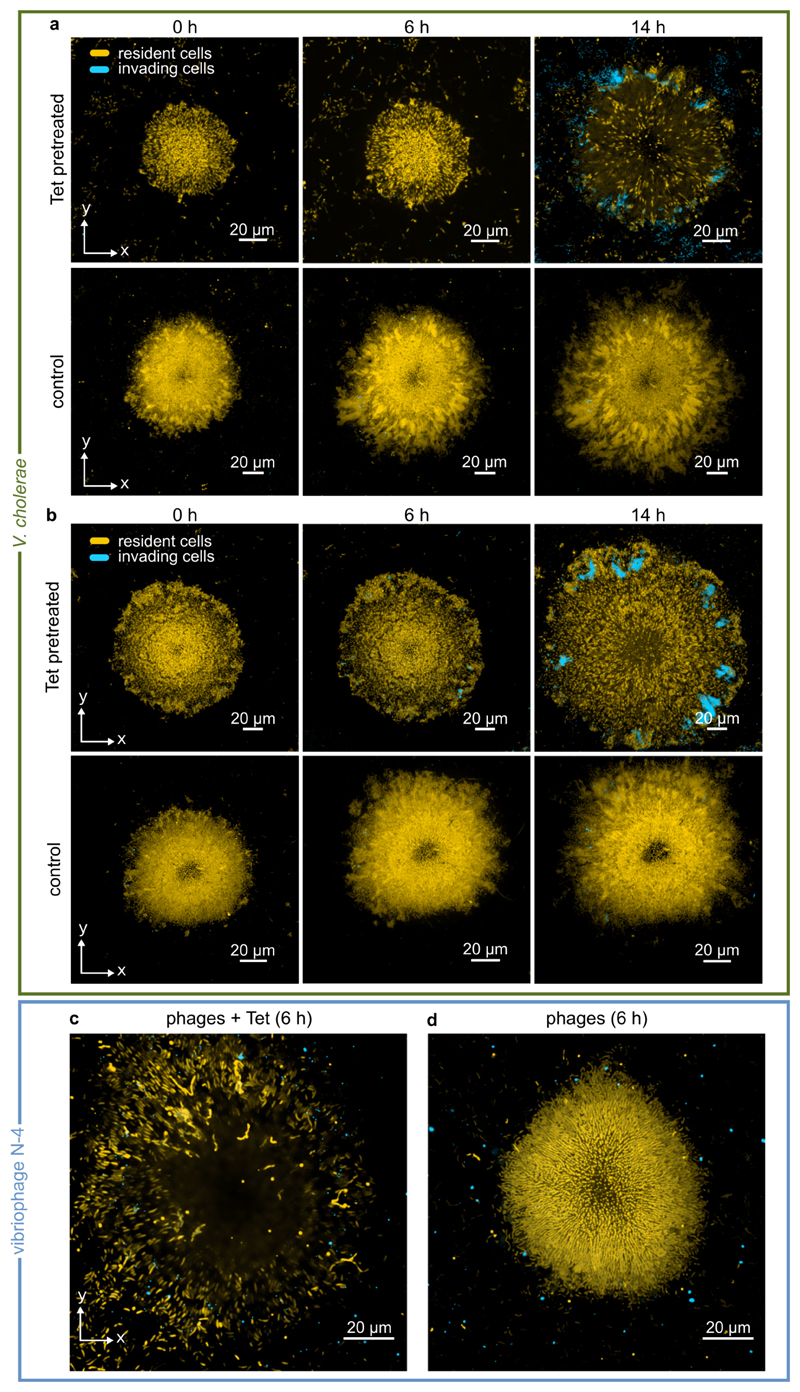
To test these hypotheses, we first exposed Tet-treated V. cholerae biofilms to planktonic cultures of isogenic cells expressing a different fluorescent protein. Tet-treated biofilms indeed permitted colonization of their interior (Fig. 4a, Extended Data Fig. 9a-b); when the medium flowing through the growth channels was switched back to antibiotic-free medium, the resident biofilm strain and the colonizing strain proceed to cohabit the biofilm together, with the colonizer gaining in frequency to invade the biofilm population (Fig. 4c). In control experiments without antibiotic treatment, we observed that biofilms are highly resistant to colonization and population invasion (Fig. 4b), consistent with previous investigations38. We also discovered that bacterial species which share the natural marine and estuarine habitats with V. cholerae, such as Shewanella putrefacies39 and Pseudomonas aeruginosa40, can also colonize and invade Tet-treated V. cholerae biofilm populations (Fig. 4d-g). Given this susceptibility to population invasion by other bacterial species, we tested if bacteriophages, which are the primary predator of V. cholerae in environmental habitats, could also invade antibiotic-treated biofilms. By exposing V. cholerae biofilms to Tet and the vibriophage N-4 for 6 h, we observed an accumulation of phages within the outer region of antibiotic-treated biofilms within this timeframe, in contrast to control biofilms (Fig. 4h, Extended Data Fig. 9c). Altogether, these experiments demonstrate how architectural changes induced by antibiotic treatment can severely affect the ecological succession41 of V. cholerae biofilm communities, and we speculate that architectural changes during antimicrobial treatment could generally be important for invasion susceptibility and succession of microbial communities.
Figure 4. Antibiotic-treated biofilms are susceptible to colonization and invasion.
(a) Confocal xy-slices of a resident V. cholerae WT biofilm, expressing mKOκ constitutively (cells shown in yellow). The resident biofilm underwent tetracycline (Tet) treatment for 6 h, followed by 2 h exposure to invader cells (shown in cyan), which are isogenic except for the fluorescent protein they express (sfGFP instead of mKOκ). Following exposure to planktonic invader cells, the medium was exchanged to fresh, sterile medium and the imaging was started (labelled 0 h here). The inset at 0 h shows a biofilm colonized by cyan cells in which RbmA is visualized using immunofluorescence (magenta). Another inset shows the location where planktonic cells have colonized the resident biofilm, measured as a distance from the biofilm boundary. Replicate experiments are shown in Extended Data Fig. 9a-b. Cyan cells colonize the inside and periphery of biofilms, but rarely attach to the glass surface. (b) Confocal xy-slices of a control biofilm (not treated with tetracycline) exposed to V. cholerae invader cells for the same duration. Very few cells attach to the glass surface, and none to the resident biofilm, as described in the methods section. Images in panels a in b are representative of 8 different biofilms. (c) Quantification of invader biomass divided by resident biomass during a V. cholerae biofilm population invasion; mean ± SE, n = 8 for +Tet and n = 11 for control conditions. (d) Confocal xy-slice of a Tet-treated or control resident V. cholerae biofilm invaded by P. aeruginosa, following the same protocol as for panel a. Images are representative of 12 different biofilms. (e) P. aeruginosa invader biomass normalized by V. cholerae resident biomass; mean ± SE, n = 12 for +Tet and n = 11 for control conditions. (f) Confocal xy-slice of a Tet-treated or control resident V. cholerae biofilm invaded by S. putrefaciens, following the same protocol as for panel a.Images are representative of 8 different biofilms. (g)S. putrefaciens invader biomass normalized by V. cholerae resident biomass; mean ± SE, n = 12 for +Tet and n = 8 for control conditions. (h) Quantification of number of vibriophage N-4 virions as a function of position, for Tet-treated biofilms and untreated control biofilms, after 6 h of phage exposure; means ± SE, n = 5 for +Tet and n = 3 for control conditions. Images of phage invasion of biofilms are shown in Extended Data Fig. 9c. Images shown in panels a, b, d, f were acquired 2 μm above the substrate. Sample sizes (n) correspond to different biofilms. Statistical significances were calculated using a two-way ANOVA with Bonferroni’s correction. *, **, ***, and **** indicate p <0.05, <0.01, <0.001, and <0.0001 respectively.
The ubiquity of biofilm formation in microbial ecology is well-accepted, but we are still in the early stages of understanding how cell-level responses to the local environment translate into the emergent collective responses of biofilm communities. Here we have shown that even transient exposure to translational inhibitors causes changes in cell shape and physiology that yield large-scale alterations of biofilm architecture. The loosening of cell-matrix associations that occurs following antibiotic exposure, in turn, dramatically alters community ecology by allowing new cells and phages to invade the community whereas otherwise they could not. The unicellular and multicellular processes identified here highlight mechanistic causes underlying ecological succession of microbial communities in response to antimicrobial therapeutics.
Materials and Methods
Media and strains
All V. cholerae strains used in this study are derivatives of the wild-type V. cholera O1 biovar El Tor strain N16961. V. cholerae deletion mutations were created using plasmids derived from the pKAS32 suicide plasmid, harboured in E.coli S17-1 λpir27,42. Plasmids for chromosomal deletions were made by amplification of the 1 kb flanking regions of the corresponding gene. The PCR product was cloned into the suicide plasmid and transformed into E. coli. Plasmids were transferred into V. cholerae by conjugation. Fluorescent protein expression constructs were introduced into the lacZ locus and screening was carried out using a beta-galactosidase colony colour conversion assay. For RbmB overexpression experiments (Fig. 3j), V. cholerae strains carrying plasmids were grown with gentamicin (30 µg/mL) throughout all experiments.
All experiments with biofilms or single cells were performed in M9 minimal medium (M9 minimal salts, M6030, Sigma), supplemented with 2 mM MgSO4, 100 mM CaCl2, MEM vitamins, 0.5% glucose, and 15 mM triethanolamine (pH 7.1), referred to in the manuscript as “M9 medium” for simplicity, unless stated otherwise. For Shewanella putrefaciens invasion assays, biofilms were grown in tryptone broth (10 g/L tryptone) instead of M9 medium. Overnight cultures were grown in shaking (250 rpm) liquid Luria-Bertani-Miller broth (LB-Miller; 10 g/L tryptone, 5 g/L yeast extract, 10 g/L NaCl) at 37 °C. Detailed lists of all strains, plasmids, and DNA oligonucleotides used in this study are provided in Supplemental Tables S1, S2, and S3, respectively.
Minimum inhibitory concentration (MIC) determination
For MIC determination, the wild-type V. cholerae N16961 strain (KDV101) was grown in LB-Miller overnight at 37 °C with shaking at 250 rpm. Then, the overnight cultures were diluted 1:50 in M9 medium (see description of media above) and grown at 28 °C until exponential phase (OD600 of 0.5-0.6). The OD600 was then adjusted to 0.5 and used to inoculate a 96-well plate (82.1581.001, Sarstedt) containing different antibiotic concentrations. The liquid volume per well was 180 µL and the initial inoculation OD600 in each well was 0.05. The 96-well plate was then incubated at 28 °C with shaking in a microtiter plate reader (Spark 10M, Tecan) for 20 hours. MICs were calculated from 2 independent experiments with 2 technical replicates per experiment (Extended Data Fig. 1c-d and Supplementary Table S4).
Flow chamber biofilm experiments
V. cholerae biofilms were grown in microfluidic flow chambers made from polydimethylsiloxane (PDMS) bonded to glass coverslips using an oxygen plasma, with 4-8 channels on a single coverslip, as previously described26. The microfluidic channels measured 500 μm in width, 100 μm in height, and 7 mm in length. Channels were inoculated with overnight cultures of V. cholerae strains. Following inoculation, the cells were given 1 h at room temperature (24-26 °C) to attach to the surface of the channel before fresh M9 medium was flowed through the channel at a flow rate of 50 μL/min for 45 s, to wash away non-attached cells and to completely replace the LB-Miller medium from the channel. The flow rate of fresh M9 medium was then set to 0.05 μL/min for the remainder of the experiment, corresponding to an average flow speed of 17 μm/s in the channel. Flow rates were maintained using a syringe pump (picoPlus, Harvard Apparatus). The flow chamber, M9 medium, and syringe pump were maintained at room temperature (24-26 °C) for the duration of all experiments.
Exposure of biofilms to antibiotics
For testing the influence of different antibiotics on mature biofilms, biofilms were grown for 24 h in M9 medium before being exposed to one of the following antibiotics: rifampicin (6 µg/mL), ciprofloxacin (0.5 µg/mL), erythromycin (200 µg/mL), kanamycin (200 µg/mL), ampicillin (400 µg/mL), tetracycline (Tet; 3 µg/mL), chloramphenicol (10 µg/mL), trimethoprim (10 µg/mL) and ceftibuten (50 µg/mL). The concentrations for each antibiotic were at least two times the minimum inhibitory concentration (MIC), which was determined for our strain and media conditions using a microtiter plate reader (Spark 10M, Tecan), as described in the section on MIC measurements above. For ampicillin and ceftibuten it was not possible to determine a MIC. Instead, we used concentrations that cause changes in cell morphology due to cell wall loss. After exposure to an antibiotic for 24 h, the biofilms were stained with 4 µM of SYTO 9 (S34854, ThermoFisher).
To test for cell death during antibiotic exposure, propidium iodide (7.5 µM) was used as a reporter – cells that have a compromised cell envelope are stained red by propidium iodide. During time-series imaging of cell death inside biofilms, a strain carrying a Ptac promoter fusion to mTFP1 (KDV392) was used (Extended Data Fig. 4).
To investigate biofilm architectural modifications in response to antibiotic treatment in detail, tetracycline was chosen as the main text antibiotic, as it is a commonly used treatment against cholera infections25. To avoid investigations of architectural modifications due to cell death alone, exposure to tetracycline was limited to 6 h for all experiments described in this manuscript, except for those investigating cell death in biofilms as a function of treatment time (Extended Data Fig. 4). For the experiments involving a constitutively expressed fluorescent protein for biofilm architecture quantification, we used strains carrying a Ptac promoter fused to mKOκ, sfGFP, or mTFP1 at the lacZ locus.
Exposure of individual adherent cells to antibiotics
An overnight culture of a wild-type (WT) strain carrying the constitutively expressed Ptac:mKOκ system on the chromosome (strain KDV103) was back-diluted 1:100 in M9 medium and grown under shaking conditions at 250 rpm until OD600 = 0.45-0.55. This suspension was then used to inoculate a diffuse monolayer of cells on the glass substratum of microfluidic devices, which were kept at room temperature (24-26 °C). After 30 min, flow was initiated at 0.05 µl/min using M9 with or without tetracycline. The flow chambers were kept at room temperature throughout the experiment.
Exposure of individual cells in shaking liquid culture to antibiotics – imaging and metabolomics
Overnight cultures were back-diluted 1:100 in M9 medium and grown at 25 °C in shaking conditions at 250 rpm until the culture reached OD600 = 0.45-0.55. At this point, either tetracycline was added or, for negative controls, an equivalent volume of methanol (the stock solvent for tetracycline) was added to the cultures. To measure the cell size as a function of time after tetracycline or clean methanol was added, aliquots of the culture were taken every hour and imaged by microscopy. For metabolomic analysis, samples were collected after 2 h for both treatments (tetracycline exposed, and non- tetracycline exposed cultures).
Metabolomic analyses were done as previously described43, with minor modifications. Briefly, for sampling of metabolites by filtration, 1 mL of culture with an OD600 of 0.5 was vacuum-filtered on a 0.45 μm pore-size membrane (HVLP02500, Merck Millipore) to remove the spent medium, before cells were subjected to M9 media containing U-13C glucose (99%, Cambridge Isotope Laboratories) for 0, 30, 90, 120, or 150 s. Afterwards, filters were immediately transferred into a mixture of acetonitrile/methanol/water (at ratio 40:40:20) and stored at −20 °C. Metabolite extracts were centrifuged for 15 min at 13,000 rpm at −9 °C to remove cellular debris. The supernatant was directly used for liquid chromatography (LC)−MS/MS.
RbmA complementation, titration, and immuno-labelling
To control the amount of RbmA produced by cells, we constructed a ΔrbmA clean deletion strain into which rbmA-His(6x) was re-introduced under the control of the tightly regulated, arabinose-inducible PBAD promoter. This construct was inserted using allelic exchange into the V. cholerae chromosome at the lacZ locus (strain KDV859). The following arabinose concentrations were used for inducing RbmA expression in biofilms: 0.2, 0.3, 0.5, 1, 2, and 5%.
To stain extracellular RmbA, a strain carrying the Ptac promoter fused to mTFP1 and rbmA-His(6x) (KDV605) was used. After 4 hours of biofilm growth an anti-His tagged antibody conjugated to Alexa Fluor 555 was added at a final concentration of 1 µg/mL (monoclonal, ThermoFisher, MA1-135-A555) into the inflowing M9 medium. To avoid nonspecific binding, bovine serum albumin (1 mg/mL) was added to the medium together with the antibody, as described previously31.
Matrix movement assay using fluorescent beads
Biofilms of the sfGFP-expressing WT strain KDV311 were grown for 24 h in presence of red fluorescent beads of diameter 0.1 µm (F8887, ThermoFisher) in the media. This led to an incorporation of beads into the extracellular matrix of the biofilms. Afterwards, the media was exchanged for fresh M9 medium without beads and tetracycline was added. Starting from this point the biofilms were imaged for 6 h with a time-resolution of 1 h.
RbmB controlled overexpression
Biofilms of the mKOκ-expressing WT strain carrying either a plasmid-based IPTG inducible rbmB expression construct (KDV1070) or an empty vector (KDV1078) were grown for 24 h prior to IPTG (1 µM) addition. Starting from this time point, biofilms were imaged for 4 h with a time resolution of 1 h.
Bacterial biofilm invasion assay
Biofilms of the mKOκ-expressing WT strain KDV103 were grown for 24 h, before the inflowing M9 medium was exchanged to contain tetracycline for 6 h. As a control treatment, M9 medium without tetracycline was added for 6 h. Separately, at the same time, an overnight culture of the sfGFP-expressing WT strain KDV311 or an overnight culture of KDP54, a Pseudomonas aeruginosa PAO1 strain expressing sfGFP was diluted 1:200 in M9 and grown at 37 °C under shaking conditions (250 rpm) until exponential phase (OD600 = 0.4). After the biofilms were exposed to either the tetracycline treatment or control treatment for 6 h, the exponential phase culture of KDV311 or KDP54 was introduced at a flow rate of 0.05 µL/min into the flow channel containing the resident KDV103 biofilms. After the sfGFP-expressing planktonic cells were given the opportunity to colonize and invade the resident biofilms for 2 h, the inflowing medium was exchanged to sterile M9 medium without any cells. Starting from this time point (labelled as “0 h” in Fig. 4 and Extended Data Fig. 9a-b), biofilms were imaged for 24 h with a time resolution of 2 h.
During experiments in which V. cholerae resident biofilms were exposed to planktonic V. cholerae cells (Fig. 4a,b and Extended Data Fig. 9a-b), the planktonic cells rarely attached to the glass surface in both conditions (Tet-pretreated and untreated control) during the 2 h initial time window of exposure to the resident biofilms. There was significantly more attachment and colonization to Tet-treated biofilms compared with untreated control biofilms at 0 h (Fig. 4a,b), and therefore much more biomass accumulation of the invader cells in the Tet-treated condition compared with the control. Some of the accumulated invader biomass in the Tet-treated condition disperses and colonizes the glass surface surrounding the biofilm, whereas in the control condition there is not enough invader biomass to substantially colonize the glass surface.
For Shewanella putrefaciens (CN-32 wild-type strain, KDM77) invasion experiments, the same protocol was used as described above for the V. cholerae and P. aeruginosa invasion experiments, except for the following modifications: All V. cholerae resident biofilms were grown in tryptone broth. To obtain an exponentially growing culture of S. putrefaciens, the frozen stock was streaked on a LB-Miler agar plate, which was incubated at room temperature. From this plate, colonies were picked to inoculate a LB-Miller liquid culture, which was grown under shaking conditions at 28°C. Using this culture, another flask containing tryptone broth was inoculated with a 1:200 dilution and grown at 28°C until exponential phase (OD600 = 0.4). This culture was used as the culture of planktonic invader cells for the invasion assay.
Biofilm phage invasion assay and vibriophage N-4 fluorescent labelling
Bacteriophages were labelled as described previously37. Briefly, 100 μL of purified vibriophages with a concentration of 1012 plaque forming units (PFU) per mL were mixed with sodium carbonate (0.1 M final) and then incubated with 0.1 mg Alexa Fluor 488 5-TFP (A30005, Thermo Fisher Scientific) for 1 h at room temperature under continuous shaking. The reaction mixture was first dialyzed at 4 °C against 500 mL of phosphate-buffered saline (PBS) for 3 hours and then dialyzed overnight at 4 °C against 2 L of PBS. This was done to separate phages from unbound dye. This stock of fluorescently labelled phages was stored at 4 °C.
Biofilms of the mRuby3-expressing V. cholerae WT strain (KDV657) were grown for 24 h, before the inflowing M9 medium was exchanged to contain tetracycline for 6 h and fluorescently labelled phages (a 1:100 dilution of the fluorescently labelled phage stock). As a control treatment, M9 medium without tetracycline, but containing the same concentration of vibriophages was added for 6 h. Biofilms were imaged for the 6 h of phage exposure with a time resolution of 2 h (Extended Data Fig. 9c).
Microscopy and image analysis
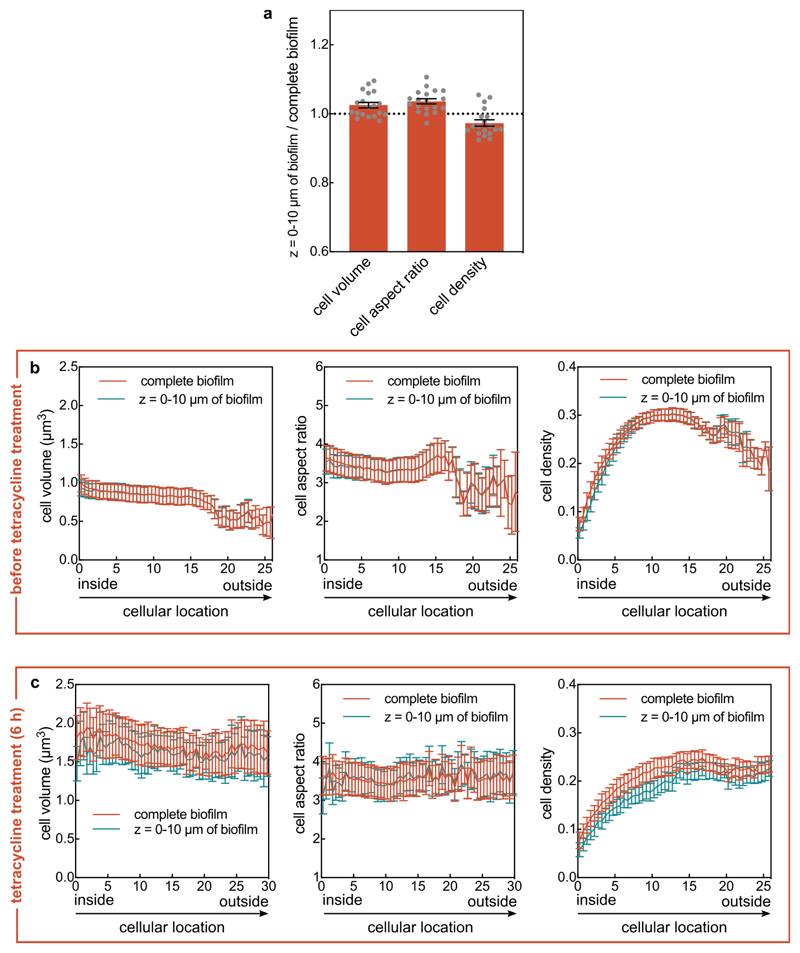
Biofilm architecture was imaged and analysed in the biofilm volume between z = 0 µm and z = 10 µm (i.e. the part of the biofilm within the closest 10 µm to the glass substrate) for most experiments, unless indicated otherwise in the figure caption. In control experiments, we determined that this lower part of the biofilm has an identical biofilm architecture to the complete biofilm in terms of cell volume, cell aspect ratio, and cell density, both in terms of mean values (Extended Data Fig. 10a) and in terms of spatially-resolved values at different timepoints (Extended Data Fig. 10b-c). Because of photobleaching and phototoxicity it was not possible to acquire image time series during antibiotic treatment of the whole biofilm at single-cell resolution, so that for most experiments only the representative lowest 10 µm of the biofilm were imaged. All imaging was performed using a Yokogawa spinning disk confocal unit, mounted on a Nikon Ti-E inverted microscope using a 100x silicone oil objective (NA 1.35, Olympus). For confocal imaging, pictures were taken with a z-step size of 0.4 µm.
For biofilm invasion assays, we used a Nikon 60x NA 1.4 oil objective on the spinning disk confocal microscope. For invasion experiments that required 3-colour imaging (Fig. 4a), we used a point-scanning confocal microscope (LSM 880, Zeiss), equipped with a tuneable emission spectrum selector for each fluorescence channel, and a Zeiss 60x NA 1.4 oil objective.
Image analysis of biofilms was performed using Matlab (Mathworks) as described previously27,28. After segmentation of all cells in the biofilm images, we calculated for each cell the aspect ratio, the matrix density surrounding each cell (for experiments in which RbmA was labelled fluorescently), the cell density at each cellular location, and each cell’s distance to the biofilm boundary. The biofilm boundary is defined as the interface between the biofilm and the liquid growth medium. Each of these quantifications is explained in detail below.
To calculate the cellular aspect ratio, an ellipsoid was fitted into each cell and the longest axis of the ellipsoid was used as cell length and the shortest as cell width. The cell aspect ratio is the ratio of cell length and cell width.
To calculate the location of each cell relative to the biofilm boundary, which is the spatial metric used to quantify the cellular location in the biofilms throughout the manuscript, we calculated the shortest distance from each cell to the interface between the biofilm and the liquid growth medium. Qualitatively, this spatial metric for the cellular location in the biofilm corresponds to the shortest distance that nutrients from the growth medium would have to diffuse to reach the cell. We note that V. cholerae biofilm communities grow into colonies with roughly hemispherical shape in our conditions27,28. If the colony morphology would be an exact hemisphere, then the distance of each cell to the biofilm boundary would correspond to a path along the radial direction in spherical coordinates, where the origin would be at the centre of mass of the colony projected onto the z = 0 µm plane. Given that V. cholerae biofilms differ from exact hemispherical shapes, we opted for using the distance to the biofilm boundary as the spatial metric to quantify cellular location.
To compute the kymograph heatmaps for a given parameter (such as the cell volume or cell aspect ratio), at each time point, the parameter value of all cells with the same distance to the biofilm boundary was averaged, resulting in a value that corresponds to the value of a particular pixel in the heatmap. This calculation was then performed for all distances to the biofilm boundary and all time points to result in the heatmap. We previously used such spatiotemporal heatmaps of biofilms to quantify spatiotemporal biofilm development28 and biofilm dispersal27.
To calculate the cell density of biofilms, we used a measurement of volume fraction. We created a sphere of 3 µm radius starting from the centroid of each cell. Then, we calculated how much of the volume of the sphere, excluding the volume of the cell used to create the sphere, was occupied by other cells.
To quantify the RbmA matrix density surrounding each cell, we measured the fluorescent signal of immunofluorescence-labelled RbmA-His that surrounds each cell within a 0.2 μm-thick 3D shell around each cell. The strain with the His-tagged RbmA used for immunostaining phenocopies the WT strain before and during antibiotic treatment (Extended Data Fig. 6).
To quantify the biofilm invasion phenotype (Fig. 4) we measured the total biomass of the invader cells between z = 0 µm and z = 10 µm (i.e. the lowest 10 µm of the biofilm) and divided this value by the total biomass of cells within the lowest 10 µm of the resident biofilm.
For analysing images of planktonic cells or single cells that are adherent to a surface (Fig. 2a), MicrobeJ was used44.
Crystal violet assay
Crystal violet experiments were performed as described previously45, with some modifications. Briefly, strain KDV103 and strain KDV115 were grown overnight in LB-Miller at 37 °C, shaking at 250 rpm. Afterwards, these cultures were diluted 1:1000 in M9 and the resulting suspension was used to inoculate a 96-well plate, which was then incubated for biofilm growth at room temperature. At different time points the biomass was measured using crystal violet methods describe previously45.
For testing antibiotic exposure of biofilms with the crystal violet assay, biofilms were grown for 14 h in a 96-well plate (82.1581.001, Sarstedt). At this time tetracycline, trimethoprim, chloramphenicol, kanamycin or erythromycin were added, reaching a final concentration of 3 µg/mL, 10 µg/mL, 10 µg/mL, 200 µg/mL and 200 µg/mL respectively. As a control, the same volume of M9 medium without tetracycline was added to a different well. The treated and untreated wells were then incubated for 6 h. After this incubation period, the biomass was measured using crystal violet. All measurements were performed using a microplate reader (Tecan Spark 10M). For each measurement, the data was averaged from 8 different wells (technical replicates) per experiment, and n = 3 independent biological replicates.
Biofilm simulations
Biofilm formation was simulated using the agent-based framework described by Hartmann et al.28. Cells are modelled as ellipsoids interacting with the channel wall via a repulsive boundary potential, and with other cells via an interaction potential. This interaction potential accounts for effective cell-cell repulsion due to steric forces and VPS production, and for cell-cell attraction mediated by adhesion molecules such as RbmA32. For two cells γ and β, let lγ and lβ be their lengths, dγ and dβ be their widths in units of μm, and be their orientation vectors, rγβ be the distance between their centroids, and be the unit vector pointing from the centroid of cell γ to the centroid of cell β. The pairwise interaction potential Uγβ between cell γ and cell β is , where ργβ = rγβ/σ is the shape-normalized cell-cell distance between two cells in units of μm28. The dimensionless range parameter depends on the cells’ ellipsoidal shapes, relative positions and the relative orientations. The overall strength of Uγβ is set by the energy scale ϵ0, scaled by the dimensionless geometric factor that accounts for the shapes and the relative orientations of the cells28. The range of cell-cell repulsion is set by length parameter λr. The relative strength of the cell-cell attraction is set by dimensionless parameter v. The length parameter ρa determines the energetically preferred cell-cell distance, and λa the gradient of the attractive barrier. The model parameters ϵ0, λr, ν, ρa and λa were obtained by fitting simulated biofilms to experimental biofilms, using the mean square distance of a feature vector as a metric, which incorporated 14 different architectural parameters and their temporal development28. For ϵ0 = 5 · 10−20 J, λr = 1.16 μm, ν = 0.13, λa = 0.11 μm and ρa = 2.0 μm the simulations yield biofilms with quantitatively and qualitatively similar architecture dynamics as those observed in the experiments for biofilm sizes up to approximately 2000 cells (for other simulation parameters and detailed comparisons between simulations and experimental biofilms, see Hartmann et al.28).
Using this model, biofilm growth was simulated until the biofilm size reached 1000 cells. Then, Tet-treatment was simulated by stopping cell division and probing three different effects: (i) the cell-cell attraction was linearly decreased to zero over time with varying total duration (0 - 10 h), following the quantitative relationship between varying RbmA levels and the model parameters ϵ0, λr, ν, ρa and λa that was established by Hartmann et al.28, (ii) the volume of each cell was increased according to the single cell volume growth rate observed in biofilms after Tet-treatment, (iii) the joint effects of loss of cell-cell attraction, and increase in cell volume were applied together. In all cases, the cell density of the simulated biofilm was monitored as a function of Tet-treatment time and as a function of the shortest distance to the boundary between the biofilm and the growth medium, using the same analysis scripts as for the experimental biofilms.
Statistical analysis
All statistical tests indicated in figure legends were performed using the GraphPad Prism software, version 8.1.1.
Extended Data
Extended Data Fig. 1. Screening biofilm architecture after antibiotic exposure and identifying the minimum inhibitory concentration (MIC).
(a) Confocal xy-slices of biofilms exposed to different antibiotics for 24 h and stained with the SYTO 9 nucleic acid dye. The conditions tests were the following: untreated control biofilm, tetracycline (Tet; 3 μg/mL, 8x the MIC), chloramphenicol (Cm; 10 μg/mL, 8x the MIC), erythromycin (Ery; 200 μg/mL, 4x the MIC), kanamycin (Kan; 200 μg/mL, 4x the MIC), rifampicin (Rif; 6 μg/mL, 5x the MIC), ciprofloxacin (Cip; 0.5 μg/mL, 6.3x the MIC), ampicillin (Amp; 400 μg/mL, a concentration at which the cell morphology was significantly modified), and ceftibuten (Ctb; 50 μg/mL, a concentration at which the cell morphology was significantly modified). Images are representative of n = 3 independent experiments. (b) Fold-change of cell volume, cell aspect ratio, and cell density (calculated as volume fraction) of biofilms treated with different protein synthesis inhibitors for 6 h, relative to untreated biofilms (mean ± SEM, n = 15 samples for control, n = 9 for Tet, n = 7 for Ery, n = 14 for Kan, and n = 8 for Cm; samples correspond to different biofilms). Statistical significances were calculated using a one-way ANOVA with Bonferroni’s correction. Statistically non-significant differences (NS) correspond to p = 0.93, 0.51, 0.99, 0.99, 0.99, 0.99, 0.46 (left to right). *, ** and **** indicate p < 0.05, p < 0.01 and p < 0.0001 respectively. (c) Batch culture growth curves of wild-type V. cholerae N16961 grown in M9 medium supplemented with glucose and with different antibiotic concentrations. Every line corresponds to the average between 2 technical replicates, and each concentration has been tested on 2 separate days (each resulting in one line). For ampicillin and ceftibuten, the MIC determination was not possible from the concentrations tested, due to the lack of cell lysis. (d) List of antibiotic concentrations used in panel c according to their color-coding.
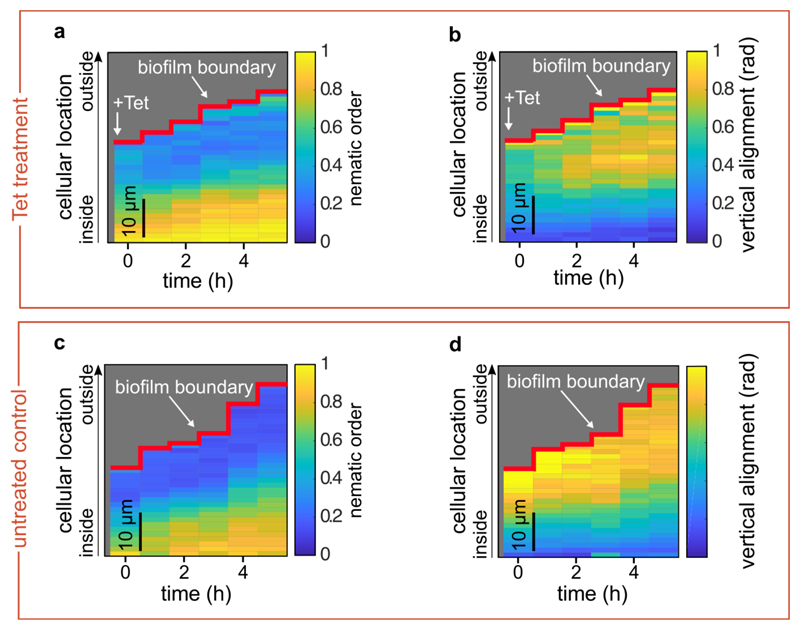
Extended Data Fig. 2. Nematic order and vertical alignment of cells in biofilms during tetracycline treatment, compared with untreated controls.
(a, b) Spatiotemporal changes of the average nematic order (a), or the vertical alignment (b), as a function of time and position inside the biofilm during tetracycline treatment. Each pixel in the heatmap is coloured according to the average nematic order (a) or vertical alignment (b) at a given time and spatial position in the biofilm. (c, d) Spatiotemporal changes of the average nematic order (c), or the vertical alignment (d), for control biofilms that were not treated with tetracycline. In these kymograph heatmaps, the pixel values correspond to averages over all cells with similar distances from the surface of the biofilm at a particular time. Heatmaps are representative of n = 5 different biofilms.
Extended Data Fig. 3. Effect of tetracycline treatment on biomass measurements using the crystal violet assay.
(a) Fold-changes for the cell volume and cell density of the wild-type (WT) and the vpvCW240R rugose strain (which is a biofilm hyper-producer strain47) for tetracycline-treated biofilms in comparison with untreated biofilms, measured in flow chambers using confocal imaging at the single-cell level. Data are shown as mean ± SE, n = 15, 9, 7, 11, for WT (-Tet), WT (+Tet), rugose (-Tet), and rugose (+Tet), respectively. Each sample corresponds to an independent biofilm. These results show that the rugose strain also displays similar biofilm architecture responses to Tet treatment. Statistical significances were calculated using a one-way ANOVA with Bonferroni’s correction. **** indicates p < 0.0001. (b) Growth curve of rugose and WT biofilms using the crystal violet assay in 96-well plates; mean ± SD, n = 3 independent biological replicates. These results show that only the rugose strain forms substantial biofilms in static 96-well plates. (c) Foldchange in biofilm biomass measured by crystal violet absorbance of rugose biofilms, which were grown for 14 h in 96-well plates followed by 6 h treatment with tetracycline (Tet; 3 μg/mL, 8x the MIC), trimethoprim (Tmp; 10 μg/mL, 4x the MIC), chloramphenicol (Cm; 10 μg/mL, 8x the MIC), erythromycin (Ery; 200 μg/mL, 4x the MIC), or kanamycin (Kan; 200 μg/mL, 4x the MIC); mean ± SE, n = 3 independent biological replicates. For all experiments, each biological replicate is the average of 8 technical replicates from different wells on the same microtiter plate. The translational inhibitors Tet, Cm, Ery, and Kan show the same qualitative behaviour: an increase in crystal violet biofilm signal after 6 h of antibiotic exposure. Only the Tet+Tmp treatment does not show the increase in crystal violet signal, consistent with Fig. 2g of the main text.
Extended Data Fig. 4. Increase in cell volume and decrease in cell density precede cell death.
(a) Confocal xy-slices of a biofilm constitutively expressing mTFP1 (shown in cyan), grown in the presence of propidium iodide. Alive cells are only visible in the cyan fluorescent channel, whereas dead cells are also visible in the red fluorescent channel. (b) Same biofilm as in panel a, now imaged after 6 h of tetracycline (Tet) treatment. (c) Same biofilm as in panel a, after 12 h of Tet treatment. (d) Untreated control biofilm. (e) Percentage of dead cells in the biofilm as a function of treatment time. Centre lines correspond to mean and width of the shaded areas around each line correspond to standard errors, n = 13 samples for Tet, n = 9 for control, n = 4 for Tmp, n = 4 for Tmp+Tet. Each sample corresponds to a different biofilm.
Extended Data Fig. 5. Changes in cell volume and metabolite levels of planktonic cells during exposure to tetracycline.
(a) Cell volume fold-change (comparing each time point to the untreated (-Tet) sample at 0 h (mean ± SEM, n = 5 independent biological replicates. (b) Fold-changes in 57 metabolites after 2 h of Tet treatment in comparison with untreated cells (mean ± SEM, n = 3 independent biological replicates).
Extended Data Fig. 6. The RbmA-His strain phenocopies the wild-type strain.
(a) Fold-change of cell volume and cell density (measured as volume fraction) of wild-type biofilms and biofilms formed by a strain producing His-tagged RbmA (RbmA-His) treated with tetracycline, relative to the biofilms before the treatment. Values are displayed as mean ± SE (n = 17 different biofilms). Statistical significances were calculated using a one-way ANOVA with Bonferroni’s correction for multiple comparisons. Statistically non-significant differences are labelled NS, which both correspond to p = 0.99. **** indicates p < 0.0001. (b, c) RbmA-His biofilms, shown here, display the same spatiotemporal changes in biofilm architecture as the WT biofilms, for which the corresponding kymograph heatmaps are shown in Fig. 1e-h. Heatmaps show the changes of the average cell volume (b) and cell density (c) as a function of time and spatial location during tetracycline treatment inside the RbmA-His biofilms. Panels on the left correspond to Tet treatment and panels on the right correspond to untreated control conditions. Each pixel in these kymograph heatmaps is coloured according to the average cell volume or cell density at a given time and spatial position in the biofilm. Cell volumes and cell density volume fraction values are averaged over all cells with similar distances from the surface of the biofilm. The RbmA-His strain was grown and imaged using antibodies as described in the methods section. Heatmaps are representative of n = 5 different biofilms.
Extended Data Fig. 7. Antibiotic-induced cell volume increase is independent of RbmA concentration.
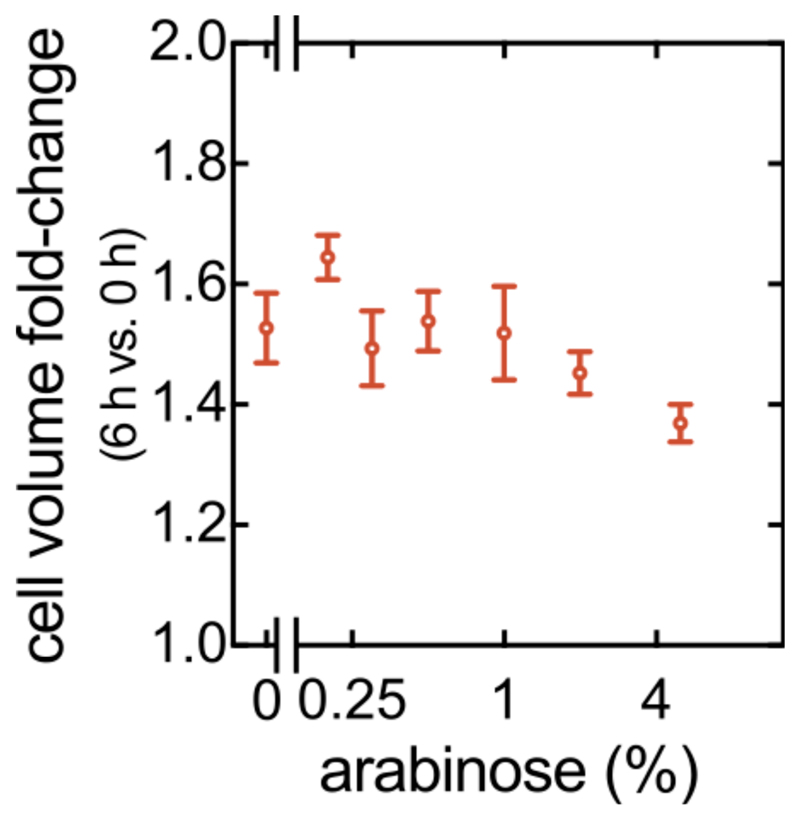
Cell volume fold-change (comparing 6 h and 0 h of Tet treatment) in biofilms of a ΔrbmA strain carrying the PBAD:rbmA construct, measured as a function of arabinose concentration (mean ± SEM, n = 7, 12, 13, 17, 10, 18, 14 samples for arabinose concentrations of 0%, 0.2%, 0.3%, 0.5%, 1%, 2%, and 5% respectively). Each sample corresponds to a different biofilm.
Extended Data Fig. 8. Simulated biofilms were subjected to a decrease in cell-cell attraction and an increase in cell volume, revealing the contribution of each effect to the antibiotic-induced biofilm architecture changes.
Biofilm growth was simulated as described in the methods section until the biofilm size reached 1,000 cells, corresponding to the 0 h time point in the heatmaps in this figure. For these 1,000-cell biofilms, tetracycline treatment was simulated by decreasing the attraction potential, or by increasing the cell volume, or by both effects together. (a) Kymograph heatmaps of simulated 1,000-cells biofilms subject to a linear decrease in cell-cell attraction over the course of different times ⊺pot. The value of ⊺pot corresponds to the time for the cell-cell attraction potential to decrease to zero, starting from the value used to simulate biofilm growth. If the attraction potential is set to zero immediately (corresponding to ⊺pot = 0), the resulting biofilm dynamics do not closely resemble the experiments, indicating that the cell-cell attraction decreases over an extended period of time. The control kymograph heatmap corresponds to biofilms were neither the attraction potential or the cell volume were changed. Each heatmap is the average of n = 3 simulations. (b) Heatmaps of simulated 1,000-cells biofilms that were subjected to a decrease in cell-cell attraction over different times (⊺pot) and simultaneously subjected to a linear increase in cell volume over 6 h (⊺pot = 6 h). Each heatmap is the average of n = 3 simulations. In Fig. 3h of the main text, a kymograph heatmap is shown for simulations in which only the cell volume is linearly increased with a time scale ⊺vol = 6 h, according to the experimentally determined single-cell volume growth rate during Tet-treatment. (c) Experimental changes of the average cell density as a function of space and time during tetracycline treatment inside the biofilm as shown in Fig. 1g, reproduced here for convenience. Heatmap in panel c is a representative of n = 5 different biofilms.
Extended Data Fig. 9. Tetracycline-treated V. cholerae biofilms are susceptible to colonization and population invasion by an isogenic strain and by bacteriophages.
(a-b) Each of the two panels shows an independent replica experiment of a tetracycline-treated V. cholerae biofilm colonized by an isogenic strain, which is expressing a different fluorescent protein. Resident biofilms constitutively express mKOκ (cells shown in yellow), invaders constitutively express sfGFP (cells shown in cyan). Images correspond to confocal xy-slices, acquired 2 μm above the substrate. The resident biofilm underwent tetracycline (Tet) treatment for 6 h or control treatment (medium without Tet), followed by 2 h exposure to invader cells. Following exposure to invader cells, the medium was exchanged to fresh, sterile medium and the imaging was started (labelled as the 0 h timepoint here). A third independent replica experiment is shown in Fig. 4a,b of the main text. (c) Confocal xy-slice of a resident V. cholerae WT biofilm, expressing mKOκ constitutively (cells shown in yellow), imaged directly above the glass substrate. The resident biofilm underwent exposure to tetracycline (Tet) and fluorescently labelled vibriophage N-4 virions (visible as cyan spots) for 6 h. During 6 h of Tet-treatment cell death is negligible, as shown in Extended Data Fig. 4. (d) Confocal xy-slice of control biofilm (not treated with tetracycline) exposed to vibriophage N-4 virions for 6 h. Images are representative of n = 5 different biofilms.
Extended Data Fig. 10. Biofilm architecture in the lower part of the biofilm is representative of the whole biofilm.
(a) Comparison between the cell volume, cell aspect ratio, and cell density (measured as volume fraction) between the lower part of the biofilm and the whole biofilm. The ratio of these biofilm architecture parameters was calculated using the mean value of these parameters in the part of the biofilm that is bounded by the z = 0 μm and z = 10 μm planes, and the mean value of these parameters in the whole biofilm (mean ± SEM, n = 19 different biofilms). (b, c) Cell volume, cellular aspect ratio, and cell density before tetracycline treatment (panel b) or after 6 hours of tetracycline treatment (panel c) as measured for complete biofilm volumes, or for the cells located in the biofilm volume bounded by the z = 0 μm and z = 10 μm planes (mean ± SD, n = 8 samples in panel b and n = 5 samples in panel c; each sample corresponds to a different biofilm). The cellular location was measured as the shortest distance of each cell to the interface between the biofilm and the liquid growth medium. This interface is termed “biofilm boundary” in this manuscript. For the experiments in this figure, biofilms were stained with the nucleic acid dye SYTO 9 prior to imaging. The cell volume, aspect ratio, and cell density were nearly identical between the whole biofilm and the bottom-most 10 μm of the biofilms.
Supplementary Material
Acknowledgements
We are grateful to Praveen K. Singh, Philip Pearce, Sanika Hakim, Miriam Bayer, Konstantin Neuhaus, Eva Jimenez, and Kerstin Strenger for strains and support during this project, and thankfully acknowledge grants from the Max Planck Society, Human Frontier Science Program (CDA00084/2015-C), Deutsche Forschungsgemeinschaft (SFB 987), Behrens-Weise-Stiftung, Minna-James-Heineman-Stiftung, and European Research Council (StG-716734) to K.D., the MIT-Germany MISTI Seed Fund Program to K.D. and J.D, and the James S. McDonnell Foundation (J.D.). C.D.N. is supported by the Alexander von Humboldt Foundation, National Science Foundation (MCB 1817342), a Burke Award from Dartmouth College, a pilot award from the Cystic Fibrosis Foundation (STANTO15RO), and NIH grant P20-GM113132 to the Dartmouth BioMT COBRE.
Footnotes
Data and code availability. Raw as well as analysed data that support the findings of this study are available from the corresponding author upon request. Our open-source and user-friendly biofilm image analysis software tool BiofilmQ46 is available online (https://drescherlab.org/data/biofilmQ/). The raw developer-level code used to analyse data is available from the corresponding author upon request.
Author contributions
K.D. conceived, supervised, and coordinated the project. C.D.N. and K.D. designed experiments. J.D. designed simulations. F.D.P. and L.V. performed all biofilm experiments. F.D.P. and L.V. performed liquid culture experiments. F.D.P., M.L. and H.L. performed metabolite measurements and analysis. R.H. and H.J. developed image and data analysis methods. F.D.P., R.H. and H.J. performed image analysis. R.H. and B.S. performed simulations. F.D.P., and L.V. generated strains. F.Y. and K.M.T. developed strains and analysis ideas. All authors made important conceptual contributions to the project and interpreted results, often in group discussions. F.D.P. and R.H. made the figures. F.D.P., C.D.N. and K.D. wrote the manuscript, with input from all authors.
Competing Interests
The authors declare no competing interests.
References
- 1.D’Costa VM, et al. Antibiotic resistance is ancient. Nature. 2011;477:457–461. doi: 10.1038/nature10388. [DOI] [PubMed] [Google Scholar]
- 2.Baym M, et al. Spatiotemporal microbial evolution on antibiotic landscapes. Science. 2016;353:1147–51. doi: 10.1126/science.aag0822. [DOI] [PMC free article] [PubMed] [Google Scholar]
- 3.Hoffman LR, et al. Aminoglycoside antibiotics induce bacterial biofilm formation. Nature. 2005;436:1171–1175. doi: 10.1038/nature03912. [DOI] [PubMed] [Google Scholar]
- 4.Koch G, et al. Evolution of Resistance to a Last-Resort Antibiotic in Staphylococcus aureus via Bacterial Competition. Cell. 2014;158:1060–1071. doi: 10.1016/j.cell.2014.06.046. [DOI] [PMC free article] [PubMed] [Google Scholar]
- 5.Jenssen H, Hamill P, Hancock REW. Peptide Antimicrobial Agents. Clin Microbiol Rev. 2006;19:491–511. doi: 10.1128/CMR.00056-05. [DOI] [PMC free article] [PubMed] [Google Scholar]
- 6.Houry A, et al. Bacterial swimmers that infiltrate and take over the biofilm matrix. Proc Natl Acad Sci. 2012;109:13088–13093. doi: 10.1073/pnas.1200791109. [DOI] [PMC free article] [PubMed] [Google Scholar]
- 7.Andersson DI, Hughes D. Microbiological effects of sublethal levels of antibiotics. Nat Rev Microbiol. 2014;12:465–78. doi: 10.1038/nrmicro3270. [DOI] [PubMed] [Google Scholar]
- 8.Antimicrobial Resistance: Tackling a Crisis for the Health and Wealth of Nations (Review on Antimicrobial Resistance) 2014.
- 9.Van Acker H, Van Dijck P, Coenye T. Molecular mechanisms of antimicrobial tolerance and resistance in bacterial and fungal biofilms. Trends Microbiol. 2014;22:326–333. doi: 10.1016/j.tim.2014.02.001. [DOI] [PubMed] [Google Scholar]
- 10.Lebeaux D, Ghigo J-M, Beloin C. Biofilm-Related Infections: Bridging the Gap between Clinical Management and Fundamental Aspects of Recalcitrance toward Antibiotics. Microbiol Mol Biol Rev. 2014;78:510–543. doi: 10.1128/MMBR.00013-14. [DOI] [PMC free article] [PubMed] [Google Scholar]
- 11.Koo H, Allan RN, Howlin RP, Stoodley P, Hall-Stoodley L. Targeting microbial biofilms: current and prospective therapeutic strategies. Nat Rev Microbiol. 2017;15:740–755. doi: 10.1038/nrmicro.2017.99. [DOI] [PMC free article] [PubMed] [Google Scholar]
- 12.Meylan S, Andrews IW, Collins JJ. Targeting Antibiotic Tolerance, Pathogen by Pathogen. Cell. 2018;172:1228–1238. doi: 10.1016/j.cell.2018.01.037. [DOI] [PubMed] [Google Scholar]
- 13.Garcia LG, et al. Antibiotic activity against small-colony variants of staphylococcus aureus: Review of in vitro, animal and clinical data. J Antimicrob Chemother. 2013;68:1455–1464. doi: 10.1093/jac/dkt072. [DOI] [PubMed] [Google Scholar]
- 14.Kwan BW, Valenta JA, Benedik MJ, Wood TK. Arrested protein synthesis increases persister-like cell formation. Antimicrob Agents Chemother. 2013;57:1468–1473. doi: 10.1128/AAC.02135-12. [DOI] [PMC free article] [PubMed] [Google Scholar]
- 15.Grant SS, Hung DT. Persistent bacterial infections, antibiotic tolerance, and the oxidative stress response. Virulence. 2013;4:273–283. doi: 10.4161/viru.23987. [DOI] [PMC free article] [PubMed] [Google Scholar]
- 16.Brooun A, Liu S, Lewis K. A Dose-Response Study of Antibiotic Resistance in Pseudomonas aeruginosa Biofilms. Antimicrob Agents Chemother. 2000;44:640–646. doi: 10.1128/aac.44.3.640-646.2000. [DOI] [PMC free article] [PubMed] [Google Scholar]
- 17.Chua SL, et al. Selective labelling and eradication of antibiotic-tolerant bacterial populations in Pseudomonas aeruginosa biofilms. Nat Commun. 2016;7 doi: 10.1038/ncomms10750. 10750. [DOI] [PMC free article] [PubMed] [Google Scholar]
- 18.Gupta K, Marques CNH, Petrova OE, Sauer K. Antimicrobial Tolerance of Pseudomonas aeruginosa Biofilms Is Activated during an Early Developmental Stage and Requires the Two-Component Hybrid SagS. J Bacteriol. 2013;195:4975–4987. doi: 10.1128/JB.00732-13. [DOI] [PMC free article] [PubMed] [Google Scholar]
- 19.Okshevsky M, Meyer RL. The role of extracellular DNA in the establishment, maintenance and perpetuation of bacterial biofilms. Crit Rev Microbiol. 2015;41:341–352. doi: 10.3109/1040841X.2013.841639. [DOI] [PubMed] [Google Scholar]
- 20.Mah T-F, et al. A genetic basis for Pseudomonas aeruginosa biofilm antibiotic resistance. Nature. 2003;426:306–310. doi: 10.1038/nature02122. [DOI] [PubMed] [Google Scholar]
- 21.Nguyen D, et al. Active Starvation Responses Mediate Antibiotic Tolerance in Biofilms and Nutrient-Limited Bacteria. Science (80-.) 2011;334:982–986. doi: 10.1126/science.1211037. [DOI] [PMC free article] [PubMed] [Google Scholar]
- 22.Høiby N, Bjarnsholt T, Givskov M, Molin S, Ciofu O. Antibiotic resistance of bacterial biofilms. Int J Antimicrob Agents. 2010;35:322–332. doi: 10.1016/j.ijantimicag.2009.12.011. [DOI] [PubMed] [Google Scholar]
- 23.Tseng BS, et al. The extracellular matrix protects Pseudomonas aeruginosa biofilms by limiting the penetration of tobramycin. Environ Microbiol. 2013;15:2865–78. doi: 10.1111/1462-2920.12155. [DOI] [PMC free article] [PubMed] [Google Scholar]
- 24.Dale JL, Nilson JL, Barnes AMT, Dunny GM. Restructuring of Enterococcus faecalis biofilm architecture in response to antibiotic-induced stress. npj Biofilms Microbiomes. 2017;3:15. doi: 10.1038/s41522-017-0023-4. [DOI] [PMC free article] [PubMed] [Google Scholar]
- 25.Wong KC, Brown AM, Luscombe GM, Wong SJ, Mendis K. Antibiotic use for Vibrio infections: important insights from surveillance data. BMC Infect Dis. 2015;15:226. doi: 10.1186/s12879-015-0959-z. [DOI] [PMC free article] [PubMed] [Google Scholar]
- 26.Drescher K, et al. Architectural transitions in Vibrio cholerae biofilms at single-cell resolution. Proc Natl Acad Sci. 2016;113:E2066–E2072. doi: 10.1073/pnas.1601702113. [DOI] [PMC free article] [PubMed] [Google Scholar]
- 27.Singh PK, et al. Vibrio cholerae Combines Individual and Collective Sensing to Trigger Biofilm Dispersal. Curr Biol. 2017;27:3359–3366.e7. doi: 10.1016/j.cub.2017.09.041. [DOI] [PMC free article] [PubMed] [Google Scholar]
- 28.Hartmann R, et al. Emergence of three-dimensional order and structure in growing biofilms. Nat Phys. 2019;15:251–256. doi: 10.1038/s41567-018-0356-9. [DOI] [PMC free article] [PubMed] [Google Scholar]
- 29.Adams DW, Errington J. Bacterial cell division: Assembly, maintenance and disassembly of the Z ring. Nat Rev Microbiol. 2009;7:642–653. doi: 10.1038/nrmicro2198. [DOI] [PubMed] [Google Scholar]
- 30.Stewart EJ, Satorius AE, Younger JG, Solomon MJ. Role of Environmental and Antibiotic Stress on Staphylococcus epidermidis Biofilm Microstructure. Langmuir. 2013;29:7017–7024. doi: 10.1021/la401322k. [DOI] [PMC free article] [PubMed] [Google Scholar]
- 31.Berk V, et al. Molecular architecture and assembly principles of Vibrio cholerae biofilms. Science. 2012;337:236–9. doi: 10.1126/science.1222981. [DOI] [PMC free article] [PubMed] [Google Scholar]
- 32.Fong JC, et al. Structural dynamics of RbmA governs plasticity of Vibrio cholerae biofilms. Elife. 2017;6:1–22. doi: 10.7554/eLife.26163. [DOI] [PMC free article] [PubMed] [Google Scholar]
- 33.Smith DR, et al. In situ proteolysis of the Vibrio cholerae matrix protein RbmA promotes biofilm recruitment. Proc Natl Acad Sci. 2015;112:10491–10496. doi: 10.1073/pnas.1512424112. [DOI] [PMC free article] [PubMed] [Google Scholar]
- 34.Fong JCN, Yildiz FH. The rbmBCDEF gene cluster modulates development of rugose colony morphology and biofilm formation in Vibrio cholerae. J Bacteriol. 2007;189:2319–2330. doi: 10.1128/JB.01569-06. [DOI] [PMC free article] [PubMed] [Google Scholar]
- 35.Douarche C, Allain J-M, Raspaud E. Bacillus subtilis Bacteria Generate an Internal Mechanical Force within a Biofilm. Biophys J. 2015;109:2195–2202. doi: 10.1016/j.bpj.2015.10.004. [DOI] [PMC free article] [PubMed] [Google Scholar]
- 36.Yan J, Nadell CD, Stone HA, Wingreen NS, Bassler BL. Extracellular-matrix-mediated osmotic pressure drives Vibrio cholerae biofilm expansion and cheater exclusion. Nat Commun. 2017;8 doi: 10.1038/s41467-017-00401-1. [DOI] [PMC free article] [PubMed] [Google Scholar]
- 37.Vidakovic L, Singh PK, Hartmann R, Nadell CD, Drescher K. Dynamic biofilm architecture confers individual and collective mechanisms of viral protection. Nat Microbiol. 2018;3:26–31. doi: 10.1038/s41564-017-0050-1. [DOI] [PMC free article] [PubMed] [Google Scholar]
- 38.Nadell CD, Drescher K, Wingreen NS, Bassler BL. Extracellular matrix structure governs invasion resistance in bacterial biofilms. ISME J. 2015;9:1700–1709. doi: 10.1038/ismej.2014.246. [DOI] [PMC free article] [PubMed] [Google Scholar]
- 39.Jørgensen BR, Huss HH. Growth and activity of Shewanella putrefaciens isolated from spoiling fish. Int J Food Microbiol. 1989;9:51–62. doi: 10.1016/0168-1605(89)90037-8. [DOI] [PubMed] [Google Scholar]
- 40.Kimata N, Nishino T, Suzuki S, Kogure K. Pseudomonas aeruginosa Isolated from Marine Environments in Tokyo Bay. Microb Ecol. 2004;47:41–47. doi: 10.1007/s00248-003-1032-9. [DOI] [PubMed] [Google Scholar]
- 41.Brislawn CJ, et al. Forfeiting the priority effect: turnover defines biofilm community succession. ISME J. 2019;13:1865–1877. doi: 10.1038/s41396-019-0396-x. [DOI] [PMC free article] [PubMed] [Google Scholar]
- 42.Skorupski K, Taylor RK. Positive selection vectors for allelic exchange. Gene. 1996;169:47–52. doi: 10.1016/0378-1119(95)00793-8. [DOI] [PubMed] [Google Scholar]
- 43.Guder JC, Schramm T, Sander T, Link H. Time-Optimized Isotope Ratio LC–MS/MS for High-Throughput Quantification of Primary Metabolites. Anal Chem. 2017;89:1624–1631. doi: 10.1021/acs.analchem.6b03731. [DOI] [PubMed] [Google Scholar]
- 44.Ducret A, Quardokus EM, Brun YV. MicrobeJ, a tool for high throughput bacterial cell detection and quantitative analysis. Nat Microbiol. 2016;1 doi: 10.1038/nmicrobiol.2016.77. 16077. [DOI] [PMC free article] [PubMed] [Google Scholar]
- 45.O’Toole GA. Microtiter dish biofilm formation assay. J Vis Exp. 2011:10–11. doi: 10.3791/2437. [DOI] [PMC free article] [PubMed] [Google Scholar]
- 46.Hartmann R, et al. BiofilmQ, a software tool for quantitative image analysis of microbial biofilm communities. bioRxiv. 2019 doi: 10.1101/735423. 735423. [DOI] [Google Scholar]
- 47.Beyhan S, Yildiz FH. Smooth to rugose phase variation in Vibrio cholerae can be mediated by a single nucleotide change that targets c-di-GMP signalling pathway. Mol Microbiol. 2007;63:995–1007. doi: 10.1111/j.1365-2958.2006.05568.x. [DOI] [PubMed] [Google Scholar]
Associated Data
This section collects any data citations, data availability statements, or supplementary materials included in this article.


