Abstract
The interactions between a receptor-modified planar surface and a surface grafted with a bimodal polymer layer, where one of the polymer species is ligand functionalized, are studied using a molecular theory. The effects of changing the binding energy of the ligand–receptor pair, the polymer surface coverage, the composition, and molecular weight of both the unfunctionalized and ligand functionalized polymers on the interactions between the surfaces are investigated. Our findings show that bridging exists between the surfaces including when the molecular weight of the ligand-bearing polymer is smaller than that of the unfunctionalized polymer, even though the ligand is initially buried within the polymer layer. The distance at which the surfaces bind depends only on the molecular weight of the ligand-modified polymer, while the strength of the interaction at a given surface separation can be tuned by changing the molecular weight of the polymers, the total polymer surface coverage, and the fraction of ligated polymers. The composition of the bimodal layer alters the structure of the polymer layer, thereby influencing the strength of the steric repulsions between the surfaces. Our theoretical results show good agreement with experimental data. The present theoretical study can be used as guidelines for the design of surfaces with tailored abilities for tunning the binding strength and surface–ligand separation distances for polymer-grafted surfaces bearing specific targeting ligands.
1. Introduction
Ligand–receptor binding is a mechanism used by biological systems to initiate, propagate, or complete many different functional processes. One specific example is the family of signaling mechanisms that are activated by the binding of extracellular matrix proteins to specific receptors on the cell surface.1,2 The strength and specificity of the interaction between biological ligand–receptor pairs are also used in the design of biomimetic systems to force the binding of different species.3-5 Consider, for example, the binding of magnetic particles to cells for imaging tracking purposes6-8 or the use of antigen-functionalized Si nanowires to sense the presence of the corresponding antibody in a concentration-dependent manner.9 In particular, selective detection of small protein concentrations has enormous potential for biomedical applications. For example, prostate specific antigen (PSA) is a prostate cancer marker. Early diagnosis of the disease notably increases the survival possibilities.10 A sensor which could precisely determinate the blood PSA concentration would have an incommensurable importance for the early detection of the most frequent cancer among men in the United States.
In the field of targeted drug delivery, polymer-coated liposomes11-18 and vesicles formed for diblock copolymers (polymersomes)19-21 use the water-soluble tethered polymer layer to increase the longevity in the blood stream.11,22,23 Furthermore, functionalization of the polymer’s end group can be used for specific targeting.11-18,24
The role of the tethered polymers in these devices serves a dual purpose: (1) improving the bioavailability of the ligand toward receptor binding and (2) exploiting the polymers’ ability to minimize nonspecific adsorption of proteins to the surfaces.25,26 A bimodal polymer layer is a structure that contains two different molecular weight polymers. This structure presents great design flexibility and can be engineered to achieve optimal binding and mechanical properties.27-31 For example, Uchida et al.29 designed a bidisperse poly(ethylene glycol) (PEG)-modified surface plasmon resonance (SPR) sensor where one of the polymers was functionalized with biotin in order to detect the presence of streptavidin in solution. These researchers found that the highest sensitivity (i.e., high specific binding and suppression of nonspecific adsorption) is achieved when the ligand is attached to PEG-5k and the rest of the surface is filled with unfunctionalized PEG-2k. The device sensitivity was substantially lowered when the molecular weight of the ligand-bearing polymer was less than that of the unmodified polymer or when the surface is modified with only the ligand-functionalized polymer. In agreement with these experimental findings, a previous theoretical work of ours32 shows that optimal binding properties and suppression of nonspecific adsorption are realized when the surface is modified with a very small fraction of ligand-functionalized polymer and a much higher concentration of a lower molecular weight unfunctionalized polymer. These predictions were recently confirmed in experimental observations of mixed tethered layers using comb copolymers.33
The understanding of ligand–receptor binding in confined environments and in the presence of polymeric spacers requires the treatment of the different intrinsic scales of the problem. We have previously studied the interactions and binding of receptor-functionalized small proteins with PEG end-tethered to a surface and functionalized with a ligand in the free end.32 The goal of the present work is to study in detail the interactions between a receptor surface and a larger polymer-modified targeted particle than has previously been treated. For this reason, the interactions between planar surfaces is considered here. These systems have been previously studied using, for example, Monte Carlo techniques with particular interest on the ligand architecture and structure for different types of receptor surfaces.30 A related system in which both ligands and receptors are at the end of spacers has been analyzed in detail by Zhang and Wang.34 For the case of polymers without functional groups, Dan and Tirrell35 have used a self-consistent field theory to look at the interactions between compressed bimodal brushes in a good solvent environment.
Surface force apparatus (SFA) experiments have greatly improved the understanding of the interactions between ligand-functionalized polymer-grafted and receptor surfaces.31,36,37 Wong et al.36 have shown that the range of interactions between these surfaces is basically the length of the fully extended conformation of the polymer bearing the ligand. Recently, Moore and Kuhl31 used SFA experiments to obtain force versus distance profiles for the interaction between a streptavidin surface and a supported lipid bilayer anchoring different architectures of PEG-2k and PEG-5k, where a known fraction of the shorter polymer was functionalized with biotin. This study suggests that liposome targeting should be enhanced by modifying the surface of the particle with a bidisperse polymer layer where the ligand-bearing polymer has an elongated configuration which is longer than the Flory radius of the filler polymer.
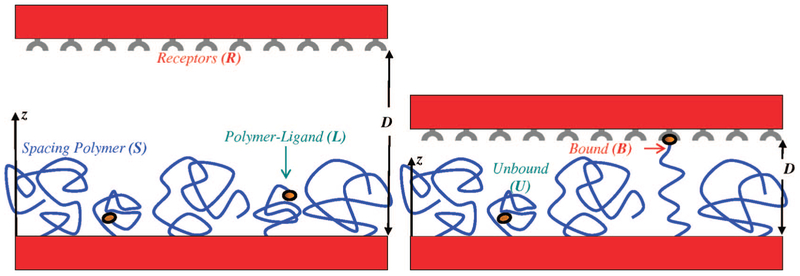
A molecular theory, previously used to study ligand–receptor interactions between a polymer modified surface and small proteins,32 is generalized here to address the problem of a planar surface coated with receptors that is interacting with a bimodal polymer-layer-modified surface. One of the polymeric species in this bimodal layer is functionalized with ligands; see Figure 1. The question that we aim to answer in this work is, what should be the optimal bimodal polymer layer architecture in order to achieve optimal binding capabilities? Design variables in this layer architecture include (1) polymer surface coverage, (2) molecular weight of both polymers, and (3) fraction of ligand functionalized polymers. In addition, we sought to understand the structure of the bidisperse layer as a function of the distance between the surfaces and the influence of the polymer structure on the interaction between the surfaces.
Figure 1.
Schematic representation of the system of interest. The ligands are attached to the free ends of surface-tethered polymer chains (L). The surface is also covered with an unfunctionalized filler spacer (S). A surface covered by receptors molecules (R) is separated by a distance D from the grafting surface. z is the distance from the grafting surface to an arbitrary point. When D is small enough, a fraction of the ligand-functionalized polymers can bind to the receptor surface (B). Unbound functionalized polymers are denoted by (U).
The next section presents the theoretical approach as well as the molecular model used in the calculations. Following that section we introduce representative results for the interactions between coated surfaces as well as the structure of the layer under different conditions. We also present direct comparisons of the theoretical predictions with experimental SFA measurements. The last section presents concluding remarks and directions for future work.
2. Molecular Theory
Consider the system shown in Figure 1, where two planar parallel surfaces, each with a total surface area, A, are separated by a distance D. One of these surfaces has a total of N polymers that are end-grafted to it such that the polymer layer is a binary mixture of polymer types, where NS of these polymers have chain length nS, while NL polymers (where N = NS + NL), of chain length nL, have a ligand molecule chemically conjugated to their free end. The polymers may differ in chain length, but the monomer chemical structure is identical so that each monomer is characterized by a volume vp. The opposing surface, located at a distance D from the grafting surface, has a high density of receptors (i.e., in an excess number as compared to ligands) that can bind to the ligands attached to the functionalized polymers. Thus, the polymer bearing the ligand molecule can be present in two possible states, unbound and bound (denoted by U and B, respectively) to the opposing surface. The binary polymer layer is in equilibrium within a solvent (water) that is good for the polymers and characterized by a volume, vw.
The free energy per unit area of the system at D is given by
| (1) |
where β = 1/kBT is the inverse absolute temperature, P(αS) represents the probability distribution function (pdf) of finding the polymer spacer of chain length nS in conformation αS, while P(αU) denotes the pdf of finding the unbound ligand-modified polymer in conformation αU and P(αB, D), on the other hand, is the pdf of finding the bound polymer in conformation αB, D and ε is the free-energy of a ligand–receptor bond. z measures the distance from the surface and the origin, z = 0, is set at the grafting surface, while z = D corresponds to the receptor surface. The total polymer surface coverage is given by σ = N/A, while xL is the fraction of polymers bearing a ligand, such that NL = xLN and NS = (1 – xL)N. At surface separation D, fD defines the fraction of ligand functionalized polymers that are in the bound state. Note that if D is greater than the maximum elongation length of the functionalized polymer, then fD must equal zero. Thus, the total number of bound polymers is given by fDNL = fDxLN, while the total number of unbound-ligand-functionalized polymers is (1 – fD)NL = (1 – fD)xLN. The z-dependent solvent density is defined by ρw(z).
The first two terms in eq 1 correspond to the conformational entropy of the unfunctionalized species and the unbound-ligand-functionalized polymer, respectively. The third term in the free energy density is the conformational entropy of the bound species plus the total binding energy. The fourth term corresponds to the z-dependent translational (mixing) entropy of the solvent. The last three terms include the mixing entropy of the unfunctionalized polymer, unbound-ligand-modified polymer, and bound polymer, respectively.
The repulsive interactions are considered at the excluded volume level and are included as packing constraints. Namely, at each distance, z, from the grafting surface, the available volume is filled by solvent, unfunctionalized polymer, bound- or unbound-ligand-functionalized polymer. This leads to
| (2) |
where the first contribution is from the unfunctionalized polymer, the second and third are from the unbound and bound ligand-modified polymers, respectively, and the last term represents the solvent contribution. The brackets, 〈〉, represent ensemble averages over the corresponding pdf’s, and 〈vi(z)〉 is the average volume that molecules of type i occupy at z.
The pdf’s for the different polymeric species and the solvent density are obtained by minimizing the free energy, Equation 1, subject to the packing constraint, eq 2. For this, Lagrange multipliers, βπ(z), are introduced to yield for the pdf of unfunctionalized polymers
| (3) |
where qS is the normalization constant or partition function, which ensures that ΣαS P(αS) = 1, and vS(αS; z)dz is the volume occupied by the unfunctionalized polymer in conformation αS in the region between z and z + dz.
An analogous expression to eq 3 is obtained for the pdf’s of the unbound-ligand-functionalized polymers. For the bound species
| (4) |
where qB is the partition function that assures ∑αB, DP(αB, D) = 1.
The fraction of functionalized polymers that are bound is given by fD = qB/(qU+qB), a relation that can also be obtained through minimization of the free energy with respect to fD subject to the packing constraint.
Finally, the solvent volume fraction profile is given by
| (5) |
The physical meaning of the Lagrange multipliers can be seen in the last expression. They are the z-dependent osmotic pressures, associated with the inhomogeneous distribution of solute and solvent. Thus, they are associated with the lateral repulsion necessary to pack all molecular species in the inhomogeneous environment imposed by the presence of the surfaces. More discussion of the physical meaning of Lagrange multipliers and the thermodynamic consequences of the incompressibility assumption can be found in ref 38.
2.1. Molecular Models and Numerical Methodology.
The numerical values of the Lagrange multipliers are obtained by replacing the expressions for the pdf’s of the different polymer species (see eqs 3 and 4, for example) and the solvent density profile, eq 5, into the packing constraint equation, eq 2. In practice, the z-direction is discretized into layers of finite thickness, δ, and, thus, all the integrals are replaced by sumations over the set of layers. In other words, , where M is the number of layers such that Mδ = D. The resulting set of discrete equations requires the following inputs: (i) the total surface coverage of grafted polymers, σ; (ii) the fraction of polymers that are functionalized, xL; (iii) the z-dependent volume distribution, vS(z, αS), for each conformation, αS, of the unfunctionalized polymer; similarly, (iv) the z-dependent volume distribution, vL(z, αL), for each conformation, αL, of the unbound functionalized polymer; (v) the z-dependent volume distribution, vB(z, αB, D), for each conformation, αB, D, of the functionalized polymer that can bind to receptors in the opposing surface at a distance D from the grafting surface; and (vi) the ligand–receptor binding free energy, ε.
For items (iii–v), the molecular model used is described below. The unfunctionalized and unbound-ligand-functionalized polymer molecules are modeled using a rotational isomeric model39 in which each CH2CH2O (EG) polymer segment can assume three isoenergetic configurations with the geometry of trans, gauche+, and gauche− as described in ref 40. Thus, in principle, the number of possible conformations of a polymer molecule with n segments is 3n−1. From a practical point of view, however, this is an unrealistic number of conformations, for the polymer type and values of n of interest since self-avoidance needs to be checked for each conformation. Therefore, the polymer of interest for this study, PEG, is modeled as described in our previous work where it has been shown that the generation of around 106 independent self-avoiding chain conformations can describe the steric properties of tethered polymer layers in all the experimental relevant regimes of surface coverage for each of the chain lengths treated here. This previous work showed that the chain model used here provides quantitatively agreement between the calculated behavior and the experimental observations reported. Examples include the pressure–area isotherms of PEG-tethered layers40 and the adsorption isotherms of lysozyme and fibrinogen on surfaces with grafted PEG for a large variety of polymer molecular weights and surface coverages.26,41 Each segment represents a EG group, and the bond length of l = 0.35 nm is the effective distance between the centers of two unified groups, the volume of the polymer segments is taken as vp = 0.06 nm3 while that of the water (solvent) is vs = 0.03 nm3. For more details on the chain model and its applicability, see, for example, refs 26, 38, 42, and 43.
The chain model is implemented by beginning with a random sequence of bonds. The bond sequence is then translated into Cartesian coordinates by matrix multiplication using the RIS chain model as described elsewhere.39,43 The first segment is translated to the origin of the coordinate system, and self-avoidance between all the segments is checked. If the chain is confirmed to be self-avoiding, it is then checked to verify that all segments are contained between both surfaces, i.e., 0 ≤ zi(αJ) ≤ D, i = 1,…, nJ; J = S, L. If the generated chain fulfills both conditions, the conformation is accepted and the distribution of volume, vJ(i, αJ), that is, the volume that conformation αJ contributes to layer i, is determined. This procedure is repeated until 5 × 10⁶ independent chain conformations are obtained.
The bound conformations are generated by Molecular Dynamics simulations using Gromacs 3.3.1.44 The reason for using this method to generate the bound conformations instead of the random generation of chains used for the unbound and unfunctionalized polymers is because elongated chains are rarely obtained using the random generation method. Although the contribution of elongated chains to the steric repulsions between the walls can be ignored, these chains are very important to describe the binding interactions appropriately. For example, the probability of randomly generating the completely elongated chain is essentially zero. However, this conformation must be accounted for in order to properly describe the interactions between the walls when they are separated by a distance, Db, equal to the length of the fully elongated conformation of the polymer bearing the ligand. Indeed, if this conformation is not included, the interactions between the walls are almost negligible at D = Db while the interaction versus separation profile contains a minimum energy if this conformation is considered. This is also valid for all distances, D≤Db, where chain conformations bridging both surfaces must be included.
A coarse-grained force field45 was used for the interactions between EG groups, while the length of the segment was kept fixed at l = 0.35 nm using the LINCS algorithm.46 The walls were represented by close-packed spherical particles in a plane and a harmonic potential with a strength of 107 kJ/(mol • nm2) was used to fix the two walls and the two end groups of the polymer to each wall. In order to prevent the polymer chain from crossing the walls, the interaction between a wall particle and a polymer monomer (excluding the ends) is represented by a potential of the form u = 6.89 × 10⁻⁵(1/r)12, in kJ nm12/mol units, where r is the distance between the wall particle and the monomer (in nanometer units) and the cutoff distance is 1.4 nm. A cell list method47 was used in the calculation of the nonbonded interactions, which was updated every five integration steps. A Berendsen thermostat48 was used to keep the system at a constant temperature of 300 K. The system consisted of a large cubic box with periodic boundary conditions, and the integration time was 2 fs. Initially, the system is equilibrated for 100 ps and then the chain coordinates are recorded every 0.2 ps during a production time of 2 ns, which makes a total of 104 conformations for the bound polymer. Once the bound conformations are generated, the discretized distribution of volumes needed to solve the equations are calculated. This procedure is repeated for each surface separation of interest.
For each polymer molecular weight, the conformations of the unbound and unfunctionalized species are generated once and this set is used for all different conditions of surface coverage, distances between the surfaces, and binding free energies, while discarding the chains that have one or more segments outside of the region delimited by the planes z = 0 and z = D. For the bound species, however, a new set of conformations needs to be generated for each surface separation.
After discretization of the packing constraint, eq 2, the set of equations to be solved for the unknown π(z) is
| (6) |
The discrete forms of the pdf’s and solvent density profile are then used. For example, the solvent volume fraction is
| (7) |
where a dimensionless lateral pressure has been defined by dz, which is more convenient for numerical purposes. The pdf of the unfunctionalized polymer spacer is given by
| (8) |
where the volume of the polymer chain is measured in units of solvent volume, and the explicit form of the partition function is
| (9) |
The pdf of the unbound species is written similarly. For the bound functionalized polymer the discrete form of the pdf is given by
| (10) |
and the partition function is expressed as
| (11) |
With all the discrete expressions replaced in the constraint equation, eq 6, a set of M coupled nonlinear equations for the lateral pressures, {π′(i); i = 1,…, M}, are obtained, each equation containing a few million terms, depending on the total number of unfunctionalized, unbound, and bound polymer conformations. These equations are then solved by standard numerical methods.
It should be mentioned that while our results are presented for PEG in water, the conclusions are valid for any flexible polymer system in a good solvent environment. The main reason for referring to PEG as the polymer of interest throughout is 3-fold. First, it has a wide range of applications in biomaterials. Second, the chain model used was developed in previous work for this polymer (when water is a good solvent). Finally, there are experimental data available31 to enable direct comparisons with our results.
3. Results
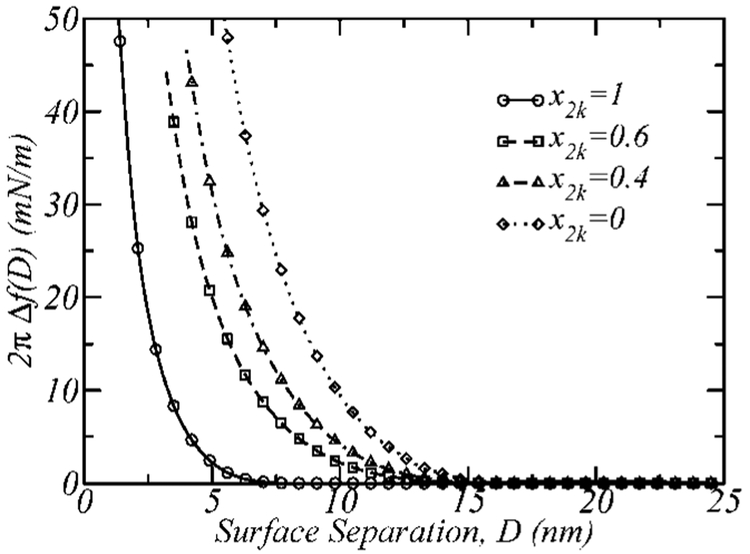
The free energy per unit area, f(D) = F(D)/2A, of the interactions between the surfaces as a function of their separation, D, was calculated using the molecularly detailed theory. Using the Derjaguin approximation,49 2πΔf(D) (with Δf(D) = f(D) – f(∞)) equals the force, divided by the radius of the cylinder, between two cylindrical surfaces perpendicular to each other. Figure 2 presents our 2πΔf(D) vs D calculations, referred to as force or interaction profiles. The reason for calculating this quantity is that these results can be directly compared to SFA experiments. The curves describe the interaction versus separation between the surfaces when there are no ligand-functionalized polymers in the layer. Four different architectures are presented in the figure, two monodisperse layers composed of 2k (i.e., PEG-2000, which has n2k = 45 ethylene glycol (EG) segments) and 5k (i.e., PEG-5000, which has n5k = 113 EG segments) polymers and two binary mixtures, 2k–5k having different compositions (x2k = 0.4 and x2k = 0.6). As can be seen from Figure 2, the repulsive interactions between the walls begin when the walls are closer than roughly 13 nm for the pure 5k layer, 6 nm for the 2k layer, and intermediate surface separations for the binary mixtures.
Figure 2.
The steric repulsions between the surfaces. The interactions (the force, using the Derjaguin approximation) between the surfaces, 2πΔf(D), as a function of the surface separation, D, for four different nonligated polymer layers, 2k (x2k = 1), 2k–5k with x2k = 0.6 and x2k = 0.4, and 5k (x2k = 0). The total polymer surface coverage is σ = 0.12 nm−2.
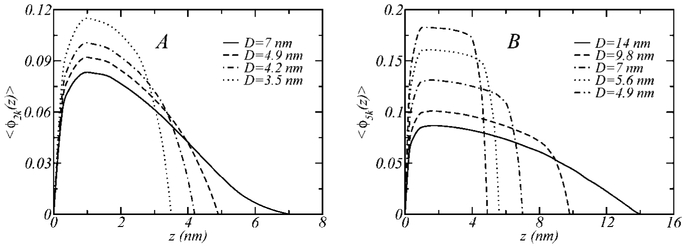
The behavior observed in Figure 2 can be easily explained by looking at Figure 3, which shows the volume fraction of the polymers, for the one-component layers 2k (A) and 5k (B), as a function of the distance from the grafting surface for different surface separations. 〈ϕ(z)〉 is the average volume fraction occupied by the polymer species between z and z + dz. Thus, 〈ϕ2k(z)〉 = σx2k〈v2k(z)〉 and 〈ϕ5k(z)〉 = σx5k〈v5k(z)〉 (note that x2k + x5k = 1), where 〈v2k(z)〉 dz and 〈v5k(z)〉 dz are, respectively, the average volume occupied by the polymers 2k and 5k between z and z + dz. The cases shown in Figure 3 correspond to x2k = 1 (A) and x5k = 1 (B).
Figure 3.
The average volume fraction, 〈ϕ(z)〉, as a function of the distance from the grafting surface, z, for the 2k (A) and 5k (B) polymer layers shown in Figure 2 and for different surface separations, D.
For the shorter polymer chain, when the surface separation is D = 7 nm, the volume fraction distribution is indistinguishable from the case where the surfaces are far away (D = ∞). As the surfaces are brought closer together (D < 7 nm), however, the layer starts to progressively compress, leading to an observed increase in the repulsive interaction. The same behavior is observed for the 5k polymer, the only difference being that the onset of repulsions begin at D~14 nm.
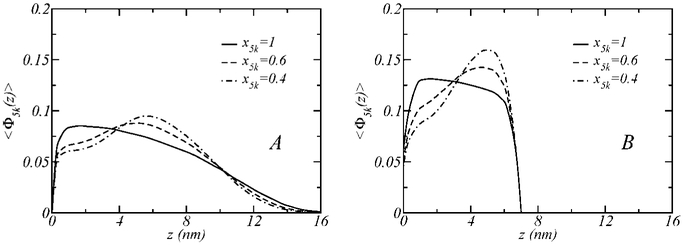
Figure 4 illustrates the structure of PEG-5k for different polymer layer compositions and two different surface separations, corresponding to the surfaces being far apart (A), where the surface interactions are negligable, and separated by 7 nm (B), where the steric repulsions between the surfaces are significant. Defining 〈Φ5k(z)〉 as the ratio between the volume fraction and the concentration of PEG-5k (i.e., 〈Φ5k(z)〉 = 〈ϕ5k(z)〉/x5k), different concentration cases can be directly compared in the same graph. In the pure case (x5k = 1), the broad volume fraction distribution corresponding to D = ∞ and the compressed distribution at D = 7 nm both display a maximum at small values of z (z ~ 2 nm). The addition of PEG-2k to the layer causes the long polymer to stretch to accommodate the short polymer at lower distance, such that the distribution maximum is moved to greater z’s from the grafting surface. This behavior is in accordance with the previous theoretical results of Dan and Tirrell.35 The effect is observed in both the uncompressed and compressed layer conditions. It is most notable, however, at higher concentrations of the short polymer (i.e., larger x2k ’s), where the PEG-5k needs to stretch to make room for larger amounts of the shorter polymer chain at smaller distances from the grafting surface.
Figure 4.
Structure of the polymer layers shown in Figure 2 that contain PEG-5k for the cases where the surfaces are far apart (A) and separated by a distance of D = 7 nm. 〈Φ5k(z)〉 is defined as the ratio between the volume fraction and the concentration of PEG-5k, 〈ϕ5k(z)〉/x5k.
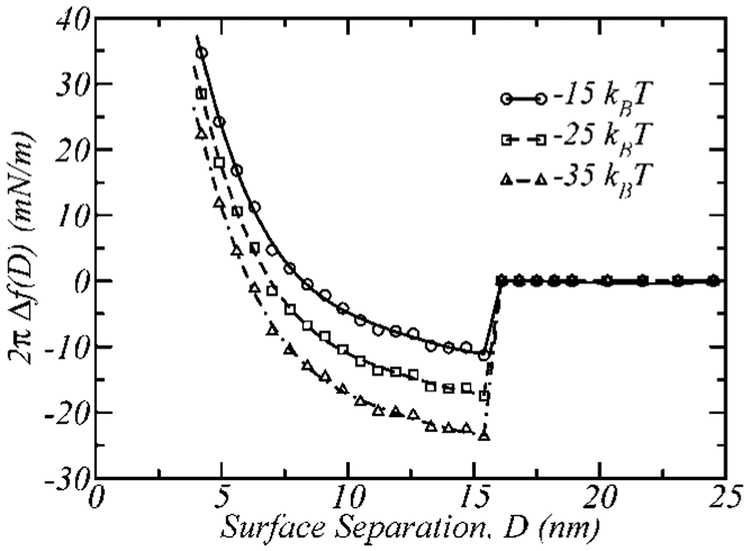
Figure 5 shows the interaction profiles between the surfaces as a function of the surface separation for different values of the ligand–receptor binding free energy, ε. The binary layer, referred to in the following as 5k–2kL, is a mixture of the 2k ligand-functionalized polymer (2kL) and an unfunctionalized 5k. The fraction of the total number of polymers bearing a ligand molecule is x2kL = 0.4, in all the profiles presented in the figure.
Figure 5.
Interaction profiles; 2πΔf(D) as a function of the surface separation for different binding free energies, for a bimodal structure 5k–2kL, with xL = 0.4 and total polymer surface coverage σ = 0.12 nm−2.
From the protein–ligand database (PLD)50 the binding energies for the pair biotin–streptavidin51-54 and histidine–histidine binding protein55,56 are −71 kJ/mol and −42 kJ/mol, which roughly corresponds to − 30kBT and −17kBT, respectively, at room temperature. Most of the biologically relevant ligand–receptor binding energies fall within this range; therefore, varying ε from −35kBT to −15kBT will cover most of the binding energies of biological interest. (For example, ε = −25kBT corresponds to the interaction of the complex formed by human thrombin,57 a protein that plays a key role in many disease processes, such as thrombosis and hemostasis and its ligand, whose binding energy is −52 kJ/mol.50)
The features of the interaction profiles observed in Figure 5 are common to all binding cases calculated. The separation at which the surfaces bind is Db ≈ 15 nm, which is independent of the ligand–receptor complex binding energy. For D > Db, the interactions between the walls are negligible for two reasons. First, the ligand–receptor binding is specific, and occur over short distances, i.e., it is short ranged. This condition is modeled in this study by allowing the binding of the end group of the functionalized polymer only when this segment touches the receptor surface. In this case, the functionalized polymer is PEG-2k with 45 EG segments and a maximum elongation length of roughly 15 nm, which is equal to Db. This means that for surface separations greater than Db, the ligands cannot reach the receptor surface, resulting in no attractions between the surfaces. In addition, the surfaces are not close enough to compress the structures of either of the polymers (see Figure 2). In particular, the longer unfunctionalized polymer in the mixture, PEG-5k, is only compressed when D < 13–14 nm, resulting in no steric repulsions between the surfaces at distances greater than this.
Another calculated result is the fraction of bound functionalized polymers, fD. This quantity is a discontinuous function of the surface separation, being fD = 0, if D > Db and fD = 1, if D ≤ Db. In other words, not only does bridging between the surfaces begin at a separation Db equal to the functionalized polymer maximum elongation length (in agreement with experimental observations36,37) but also all of the functionalized polymers bind to the receptors surface at this point. This behavior is also manifested in the discontinuity of the interaction profile at D = Db. Note that all the ligands bind to receptors because we are only considering cases in which the surfaces have excess of receptors and we are treating the systems at thermodynamic equilibrium.
An additional finding from our calculations is that changes in the ligand–receptor binding free energy (i.e., the value of Δf at D = Db when xL = 1) results in a parallel shifting of the profile upward or downward depending on whether ε is decreased or increased in absolute value. These shifts are proportional to the change in binding energy, which shows that changing the binding energy within the range −35, −15kBT does not affect the fraction of bound polymers in our calculations.
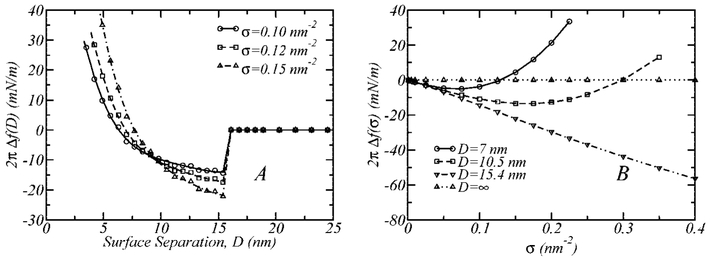
Figure 6 illustrates the dependence of the interactions between the walls on the total polymer surface density for a binary polymer layer 5k–2kL, with a fraction of functionalized polymers, x2kl = 0.4, and binding energy, ε = −25kBT. The range of surface coverage studied corresponds to that relevant for the design of sterically stabilized liposomes.58,59
Figure 6.
Influence of the total polymer surface coverage, σ, on a 5k–2kL polymer layer with xL = 0.4 and ε = −25kBT. (A) Interaction profiles for different values of the polymer surface coverage. (B) The strength of the interaction between the surfaces, 2πΔf(σ), as a function of the polymer surface coverage for different fixed surface separations.
Figure 6A shows binding profiles for different polymer surface densities. At a surface separation equal to Db, the stronger attraction for the higher surface coverage is simply associated with a greater number of ligand–receptor bonds possible since there is a greater number of functionalized polymers in the system. As the surfaces approach one another, a larger σ possesses stronger steric repulsions between the surfaces, leading to interaction profiles that intersect each other.
Figure 6B displays the dependence of the surface interactions as a function of the polymer surface density for different fixed surface separations. When D = ∞, the surfaces do not interact with each other, regardless of the polymer surface coverage. At the binding distance (Db ≈ 15 nm), the strength of the attractive interaction between the surfaces increases linearly with surface coverage because the number of ligand–receptors bonds depends linearly on the number of functionalized polymers (there is no steric repulsion at this distance). For smaller surface separations, the interaction profiles display a minimum as a function of the total surface coverage. In other words, at a given surface separation distance, there is a surface coverage for which attractions between the walls are maximized. This result is relevant for devices where the separation between the surfaces is a constraint. For those systems, the interactions between the surfaces can be tuned through the polymer surface coverage, molecular weight, and ratio of binary polymer layer. Moreover, if it is possible to develop a method where the grafting of the polymer surface occurs after the surface separation has been fixed, then the surface coverage can be controlled. The surface coverage in that case will be that which minimizes the free energy at the given separation between the surfaces.
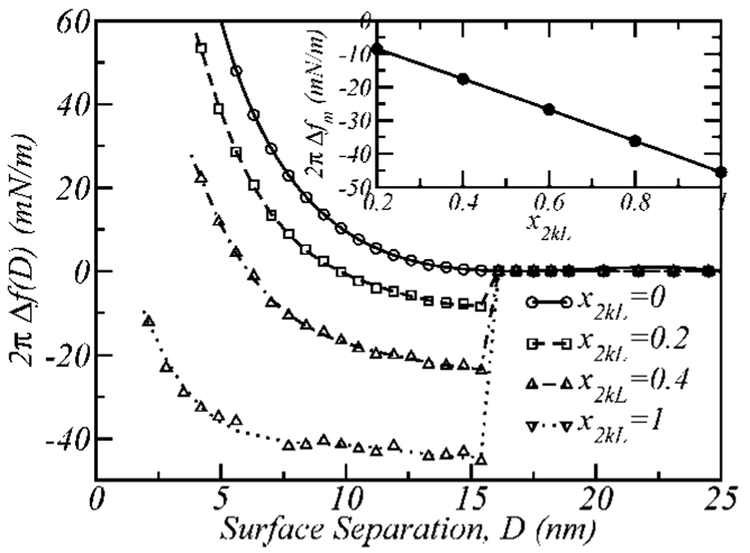
Figure 7 presents surface interaction profiles for different fractions of functionalized polymers in a binary 5k–2kL layer with σ = 0.12 nm−2 and ε = −25kBT. Because the total surface coverage of polymer is constant in all the cases shown in the figure, increasing x2kL not only increases the negative binding contribution to the total interaction for a given surface separation but also decreases the steric repulsion due to a reduced density of the longer 5k polymer. At Db, the steric repulsions do not significantly contribute to the net interaction, such that the only contribution to the interaction results from ligand–receptor binding. This produces a linear dependence between the maximum attraction between the surfaces, 2πΔfm, which occurs at binding surface separation (Δfm = Δf(Db)), and the fraction of functionalized polymers in the mixed layer (see inset of Figure 7).
Figure 7.
2πΔf(D) vs D profiles for 5k–2kL layers with σ = 0.12 nm−2, having different concentrations of the ligand bearing polymer, x2kL (xL). The upper right side inset shows the strength of the maximum attraction (at binding surface separation, Db), 2πΔfm, as a function of x2kL.
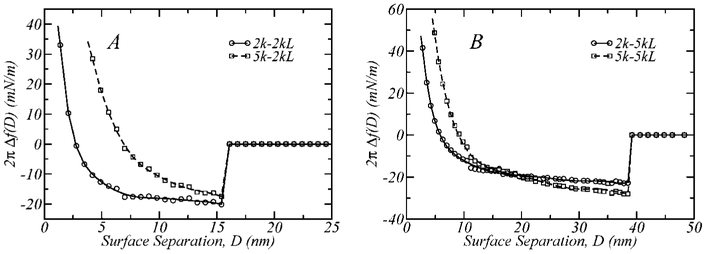
Another design variable in the development of targeted sterically stabilized liposomes or biosensors with optimal detection capabilities is the molecular weight of the functionalized and unfunctionalized polymers. Four different layer architectures are presented in Figure 8, where the fraction of functionalized polymers is always xL = 0.4 and the surface coverage and binding energy are the same as for Figure 7. Figure 8A shows the surface interaction profiles of two binary layers where the ligand-conjugated polymer is 2kL and the nonfunctionalized spacers are 2k and 5k, respectively. In the binary layers presented in Figure 8B, the functionalized polymer is longer, 5kL, and the unfunctionalized polymers are again 2k and 5k, respectively.
Figure 8.
Interaction profiles for different bimodal architectures with xL = 0.4, ε = −25kBT and σ = 0.12 nm−2. The cases where the ligand bearing polymer is 2kL (A) and 5kL (B) are presented, in binary mixtures with the filling spacers 2k and 5k. Note that the number of EG segments in PEG-2k is n2k = 45, and that of PEG-5k is n5k = 113, which makes their extended conformations reach roughly 15 and 40 nm, respectively.
Our findings clearly show that the surface separation at which binding occurs, Db, is independent of the molecular weight of the unfunctionalized spacer and equal to the maximum extension length of the functionalized polymer (i.e., 15 nm for PEG-2k and 40 nm for PEG-5k). At small separations (D< ~7 nm, for Figure 8A and D< ~10 nm, for Figure 8B), the repulsions are stronger for the layers containing the longer unfunctionalized spacer (5k), as expected.
A very interesting feature observed in Figure 8A is the fact that at the binding separation the strength of the interactions is not equal for the curves being compared. This is even more notable for the curves in Figure 8B (note the different scales of the graphs). In both cases, the molecular weight, fraction, and density of the functionalized polymer are identical, meaning that the attractive contribution to the total interaction must be equal. In addition, the steric repulsions in both cases become significant at much smaller distances; therefore, it would be expected that the interactions at Db would be equal since the functionalized polymer composition is the same. Another intriguing feature of this observation is that, for Figure 8B, the strongest attraction between the surfaces occurs for the longer spacing polymer, 5k.
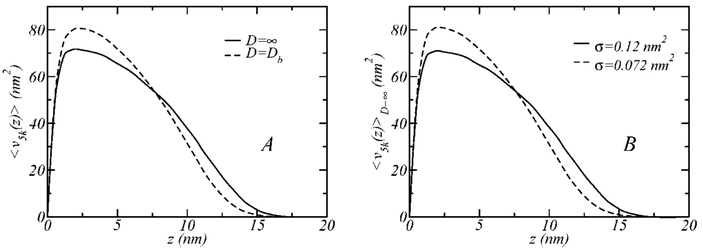
These results can be understood by examining the structure of the unfunctionalized polymer in the binary layers. We concentrate our attention on the cases where the functionalized polymer is PEG-5k, shown in Figure 8B, and look at the structure of the layer. Figure 9A shows the average volume distribution of the unconjugated polymer (5k) in the 5k–5kL layer for the cases where the surfaces are far apart from each other, D = ∞, and at binding separation D = Db. When the receptors surface is at D = Db, the functionalized polymers stretch out to bridge both surfaces, leaving room for the unfunctionalized polymer to fill, which results in the different volume distributions shown in Figure 9A. Because the functionalized polymers are bound and elongated at x5kL = 0.4, the situation for the unfunctionalized polymer is similar to a 40% reduction in the total polymer surface density. Supporting this interpretation are the data shown in Figure 9B, where the volume distributions of pure 5k layers at D = ∞, having surface coverage values of σ = 0.12 nm−2 and σ = 0.072 nm−2 (i.e., 40% smaller) are compared.
Figure 9.
The average volume distribution of PEG-5k, 〈v5k〉, as a function of the distance from the grafting surface for different conditions. (A) The structure of PEG-5k within the binary layer 5k–5kL shown in Figure 8B, when the surfaces are far apart (solid line) and at binding distance (dashed line); the surface coverage is σ = 0.12 nm−2 and x5k = 0.6 (x5kL = 0.4). (B) The structure of PEG-5k in pure layers (x5k = 1), for the cases σ = 0.12 nm−2 (solid line) and σ = 0.6 0.12 nm−2 = 0.072 nm−2 (dashed line).
The structures shown in Figure 9A are indistinguishable from those shown in Figure 9B, indicating that the gain in conformational freedom of the unbound polymers upon stretching of the functionalized polymer is the origin of the increased attraction between the surfaces in the 5k–5kL case compared to the 2k–5kL system (Figure 8B). In addition, the smaller size of the 2k spacer implies that the effect of the relaxation of lateral pressures upon stretching of the longer functionalized polymer will be less extensive in this case (2k–5kL layer), resulting in a lower reduction of the free energy than in the 5k–5kL layer. The situation is different when the functionalized polymer is shorter because the longer 5k polymer contributes more significantly to the steric repulsions between the surfaces at Db. This also explains the stronger attraction between the surfaces at Db for the 2k–2kL case compared to the mixed 5k–2kL layer.
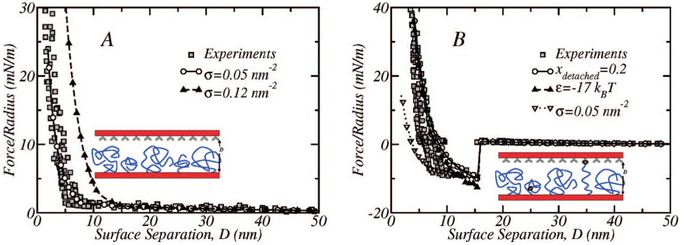
Figure 10A displays the experimental force versus surface separation profiles, determined via SFA by Moore and Kuhl,31 for the compression of a mixed 5k–2k layer with x2k = 0.4 and σ = 1.19 × 105 μm−2 ≈ 0.12 nm−2, together with the calculated profile of the same binary layer. Figure 10B shows the force versus distance profile comparison between experiments and theory for a mixed 5k–2kL layer where x2kL = 0.4, σ = 0.12 nm−2 and a binding energy of ε = −35kBT (which roughly corresponds to the experimentally determined biotin–streptavidin binding strength60). In the theoretical case, however, 80% of the ligand-functionalized polymers are allowed to bind the receptor surface. This is to account for the possibility of lipid pull-out and will be discussed later on. Moreover, electrostatic repulsions to account for the buffer electrolyte in the experimental solution and the charges on the mica surfaces31 of the form F/R = (πσe2/ε1ε0κ)e-κD have been included for D > 10 nm in all the theoretical curves, where F/R is the force over the radius of the cantilever, σe is the surface electric charge, ε1 and ε0 are the electrical permittivity of the medium and the vacuum, respectively, and κ is the inverse of the Debye length. We use the values of ε1 = 78 and κ 4.3 nm−1 as taken from the experimental system.31
Figure 10.
Comparison of the theoretical results with experimental data (filled squares) published in ref 31 (A) Experimental and calculated force profiles for a 5k–2k nonligated layer with x2k = 0.4 and total polymer surface coverage, σ = 0.12 nm−2. The theoretical profile for the same layer but having a lower surface coverage, σ = 0.05 nm−2, is also shown. (B) The SFA experiments correspond to the interaction of a streptavidin surface and a surface grafted with a 5k–2kL polymer layer where the ligand is biotin. The theoretical curve (open circles joined by a solid line) corresponds to a 5k–2kL layer with the same surface coverage, σ = 0.12 nm−2, and fraction of ligand functionalized polymers x2kL = 0.4, as in the experiments; the binding energy is ε = −35kBT, which corresponds to the biotin–streptavidin binding strength. In the theoretical case, only 80% of the ligand modified polymers are allowed to bind the receptor surface to account for the inuence of lipid detachment (see discussion below). Two more calculations for the same layer are shown. In one case the binding energy is lower, ε = −17kBT, and in the other the surface coverage is σ = 0.05 nm−2 (as in one of the calculations shown in Figure 10A). In both of these cases all ligated polymers can bind the opposed surface.
In the case of the nonligated mixture of Figure 10A, the theoretical profile shows the same trend and shape as the experimental data. At small surface separations (D < 10 nm) there is a shift of the predicted repulsions to larger distances as compared to the experimental observations. There are several possibilities for the differences between the predictions and the observations. For example, the experimental surface coverage may not be the same as the one that we use in the calculations. We have added in the figure the predictions for a smaller surface coverage, i.e., σ = 0.05 nm−2, which shows excellent quantitative agreement with the experimental observations. There may also be systematic errors in the experimental determinations of surface separations (Dr. N. W. Moore in private communication). It is also conceivable that there is additional physics in the problem which is not accounted for in our free energy functional. One possibility is that polymer segments interact with the streptavidin surface. Calculations were performed where polymer segments within a 0.7 nm distance of the receptor surface are allowed to interact with it over a range of different adsorption energies, , between – 1kBT and −0.05kBT.61 These profiles, however, display a local minimum that it is not observed in the experimental data. The curves including the adsorption energy are continuous unlike the binding profiles presented thoughout this work. The local minimum becomes deeper as increases and for greater than roughly 0.1kBT, the net force at the local minimum is attractive, which means that segment adsorption is the dominant contribution to the free energy as opposed to the steric repulsions. The inclusion of this adsorption energy shifts the profile in the appropriately direction and using , the theoretical profile fits the data very well at low separations, but the local minimum will be observed.
Another possibility is the quality of the solvent. In this work, a good solvent has been considered by taking the polymer segment–segment and the polymer segment–solvent interactions to be equal. In the situation of a slightly poorer solvent, the structure of the polymer layer will shrink, as compared to the profiles shown in for example Figure 3, resulting in a shifted force profile.
For the case of the ligated polymer shown in Figure 10B, the experimental curve compares with the same theoretical case, but when 80% of the ligand-functionalized polymers are bound to the surface. Leckband et al.62 have shown that the ligand–receptor binding is insufficient to describe the interactions between these surfaces and lipid membrane failure due to lipid pull-out must be also considered. The energy required to pull a lipid out of the lipid bilayer is 30kBT which is less, in absolute value, than the biotin–streptavidin bond energy. Therefore, at detachment surface separation (binding distance) membrane failure will be preferential to ligand–receptor bond breakage. Thus, the situation modeled here is that where at equilibrium 20% of the lipids have already detached from the surface. A similar agreement with experiments is achieved by considering all the polymers to have a ligand but with a smaller (in absolute value) effective binding energy (per bond) of –17kBT, which is less than half of the complex biotin–streptavidin (see Figure 5). This particular value was estimated before the calculations were carried out from the linear dependence of the free energy of binding on the bond strength, see Figure 5, and on composition, see Figure 7. The results presented in Figure 10B confirm that the linear relationships are valid under all conditions.
In both cases, the ligated (5k–2kL) and nonligated (5k–2k) polymer structures, the qualitative agreement of the molecular theory and the experiments is very good. The quantitative agreement between theory and experiments is also good, particularly considering how challenging is the precise determination of some experimental parameters. The most relevant among those parameters are perhaps the surface coverage, the separation between the surfaces, and the detachment pathway between the surfaces. However, the comparison of the experimental observations with and without the ligand strongly suggest that both experiments are not at the same surface coverage. The repulsive part of the measured forces arises from the steric repulsions between the polymers. We have added in Figure 10B the curve that compares quantitatively to the purely repulsive case, which according to our calculations corresponds to a lower surface coverage than the one reported by the experiments. The curve corresponds to repulsions that are significantly lower than the repulsions in the presence of the ligand. The only physical explanation of this effect, we believe, is that the surface coverage in both experiments is different.
4. Concluding Remarks
A molecular theory which enables the calculation of the free energy of the interaction of a polydisperse polymer-grafted surface bearing ligand-functionalized polymers and a receptor surface is presented. Different polymer layer compositions are considered, including nonligated structures, 5k–2k polymer mixtures with concentrations of PEG-2k from x2k = 0 to 1, as well as structures including a ligand-functionalized polymer, 2k–2kL, 2k–5kL, 5k–2kL, 5k–5kL, having different fractions of ligand modified polymers, xL from 0 to 1.
When the polymers are not ligand functionalized, the strength of the repulsions as well as the range of this interaction between the surfaces depends on the composition of the binary layer and the molecular weight of the conformers which determines the structure of the polymer grafted surface. This is in agreement with earlier theoretical and recent experimental observations.31,35
For the ligated layers, the surface interaction versus distance profiles exhibit a discontinuous drop at a surface separation, Db, equivalent to the maximal elongation length of the ligand-bearing polymer in agreement with experimental results,31,36 indicating that at this binding distance the two surfaces are bridged. Binding between the surfaces is observed even if the molecular weight of the ligand-bearing polymer is much smaller than that of the unmodified polymer. The distance at which the surfaces bind is independent of the architecture of the polymer layer and is dependent only on the molecular weight of the ligand-functionalized polymer as observed experimentally.31 The structure and architecture of the polymer layer (composition, fraction of ligand conjugated polymers, molecular weight of both polymers), however, affects the strength of the attraction between the surfaces at the binding distance, due to the binding contributions to the free energy and the relaxation of lateral steric repulsions when the chain stretches to bridge both surfaces.
At each surface separation less than or equal to the binding distance, the strength of the interactions between the surfaces can be tuned by selecting the binding energy (ligand–receptor pair), the total polymer surface coverage, or the fraction of ligand-functionalized polymers. In particular, for separations D < Db, the free energy of the system possesses a local minimum as a function of polymer surface coverage. Therefore, the proper choice of the polymer molecular weight and surface coverage can be used to set the position at which the surfaces bind or to control the strength of the interaction if the surface separation is a key design constraint.
Our theoretical results show good agreement with SFA experiments. Our model is able to adequately describe the steric repulsions between the nonligated polymer surface and the opposing surface without the use of fitting parameters. In the case of the ligated polymer layer, the agreement is also good showing that ligand–receptor binding energy is insufficient to describe these types of experiments such that lipid membrane failure must be considered as previously suggested.62 Our results suggest than lipid pull-out is the preferential detachment mechanism between the surfaces in the experiments. A limitation of our theory is the absence of a molecularly detailed model of the lipid pull-out instead of simply considering a reduction of the bound polymers or the use of a smaller effective binding energy. In the bound conformation, the ligand molecules are locked inside the receptors so that and they contribute no volume to the system delimited by the surfaces. For this reason, we do not include a molecular description of the ligand molecule and consider it volumeless. However, if a considerable fraction of ligands in the layer is unbound, the contribution to the steric repulsions of the volume occupied by ligand molecules should, in principle, be considered. In addition, the lipid pull-out implies the presence of a complete new species in the system. This species is not grafted to the surface, which reduces the total surface coverage, and it includes the lipid molecule, which will also contribute to the packing interactions. This effect will be considered in future studies.
This work can be used as an important tool in the design of materials for applications in biosensing and drug delivery. Ligand–receptor interactions depend, however, on the type of confinement within which the interactions take place. Therefore, the considerations to be made when, for example, designing a small nanometer-sized stabilized liposome to target a cancer cell are different from those considerations needed when designing a giant targeted polymersome whose dimensions compare to that of the targeted cell. We have previously studied the ligand–receptor binding between small targeted proteins and a surface.32 Here, we present guidelines for designing targeted systems having dimensions of the order of the cell size. Finally, it should be mentioned that understanding the kinetics of ligand–receptor binding in confined environments and in the presence of polymeric spacers is the next natural step for the complete understanding of these complex systems. These effects have been shown to be very important in liposome binding37 and cell adhesion63 as well as to understand surface force experiments.64
Acknowledgment.
We thank Dr. Donsheng Zhang for the GROMACS Molecular Dynamics simulations used to generate the bound polymer conformations and Dr. Nathan W. Moore and Professor Tonya L. Kuhl for generously providing the experimental data to compare our results. This work is supported by the National Science Foundation and the National Institutes of Health, NIH CA112427, and by the National Science Foundation under Grant EE-0503943 (I.S.).
LA8009699
Contributor Information
Gabriel S. Longo, Department of Chemistry, Purdue University, West Lafayette, Indiana 47907-1393.
David H. Thompson, Department of Chemistry, Purdue University, West Lafayette, Indiana 47907-1393
I. Szleifer, Department of Biomedical Engineering, Northwestern University, 2145 Sheridan Road, Evanston, Illinois 60208.
References
- (1).Miranti CK; Brugge JS Nat. Cell Biol 2002, 4, 83–90. [DOI] [PubMed] [Google Scholar]
- (2).Ridley AJ; Schwartz MA; Burridge K; Firtel RA; Ginsberg MH; Borisy G; Parsons JT; Horwitz AR Science 2003, 302, 1704–1709. [DOI] [PubMed] [Google Scholar]
- (3).Camarero JA; Kwon Y; Coleman MA J. Am. Chem. Soc 2004, 126, 14730–14731. [DOI] [PubMed] [Google Scholar]
- (4).Groll J; Amirgoulova EV; Ameringer T; Heyes CD; Röcker C; Nienhaus GU; Möller M J. Am. Chem. Soc 2004, 126, 4234–4239. [DOI] [PubMed] [Google Scholar]
- (5).Groll J; Haubensak W; Ameringer T; Möller M Langmuir 2005, 21, 3076–3083. [DOI] [PubMed] [Google Scholar]
- (6).Arias JL; Gallardo V; Gomez-Lópera SA; Plaza RC; Delgado AV J. Controlled Release 2001, 77, 309–321. [DOI] [PubMed] [Google Scholar]
- (7).Berry CC; Curtis ASG J. Phys. D: Appl. Phys 2003, 36,R198–R206. [Google Scholar]
- (8).Berry CC J. Mater. Chem 2005, 15, 543–547. [Google Scholar]
- (9).Cui Y; Wei Q; Park H; Lieber CM Science 2001, 293, 1289–1292. [DOI] [PubMed] [Google Scholar]
- (10).Kelloff GJ; Coffey DS; Chabner BA; Dicker AP; Guyton KZ; Nisen PD; Soule HR; D’Amico AV Clin. Cancer Res 2004, 10, 3927–3933. [DOI] [PubMed] [Google Scholar]
- (11).Blume G; Cevc C; Crommelin MDJA; Bakker-Woudenberg IAJM; Kluft C; Storm G Biochim. Biophys. Acta 1993, 1149, 180–184. [DOI] [PubMed] [Google Scholar]
- (12).Zalipsky S Bioconjugate Chem. 1993, 4, 296–299. [DOI] [PubMed] [Google Scholar]
- (13).Allen TM; Brandeis E; Hansen CB; Kao GY; Zalipsky S Biochim. Biophys. Acta 1995, 1237, 99–108. [DOI] [PubMed] [Google Scholar]
- (14).Allen TM; Moase EH Adv. Drug Delivery Rev 1996, 21, 117–133. [Google Scholar]
- (15).Maruyama K; Ishida O; Takizawa T; Moribe K Adv. Drug Delivery Rev 1999, 40, 89–102. [DOI] [PubMed] [Google Scholar]
- (16).Gabizon A Clin. Cancer Res 2001, 7, 223–225. [PubMed] [Google Scholar]
- (17).Farokhzad OC; Jon S; Khademhosseini A; Tran T-NT; LaVan DA; Langer R Cancer Res. 2004, 64, 7668–7672. [DOI] [PubMed] [Google Scholar]
- (18).Rui Y; Wang S; Low PS; Thompson DH J. Am. Chem. Soc 1998, 120(44), 11213–11218. [Google Scholar]
- (19).Discher BM; Won Y-Y; Ege DS; Lee JC-M; Bates FS; Discher DE; Hammer DA Science 1999, 284, 1143–1146. [DOI] [PubMed] [Google Scholar]
- (20).Discher DE; Eisenberg A Science 2002, 297, 967–973. [DOI] [PubMed] [Google Scholar]
- (21).Discher DE; Ahmed F Annu. Rev. Biomed. Eng 2006, 8, 323–341. [DOI] [PubMed] [Google Scholar]
- (22).Senior J; Delgado C; Fisher D; Tilcock C; Gregoriadis G Biochim. Biophys. Acta 1991, 1062, 77–82. [DOI] [PubMed] [Google Scholar]
- (23).Litzingera DC; Buitingb AMJ; van Rooijenb N; Huang L Biochim. Biophys. Acta 1994, 1190, 99–107. [DOI] [PubMed] [Google Scholar]
- (24).Meng F; Engbers GHM; Feijen J J. Controlled Release 2005, 101, 187–198. [DOI] [PubMed] [Google Scholar]
- (25).Gombotz WR; Guanghui W; Horbett TA; Hoffman AS J. Biomed. Mater. Res 1991, 25, 1547–1562. [DOI] [PubMed] [Google Scholar]
- (26).Satulovsky J; Carignano M; Szleifer I Proc. Natl. Acad. Sci.U.S.A 2000, 97, 9037–9041. [DOI] [PMC free article] [PubMed] [Google Scholar]
- (27).Kim DH; Klibanov AL; Needham D Langmuir 2000, 16(6), 2808–2817. [Google Scholar]
- (28).Lin JJ; Silas JA; Bermudez H; Milam VT; Bates FS; Hammer DA Langmuir 2004, 20(13), 5493–5500. [DOI] [PubMed] [Google Scholar]
- (29).Uchida K; Otsuka H; Kaneko M; Kataoka K; Nagasaki Y Anal. Chem 2005, 77, 1075–1080. [DOI] [PubMed] [Google Scholar]
- (30).Chen CC; Dormidontova E Langmuir 2005, 21, 5605–5615. [DOI] [PubMed] [Google Scholar]
- (31).Moore NW; Kuhl TL Langmuir 2006, 22, 8485–8491. [DOI] [PubMed] [Google Scholar]
- (32).Longo G; Szleifer I Langmuir 2005, 21, 11342–11351. [DOI] [PubMed] [Google Scholar]
- (33).Kuhlman W; Taniguchi I; Griffith LG; Mayes AM Biomacro-molecules 2007, 8, 3206–3213. [DOI] [PubMed] [Google Scholar]
- (34).Zhang C-Z; Wang Z-G Langmuir 2007, 23, 13024–13039. [DOI] [PubMed] [Google Scholar]
- (35).Dan N; Tirrell M Macromolecules 1993, 26, 6467–6473. [Google Scholar]
- (36).Wong JY; Kuhl TK; Israelachvili JN; Mullah N; Zalipsky S Science 1997, 275, 820–822. [DOI] [PubMed] [Google Scholar]
- (37).Jeppesen C; Wong JY; Kuhl TK; Israelachvili JN; Mullah N; Zalipsky S; Marques C Science 2001, 293, 465–468. [DOI] [PubMed] [Google Scholar]
- (38).Szleifer I; Carignano M Adv. Chem. Phys 1996, 94, 165–260. [Google Scholar]
- (39).Flory PJ Statistical Mechanics of Chain Molecules; Wiley-Interscience: New York, 1969. [Google Scholar]
- (40).Fauré MC; Bassereau P; Carignano MA; Szleifer I; Gallot Y;.; Andelman D Eur. Phys. J. B 1998, 3, 365–375. [Google Scholar]
- (41).McPherson T; Kidane A; Szleifer I; Park K Langmuir 1998, 14, 176–186. [Google Scholar]
- (42).Szleifer I Curr. Opin. Solid State Mech 1997, 2, 337–344. [Google Scholar]
- (43).Szleifer I Biophys. J 1997, 72, 595–612. [DOI] [PMC free article] [PubMed] [Google Scholar]
- (44).Lindahl E; Hess B; van der Spoel DJ Mol. Model 2001, 7, 306–317. [Google Scholar]
- (45).Bedrov D; Ayyagari C; Smith GD J. Chem. Theory Comput 2006, 2, 589–606. [DOI] [PubMed] [Google Scholar]
- (46).Hess B; Bekker H; Berendsen HJC; Fraaije JGEM J. Comput. Chem 1997, 18, 1463–1472. [Google Scholar]
- (47).Allen MP; Tildesley DJ Computer Simulation of Liquids; Oxford Science: Oxford, 1987. [Google Scholar]
- (48).Berendsen HJC; Postma JPM; van Gunsteren WF; DiNola A; Haak JR J. Chem. Phys 1984, 81, 3684–3690. [Google Scholar]
- (49).Israelachvili J Intermolecular and Surface Forces, 2nd ed.; Academic Press: New York, 1991. [Google Scholar]
- (50).Puvanendrampillai D; Mitchell JBO Bioinformatics 2003, 19, 1856–1857. [DOI] [PubMed] [Google Scholar]
- (51).Weber PC; Ohlendorf DH; Wendoloski JJ; Salemme FR Science 1989, 243, 85–88. [DOI] [PubMed] [Google Scholar]
- (52).Livnah O; Bayer EA; Wilchek M; Sussman JL Proc. Natl. Acad. Sci. U.S.A 1993, 90, 5076–5080. [DOI] [PMC free article] [PubMed] [Google Scholar]
- (53).Chilkoti A; Stayton PS J. Am. Chem. Soc 1995, 117, 10622–10628. [Google Scholar]
- (54).Merkel R; Nassoy P; Leung A; Ritchie K; Evans E Nature 1999, 397, 50–53. [DOI] [PubMed] [Google Scholar]
- (55).Yao N; Trakhanov S; Quiocho FA Biochemistry 1994, 33, 4769–4779. [DOI] [PubMed] [Google Scholar]
- (56).Nieba L; Nieba-Axmann SE; Persson A; Hämäläinen M;.;Edebratt F; Hansson A; Lidholm J; Magnusson K; Karlsson ÅF; Plückthun A Anal. Biochem 1997, 252, 217–228. [DOI] [PubMed] [Google Scholar]
- (57).Charles RS; Matthews JH; Zhang E; Tulinsky A J. Med. Chem 1999, 42, 1376–1383. [DOI] [PubMed] [Google Scholar]
- (58).Kuhl TL; Leckband DE; Lasic DD; Israelachvili JN Biophys. J 1994, 66, 1479–1488. [DOI] [PMC free article] [PubMed] [Google Scholar]
- (59).Efremova NV; Bondurat B; O’Brien DF; Leckband DE Biochemistry 2000, 39, 3441–3451. [DOI] [PubMed] [Google Scholar]
- (60).Leckband DE; Schmitt F-J; Israelachvili JN; Knoll W Biochemistry 1994, 33, 4611–4624. [DOI] [PubMed] [Google Scholar]
- (61).Szleifer I Physica A 1997, 244, 370–388. [Google Scholar]
- (62).Leckband D; Müller W; Schmitt F-J; Ringsdorf H Biophys. J 1995, 69, 1162–1169. [DOI] [PMC free article] [PubMed] [Google Scholar]
- (63).Mougin K; Ham AS; Lawrence MB; Fernandez EJ; Hillier AC Langmuir 2005, 21, 4809–4812. [DOI] [PubMed] [Google Scholar]
- (64).Wong JY; Kuhl TL Langmuir 2008, 24, 1225–1231. [DOI] [PubMed] [Google Scholar]


