

Abstract
The nuclear factor (erythroid 2)-like (NRF) transcription factors are a subset of cap'n'collar transcriptional regulators. They consist of three members, NRF1, NRF2, and NRF3, that regulate the expression of genes containing antioxidant-response elements (AREs) in their promoter regions. Although all NRF members regulate ARE-containing genes, each is associated with distinct roles. A comprehensive study of differential and overlapping DNA-binding and transcriptional activities of the NRFs has not yet been conducted. Here, we performed chromatin immunoprecipitation (ChIP)-exo sequencing, an approach that combines ChIP with exonuclease treatment to pinpoint regulatory elements in DNA with high precision, in conjunction with RNA-sequencing to define the transcriptional targets of each NRF member. Our approach, done in three U2OS cell lines, identified 31 genes that were regulated by all three NRF members, 27 that were regulated similarly by all three, and four genes that were differentially regulated by at least one NRF member. We also found genes that were up- or down-regulated by only one NRF member, with 84, 84, and 22 genes that were regulated by NRF1, NRF2, and NRF3, respectively. Analysis of the ARE motifs identified in ChIP peaks revealed that NRF2 prefers binding to AREs flanked by GC-rich regions and that NRF1 prefers AT-rich flanking regions. Thus, sequence preference, likely in combination with upstream signaling events, determines NRF member activation under specific cellular contexts. Our analysis provides a comprehensive description of differential and overlapping gene regulation by the transcriptional regulators NRF1, NRF2, and NRF3.
Keywords: nuclear factor 2 (erythroid-derived 2-like factor) (NFE2L2) (Nrf2), oxidative stress, antioxidant, DNA transcription, gene transcription, ChIP-sequencing (ChIP-seq), transcriptomics, signal transduction, cell signaling, cell culture
Introduction
The nuclear factor (erythroid 2)-like (NRF)5 transcription factors are a subset of basic leucine zipper (bZip) cap'n'collar (CNC) transcription factors sharing close homology. There are three NRF family members: NRF1, NRF2, and NRF3 (1). The discovery of different NRF family members followed an effort to find transcription factors controlling expression of β-globin, a gene required for hemoglobin production and proper oxygen transport in vertebrates. NRF1 was the first discovered NRF family member and was identified in a cDNA library screen for binding to the erythroid-specific NF-E2/AP1 consensus sequence found in the 5′ β-globin locus control region, 5′-GCTGAGTCA-3′ (2). Shortly thereafter, NRF2 was identified in a comparable cDNA library screen (3). Intriguingly, the isolation and characterization of NRF3 arose a few years later following a logical deduction: as the genomic locations of nrf1, nrf2, and the NF-E2 subunit p45 (NF-E2p45) were found near hoxB, hoxD, and hoxC genes, respectively, nrf3 was predicted and shown to map close to the hoxA gene (4). Thus, the CNC families of NF-E2, NRF1, NRF2, and NRF3 were all predicted to have arisen from a common genetic lineage, diverging after chromosomal duplication.
Almost immediately after the discovery of NF-E2, NRF1, and NRF2, investigators began dissecting the differing roles of these three transcription factors. As they had all been discovered as mediators of β-globin expression, initial investigations looked into their roles in erythropoiesis and hematology. NF-E2p45 knockout mice exhibited an absence of platelets and hemorrhaging, but had very little effect on erythroid cell lineages and were able to survive to adulthood (5). In contrast, NRF1 knockout mice displayed severe anemia due to impaired fetal liver erythropoiesis and died in utero (6, 7). Homozygous Nrf2 knockout mice, however, displayed no obvious defects in embryogenesis, fertility, or litter sizes (8). The role of NRF2 became more apparent following challenge with carcinogens, where it was initially shown to protect mice against chemical carcinogenesis. Similarly, Nrf3 knockout mice displayed no overt phenotype (9). Further insight into the role of Nrf3 may become more apparent after appropriate challenges: for example, Nrf3−/− animals were more likely to develop cell lymphoblastic lymphoma following benzo-a-pyrene exposure (10). The NRF transcription factors also differed in their tissue localization; Nrf1 and Nrf2 are expressed relatively ubiquitously, whereas Nrf3 expression is highly localized to placental tissue (2–4).
Although these early studies into the differential underpinnings of the NRF members showed stark contrasts in expression and mediation of downstream responses between family members, mechanistic investigations into their transcriptional modes of action indicated a more conserved process. To control transcription, all CNC members utilize a similar mechanism. Nuclear CNC transcription factors dimerize with the small musculoaponeurotic fibrosarcoma, or sMaf proteins (sMafG, sMafK, and sMafF), to bind to DNA. The resulting sMaf/bZip factor complexes have the capacity to bind to several related target DNA sequences: the palindromic Maf recognition element (5′-TGCTGAC(G)TCAGCA-3′), the NF-E2 recognition element (5′-TGCTGACTCAT-3′), and the antioxidant-response element (ARE, 5′-TGABNNNGC-3′) (1, 11, 12). Historically, genes under ARE control were of particular interest; many of these genes were transcriptionally inducible by electrophilic xenobiotics and consisted predominately of detoxifying enzymes like GSH–S-transferase or NAD(P)H quinone dehydrogenase 1 (NQO1) (13–15). In a paradigm-shifting work, ARE-containing genes were discovered to be under the transcriptomic control of NRF members, particularly NRF2 (16).
Given the distinct, and occasionally conflicting, roles that have been attributed to the NRF family members, we combined ChIP and RNA-Seq analyses to catalog the overlapping and distinct genes regulated by each NRF family member, providing insights into the transcriptional program governing the NRF family members.
Results
System design
The incomplete mechanistic understanding of NRF3 regulation, as well as the absence of a well-established NRF3-specific antibody, complicates systematic evaluation of the transcriptional targets of each NRF family member. To overcome these limitations, we created three derivative U2OS cell lines; each of these cell lines carries a doxycycline-inducible FLAG-tagged NRF family member inserted into the same locus using flp-in technology (Fig. S1). These cell lines allow us to modulate the expression of each NRF family member using doxycycline induction and detection using the highly-specific anti-FLAG–tag antibody (Fig. 1A). To ensure that the induced NRF proteins will translocate to the nucleus to mediate their transcriptional functions, we removed the ER targeting sequences of NRF1 and NRF3, and we replaced the DLG and ETGE motifs of the Neh2 degron on NRF2 with AAA and AAAA, respectively (Fig. 1, B and C). The mutations to Neh2 degron on NRF2 is required to prevent it from interacting with kelch-like ECH–associated protein 1 (KEAP1), which will ubiquitylate and target NRF2 for proteasomal degradation. By establishing this system, we sought to compare gene expression and genomic binding similarities and differences among NRF members in the same cell line with comparable induction systems.
Figure 1.
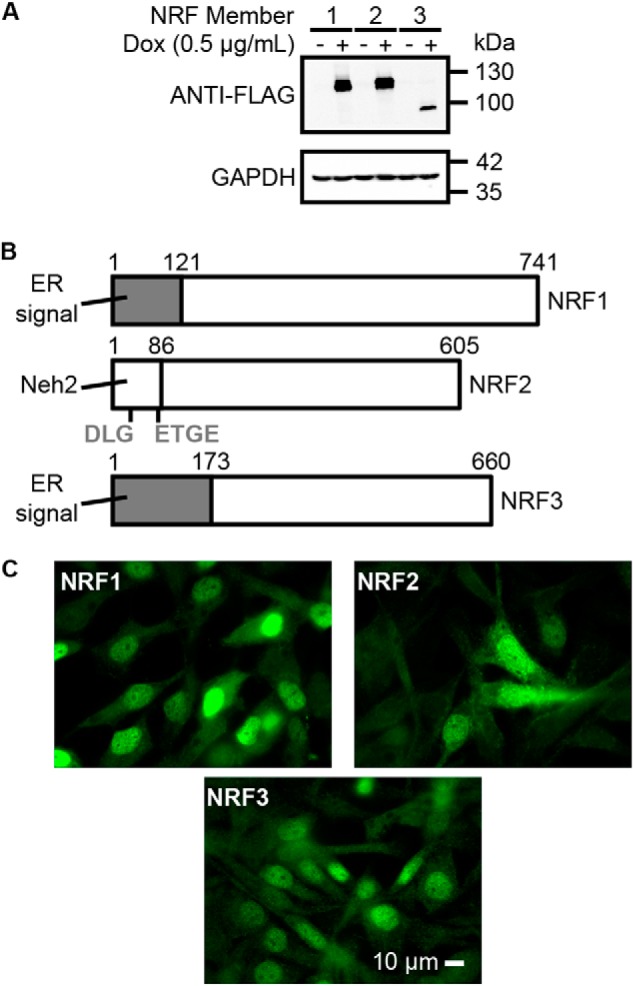
NRF system design and validation. A, immunoblots showing NRF1, NRF2, and NRF3 proteins are inducible by doxycycline in their respective cell lines. Each NRF member was fused with a FLAG peptide sequence. GAPDH was used as a loading control. B, amino acids 1–121 and 1–173 were removed from the open reading frames of NRF1 and NRF3, respectively, to eliminate their ER targeting sequences. Similarly, the DLG and ETGE degron motifs within the Neh2 domain of NRF2 were mutated to AAA and AAAA, respectively, to allow for NRF2 accumulation in the ChIP-exo experiments. The DLG and ETGE degrons must be removed to prevent KEAP1-mediated ubiquitylation of NRF2. C, following doxycycline induction (0.5 μg/ml), NRF members translocate to the nucleus. The scale bar represents a length of 10 μm.
ChIP-exo
Using the constructed cell line, we performed ChIP-exo sequencing using anti-FLAG antibody-conjugated magnetic beads. Although the ChIP studies have been conducted with great success on individual NRF members (17), no studies have compared binding sites among all NRF members in the same system. All genomic loci found from the ChIP-exo analysis can be found in Table S1. The sequencing results showed good enrichment for binding sites containing antioxidant-response elements for all three NRF members (Fig. 2A); 73, 46, and 66% of NRF1, NRF2, and NRF3 peaks contained one or more AREs, respectively. The ChIP peaks also showed good resolution for AREs, with 96, 83, and 96% of canonical AREs appearing within 200 bp of the peak summits (Fig. 2B). All three NRF members showed binding across all chromosomes (Fig. 2C). In terms of genomic annotations, NRF1 and NRF3 peaks showed relatively similar distributions, with peaks mainly residing in distal intergenic regions (Fig. 2D), whereas NRF2 showed relatively fewer distal intergenic binding sites, and a relative increase in binding sites residing within the promoter and the first exon of genes. All annotated peaks are provided in Table S2. As expected from ChIP of transcription factors, binding sites from the promoter region congregate near the transcription start site (TSS) of genes (Fig. 2E).
Figure 2.
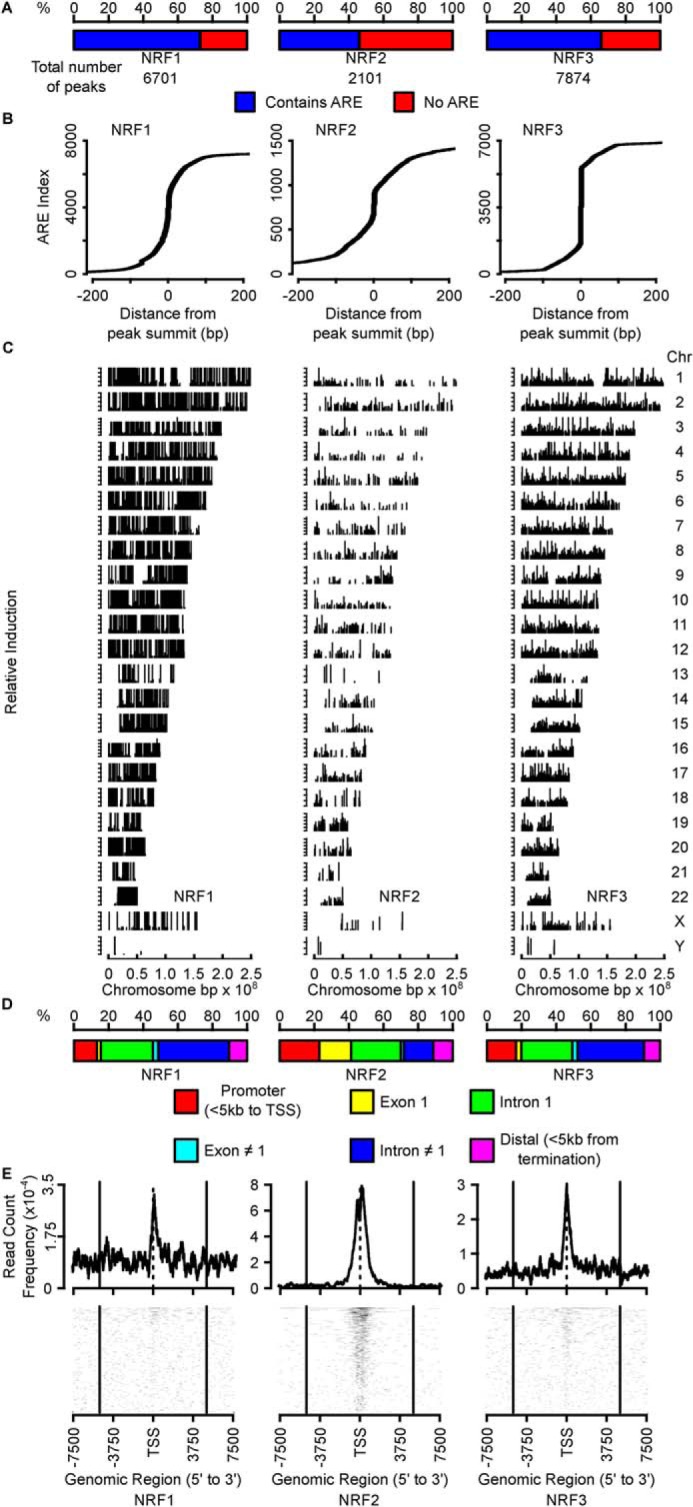
ChIP-exo sequencing. A, percentage of binding sites of each NRF member that contained a canonical TGABNNNGC ARE sequence. Total number of binding sites are found below the bar chart. B, indices of AREs relative to the summit of a peak. Most AREs fell near the summits (defined as 0 bp), illustrated as the ARE index increases precipitously around 0 bp. C, distribution of NRF-binding sites across chromosomes. Relative induction levels are indicated by vertical line height and are quantified as the normalized fold induction from NRF overexpression relative to control. D, distribution of positions of NRF-binding sites by genomic annotation. E, frequencies of NRF-binding sites near the transcription start site (TSS). Vertical lines indicate 5 kb upstream and downstream of TSS.
To determine whether NRF1, NRF2, or NRF3 showed any binding preferences to specific ARE sequences or flanking region sequences, we grouped ChIP-exo binding sites by their specificity to each NRF member or overlaps among different NRF members, searched the peaks for AREs, and identified potential consensus sequences for a 50-bp region flanking the ARE at both the 5′ and the 3′ ends. We then compared whether the sequences were different between groups and identified sequences specific to each NRF member and to those shared by two or more NRF members (Fig. 3, A and B). NRF1 and NRF2 specific binding sites have ARE sequences that differ from each other. ARE sequences from binding sites shared by all three NRF members significantly differed from ARE sequences from binding sites specific to NRF1, NRF2, and NRF3 and ARE sequences from binding sites shared by NRF1 and NRF3. We identified similar trends for sequences flanking both the 5′ and the 3′ regions.
Figure 3.

Comparison of GC to AT ratios between NRF-binding-site groups for all ChIP-exo AREs. A, binding sites that were unique to a single NRF family member, or those that overlapped between multiple NRF members, are identified by ChIP-exo sequencing. Note that the sum of binding sites for each member does not always equal the number of binding sites in Fig. 2A due to peak resolution. B, proportions of GC to AT base pairs in 50-bp regions flanking the AREs were compared among NRF member binding-site groups identified from ChIP-exo sequencing. Red-colored scaled squares indicate one group being significantly different from the other as determined by the χ2 test, with a darker color indicating a smaller p value. NRF members of each binding-site group are indicated with solid green squares to the right or below the p value grid.
We compared the GC to AT ratio at each position in the sequences flanking the ARE from binding sites specific to each NRF members or shared among them (Fig. 4). Sites bound by all three NRF members were particularly enriched for AT at the position immediately preceding the ARE. We found that 28 positions were enriched for GC in binding sites specifically bound by NRF2, whereas seven positions were enriched for AT in NRF1-specific binding sites. None of the other groups showed consensus sequence enrichment for GC or AT at any particular sequence position.
Figure 4.

Position–by–position comparison of GC to AT ratios among 50-bp sequences flanking ARE of NRF-binding groups. Proportions of GC to AT base pairs in regions flanking the AREs were compared among NRF binding–site groups within each position. Blacked out rows indicate the group being compared against the others. NRF members of each binding-site group are indicated with solid green squares to the right of the consensus sequences. Red-colored scaled squares indicate one group being significantly different from the other as determined by the χ2 test, with a darker color indicating a smaller p value. Bars below a particular position indicate the group was specifically enriched for GC (blue) or AT (red) base pairs at that position when compared with the other groups.
RNA sequencing
We next assessed differences and similarities in genes differentially regulated by NRF1, NRF2, and NRF3 in the RNASeq data. To overexpress each NRF member, we exposed the U2OSTetR–NRFX to doxycycline for 16 h. U2OSTetR–NRF2 cells were also treated with sulforaphane to facilitate NRF2 translocation (18–21). All differentially expressed genes can be found in Table S3. Overexpression of all NRF members yielded increased transcript levels of more than a thousand genes, with NRF1 up-regulating 3155 genes; NRF2 up-regulating 2619, and NRF3 up-regulating 1212 (Fig. 5A). Next, we looked at genes that were regulated by more than one member. All three NRF members commonly up-regulated 557 genes. Additionally, NRF1 and NRF2 commonly up-regulated 849 genes; NRF1 and NRF3 commonly up-regulated 277 genes, and NRF2 and NRF3 commonly up-regulated 149 genes.
Figure 5.

Identification of high-confidence genes regulated by NRF members. A, number of intersecting or unique genes whose expression was up-regulated or down-regulated following overexpression of NRF1, NRF2, or NRF3. Data were determined by RNA-Seq. B, number of intersecting or unique genes harboring an LRE following overexpression of NRF1, NRF2, or NRF3. Data were determined by ChIP-exo sequencing. Note the number of genes harboring an LRE with an overlap between NRF1 and NRF2 is higher than that found in Fig. 3A due to some LREs annotating to multiple genes. C, number of high-confidence genes that concurrently had an LRE and showed altered transcription following overexpression of NRF1, NRF2, or NRF3. Different high-confidence groups are annotated according to whether the different members up-regulated (red) or down-regulated (blue) transcription, as determined by RNA-Seq. The percentage of high-confidence genes that harbored a canonical ARE sequence, 5′-TGABNNNGC-3′ is presented in black (proportion with ARE) and white (proportion without ARE). D–K, ChIP-exo coverage profiles of binding sites for selected high-confidence genes, showing how genes not regulated by a certain NRF member did not have a nearby LRE. Scale bars represent 1 kb. Rectangles and arrowed lines below coverage profiles indicate gene transcripts. Red lines indicate locations of canonical AREs.
Looking at the down-regulated portion of differentially expressed genes, NRF1 down-regulated 2515 genes; NRF2 down-regulated 2066 genes, and NRF3 down-regulated 1364 genes. NRF1–NRF2 pair shared more down-regulated genes than the NRF1–NRF3 pair or the NRF2–NRF3 pair (849 genes, 277 genes, and 149 genes, respectively) (Fig. 5A).
In summary, NRF1 and NRF2 have the most genes in common relative to all NRF family members. This includes both up-regulated and down-regulated genes. Additionally, NRF1 and NRF2 alter transcript levels of more genes than NRF3. These results highlight the similarities of NRF1 and NRF2 and the uniqueness of NRF3 in downstream regulation of ARE-containing genes.
Combining RNAseq and ChIP-exo data
We then analyzed the ChIP-exo data to compare genes regulated by NRF members. We limited genes to those with binding sites falling within 5 kb upstream of the TSS, the first intron, or the first exon. These binding sites were categorized as likely regulatory elements (LREs), which may or may not contain an ARE. NRF1, NRF2, and NRF3 each showed more than 1000 genes harboring LREs (Fig. 5B). 167 genes were shared between all three NRF members. Beyond the 167 genes shared by all NRF family members, NRF3 shared 84 genes with NRF2 and 580 genes with NRF1. NRF1 and NRF2 shared 67 LREs.
We were interested in genes that showed differential expression from the RNA-Seq data and had an LRE; we called these genes “high-confidence genes.” Based on these criteria, we identified 262 high-confidence genes. We stratified these genes into 17 groups based on how each NRF member affected their transcript levels (Fig. 5C and summarized in Table 1). Several high-confidence genes were regulated by only one NRF member. For example, ADGRG7 was uniquely up-regulated by NRF1, and NRF1 is the only NRF member showing an LRE in the promoter region of ADGRG7 (Fig. 5D). A similar pattern was observed for PHF20L1 with NRF2 (Fig. 5E). Additionally, TACC1 was down-regulated by NRF2 and contained an NRF2 LRE, whereas MRPL52 is down-regulated by NRF3 and contained an NRF3 LRE (Fig. 5, F and G). 84 high-confidence genes were solely regulated by NRF1 (67 up-regulated and 17 down-regulated). Similarly, NRF2 itself regulates 84 high-confidence genes (55 up-regulated and 29 down-regulated), and NRF3 independently regulates 22 high-confidence genes (3 up-regulated and, 19 down-regulated).
Table 1.
Genes with up-regulated (+), down-regulated (−), or unaffected (0) transcription for each NRF member
All genes in this table have an LRE.
| NRF1 | NRF2 | NRF3 | Genes |
|---|---|---|---|
| + | 0 | 0 | ADGRG7; C20orf203; HMGCS1; IL15RA; CLEC19A; CHD1L; CENPT; STMN2; LINC01387; BFSP1; SEC24C; HTR2B; ABHD17B; UTP3; ZNF407; NSF; HOMER2; TAOK3; PSMB7; SAMD5; ATP6V1B1-AS1; SGMS1; EYS; CALCR; INPP4A; PAK1; DAAM2; NANP; FRMD3; MARK1; MAPRE2; PLA2G12A; FKBP15; C18orf25; CRK; PPP3CA; CDKL1; SNAPC5; COL21A1; COBL; ANXA10; TMEM132D; NEK1; AKAP2; IMPDH1; MSRB1; HIP1; MBOAT4; PTPRM; LOC101930010; PTPRN; MRO; TMEM30A; TSPAN9; BTBD11; EEA1; PMF1-BGLAP; KIAA0513; ACSL5; TMEM164; SORD; ABCD1; HGS; CEP128; MAP4; CREB5; OSBP2 |
| 0 | + | 0 | GPBP1L1; SYT14; HACD1; DPP8; ZWILCH; SIAH1; TLK2; SPIRE1; DNMT3A; MSH6; PTPRG; ANAPC13; LNPEP; WHSC1L1; MTERF3; ERP44; DDX31; AKIRIN1; LOC100130992; SMIM10L1; GXYLT1; ERO1A; FEM1B; LOC104968399; DUSP2; PAXBP1; UBE2E2; SLC30A5; ZNF12; BAZ1B; SYPL1; ARMC1; WDYHV1; PHF20L1; UHRF2; NOL8; ATP6V1G1; TOR1B; GNG12; NT5C2; CNIH1; GABARAPL2; VAPA; MOB1A; KRCC1; INO80D; PYURF; PIGY; CENPK; TCERG1; GRPEL2; MAT2B; RBAK; RNF216; KAT6A |
| + | + | 0 | PTP4A1; PDCD6IP; VPS54 |
| 0 | 0 | + | ARFIP1; ANK2; HIRA |
| + | 0 | + | G3BP1; LAMC1; PPIP5K2; SRPK1; DYNC1H1; PHTF1; PES1; PDK1; ENO1; PURB; LPIN1; PSMD4; INADL; EXOC2; VMP1; CALB2; BLVRB |
| + | + | + | PRDX1; HTATIP2; DLGAP1-AS2; HMOX1; LUCAT1; SQSTM1; GCLC; FTL; MAFG; LINC00657; TRIO; VCP; BMP6; LPIN2; TBK1; TXNRD1; BAG2; SOD1 |
| − | 0 | 0 | SNORD12C; SNORD12B; NUDT1; ACBD4; TLE6; SOCS5; NUP85; COMMD8; KLHL5; RAI14; IQSEC1; MAL2; SRGAP2B; THSD4; NUTF2; TSNARE1; PCMTD1 |
| − | + | 0 | PPP1R9A |
| 0 | − | 0 | ATAD3A; MST1P2; AMPD2; GPR137; SNORD18A; SLX1A-SULT1A3; SLX1B-SULT1A4; VPS9D1; MRPL27; KCNH7; HYAL3; PSMG3; IQCE; FBXO16; PUF60; C9orf69; MAN1B1; LDLRAP1; RHOBTB1; CHST3; ATG2A; CELSR3; UBE2H; TACC1; TYMSOS; DOK1; ARID5A; ARFGAP1; ERGIC1 |
| + | − | 0 | RAB31 |
| + | − | + | DST |
| − | − | 0 | TCIRG1; NACC2; CPSF3L; FUT8 |
| 0 | 0 | − | LDHA; MRPL52; RNU6–2; RNU6–9; RNU6–7; RNU6–1; RNU6–8; SYNRG; GTF2IRD1; EMC4; SNX1; SCARB1; HNRNPAB; MTRNR2L8; PTRH2; CUX1; CCDC85C; PI4KAP2; GALNT14 |
| + | 0 | − | NRD1; ABCF3; ALDOA; SLC2A1; PLEC; EIF4G1; GNA12; NSFL1C; KIAA1217; SEPT9 |
| + | + | − | BRD2; TXN; TNFRSF1A |
| − | 0 | − | SH3RF3; ACTN1; FGF1; PRKACB; CDS2 |
| − | − | − | LAMA5; RNU1-1; RNU1-2; RNU1-27P; RNU1-4; RNVU1-18; RNU1-28P; RNU1-3; CCNJL |
Eighteen high-confidence genes (PRDX1, HTATIP2, DLGAP1-AS2, HMOX1, LUCAT1, SQSTM1, GCLC, FTL, MAFG, LINC00657, TRIO, VCP, BMP6, LPIN2, TBK1, TXNRD1, BAG2, and SOD1) were up-regulated by all three NRF members (Table 1); these included several bona fide NRF target genes containing AREs, such as PRDX1, HMOX1, TXNRD1, FTL, and GCLC. For example, GCLC had an LRE in its promoter and was up-regulated by all three NRF members (Fig. 5H).
To determine which of the genes were regulated by canonical NRF signaling, we evaluated the ChIP peaks in the high-confidence genes for the presence of a core ARE consensus sequence, 5′-TGABNNNGC-3′. Indeed, 100% of the 18 high-confidence genes up-regulated by NRF1, NRF2, and NRF3 all contained AREs. This is in contrast to the nine genes down-regulated by NRF1, NRF2, and NRF3, of which only three (33%) had an ARE. When we looked at all 262 high-confidence genes, 62% of them contained an ARE (Fig. 5C).
Some genes showed different up- or down-regulation patterns dependent on which NRF member binds to its LRE (Fig. 5C). For example, TNFRSF1A was up-regulated by NRF1 and NRF2, but down-regulated by NRF3 (Fig. 5I). Similarly, DST was found to be up-regulated by NRF1 and NRF3 but down-regulated by NRF2 (Fig. 5J). Some genes were regulated by just two members. For example, GNA12 expression was found to be up-regulated by NRF1, unaffected by NRF2, and down-regulated by NRF3; as expected, only NRF1 and NRF3 have an LRE (Fig. 5K).
These different groupings and regulation patterns demonstrate the heterogeneity by which NRF members affect gene expression. Some genes were regulated by just one member, whereas others were regulated by two or more members. Moreover, NRF members binding to the same LRE of a gene sometimes altered gene expression in different directions. All genes and their respective groupings can be found in Table 1.
ADGRG7 and PHF20L1 are transcriptional targets of NRF1 and NRF2, respectively
Following the identification of different groupings described in the previous section (Table 1), we decided to focus on the NRF1-specific ADGRG7 and the NRF2-specific PHF20L1. To test whether the NRF member specificity of these two genes is generalizable across different cell lines, we performed validation studies in four different cell lines: H1299 (a nonsmall cell lung cancer cell line); HK2 (an immortalized human renal cortex/proximal tubule cell line); BEAS-2B (an immortalized human bronchial epithelia cell line); and MDA-MB-231 (a breast cancer cell line). These cell lines are not known to have NRF1, NRF2, or NRF3 activation. We pharmacologically induced NRF1 using tunicamycin (22) and induced NRF2 using sulforaphane (23). Accordingly, tunicamycin only increased NRF1 protein levels, and sulforaphane only increased NRF2 protein levels across the four tested cell lines (Fig. 6A). We then evaluated transcript levels of ADGRG7 and PHF20L1 using RT-qPCR and found that ADGRG7 mRNA level was induced (∼1.5–3.0-fold) by tunicamycin in all four cell lines (Fig. 6B). Sulforaphane did not induce ADGRG7 in MDA-MB-231, BEAS-2B, or H1299 cell lines and only induced ADGRG7 ∼1.2-fold in the HK2 cell line (Fig. 6C). Tunicamycin did not induce PHF20L1 mRNA in any cell lines (Fig. 6B), whereas sulforaphane induced PHFC20L1 mRNA in MDA-MB-231, BEAS-2B, and H1299 cell lines (Fig. 6C). To ensure canonical transcription targets of NRF1 and NRF2 were up-regulated with both treatments, we measured transcript levels of FTL, GCLM, and NQO1 in the four cell lines and confirmed that all three genes were induced (Fig. S2).
Figure 6.

Validation of ADGRG7 and PHF20L1 as specific targets of members. A, immunoblot showing NRF1 protein is induced by treatment with 5 μg/ml tunicamycin (T), and the NRF2 protein is induced by treatment with 5 μm sulforaphane (S) relative to vehicle (V) after 4 h in four H1299, HK2, BEAS-2B, and MDA-MB-231 cell lines. Note the lowered approximate molecular weight of NRF1 following its activation is consistent with previous reports (22). B and C, RT-qPCR of mRNA levels of ADGRG7 (B) and PHF20L1 (C) following a 16-h treatment with either vehicle, 5 μg/ml tunicamycin, or 5 μm sulforaphane. *, p ≤ 0.05, and N, not significant (p > 0.05) for treatment differences, as determined by ANOVA with post hoc Tukey's highly-significant difference test.
Species conservation
To evaluate whether the identified different grouping of genes are conserved across members of the subphyla vertebrata, we evaluated the distribution of phastCons scores for ChIP peaks specific to NRF1–up-regulated, NRF2–up-regulated, NRF3–up-regulated, and NRF1/NRF2/NRF3–up-regulated groups. PhastCons score estimates the likelihood that a specific nucleotide position belongs to a conserved element, and the scoring system range is from 0 to 1, with 1 representing the highest probability that the nucleotide position belongs to a conserved element. We found that ChIP-peaks from NRF2- and NRF1/NRF2/NRF3–up-regulated groups are likely to contain a conserved element, with up to 70% of the peaks containing regions with a phastCons score of 1. ChIP-peaks from the NRF1–up-regulated group are moderately likely to contain a conserved element, with around 30% of the ChIP-peaks with a phastCons score of 1, whereas ChIP peaks from the NRF3–up-regulated group are least likely to contain a conserved element (Fig. S3). However, because ChIP-peaks from NRF1- and NRF2–up-regulated groups are likely to contain a conserved element, we wanted to know whether AREs in ADGRG7 and PHF20L1 contributed to the observed high phastCons score. By looking at position-wise phastCons scores for ADGRG7 and PHF20L1 ChIP-peaks, we found that the AREs for the two genes are not well-conserved (Fig. S3). This indicates that those elements are likely to be more specific to higher primates.
Flanking sequence identification
We evaluated sequences flanking the canonical AREs of high-confidence genes to see whether any transcriptional program is determining NRF member binding. We extracted all ARE sequences found within the LREs (Table S4). We next developed consensus sequences covering the AREs and 50 bp flanking the canonical sequence (Fig. 7A). A handful of trends emerged. NRF2-specific binding sites had 21 positions that were preferentially enriched for GC base pairs. NRF1-specific binding sites had seven positions that were preferentially enriched for AT base pairs. NRF3-specific binding sites had two positions that were preferentially enriched for AT base pairs.
Figure 7.

Position–by–position comparison of GC to AT ratios among 50-bp sequences flanking the ARE of NRF high-confidence gene groups. A, proportions of GC to AT base pairs in regions flanking the AREs were compared among NRF high-confidence gene groups within each position. NRF members of each high-confidence gene group are indicated with solid green squares to the right of the consensus sequences. Blacked out rows indicate the group being compared against the others. Red-colored scaled squares indicate one group being significantly different from the other as determined by the χ2 test, with the darker color indicating a smaller p value. Bars below a particular position indicate the group was specifically enriched for GC (blue) or AT (red) base pairs at that position when compared with the other groups. B, consensus ARE sequences from A for NRF1 and NRF2 were placed in front of a luciferase ORF to generate NRF1–AREflank and NRF2–AREflank plasmids. The constructs were transfected into U2OSTetR–NRF1 and U2OSTetR–NRF2 cell lines treated with doxycycline, and luciferase activity was assessed. Bars represent mean luciferase readings from triplicate samples. Error bars represent ± S.D. Asterisks represent statistically significant differences between the two samples, as determined by two-tailed Student's t test. C, relative luciferase units (RLU) of U2OSTetR–NRF1 or U2OSTetR–NRF2 transfected with the pGL4.21 vector with No Promoter (empty pGL4.21), the ADGRG7 promoter region, or the PHF20L1 promoter region as described under “Experimental procedures.” Cells were treated with and without doxycycline. *, p ≤ 0.05, and NS, not significant (p > 0.05) for treatment differences, as determined by ANOVA with post hoc Tukey's highly-significant difference test.
Because the high-confidence genes solely regulated by NRF2 showed a preponderance of GC base pairs in the flanking regions, and high-confidence genes solely regulated by NRF1 showed a preponderance of AT base pairs in the flanking regions, we sought to determine whether the transcription factors showed any bias toward these sequences. We generated luciferase constructs that placed a firefly luciferase ORF under the control of the dominating consensus sequences for both the NRF1-specific and NRF2-specific binding sites. After transfecting these constructs into the U2OSTetR–NRF1 and U2OSTetR–NRF2 cells and activating the different NRFX members with doxycycline, we compared relative luciferase activities (Fig. 7B). We found that the NRF1–AREflank showed higher luciferase activity in U2OSTetR–NRF1, whereas the NRF2–AREflank showed higher luciferase activity in the U2OSTetR–NRF2 cells. This indicates that NRF1 showed a slight preference for AREs flanked by AT-rich sequences, whereas NRF2 showed a slight preference for AREs flanked by GC-rich sequences.
We expanded on the synthetic promoter sequence results by evaluating whether the promoter regions of the NRF1-specific gene, ADGRG7, and the NRF2-specific gene, PHF20L1, were sufficient to elicit NRF member specificity. We placed the promoter regions of ADGRG7 or PHF20L1 found immediately upstream of the TSS in front of a firefly luciferase vector. The 50-bp regions flanking the 5′ and 3′ ends of the AREs contained 48.27% GC (ADGRG7) and 81.08% GC (PHF20L1). After transfecting these constructs into the U2OSTetR–NRF1 and U2OSTetR–NRF2 cells and activating the different NRFX members with doxycycline, we compared relative luciferase activities as before (Fig. 7C). We found that the ADGRG7 promoter vector only showed high firefly luciferase activity in U2OSTetR–NRF1 cells treated with doxycycline, whereas the PHF20L1 promoter vector only showed high firefly luciferase activity in U2OSTetR–NRF2 cells treated with doxycycline. These results are consistent with the hypothesis that genes under the control of the ADGRG7 and PHF20L1 promoter regions are preferentially activated by NRF1 and NRF2, respectively.
Functional annotation
We sought to determine which biological processes each of these gene sets may be controlling by performing a gene ontology (GO) analysis on each gene set and identifying all statistically significantly enriched terms containing two or more genes. A full list of statistically-significant enriched terms, including those with just one gene, are included in Table S5. The high-confidence genes up-regulated by all three NRF members had the most enriched terms. As expected, terms around redox processes, iron homeostasis, and oxidative stress were enriched. Other key terms centered around apoptosis regulation, autophagy, angiogenesis, response to stressors (heat, mechanical stimuli, and cadmium), and proteostasis (“chaperone binding” and ubiquitination) (Fig. 8). This was in contrast to high-confidence genes up-regulated by NRF1 and NRF2 but down-regulated by NRF3; only “protein binding” and “viral processes” were enriched.
Figure 8.

GO for different groups of high-confidence genes. The numbers of genes represented from each high-confidence gene group that comprise significantly-enriched GO terms are shown. Only enriched GO terms with more than one gene represented were plotted. The colors of the bars indicate the p value of statistical enrichment (p ≤ 0.05). See Table S5 for details on which genes comprised the terms.
The high-confidence genes composed of two NRF members showed different themes. Those up-regulated by NRF1 and NRF3 were enriched for RNA binding, proliferation, and thermogenesis, whereas those up-regulated by NRF1, but down-regulated by NRF3, showed enrichment for terms focused on cellular structure like “actin cytoskeleton,” “membrane,” or “intermediate filament cytoskeleton.”
High-confidence genes up-regulated by NRF2 alone were enriched for terms involved in proteostasis and protein trafficking. Indeed, several GO terms associated with protein folding were specifically associated with NRF2. These include “protein folding in endoplasmic reticulum,” “chaperone cofactor-dependent protein refolding,” and “protein-disulfide isomerase activity.” NRF2-regulated genes involved in these processes include ERO1A, TOR1B, ERP44, and VAPA. GO processes involving protein trafficking included the “GPI–GnT complex” and the “GPI anchor biosynthetic process” with genes, including PIGY and PYURF. These processes involve protein glypiation, which is a critical post-translational modification for anchoring proteins to the cell membrane.
The GO enrichment analysis indicates the NRF members are involved in a wide variety of biological processes; some of these processes may be regulated by multiple NRF members, whereas others are more specific to certain members.
We also looked at GO for all high-confidence genes regulated by each NRF member, independent of positive or negative regulation (Fig. 9 and Table S6). For the high-confidence genes regulated by NRF1, several terms around splicing (“U1 snRNP” and “mRNA 5′-splice site recognition”) were enriched, as were terms around cellular structure such as “actin filament network formation” and “laminin-10 complex.” NRF2-specific ontologies include “macroautophagy” and “protein-disulfide oxidoreductase activity.” NRF3-specific ontologies include processes involved in metabolism (“l-ascorbic acid metabolic process” and “fatty acid catabolic process”), structure (“cadherin binding” and “cellular response to mechanical stimulus”), and protein sorting (“extracellular exosome” and “protein localization to organelle”).
Figure 9.

GO for all high-confidence genes regulated by NRF1, NRF2, or NRF3. Significantly-enriched GO terms for high-confidence genes altered by NRF1, NRF2, or NRF3 member groups. Only enriched GO terms with more than one gene represented were included. Venn diagram indicates number of unique or intersecting terms between each NRF member. See Table S6 for details on which genes comprised the terms.
Some terms overlapped between the various NRF member groups (Fig. 9). No terms were commonly enriched between all three NRF members; however, NRF2 and NRF3 shared “cell redox homeostasis,” and NRF1 was enriched for “regulation of cellular response to oxidative stress,” which are closely related terms. This is not unexpected, as one of the primary functions attributed to NRF members is the antioxidant response. NRF2 and NRF3 shared the terms “erythrocyte homeostasis” and “iron ion homeostasis.” Additionally, NRF1 and NRF3 shared “heme catabolic process.” This is unsurprising considering the history of NRF members and globin regulation. Consistent with their individual processes, NRF1 and NRF3 shared other terms around structure, such as “membrane” or “hemidesmosome.” Only one term was shared by NRF1 and NRF2: “neurofilament cytoskeletal organization.”
Discussion
Here, we present a comprehensive comparison of NRF1, NRF2, and NRF3 transcriptional targets by comparing differentially-regulated genes determined from RNA-Seq with genes harboring nearby NRF-binding sites as determined by ChIP-exo sequencing. Although several genes were up-regulated or down-regulated by all three members, each member also individually regulated its own subset of genes. Indeed, 235 of the 262 high-confidence genes were regulated differently by the NRF members. Based on this, it is likely that the observed transcriptional differences were determined by disparities in DNA-binding sequence preference, upstream-signaling pathways, and specific cellular contexts (i.e. biochemical/xenobiotic/nutritional status, cofactor availability, competitive transcriptional programs, etc.). These features dictate which NRF family member becomes activated, where it binds in the genome, and what binding partners are available for determining gene induction or repression.
Supporting this, the known regulatory networks governing the different NRF family members appear to vary significantly. This is due in part to the dominant role that the discovery of NRF2 mediation of the antioxidant response had on the field, as investigations on NRF members subsequently diverged into disparate studies that generally focused on individual members. Furthermore, localization of each NRF member also plays a key role in dictating to which context each member is activated. For example, Nrf1 resides in an inactive, glycosylated state in the endoplasmic reticulum (22, 24, 25); once activated, Nrf1 translocates to the cytosol where it is deglycosylated and processed into several active isoforms, each of which harbors differential capacity to regulate transcription (26). Thus, glucose homeostasis, proteostasis, and other cellular conditions control Nrf1 activity (27). To control protein levels, Nrf1 is constantly degraded by the ubiquitin–proteasome system by several ubiquitin ligase systems, including HRD1 and β-TrCP complexes (28, 29). Moreover, NRF1 is a well-described regulator of proteasomal function (30, 31).
The main negative regulator of NRF2 is KEAP1, which resides in the cytosol. KEAP1 is part of an E3 ubiquitylation complex that constantly ubiquitylates NRF2, marking it for proteasomal degradation (32). KEAP1 binds to the Neh2 domain of NRF2 and mediates NRF2 ubiquitylation. Following adduction of reactive cysteines on KEAP1 by electrophiles, the complex no longer effectively ubiquitylates NRF2, and newly-synthesized NRF2 can accumulate, translocate to the nucleus, and facilitate or repress transcription (33). This mechanism makes NRF2 the primary responder to chemical stressors. Intriguingly, KEAP1 stabilizes NRF1 when it binds to its Neh2 domain, contrasting the regulation of NRF2 from NRF1 (34). As more mechanistic insights into NRF2 regulation comes to light, the importance of NRF2 in maintaining cellular homeostasis, even in the absence of chemical stressors, continues to expand. For example, other ubiquitylation pathways, including HRD1- and β-TrCP–dependent mechanisms, also control the NRF2 protein level under specific physiological conditions (35, 36). Additionally, we recently discovered that NRF2 is negatively regulated by many autophagy-related genes, implicating cellular proteostasis and metabolism also play important roles in NRF2 regulation (37).
Less is definitively known about NRF3 regulation; however, studies have shown that NRF3 is controlled in part by a PEST degron sequence and that NRF3 has three isoforms with varying subcellular localizations, including isoform “A” in the ER, isoform “B” in the cytosol, and isoform “C” in the nucleus (38). Similar to NRF1, NRF3 is targeted to and eventually cleaved from the ER (40). NRF3 degradation is also proteasome-dependent (40). Hence, the different mechanisms controlling the signaling and processing of NRF transcription factors, despite their structural homology, highlight the functional differences among them. Reviews are available describing the different signaling nuances of the NRF members (27, 41–43).
Accordingly, a better understanding of the functional differences between NRF members can further our understanding of the different roles each plays in physiology and pathology. We identified that some processes, like antioxidant response, are under the control of all three members. Other processes, like maintenance of cellular structure, may be limited to just a subset, like NRF1 and NRF3. Still, other processes may be completely under the jurisdiction of just one member. For the less well-studied NRF members, NRF1 and NRF3, this study provides unique target genes and their associated biological processes that could form the groundwork for further elucidation of their biological functions.
Functionally, NRF1 has been shown to be involved in various metabolic processes, including insulin resistance, diabetes, and inflammation (44–47). This is, in part, due to Nrf1-validated control of enzymes involved in glycolysis, gluconeogenesis, and lipid metabolism (43, 48); some of these regulated genes appear to be NRF1-specific and not shared by other NRF members like NRF2. NRF1 also regulates genes involved in cell differentiation, proteostasis, cell survival, and mitosis (43); however, NRF2 shares several of these functions, such as energy metabolism and cell differentiation (49–56), while still controlling several unique genes in its own right. Metabolically, a recent work (57) has shown that loss of NRF2 in a rodent model can result in a lean phenotype. Beyond the aforementioned processes, a main function of NRF2 has been its role in antioxidation and detoxification, and while NRF1 and NRF3 have been shown to regulate several detoxification genes (58, 59), NRF2 has been designated the master regulator of the antioxidant response, due in part to the KEAP1 electrophile sensory mechanism and several studies indicating NRF2 induction of this subset of genes to be the most robust. Specific roles of NRF3 have remained the most enigmatic; although several target genes have been identified, little clear evidence has determined the in vivo relevance of those genes (42). Indeed, a consistent lack of information exists on NRF3, particularly its physiological roles, again highlighting the need for more studies clarifying the role of the lesser-studied NRF family members.
To uncover potential unique roles of the different NRF members, we first conducted RNA-Seq to establish which genes each member regulates. This was then combined with ChIP-exo sequencing to identify LREs near those genes that were either similarly or differentially regulated. Many of the genes that were differentially regulated at the transcription level by an NRF member did not harbor an LRE. Similarly, many of the genes with ChIP-exo peaks were not annotated to a differentially-regulated gene. One possible explanation for these discrepancies could be distant enhancer regions. Enhancers have been shown to interact with promoters over 150–200 kb or even span several megabases. Enhancers can even effect transcription across chromosomes due to the inherent flexibility in chromatin (60, 61). To further complicate the situation, genes regulated by certain enhancers can vary from tissue to tissue and cell to cell depending on the chromatin state. Furthermore, we also recently reported that NRF2 can repress gene expression by interacting with replication protein A1 (RPA1) to bind 5′-TGABNNNGCAAACTTCA-3′ consensus sequence (62). Although several NRF2–RPA1 target genes were indeed down-regulated in the RNA-Seq data, no ChIP peaks were identified for those target genes possibly due to the lack of statistical power in the genome-wide approach or to cell type–specific effects. Regardless of these constraints, this remains the first study to systematically investigate NRF member dynamics at both a transcriptional and DNA-binding level simultaneously.
The ChIP-exo results showed a majority of NRF1- and NRF3-binding sites harbored canonical AREs. Interestingly, more than 50% of the binding sites for NRF2 did not contain a canonical ARE. This indicates NRF2 may be less specific than NRF1 or NRF3. Although regulating the antioxidant response is one of the primary functions of NRF2, and NRF2-based literature has often focused on this role, the 50% of NRF2-binding sites not harboring an ARE supports a role for NRF2 outside of xenobiotic elimination. Indeed, Gene Ontology for genes up-regulated by NRF1, NRF2, and NRF3 centered on the stress-response pathways, and 100% of those genes harbored an ARE. In contrast, the processes enriched from other gene groups associated with NRF2 did not contribute to antioxidation or stress-response processes, participating instead in areas like protein quality control and trafficking. Future investigations on NRF2 and protein quality control could uncover more specific roles of NRF2 in the process of ER protein folding and subsequent targeting to the membrane. In the past decade, new roles are increasingly being uncovered for NRF2 in areas such as metabolism, proliferation and differentiation, iron homeostasis, and inflammation (49–56, 63–66). Perhaps some of these newer roles require NRF2 binding to less restrictive ARE sequences and may be an avenue of future investigations.
After combining the ChIP-exo and RNA-Seq data, we identified 262 high-confidence genes that fell into varying regulatory categories: some genes were regulated similarly by all NRF family members, whereas others were differentially regulated. We hypothesize that genes regulated similarly by all NRF members may be compensatory, i.e. deficiency in one gene could be compensated by up-regulation of another. For example, the following genes were up-regulated by all three NRF members and are lethal upon knockout in mice: VCP, GCLC, TRIO, TBK1, and TXNRD1 (67–72). Perhaps the loss of some of these transcription targets is partly to blame for the lethality seen with Nrf1 knockout animals as Nrf2 and Nrf3 may not be expressed at the right space and time to compensate during development. However, because Nrf1, Nrf2, and Nrf3 share several transcription targets, could activation of Nrf2 or Nrf3 in an Nrf1 knockout mouse rescue the embryonic lethal phenotype? It is important to note that under different cellular contexts, the jurisdiction of different NRF members may be swapped according to upstream signaling, cross-talk with other pathways, and proficiency/abundance of negative regulators. For example, some genes show cross-talk with aryl hydrocarbon receptor transcriptional programs (73). The relative location of each NRF member on the genome may dictate their roles during development as is the case with KRAS and HRAS genes, whereby knocking-in HRAS into the KRAS locus circumvents the embryonic lethality seen with KRAS loss (74). Assessing whether embryonic lethality is maintained in NRF1−/− animals by substituting NRF2 or NRF3 at the NRF1 locus would allow us to identify functional redundancy of NRF members and the importance of their genomic locations in their function. A putative understanding of the epigenetic and signaling pathways determining NRF member activation during development would help clarify their roles. Importantly, consensus sequence analyses also identified sequence preferences for NRF1 and NRF2. Thus, certain target genes may be preferentially regulated by NRF1 and NRF2, implicating that the two genes are not always interchangeable.
From a gene regulatory standpoint, an intriguing area to consider were those genes and GO processes that were regulated differentially by the NRF1, NRF2, and NRF3 members. Dystonin (DST) was the single gene that was up-regulated by NRF1 and NRF3 but down-regulated by NRF2. DST is a cytoskeletal linker whose loss–of–function is responsible for dystonia musculorum. Defects in DST are associated with malformations in the ER (75, 76). Considering NRF1 and NRF3 are targeted to the ER whereas NRF2 is not, the up-regulation of DST by NRF1 and NRF3 may be necessary for ER organization and thus proper functioning of NRF1 and NRF3. Interestingly, NRF2 is activated following ER stress and contributes to cell survival (77, 78). Why DST is not up-regulated by NRF2 when DST could help restore ER homeostasis remains enigmatic, but NRF2 did exclusively up-regulate the genes ARFGAP1, ERGIC1, TOR1B, and VAPA, which are involved in “endoplasmic reticulum organization” and “retrograde vesicle-mediated transport, Golgi to ER.” More inquiry into the divergent roles of NRF members in ER biology would be valuable in unraveling the differing transcriptional programs.
BRD2, TXN, and TNFRSF1A were genes up-regulated by both NRF1 and NRF2 but down-regulated by NRF3. Bromodomain-containing 2 (BRD2) is a transcriptional regulator known to inhibit NRF member activity (79). Thus, for NRF1 and NRF2 it may serve as a negative feedback mechanism, whereas for NRF3 it is a feed-forward pathway. Thioredoxin (TXN) is a bona fide NRF2 target gene; the contrarian role of NRF3 in regulating this gene and the others in this group is intriguing, but not unheard of, as NRF3 has been shown to negatively regulate levels of other bona fide antioxidant genes before, such as NQO1 and PRDX6 by “sitting” on the ARE sequence without activating transcription (80–82). Additionally, all three of these genes are involved in the viral infection process, which is supported from the GO analysis for “viral process.”
The NRF transcription factors differ in their tissue localization; Nrf1 and Nrf2 are expressed across almost all tissues, whereas the Nrf3 expression is predominately placental (2–4). NRF2-specific processes (see Fig. 9) included several metabolic processes, such as fatty acid catabolism. It has been well-described that maternal–to–fetal nutrient exchange is a critical function of the placenta, and this includes fatty acid transport and catabolism (83).
Perhaps the more intriguing proposition is the developmental activation and inactivation of NRF members over time. Nrf1 transcripts have been shown to be expressed in all tissues and at all stages of development investigated (84). In contrast, NRF2 is expressed solely in fetal liver and muscle and was absent in all other embryonic tissues investigated (3). Nrf3 transcript expression has been investigated in avian species, where it was first noticed in heart myocardium (85). Nrf3 transcripts then disappear from the heart and are next observed in the myotomal compartment of maturing somites. Central nervous system expression appears gradually and persists at low levels in ventricular neuroepithelial cells until at least embryonic day 6. Strong expression is observed in the early epiphysis, in the collecting ducts of the developing kidney, and in individual cells of the yolk sac (85). Studies in zebrafish have indicated that the differing expressions of Nrf transcripts in various tissue and developmental stages are due to the varying needs of oxidative stress regulation during development (86). Particularly, the absence of NRF2 during development may be to facilitate oxidative stress, which is required for some developmental processes (87). Nrf3 presents a second interesting case study; it is expressed early in avian heart development, and it is also critical in smooth muscle differentiation (81, 85). As we saw here, biological processes related to vascularization and muscle development such as “M Band” and “endothelial cell proliferation” also suggest a role for NRF3 in circulatory system development.
However, until a detailed description of NRF1, NRF2, and NRF3 expressions at all different stages of development in the same model system is completed, we can only guess whether the different genes specific to each NRF member are relevant for a developmental function. Much of the available data on the developmental patterns of NRF member expression has utilized transcript levels instead of protein levels, and thus the preponderance of post-translational regulations of NRF members (i.e. KEAP1-mediated degradation of NRF2 or ER compartmentalization of NRF1) lessens the data's utility.
To help understand some of these differences between NRF members, we investigated whether any genomic sequences flanking the AREs were consistent among particular NRF groups. While looking for motifs flanking the AREs, we identified that NRF2 prefers GC-rich flanking bases, whereas NRF1 prefers AT-rich flanking bases. Although these moderate preferences may help determine differences between NRF1 and NRF2, there were no other trends among the NRF members or their overlaps.
Perhaps NRF members differentially regulate genes to some degree based on their relative promiscuities for the ARE. As has been shown, mutations to several bases of the canonical 5′-TGABNNNGC-3′ do not always abolish NRF2 binding, and moreover, they can actually enhance binding. Particularly, mutations to the distal GC have a wide array of effects, but none abolish NRF2 binding (89). If NRF2 binding and lack of NRF1/NRF3 binding to noncanonical AREs could be validated on a host of NRF2-specific genes, it may explain some of the differential regulatory capacities between the three. For example, the NRF2-specific up-regulated genes SYT14, SIAH1, and UBE2E2 harbor 5′-TGACCACAT-3′, 5′-TGAGTGCGG-3′, and 5′-TGAGTGCGG-3′ sequences near the ChIP-exo peaks that closely mimic the canonical ARE and could still retain binding activity. An exhaustive comparison of binding capabilities for each NRF member to ARE derivatives may inform the differential binding capacities more completely.
Additionally, it is unclear how differing binding affinities may play a role. As has been shown previously (4), NRF2 binds more loosely to canonical AREs compared with NRF1 and NRF3. It is possible that NRF2 binding to some ARE sequences was blocked due to the presence of different ARE-binding proteins, such as dimers of Maf proteins and either p45, NRF1, NRF3, or BACH1, even with NRF2 overexpression. Similarly, the different affinities of NRF members to the sMAF proteins are not known. Thus, the context of other ARE-binding proteins and their binding sites may determine NRF2 binding as well, given it has less affinity in some cases.
In addition to a more refined understanding of binding affinities and promiscuities for each NRF member, a complete understanding of upstream events leading to transcriptional activation by NRFs could also uncover mechanisms governing their similarities and differences. For example, SETD6 was shown to inhibit NRF2 after ARE binding (90). As mentioned above, RPA1 is an additional inhibitor of NRF2 activity (62). In the context of the project presented here, the following questions arise. Can inhibitory proteins like SETD6 and RPA1 impede NRF1 and NRF3 activity, or just NRF2 activity? Does SETD6 bind to DNA near all AREs or just select ones? Understanding the interactions between NRF members and other transcription modulators is critical for interpreting differences between NRF members.
Here, we provide a compendium of the similarities and differences between the NRF1, NRF2, and NRF3 transcriptional programs. All three NRF members identify and bind to the ARE, indicating upstream signaling and cellular context, as well as other factors such as competitive binding of other transcription factors and ARE promiscuity, could play a major role in dictating the observed phenotypic differences among them. As such, determining the pathological and physiological relevance of the overlap and the disparities among the NRF family member transcriptional programs are key steps in targeting these pathways in human disease.
Experimental procedures
Cell culture and reagents
All cell lines were obtained from American Tissue Culture Collection (ATCC), and grown in Dulbecco's modified Eagle's medium with high glucose (4.5 g/liter) and no pyruvate and supplemented with heat-inactivated 10% fetal bovine serum. Cells were cultured in atmospheric air enriched with 5% CO2 in an incubator maintained at 37 °C. Zeocin, blasticidin, hygromycin, and doxycycline were obtained from Thermo Fisher Scientific and used at concentrations of 400, 10, 300, and 0.5 μg/ml, respectively. Tunicamycin was purchased from Sigma, and sulforaphane was from LKT Labs (S8044).
Generation of U2OSTetR–lacZ cells
All plasmids were obtained from Thermo Fisher Scientific (Flp-In T-RExTM core kit, K6500-01). pcDNA5/FRT/TO/3×FLAG vector was generated by cloning a triple FLAG sequence into the pcDNA5/FRT/TO vector (Thermo Fisher Scientific) after multiple cloning sequences. NRF member open reading frames were reverse-transcribed and amplified by PCR from U2OS total RNA and modified using site-directed mutagenesis as outlined in Fig. 1B. U2OSTetR–lacZ cells were generated according to the manufacturer's protocol. Briefly, U2OS cells were transfected with pFRTlacZ–Zeocin; cells with stable incorporation of this plasmid were selected with Zeocin and termed U2OS–lacZ. U2OS–lacZ cells were transfected with pCDNA/TetR; cells with stable incorporation of this plasmid were selected for with blasticidin and termed U2OSTetR–lacZ. While U2OSTetR–lacZ cells were being generated, the modified ORFs of NRF members NRF1, NRF2, and NRF3 (collectively NRFX) were each cloned into pcDNA5/FRT/TO/3×FLAG vector (see Fig. 1B for modifications to NRF ORFs). The pcDNA5/FRT/TO/NRFX/3×FLAG vectors were co-transfected with pOG44 into U2OSTetR–lacZ to generate U2OSTetR–NRFX. U2OSTetR–NRFX cells with proper incorporation of pcDNA5/FRT/TO/NRF/3×FLAG at the Flp recombinase site were selected with hygromycin. Thus, U2OSTetR–NRFX cells expressed the hygromycin resistance gene, and NRFX was tagged with triple FLAG under tet-operon control. See Fig. S1 for a schematic.
Cell line validations
U2OSTetR–NRF1, U2OSTetR–NRF2, and U2OSTetR–NRF3 cells were treated with vehicle or doxycycline for 16 h and harvested for immunoblotting and immunofluorescence.
Western blotting
Immunoblotting was performed according to standard procedures. Antibodies used in this study include anti-FLAG (Sigma, catalog no. 3165), anti-GAPDH (Santa Cruz Biotechnologies, sc-32233), anti-NRF1 (Cell Signaling Technologies, no. 8052), and anti-NRF2 (Santa Cruz Biotechnologies, sc-13032).
ADGRG7 and PHF20L1 validation
Four cell lines (MDA-MB-231, HK2, BEAS-2B, and H1299) were treated with 5 μg/ml tunicamycin, 5 μm sulforaphane, or vehicle control. After 4 h, cells were harvested for protein and prepared for immunoblotting. After 16 h, cells were harvested in TRIzol (Thermo Fisher Scientific). cDNA was synthesized using equal amounts of mRNA and a transcriptor first-strand cDNA synthesis kit (Roche Applied Science). Real-time quantitative PCR (qRT-PCR) was then performed. The GAPDH gene was used for RT-qPCR normalization according to the 2−ΔΔCt method (91). All experiments were performed in triplicate. Primers were as follows: GAPDH (forward, 5′-CTG ACT TCA ACA GCG ACA CC-3′, and reverse, 5′-TGC TGT AGC CAA ATT CGT TGT-3′); ADGRG7 (forward, 5′-GAC AAG GAA TAA GTC TCC ATT TGC-3′, and reverse, 5′-TGC CAT AGT AAC AGT GAG TCA AC-3′); FTL (forward, 5′-ATT TCG ACC GCG ATG ATG TG-3′, and reverse, 5′-CAT GGC GTC TGG GGT TTT AC-3′); GCLM (forward, 5′-GAC AAA ACA CAG TTG GAA CAG C-3′, and reverse, 5′-CAG TCA AAT CTG GTG GCA TC-3′); NQO1 (forward, 5′-ATG TAT GAC AAA GGA CCC TTC C-3′, and reverse, 5′-TCC CTT GCA GAG AGT ACA TGG-3′); and PHF20L1 (forward, 5′-CAT CTT GCC CTC CTC ATA GTC-3′, and reverse, 5′-AAA TCG CCC TGG AAT CAC TT-3′).
Immunofluorescence
For immunofluorescence assays, cells were grown on glass coverslips in 35-mm dishes. Cells were fixed in ice-cold methanol for 20 min and then blocked in 5% BSA for 1 h. FLAG–NRFX was detected using an anti-FLAG antibody (Sigma, catalog no. 3165) and an Alexa Fluor 488-conjugated anti-mouse secondary antibody. Images were taken with a Zeiss Observer.Z1 microscope. Images were acquired with Slidebook 4.2.0.11 software.
Luciferase assay—synthetic sequence
The dominating base pair sequences containing the NRF1- and NRF2-flanking regions on either side of a core ARE sequence (5′-GTT AGT TGC ATA GAG TGT GTT AAT TTC TAG CCA ATC GAC TAG GAA AGA CA TGACTCAGC AAT TAC GTA ACA GTA TGA AAG GGA AAC ATA AAA AAA GTC TCA ATT GAA TA-3′ and 5′-GCC GGG GGC GGG GGG GGG GCC GCG GGG GGG CGG GCG GGG CGG GCG GGG GC TGAGGCGGC CGG GCG GCG TGC GGC CGC GCG GCG GGC GGG GCC GCG GGC GCC GCT GCG GC-3′, respectively) were cloned into pGL 4.37 vector (Promega) in place of the commercially-available endogenous ARE sequence, to make NRF1–AREflank and NRF2–AREflank. U2OSTetR–NRF1 and U2OSTetR–NRF2 cells were co-transfected with a Renilla luciferase control vector (Promega E2261) and the respective NRF1-flank or NRF2-flank luciferase constructs. Cells were treated with doxycycline as described above. After 24 h, a dual-luciferase assay (Promega E1910) was conducted according to the manufacturer's instructions. Readouts from U2OSTetR–NRF1 and U2OSTetR–NRF2 were compared using Student's t test.
Luciferase assay–ADGRG7 and PHF20L1
Promoter regions were amplified by PCR from U2OS genomic DNA. Target regions included chr8:132775076–132777861 (PHF20L1) and chr3:100630731–100637341 (ADGRG7). The amplicons were cloned 5′ to the firefly luciferase ORF within the pGL4.21 vector (Promega) using Gibson cloning. Using these vectors and Renilla luciferase control vector, cells were subjected to dual-luciferase assay as with the synthetic vector above. All experiments were conducted in triplicate. Readouts were compared using ANOVA with post hoc Tukey's highly-significant difference test.
RNA sequencing
U2OSTetR–NRFX cells expressing NRF1, NRF2, and NRF3 were treated with doxycycline. The NRF1 and NRF3 open reading frames had their ER targeting sequences removed in U2OSTetR–NRF1 and U2OSTetR–NRF3, respectively. U2OSTetR–NRF2 cells were treated with 10 μm sulforaphane (LKT Laboratories) for 10 h. An empty vector (U2OSTetR–FLAG) was used as a control. Total RNA from duplicate samples of the above cells was isolated using TRIzol and a column-based RNeasy kit (Qiagen). rRNA was depleted using Ribo-Zero Gold rRNA removal kit (Illumina) and prepared for sequencing using the Ultra Directional RNA library prep kit from Illumina (New England Biolabs). Samples were run on a HiSeq3000 Illumina Sequencing Platform as 50-bp single-end read runs. FASTQ files from RNA-Seq were mapped to the reference genome (UCSC hg38) using TopHat2, a splicing aligner for RNA-Seq data. Resultant binary equivalent files were sorted and indexed for quicker access using SAMtools. The number of reads per gene was annotated using a custom in-house generated script. Differentially expressed genes between control and NRF-activated samples were identified using the DESeq2 package in the R statistical environment on the read count data, which utilizes the negative binomial test to assess statistical significance. Differentially-expressed genes were defined as all genes with multiple testing corrected and adjusted p value of <0.05.
ChIP-exo sequencing
U2OSTetR–NRFX cells expressing NRF1, NRF2, and NRF3 were treated with doxycycline. NRF1 ORFs and NRF3 ORFs had their ER-targeting sequences removed. The NRF2 ORF had its two degron motifs, DLG and ETGE, mutated to AAA and AAAA, respectively. ChIP assay was performed according to the manufacturer's instructions (EZ-CHIPTM, Merck, Germany). In brief, U2OSTetR–NRFX cells were seeded in a 150-mm dish. Upon ∼95% confluence, DNA–protein complexes were cross-linked by adding formaldehyde to a final concentration of 1%. The cells were washed with cold PBS and suspended in 1 ml of SDS lysis buffer containing 1 mm phenylmethylsulfonyl fluoride and 1% protease inhibitor mixture. Next, the samples were sonicated (nine times for 20 s and performed on ice) and centrifuged at 15,000 rpm for 30 min at 4 °C. The solubilized chromatin was diluted with ChIP dilution buffer (1:9 ratio) for ChIP assays. 0.1 ml of diluted solubilized chromatin was saved for total chromatin input. The chromatin was pre-cleared using protein G–agarose beads for 1 h at 4 °C and then incubated with 4 μg of anti-FLAG antibody or mouse normal IgG overnight at 4 °C with rotation. The cross-linked immunoprecipitates and total chromatin input were reverse cross-linked, and the DNA was isolated via phenol chloroform extraction ethanol precipitation. The library was created using adapter ligation methods, and each library was sequenced along with an input control library on a HiSeq3000 Illumina Sequencing Platform as 50-bp single-end read runs.
Sequencing FASTQ files for each NRF treatment group were mapped to UCSC hg38 using Bowtie2, a genomic aligner for DNA sequences. The resulting binary alignment sequence files were sorted, indexed, and purged of duplicate reads using SAMtools. ChIP peaks were identified using two algorithms: the Genome-wide Event finding and Motif discovery (GEM) algorithm and the Model-based Analysis for ChIP-Seq (MACS) algorithm. GEM was chosen for its utility in resolving ChIP-exo data, which usually has narrow, sharp peaks; the analysis was complemented with MACS, which can better resolve wider peaks in data with high background. Overlapping binding sites were calculated using Bedtools (92). Peaks were annotated by their location to nearby genes using a custom script in the R programming environment that identified all peaks that fell within genes' exons, introns, or within 5 kb of the transcription start and end sites. We defined peaks that fell within the first exon, first intron, or within 5 kb of the transcription start site as LREs, and genes harboring LREs were used for further analyses. ChIP peaks and genomic regions were visualized using the ChIPSeeker package, Gviz package, or in-house scripts in the R statistical environment (88, 93–94).
Combining ChIP-exo and RNA sequencing
Only genes harboring both LREs and differential RNA expression were taken forward for further analysis as high-confidence genes likely to be regulated by one or more NRF family members. If genes were inconsistent between any NRF members then that gene was excluded from analysis. Inconsistent genes include genes that had LREs but did not have differential RNA expression or genes that had differential RNA expression but did not harbor an LRE. Genes were then categorized by their regulatory network (i.e. NRF1 and NRF2 up-regulate Gene A).
Gene ontology annotation
High-confidence genes within each gene grouping or NRF categorization were subjected to a Gene Ontology (GO) analysis. GO terms were tested for statistically-significant enrichment by hypergeometric test (threshold p value <0.05 was considered significant).
Consensus sequence flanking analysis
Across the whole genome, the previously-identified LREs from high-confidence genes were scoured for sequences conforming to the core ARE sequence, 5′-TGABNNNGC-3′. All core sequences plus 50 flanking base pairs were extracted. For the different sets of genes presented, position weight matrices harboring the relative proportions of each base pair (A, T, G, and C) at each position were evaluated. Relative proportions of GC and AT base pairs were compared between gene sets and between flanking positions using the χ2 test. p values were corrected for multiple testing using the Benjamini-Hotchberg methodology. Position weight matrices were visualized using the ggseqlogo package in the R environment.
ChIP peak sequence conservation
To evaluate conservation of ChIP-peaks' sequences across different members of the subphylum vertebrata, we retrieved phastCons scores for genomic regions covered by the high-confidence ChIP-peaks directly from the UCSC genome browser's Cons 7 Verts track. This track compares sequences from seven different species within the subphylum vertebrata by multiple alignment. The seven species being compared are human, chimp, rhesus, mouse, rat, dog, and opossum.
Data and materials availability
Datasets from the sequencing studies provided here are available at the NCBI short read archive (BioProject 541591).
Author contributions
P. L., M. J. K., W. T., and A. O. data curation; P. L., M. J. K., W. T., D. D. Z., and A. O. formal analysis; P. L., M. J. K., W. T., and D. N. investigation; P. L., M. J. K., W. T., D. N., and A. O. methodology; M. J. K. and A. O. software; M. J. K., D. D. Z., and A. O. funding acquisition; M. J. K. validation; M. J. K. and A. O. visualization; M. J. K., D. D. Z., and A. O. writing-original draft; M. J. K., D. D. Z., and A. O. writing-review and editing; D. N., D. D. Z., and A. O. resources; D. D. Z. and A. O. conceptualization; D. D. Z. and A. O. supervision; D. D. Z. and A. O. project administration.
Supplementary Material
Acknowledgments
We thank Dr. Xinmin Li of the UCLA Technology Center for Genomics and Bioinformatics for technical advice. We also thank Cody Schmidlin and Matt Dodson for critical reading of the manuscript.
This work was supported in part by National Institutes of Health Grants R21ES027920 and R01CA226920 (to A. O.) and R01DK109555, R01ES026845, and P42ES004940 (to D. D. Z.) and by National Science Foundation Graduate Research Fellowship Program Grant DGE-1746060 (to M. J. K.). The authors declare that they have no conflicts of interest with the contents of this article. The content is solely the responsibility of the authors and does not necessarily represent the official views of the National Institutes of Health or the National Science Foundation.
This article contains Figs. S1–S3 and Tables S1–S6.
- NRF
- nuclear factor (erythroid 2)-like
- ARE
- antioxidant-response element
- bZip
- basic leucine zipper
- ChIP
- chromatin immunoprecipitation
- GO
- gene ontology
- LRE
- likely regulatory element
- NQO1
- NAD(P)H quinone dehydrogenase 1
- sMaf
- small musculoaponeurotic fibrosarcoma
- TSS
- transcription start site
- ANOVA
- analysis of variance
- qPCR
- quantitative PCR
- ER
- endoplasmic reticulum
- GAPDH
- glyceraldehyde-3-phosphate dehydrogenase
- RNA-Seq
- RNA-sequencing
- exo
- exonuclease
- CNC
- cap'n'collar
- ChIP-Seq
- ChIP-sequencing
- GPI
- glycosylphosphatidylinositol
- DST
- dystonin.
References
- 1. Motohashi H., O'Connor T., Katsuoka F., Engel J. D., and Yamamoto M. (2002) Integration and diversity of the regulatory network composed of Maf and CNC families of transcription factors. Gene 294, 1–12 10.1016/S0378-1119(02)00788-6 [DOI] [PubMed] [Google Scholar]
- 2. Chan J. Y., Han X.-L., and Kan Y. W. (1993) Cloning of Nrf1, an NF-E2-related transcription factor, by genetic selection in yeast. Proc. Natl. Acad. Sci. U.S.A. 90, 11371–11375 10.1073/pnas.90.23.11371 [DOI] [PMC free article] [PubMed] [Google Scholar]
- 3. Moi P., Chan K., Asunis I., Cao A., and Kan Y. W. (1994) Isolation of NF-E2-related factor 2 (Nrf2), a NF-E2-like basic leucine zipper transcriptional activator that binds to the tandem NF-E2/AP1 repeat of the β-globin locus control region. Proc. Natl. Acad. Sci. U.S.A. 91, 9926–9930 10.1073/pnas.91.21.9926 [DOI] [PMC free article] [PubMed] [Google Scholar]
- 4. Kobayashi A., Ito E., Toki T., Kogame K., Takahashi S., Igarashi K., Hayashi N., and Yamamoto M. (1999) Molecular cloning and functional characterization of a new Cap'n'collar family transcription factor Nrf3. J. Biol. Chem. 274, 6443–6452 10.1074/jbc.274.10.6443 [DOI] [PubMed] [Google Scholar]
- 5. Shivdasani R. A., and Orkin S. H. (1995) Erythropoiesis and globin gene expression in mice lacking the transcription factor NF-E2. Proc. Natl. Acad. Sci. U.S.A. 92, 8690–8694 10.1073/pnas.92.19.8690 [DOI] [PMC free article] [PubMed] [Google Scholar]
- 6. Chan J. Y., Kwong M., Lu R., Chang J., Wang B., Yen T. S., and Kan Y. W. (1998) Targeted disruption of the ubiquitous CNC-bZIP transcription factor, Nrf-1, results in anemia and embryonic lethality in mice. EMBO J. 17, 1779–1787 10.1093/emboj/17.6.1779 [DOI] [PMC free article] [PubMed] [Google Scholar]
- 7. Farmer S. C., Sun C. W., Winnier G. E., Hogan B. L., and Townes T. M. (1997) The bZIP transcription factor LCR-F1 is essential for mesoderm formation in mouse development. Genes Dev. 11, 786–798 10.1101/gad.11.6.786 [DOI] [PubMed] [Google Scholar]
- 8. Chan K., Lu R., Chang J. C., and Kan Y. W. (1996) NRF2, a member of the NFE2 family of transcription factors, is not essential for murine erythropoiesis, growth, and development. Proc. Natl. Acad. Sci. U.S.A. 93, 13943–13948 10.1073/pnas.93.24.13943 [DOI] [PMC free article] [PubMed] [Google Scholar]
- 9. Derjuga A., Gourley T. S., Holm T. M., Heng H. H., Shivdasani R. A., Ahmed R., Andrews N. C., and Blank V. (2004) Complexity of CNC transcription factors as revealed by gene targeting of the Nrf3 locus. Mol. Cell. Biol. 24, 3286–3294 10.1128/MCB.24.8.3286-3294.2004 [DOI] [PMC free article] [PubMed] [Google Scholar]
- 10. Chevillard G., Paquet M., and Blank V. (2011) Nfe2l3 (Nrf3) deficiency predisposes mice to T-cell lymphoblastic lymphoma. Blood 117, 2005–2008 10.1182/blood-2010-02-271460 [DOI] [PubMed] [Google Scholar]
- 11. Toki T., Itoh J., Kitazawa J., Arai K., Hatakeyama K., Akasaka J., Igarashi K., Nomura N., Yokoyama M., Yamamoto M., and Ito E. (1997) Human small Maf proteins form heterodimers with CNC family transcription factors and recognize the NF-E2 motif. Oncogene 14, 1901–1910 10.1038/sj.onc.1201024 [DOI] [PubMed] [Google Scholar]
- 12. Blank V. (2008) Small Maf proteins in mammalian gene control: mere dimerization partners or dynamic transcriptional regulators? J. Mol. Biol. 376, 913–925 10.1016/j.jmb.2007.11.074 [DOI] [PubMed] [Google Scholar]
- 13. Rushmore T. H., King R. G., Paulson K. E., and Pickett C. B. (1990) Regulation of glutathione S-transferase Ya subunit gene expression: identification of a unique xenobiotic-responsive element controlling inducible expression by planar aromatic compounds. Proc. Natl. Acad. Sci. U.S.A. 87, 3826–3830 10.1073/pnas.87.10.3826 [DOI] [PMC free article] [PubMed] [Google Scholar]
- 14. Rushmore T. H., Morton M. R., and Pickett C. B. (1991) The antioxidant responsive element. Activation by oxidative stress and identification of the DNA consensus sequence required for functional activity. J. Biol. Chem. 266, 11632–11639 [PubMed] [Google Scholar]
- 15. Rushmore T. H., and Pickett C. (1990) Transcriptional regulation of the rat glutathione S-transferase Ya subunit gene. Characterization of a xenobiotic-responsive element controlling inducible expression by phenolic antioxidants. J. Biol. Chem. 265, 14648–14653 [PubMed] [Google Scholar]
- 16. Itoh K., Chiba T., Takahashi S., Ishii T., Igarashi K., Katoh Y., Oyake T., Hayashi N., Satoh K., Hatayama I., Yamamoto M., and Nabeshima Y. (1997) An Nrf2/small Maf heterodimer mediates the induction of phase II detoxifying enzyme genes through antioxidant-response elements. Biochem. Biophys. Res. Commun. 236, 313–322 10.1006/bbrc.1997.6943 [DOI] [PubMed] [Google Scholar]
- 17. Chorley B. N., Campbell M. R., Wang X., Karaca M., Sambandan D., Bangura F., Xue P., Pi J., Kleeberger S. R., and Bell D. A. (2012) Identification of novel NRF2-regulated genes by ChIP-Seq: influence on retinoid X receptor α. Nucleic Acids Res. 40, 7416–7429 10.1093/nar/gks409 [DOI] [PMC free article] [PubMed] [Google Scholar]
- 18. Eren E., Tufekci K. U., Isci K. B., Tastan B., Genc K., and Genc S. (2018) Sulforaphane inhibits lipopolysaccharide-induced inflammation, cytotoxicity, oxidative stress, and miR-155 expression and switches to Mox phenotype through activating extracellular signal-regulated kinase 1/2–nuclear factor erythroid 2-related factor 2/antioxidant-response element pathway in murine microglial cells. Front. Immunol. 9, 36 10.3389/fimmu.2018.00036 [DOI] [PMC free article] [PubMed] [Google Scholar]
- 19. Velmurugan G. V., Sundaresan N. R., Gupta M. P., and White C. (2013) Defective Nrf2-dependent redox signalling contributes to microvascular dysfunction in type 2 diabetes. Cardiovasc. Res. 100, 143–150 10.1093/cvr/cvt125 [DOI] [PMC free article] [PubMed] [Google Scholar]
- 20. Zhang D. D. (2006) Mechanistic studies of the Nrf2-Keap1 signaling pathway. Drug Metab. Rev. 38, 769–789 10.1080/03602530600971974 [DOI] [PubMed] [Google Scholar]
- 21. Yoon H.-Y., Kang N.-I., Lee H.-K., Jang K. Y., Park J.-W., and Park B.-H. (2008) Sulforaphane protects kidneys against ischemia-reperfusion injury through induction of the Nrf2-dependent phase 2 enzyme. Biochem. Pharmacol. 75, 2214–2223 10.1016/j.bcp.2008.02.029 [DOI] [PubMed] [Google Scholar]
- 22. Wang W., and Chan J. Y. (2006) Nrf1 is targeted to the endoplasmic reticulum membrane by an N-terminal transmembrane domain Inhibition of nuclear translocation and transacting function. J. Biol. Chem. 281, 19676–19687 10.1074/jbc.M602802200 [DOI] [PubMed] [Google Scholar]
- 23. Thimmulappa R. K., Mai K. H., Srisuma S., Kensler T. W., Yamamoto M., and Biswal S. (2002) Identification of Nrf2-regulated genes induced by the chemopreventive agent sulforaphane by oligonucleotide microarray. Cancer Res. 62, 5196–5203 [PubMed] [Google Scholar]
- 24. Zhang Y., Lucocq J. M., Yamamoto M., and Hayes J. D. (2007) The NHB1 (N-terminal homology box 1) sequence in transcription factor Nrf1 is required to anchor it to the endoplasmic reticulum and also to enable its asparagine-glycosylation. Biochem. J. 408, 161–172 10.1042/BJ20070761 [DOI] [PMC free article] [PubMed] [Google Scholar]
- 25. Zhang Y., Crouch D. H., Yamamoto M., and Hayes J. D. (2006) Negative regulation of the Nrf1 transcription factor by its N-terminal domain is independent of Keap1: Nrf1, but not Nrf2, is targeted to the endoplasmic reticulum. Biochem. J. 399, 373–385 10.1042/BJ20060725 [DOI] [PMC free article] [PubMed] [Google Scholar]
- 26. Wang M., Qiu L., Ru X., Song Y., and Zhang Y. (2019) Distinct isoforms of Nrf1 diversely regulate different subsets of its cognate target genes. Sci. Rep. 9, 2960 10.1038/s41598-019-39536-0 [DOI] [PMC free article] [PubMed] [Google Scholar]
- 27. Bugno M., Daniel M., Chepelev N. L., and Willmore W. G. (2015) Changing gears in Nrf1 research, from mechanisms of regulation to its role in disease and prevention. Biochim. Biophys. Acta 1849, 1260–1276 10.1016/j.bbagrm.2015.08.001 [DOI] [PubMed] [Google Scholar]
- 28. Biswas M., Phan D., Watanabe M., and Chan J. Y. (2011) The Fbw7 tumor suppressor regulates nuclear factor E2-related factor 1 transcription factor turnover through proteasome-mediated proteolysis. J. Biol. Chem. 286, 39282–39289 10.1074/jbc.M111.253807 [DOI] [PMC free article] [PubMed] [Google Scholar]
- 29. Tsuchiya Y., Morita T., Kim M., Iemura S., Natsume T., Yamamoto M., and Kobayashi A. (2011) Dual regulation of the transcriptional activity of Nrf1 by β-TrCP- and Hrd1-dependent degradation mechanisms. Mol. Cell. Biol. 31, 4500–4512 10.1128/MCB.05663-11 [DOI] [PMC free article] [PubMed] [Google Scholar]
- 30. Steffen J., Seeger M., Koch A., and Krüger E. (2010) Proteasomal degradation is transcriptionally controlled by TCF11 via an ERAD-dependent feedback loop. Mol. Cell 40, 147–158 10.1016/j.molcel.2010.09.012 [DOI] [PubMed] [Google Scholar]
- 31. Radhakrishnan S. K., Lee C. S., Young P., Beskow A., Chan J. Y., and Deshaies R. J. (2010) Transcription factor Nrf1 mediates the proteasome recovery pathway after proteasome inhibition in mammalian cells. Mol. Cell 38, 17–28 10.1016/j.molcel.2010.02.029 [DOI] [PMC free article] [PubMed] [Google Scholar]
- 32. Itoh K., Wakabayashi N., Katoh Y., Ishii T., Igarashi K., Engel J. D., and Yamamoto M. (1999) Keap1 represses nuclear activation of antioxidant responsive elements by Nrf2 through binding to the amino-terminal Neh2 domain. Genes Dev. 13, 76–86 10.1101/gad.13.1.76 [DOI] [PMC free article] [PubMed] [Google Scholar]
- 33. Zhang D. D., and Hannink M. (2003) Distinct cysteine residues in Keap1 are required for Keap1-dependent ubiquitination of Nrf2 and for stabilization of Nrf2 by chemopreventive agents and oxidative stress. Mol. Cell. Biol. 23, 8137–8151 10.1128/MCB.23.22.8137-8151.2003 [DOI] [PMC free article] [PubMed] [Google Scholar]
- 34. Tian W., Rojo de la Vega M., Schmidlin C. J., Ooi A., and Zhang D. D. (2018) Kelch-like ECH-associated protein 1 (KEAP1) differentially regulates nuclear factor erythroid-2–related factors 1 and 2 (NRF1 and NRF2). J. Biol. Chem. 293, 2029–2040 10.1074/jbc.RA117.000428 [DOI] [PMC free article] [PubMed] [Google Scholar]
- 35. Rada P., Rojo A. I., Chowdhry S., McMahon M., Hayes J. D., and Cuadrado A. (2011) SCF/β-TrCP promotes glycogen synthase kinase 3-dependent degradation of the Nrf2 transcription factor in a Keap1-independent manner. Mol. Cell. Biol. 31, 1121–1133 10.1128/MCB.01204-10 [DOI] [PMC free article] [PubMed] [Google Scholar]
- 36. Wu T., Zhao F., Gao B., Tan C., Yagishita N., Nakajima T., Wong P. K., Chapman E., Fang D., and Zhang D. D. (2014) Hrd1 suppresses Nrf2-mediated cellular protection during liver cirrhosis. Genes Dev. 28, 708–722 10.1101/gad.238246.114 [DOI] [PMC free article] [PubMed] [Google Scholar]
- 37. Kerins M. J., Liu P., Tian W., Mannheim W., Zhang D. D., and Ooi A. (2019) Genome wide CRISPR screen reveals autophagy disruption as the convergence mechanism that regulates the NRF2 transcription factor. Mol. Cell. Biol. 39, e00037–19 10.1128/MCB.00037-19 [DOI] [PMC free article] [PubMed] [Google Scholar]
- 38. Zhang Y., Kobayashi A., Yamamoto M., and Hayes J. D. (2009) The Nrf3 transcription factor is a membrane-bound glycoprotein targeted to the endoplasmic reticulum through its N-terminal homology box 1 sequence. J. Biol. Chem. 284, 3195–3210 10.1074/jbc.M805337200 [DOI] [PubMed] [Google Scholar]
- 39. Deleted in proof.
- 40. Nouhi Z., Chevillard G., Derjuga A., and Blank V. (2007) Endoplasmic reticulum association and N-linked glycosylation of the human Nrf3 transcription factor. FEBS Lett. 581, 5401–5406 10.1016/j.febslet.2007.10.041 [DOI] [PubMed] [Google Scholar]
- 41. Yamamoto M., Kensler T. W., and Motohashi H. (2018) The KEAP1-NRF2 system: a thiol-based sensor-effector apparatus for maintaining redox homeostasis. Physiol. Rev. 98, 1169–1203 10.1152/physrev.00023.2017 [DOI] [PMC free article] [PubMed] [Google Scholar]
- 42. Chevillard G., and Blank V. (2011) NFE2L3 (NRF3): the Cinderella of the Cap'n'Collar transcription factors. Cell. Mol. Life Sci. 68, 3337–3348 10.1007/s00018-011-0747-x [DOI] [PMC free article] [PubMed] [Google Scholar]
- 43. Kim H. M., Han J. W., and Chan J. Y. (2016) Nuclear factor erythroid-2 like 1 (NFE2L1): structure, function and regulation. Gene 584, 17–25 10.1016/j.gene.2016.03.002 [DOI] [PMC free article] [PubMed] [Google Scholar]
- 44. Hirotsu Y., Hataya N., Katsuoka F., and Yamamoto M. (2012) NF-E2-related factor 1 (Nrf1) serves as a novel regulator of hepatic lipid metabolism through regulation of the Lipin1 and PGC-1β genes. Mol. Cell. Biol. 32, 2760–2770 10.1128/MCB.06706-11 [DOI] [PMC free article] [PubMed] [Google Scholar]
- 45. Hirotsu Y., Higashi C., Fukutomi T., Katsuoka F., Tsujita T., Yagishita Y., Matsuyama Y., Motohashi H., Uruno A., and Yamamoto M. (2014) Transcription factor NF-E2-related factor 1 impairs glucose metabolism in mice. Genes Cells 19, 650–665 10.1111/gtc.12165 [DOI] [PubMed] [Google Scholar]
- 46. Tsujita T., Peirce V., Baird L., Matsuyama Y., Takaku M., Walsh S. V., Griffin J. L., Uruno A., Yamamoto M., and Hayes J. D. (2014) Transcription factor Nrf1 negatively regulates the cystine/glutamate transporter and lipid-metabolizing enzymes. Mol. Cell. Biol. 34, 3800–3816 10.1128/MCB.00110-14 [DOI] [PMC free article] [PubMed] [Google Scholar]
- 47. Xu Z., Chen L., Leung L., Yen T. S., Lee C., and Chan J. Y. (2005) Liver-specific inactivation of the Nrf1 gene in adult mouse leads to nonalcoholic steatohepatitis and hepatic neoplasia. Proc. Natl. Acad. Sci. U.S.A. 102, 4120–4125 10.1073/pnas.0500660102 [DOI] [PMC free article] [PubMed] [Google Scholar]
- 48. Biswas M., and Chan J. Y. (2010) Role of Nrf1 in antioxidant-response element-mediated gene expression and beyond. Toxicol. Appl. Pharmacol. 244, 16–20 10.1016/j.taap.2009.07.034 [DOI] [PMC free article] [PubMed] [Google Scholar]
- 49. Chartoumpekis D. V., Wakabayashi N., and Kensler T. W. (2015) Keap1/Nrf2 pathway in the frontiers of cancer and non-cancer cell metabolism. Biochem. Soc. Trans. 43, 639–644 10.1042/BST20150049 [DOI] [PMC free article] [PubMed] [Google Scholar]
- 50. Holmström K. M., Baird L., Zhang Y., Hargreaves I., Chalasani A., Land J. M., Stanyer L., Yamamoto M., Dinkova-Kostova A. T., and Abramov A. Y. (2013) Nrf2 impacts cellular bioenergetics by controlling substrate availability for mitochondrial respiration. Biol. Open 2, 761–770 10.1242/bio.20134853 [DOI] [PMC free article] [PubMed] [Google Scholar]
- 51. Ludtmann M. H., Angelova P. R., Zhang Y., Abramov A. Y., and Dinkova-Kostova A. T. (2014) Nrf2 affects the efficiency of mitochondrial fatty acid oxidation. Biochem. J. 457, 415–424 10.1042/BJ20130863 [DOI] [PMC free article] [PubMed] [Google Scholar]
- 52. Mitsuishi Y., Taguchi K., Kawatani Y., Shibata T., Nukiwa T., Aburatani H., Yamamoto M., and Motohashi H. (2012) Nrf2 redirects glucose and glutamine into anabolic pathways in metabolic reprogramming. Cancer Cell 22, 66–79 10.1016/j.ccr.2012.05.016 [DOI] [PubMed] [Google Scholar]
- 53. Kuosmanen S. M., Kansanen E., Kaikkonen M. U., Sihvola V., Pulkkinen K., Jyrkkänen H.-K., Tuoresmäki P., Hartikainen J., Hippeläinen M., Kokki H., Tavi P., Heikkinen S., and Levonen A. L. (2018) NRF2 regulates endothelial glycolysis and proliferation with miR-93 and mediates the effects of oxidized phospholipids on endothelial activation. Nucleic Acids Res. 46, 1124–1138 10.1093/nar/gkx1155 [DOI] [PMC free article] [PubMed] [Google Scholar]
- 54. Murakami S., and Motohashi H. (2015) Roles of Nrf2 in cell proliferation and differentiation. Free Radic. Biol. Med. 88, 168–178 10.1016/j.freeradbiomed.2015.06.030 [DOI] [PubMed] [Google Scholar]
- 55. Homma S., Ishii Y., Morishima Y., Yamadori T., Matsuno Y., Haraguchi N., Kikuchi N., Satoh H., Sakamoto T., Hizawa N., Itoh K., and Yamamoto M. (2009) Nrf2 enhances cell proliferation and resistance to anticancer drugs in human lung cancer. Clin. Cancer Res. 15, 3423–3432 10.1158/1078-0432.CCR-08-2822 [DOI] [PubMed] [Google Scholar]
- 56. Kerins M. J., Vashisht A. A., Liang B. X., Duckworth S. J., Praslicka B. J., Wohlschlegel J. A., and Ooi A. (2017) Fumarate mediates a chronic proliferative signal in fumarate hydratase inactivated cancer cells by increasing transcription and translation of ferritin genes. Mol. Cell. Biol. 37, e00079–17 10.1128/MCB.00079-17 [DOI] [PMC free article] [PubMed] [Google Scholar]
- 57. Schneider K., Valdez J., Nguyen J., Vawter M., Galke B., Kurtz T. W., and Chan J. Y. (2016) Increased energy expenditure, Ucp1 expression, and resistance to diet-induced obesity in mice lacking nuclear factor-erythroid-2-related transcription factor-2 (Nrf2). J. Biol. Chem. 291, 7754–7766 10.1074/jbc.M115.673756 [DOI] [PMC free article] [PubMed] [Google Scholar]
- 58. Ohtsuji M., Katsuoka F., Kobayashi A., Aburatani H., Hayes J. D., and Yamamoto M. (2008) Nrf1 and Nrf2 play distinct roles in activation of antioxidant-response element-dependent genes. J. Biol. Chem. 283, 33554–33562 10.1074/jbc.M804597200 [DOI] [PMC free article] [PubMed] [Google Scholar]
- 59. Raghunath A., Sundarraj K., Nagarajan R., Arfuso F., Bian J., Kumar A. P., Sethi G., and Perumal E. (2018) Antioxidant response elements: discovery, classes, regulation and potential applications. Redox Biol. 17, 297–314 10.1016/j.redox.2018.05.002 [DOI] [PMC free article] [PubMed] [Google Scholar]
- 60. Kulaeva O. I., Nizovtseva E. V., Polikanov Y. S., Ulianov S. V., and Studitsky V. M. (2012) Distant activation of transcription: mechanisms of enhancer action. Mol. Cell. Biol. 32, 4892–4897 10.1128/MCB.01127-12 [DOI] [PMC free article] [PubMed] [Google Scholar]
- 61. Li G., Ruan X., Auerbach R. K., Sandhu K. S., Zheng M., Wang P., Poh H. M., Goh Y., Lim J., Zhang J., Sim H. S., Peh S. Q., Mulawadi F. H., Ong C. T., Orlov Y. L., et al. (2012) Extensive promoter-centered chromatin interactions provide a topological basis for transcription regulation. Cell 148, 84–98 10.1016/j.cell.2011.12.014 [DOI] [PMC free article] [PubMed] [Google Scholar]
- 62. Liu P., De La Vega M. R., Sammani S., Mascarenhas J. B., Kerins M., Dodson M., Sun X., Wang T., Ooi A., Garcia J. G., Garcia J. G., and Zhang D. D. (2018) RPA1 binding to NRF2 switches ARE-dependent transcriptional activation to ARE-NRE–dependent repression. Proc. Natl. Acad. Sci. U.S.A. 115, E10352–E10361 10.1073/pnas.1812125115 [DOI] [PMC free article] [PubMed] [Google Scholar]
- 63. Kerins M. J., and Ooi A. (2018) The roles of NRF2 in modulating cellular iron homeostasis. Antioxid. Redox Signal. 29, 1756–1773 10.1089/ars.2017.7176 [DOI] [PMC free article] [PubMed] [Google Scholar]
- 64. Kasai S., Mimura J., Ozaki T., and Itoh K. (2018) Emerging regulatory role of Nrf2 in iron, heme, and hemoglobin metabolism in physiology and disease. Front. Vet. Sci. 5, 242 10.3389/fvets.2018.00242 [DOI] [PMC free article] [PubMed] [Google Scholar]
- 65. Mills E. L., Ryan D. G., Prag H. A., Dikovskaya D., Menon D., Zaslona Z., Jedrychowski M. P., Costa A. S. H., Higgins M., Hams E., Szpyt J., Runtsch M. C., King M. S., McGouran J. F., Fischer R., et al. (2018) Itaconate is an anti-inflammatory metabolite that activates Nrf2 via alkylation of KEAP1. Nature 556, 113–117 10.1038/nature25986 [DOI] [PMC free article] [PubMed] [Google Scholar]
- 66. Kansanen E., Kuosmanen S. M., Leinonen H., and Levonen A.-L. (2013) The Keap1-Nrf2 pathway: mechanisms of activation and dysregulation in cancer. Redox Biol. 1, 45–49 10.1016/j.redox.2012.10.001 [DOI] [PMC free article] [PubMed] [Google Scholar]
- 67. Hemmi H., Takeuchi O., Sato S., Yamamoto M., Kaisho T., Sanjo H., Kawai T., Hoshino K., Takeda K., and Akira S. (2004) The roles of two IκB kinase-related kinases in lipopolysaccharide and double stranded RNA signaling and viral infection. J. Exp. Med. 199, 1641–1650 10.1084/jem.20040520 [DOI] [PMC free article] [PubMed] [Google Scholar]
- 68. Jakupoglu C., Przemeck G. K., Schneider M., Moreno S. G., Mayr N., Hatzopoulos A. K., de Angelis M. H., Wurst W., Bornkamm G. W., Brielmeier M., and Conrad M. (2005) Cytoplasmic thioredoxin reductase is essential for embryogenesis but dispensable for cardiac development. Mol. Cell. Biol. 25, 1980–1988 10.1128/MCB.25.5.1980-1988.2005 [DOI] [PMC free article] [PubMed] [Google Scholar]
- 69. Bonnard M., Mirtsos C., Suzuki S., Graham K., Huang J., Ng M., Itié A., Wakeham A., Shahinian A., Henzel W. J., Elia A. J., Shillinglaw W., Mak T. W., Cao Z., and Yeh W. C. (2000) Deficiency of T2K leads to apoptotic liver degeneration and impaired NF-κB-dependent gene transcription. EMBO J. 19, 4976–4985 10.1093/emboj/19.18.4976 [DOI] [PMC free article] [PubMed] [Google Scholar]
- 70. Dalton T. P., Dieter M. Z., Yang Y., Shertzer H. G., and Nebert D. W. (2000) Knockout of the mouse glutamate cysteine ligase catalytic subunit (Gclc) gene: embryonic lethal when homozygous, and proposed model for moderate glutathione deficiency when heterozygous. Biochem. Biophys. Res. Commun. 279, 324–329 10.1006/bbrc.2000.3930 [DOI] [PubMed] [Google Scholar]
- 71. Zong W., Liu S., Wang X., Zhang J., Zhang T., Liu Z., Wang D., Zhang A., Zhu M., and Gao J. (2015) Trio gene is required for mouse learning ability. Brain Res. 1608, 82–90 10.1016/j.brainres.2015.02.040 [DOI] [PubMed] [Google Scholar]
- 72. Müller J., Deinhardt K., Rosewell I., Warren G., and Shima D. T. (2007) Targeted deletion of p97 (VCP/CDC48) in mouse results in early embryonic lethality. Biochem. Biophys. Res. Commun. 354, 459–465 10.1016/j.bbrc.2006.12.206 [DOI] [PubMed] [Google Scholar]
- 73. Yeager R. L., Reisman S. A., Aleksunes L. M., and Klaassen C. D. (2009) Introducing the “TCDD-inducible AhR-Nrf2 gene battery”. Toxicol. Sci. 111, 238–246 10.1093/toxsci/kfp115 [DOI] [PMC free article] [PubMed] [Google Scholar]
- 74. Potenza N., Vecchione C., Notte A., De Rienzo A., Rosica A., Bauer L., Affuso A., De Felice M., Russo T., Poulet R., Cifelli G., De Vita G., Lembo G., and Di Lauro R. (2005) Replacement of K-Ras with H-Ras supports normal embryonic development despite inducing cardiovascular pathology in adult mice. EMBO Rep. 6, 432–437 10.1038/sj.embor.7400397 [DOI] [PMC free article] [PubMed] [Google Scholar]
- 75. Young K. G., and Kothary R. (2008) Dystonin/Bpag1 is a necessary endoplasmic reticulum/nuclear envelope protein in sensory neurons. Exp. Cell Res. 314, 2750–2761 10.1016/j.yexcr.2008.06.021 [DOI] [PubMed] [Google Scholar]
- 76. Ryan S. D., Ferrier A., Sato T., O'Meara R. W., De Repentigny Y., Jiang S. X., Hou S. T., and Kothary R. (2012) Neuronal dystonin isoform 2 is a mediator of endoplasmic reticulum structure and function. Mol. Biol. Cell 23, 553–566 10.1091/mbc.e11-06-0573 [DOI] [PMC free article] [PubMed] [Google Scholar]
- 77. Mukaigasa K., Tsujita T., Nguyen V. T., Li L., Yagi H., Fuse Y., Nakajima-Takagi Y., Kato K., Yamamoto M., and Kobayashi M. (2018) Nrf2 activation attenuates genetic endoplasmic reticulum stress induced by a mutation in the phosphomannomutase 2 gene in zebrafish. Proc. Natl. Acad. Sci. U.S.A. 115, 2758–2763 10.1073/pnas.1714056115 [DOI] [PMC free article] [PubMed] [Google Scholar]
- 78. Cullinan S. B., Zhang D., Hannink M., Arvisais E., Kaufman R. J., and Diehl J. A. (2003) Nrf2 is a direct PERK substrate and effector of PERK-dependent cell survival. Mol. Cell. Biol. 23, 7198–7209 10.1128/MCB.23.20.7198-7209.2003 [DOI] [PMC free article] [PubMed] [Google Scholar]
- 79. Michaeloudes C., Mercado N., Clarke C., Bhavsar P. K., Adcock I. M., Barnes P. J., and Chung K. F. (2014) Bromodomain and extraterminal proteins suppress NF-E2–related factor 2–mediated antioxidant gene expression. J. Immunol. 192, 4913–4920 10.4049/jimmunol.1301984 [DOI] [PMC free article] [PubMed] [Google Scholar]
- 80. Chowdhury I., Mo Y., Gao L., Kazi A., Fisher A. B., and Feinstein S. I. (2009) Oxidant stress stimulates expression of the human peroxiredoxin 6 gene by a transcriptional mechanism involving an antioxidant-response element. Free Radic. Biol. Med. 46, 146–153 10.1016/j.freeradbiomed.2008.09.027 [DOI] [PMC free article] [PubMed] [Google Scholar]
- 81. Pepe A. E., Xiao Q., Zampetaki A., Zhang Z., Kobayashi A., Hu Y., and Xu Q. (2010) Crucial role of nrf3 in smooth muscle cell differentiation from stem cells. Circ. Res. 106, 870–879 10.1161/CIRCRESAHA.109.211417 [DOI] [PubMed] [Google Scholar]
- 82. Sankaranarayanan K., and Jaiswal A. K. (2004) Nrf3 negatively regulates antioxidant-response element-mediated expression and antioxidant induction of NAD(P)H:quinone oxidoreductase1 gene. J. Biol. Chem. 279, 50810–50817 10.1074/jbc.M404984200 [DOI] [PubMed] [Google Scholar]
- 83. Garnica A. D., and Chan W.-Y. (1996) The role of the placenta in fetal nutrition and growth. J. Am. Coll. Nutr. 15, 206–222 10.1080/07315724.1996.10718591 [DOI] [PubMed] [Google Scholar]
- 84. Murphy P., and Kolstø A.-B. (2000) Expression of the bZIP transcription factor TCF11 and its potential dimerization partners during development. Mech. Dev. 97, 141–148 10.1016/S0925-4773(00)00413-5 [DOI] [PubMed] [Google Scholar]
- 85. Etchevers H. C. (2005) The cap'n'collar family member NF-E2-related factor 3 (Nrf3) is expressed in mesodermal derivatives of the avian embryo. Int. J. Dev. Biol. 49, 363–367 10.1387/ijdb.041942he [DOI] [PubMed] [Google Scholar]
- 86. Hahn M. E., Timme-Laragy A. R., Karchner S. I., and Stegeman J. J. (2015) Nrf2 and Nrf2-related proteins in development and developmental toxicity: insights from studies in zebrafish (Danio rerio). Free Radic. Biol. Med. 88, 275–289 10.1016/j.freeradbiomed.2015.06.022 [DOI] [PMC free article] [PubMed] [Google Scholar]
- 87. Dennery P. A. (2010) Oxidative stress in development: nature or nurture? Free Radic. Biol. Med. 49, 1147–1151 10.1016/j.freeradbiomed.2010.07.011 [DOI] [PubMed] [Google Scholar]
- 88. Hahne F., and Ivanek R. (2016) Visualizing genomic data using gviz and bioconductor. In Statistical Genomics (Mathé E., and Davis S., eds) pp. 335–351, Humana Press, New York, NY: [DOI] [PubMed] [Google Scholar]
- 89. Kuosmanen S. M., Viitala S., Laitinen T., Peräkylä M., Pölönen P., Kansanen E., Leinonen H., Raju S., Wienecke-Baldacchino A., Närvänen A., Poso A., Heinäniemi M., Heikkinen S., and Levonen A. L. (2016) The effects of sequence variation on genome-wide NRF2 binding—new target genes and regulatory SNPs. Nucleic Acids Res. 44, 1760–1775 10.1093/nar/gkw052 [DOI] [PMC free article] [PubMed] [Google Scholar]
- 90. Chen A., Feldman M., Vershinin Z., and Levy D. (2016) SETD6 is a negative regulator of oxidative stress response. Biochim. Biophys. Acta 1859, 420–427 10.1016/j.bbagrm.2016.01.003 [DOI] [PubMed] [Google Scholar]
- 91. Livak K. J., and Schmittgen T. D. (2001) Analysis of relative gene expression data using real-time quantitative PCR and the 2− ΔΔCT method. Methods 25, 402–408 10.1006/meth.2001.1262 [DOI] [PubMed] [Google Scholar]
- 92. Quinlan A. R., and Hall I. M. (2010) BEDTools: a flexible suite of utilities for comparing genomic features. Bioinformatics 26, 841–842 10.1093/bioinformatics/btq033 [DOI] [PMC free article] [PubMed] [Google Scholar]
- 93. R Core Team (2018) R: A Language and Environment for Statistical Computing, R Foundation for Statistical Computing, Austria [Google Scholar]
- 94. Yu G., Wang L.-G., and He Q.-Y. (2015) ChIPseeker: an R/Bioconductor package for ChIP peak annotation, comparison and visualization. Bioinformatics 31, 2382–2383 10.1093/bioinformatics/btv145 [DOI] [PubMed] [Google Scholar]
Associated Data
This section collects any data citations, data availability statements, or supplementary materials included in this article.