The open-source software, DECA, provides comprehensive back-end analysis of HDX-MS data that addresses the recent recommendations for HDX-MS data analysis and presentation. It provides options for back-exchange correction and rigorous statistical analysis of the significance of differences in exchange.
Keywords: Biophysical methods, computer modeling, data evaluation, macromolecular complex analysis, molecular dynamics, protein structure, statistics, HDX-MS
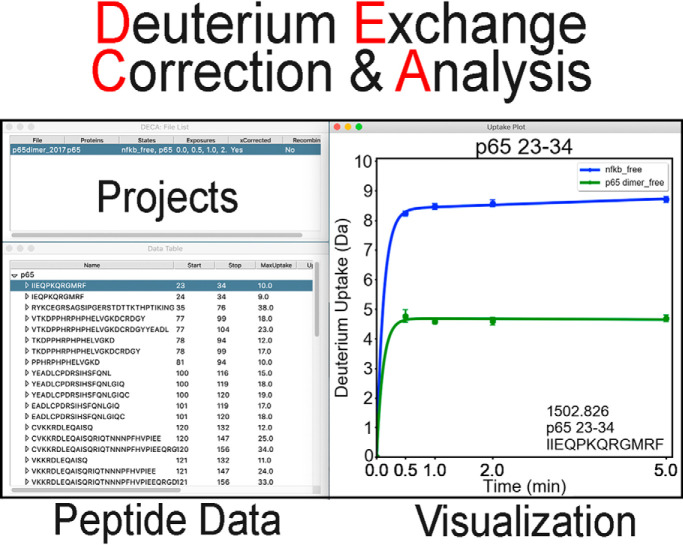
Graphical Abstract
Highlights
Open source software for comprehensive HDX-MS data analysis.
Automatic back-exchange correction options.
Rigorous statistical analysis of the significance of uptake differences.
High quality visualization tools.
Abstract
Amide hydrogen-deuterium exchange mass spectrometry (HDX-MS) has become widely popular for mapping protein-ligand interfaces, for understanding protein-protein interactions, and for discovering dynamic allostery. Several platforms are now available which provide large data sets of amide hydrogen/deuterium exchange mass spectrometry (HDX-MS) data. Although many of these platforms provide some down-stream processing, a comprehensive software that provides the most commonly used down-stream processing tools such as automatic back-exchange correction options, analysis of overlapping peptides, calculations of relative deuterium uptake into regions of the protein after such corrections, rigorous statistical analysis of the significance of uptake differences, and generation of high quality figures for data presentation is not yet available. Here we describe the Deuterium Exchange Correction and Analysis (DECA) software package, which provides all these downstream processing options for data from the most popular mass spectrometry platforms. The major functions of the software are demonstrated on sample data.
Hydrogen deuterium exchange mass spectrometry (HDX-MS)1 probes protein structure and dynamics by measuring amide proton exchange. HDX reports on solvent-accessible surface area, protein-protein interfaces, and allosteric changes, and the data can be used to constrain docking or homology modeling (1–4). Our group recently showed that HDX-MS experiments in which proteins are incubated in a deuterated solvent for seconds to minutes probe microsecond to millisecond motions in samples (5).
Two caveats limit HDX-MS analysis. First, HDX-MS resolution is limited to the length of observable peptides. Approaches to achieve single amino acid resolution with HDX-MS include using several proteases to increase peptide overlap (6), ETD fragmentation to better localize deuterons on each peptide (3, 7), and deconvolution of isotopic envelopes to extract information from the peptide data itself (8, 9). Second, HDX-MS suffers from deuterium back exchange during sample handling and chromatography. Several methods exist for the correction of back exchange, a necessary step for downstream data processing to obtain reproducible numbers of amides exchanged. Correction for back exchange has previously been performed using several different methods including internal standards or using fully deuterated control samples to determine the extent of uptake on each peptide (8, 10, 11).
To decongest complex mixtures of biomolecules, it is helpful to integrate ion mobility (IMS) and m/z data simultaneously (12, 13). IMS-integrated HDX-MS uniquely excels in the study of large, complex protein samples (14, 15). Waters pioneered IMS as a third dimension of resolution for HDX-MS experiments with the SYNAPT system and the Protein Lynx Global Server/DynamX software workflow. IMS provides a third independent piece of information with which to identify each peptide and markedly improves the accuracy of ion clustering and assignment of peptides from HDX-MS data (14).
As HDX-MS became more high-throughput, various efforts to automate aspects of the data analysis became available. HXExpress, a Microsoft Excel utility, was the first freely-available semi-automatic data analysis platform (16). This utility was further developed for deconvoluting overlapped peptide mass envelopes (17). Several automatic analysis platforms were developed beginning with The Deuterator and HD Desktop, which were further developed into HDX Workbench, a comprehensive fully automatic program that incorporates analysis of ETD fragments, isotopic fitting, overlapping peptide segmentation, statistical analysis, and data visualization (8). During this time, Schriemer's group developed Hydra (18), Mayer's group developed Hexicon (19), and Englander's group developed ExMS (9), all of which provide a similar list of functionalities. Realizing the need for more rigorous back-exchange correction, Z. Zhang developed MassAnalyzer, a fully-automated software that generated data in the form of protection factors (10). Two commercially available software programs were also developed, HD Examiner by Sierra Analytics and DynamX by Waters. These two software programs aptly demonstrate the two cultures that have grown out of the HDX-MS community; those researchers who desire a fully-automated platform such as that provided by HD Examiner and HDX Workbench versus those who wish to have some automation but with user-controlled examination of the raw data such as is provided by DynamX. Currently, only HD Examiner and DynamX allow import of IMS data. Several software programs also emerged that provided further data analysis once the initial centroid data was obtained. HDX Analyzer provides rigorous statistical analysis (20). MEMHDX (21) and Deuteros (22) allow downstream analysis of HDX Workbench and DynamX output data, providing further statistical analyses and data visualization. However, neither address back exchange analysis, which is missing from DynamX.
Here we present the Deuterium Exchange Correction and Analysis (DECA) software package, which was designed as a simple, rapid backend to DynamX, but can also be used for other data in .csv format. DECA provides several options for back exchange correction, resolution-increases by Overlapping Peptide Segmentation (OPS), a rigorous evaluation of the statistical significance of observed differences, and visualization tools. To our knowledge, DECA is the only freely-available software that provides all these functionalities in a single platform. In addition, DECA is able to extract detailed ion mobility, retention time, and deuterium uptake information from DynamX project files in order to measure the summary statistics of the ions assigned to each peptide, check the quality of the data through outlier analysis, and more accurately determine the statistical significance of differences between protein states than is possible with exported summary data. For data from other platforms which require back exchange correction and/or automatic analysis of overlapping peptides, DECA can be a helpful backend as well.
Here, we demonstrate the effectiveness of DECA on a representative HDX data set from DynamX and explain how it can be used for uptake data output files from other platforms. DECA is an initial attempt to provide software that will allow the HDX-MS community to comply with the recently published recommendations for performing, interpreting, and reporting HDX-MS experimental data. DECA is open-source with the intent that users will contribute additional functionalities and improvements.
MATERIALS AND METHODS
Software Design
DECA was written entirely in Python, and it implements modules from external libraries for visualization and analysis. The graphical interface implements the built-in Tkinter framework, and it was initially designed in PAGE, a Python GUI Generator. DECA performs statistical analysis of imported data by implementing functions from the Scipy and Statsmodels libraries (23). Curve fitting in deuterium uptake plots uses a linear regression function from the Scipy library. Uptake plots, coverage maps and spectra are generated through functions from the Matplotlib library (24). The retention time prediction feature implements a function from the Pyteomics library (25). The PyInstaller script is used to package all DECA code and python dependences into executable binaries for OSX and Windows (26). The packages used are PSF, BSD, GPL or Apache licensed (All free software licenses, with some share-alike copyleft restrictions). The DECA source-code is compatible with Python 2.7 and Python 3.7, which are freely available and pre-installed on UNIX operating systems. This source code is executable through the python environment upon the installation of the external libraries mentioned above. The source code and binaries are available at github.com/komiveslab/DECA.
Data Format
DECA primarily accepts tabular peptide lists of deuterium uptake data from CSV files. It was designed to import DynamX state data, HDXWorkbench data, and a third generic alternative. Sample data sets of each type are available in the supplementary information. Between the three data styles, DECA can import most tabular HDX-MS data with only minor alterations to the data set's column headers. For deeper statistical analysis and visualization of the raw spectra, a “.dnx” DynamX project file can be imported into DECA.
Data Analysis
Each data set imported is evaluated to identify high relative standard deviations or errors in peptide mass values, retention times, and ion mobility values. The statistical significance is determined for every time point between each protein state in the data set. If a DynamX project file is imported, DECA interrogates every ion assigned to each peptide in order to flag outlier ion assignments and report on the spread of m/z, retention time, and mobility values for each ion cluster.
Sample Data Set
HDXMS experiments were performed and published previously (27). The data set includes peptides of a single protein, RelA, in two states: the RelA homodimer and the RelA-p50 heterodimer. Deuterium exchange was measured in triplicate at 30 s, 1 min, 2 min, and 5 min. Independent biological replicates of the triplicate experiment were performed to verify the results. Peptides were identified using the Protein Lynx Global Server and analyzed in DynamX 3.0 taking advantage of the ion mobility data. The peptides were identified from triplicate MSE analyses and data were analyzed using PLGS 3.0 (Waters Corporation). Peptide masses were identified using a minimum number of 250 ion counts for low energy peptides and 50 ion counts for their fragment ions. The peptides identified in PLGS were then analyzed in DynamX 3.0 (Waters Corporation, Milford, MA) implementing a score cut-off of 7, the peptide must be present in at least 2 files, have at least 0.2 products per amino acid, a maximum MH+ error of 5 ppm, and less than a 5% error in the retention time. The relative deuterium uptake for each peptide was calculated by comparing the centroids of the mass envelopes of the deuterated samples versus the undeuterated controls following previously published methods (28) and corrected for back-exchange as previously described (29). The experiments were performed in triplicate, and independent replicates of the triplicate experiment were performed to verify the results.
Fitting of Deuterium Uptake Plots
A curve-fitting algorithm was implemented based on a least-squares minimization fit to the double-exponential function y = a*(1 − e−bt) + c*(1 − e−0.01t) to the HDX data. Constants a and b reflect the asymptote and rate of uptake by fast exchange, whereas constant c scales the contribution of uptake by slow exchange. If the timepoints do not cover the curvature of the first exponential, the minimization may overfit the data. In such cases, the first exponential is minimized so yt=1/4*n = 3/4*yt=n, where n is the lowest non-zero time point, to solve for the value of b that creates a curve that passes through the point at ¾ of the uptake in ¼ of the exposure of time point n. This curvature adjustment may be modified in the global settings. Constants a and c are subsequently minimized with the new b value to create a smooth curve to the first non-zero time point. Notably, in such scenarios where the data does not cover both sides of the inflection of the uptake curve, the curve fit does not reflect the rate of exchange of the peptide. DECA makes no attempt to extract the rates of exchange of individual amides from the peptide uptake curve. Such estimates are usually unreliable.
RESULTS
Graphical User Interface
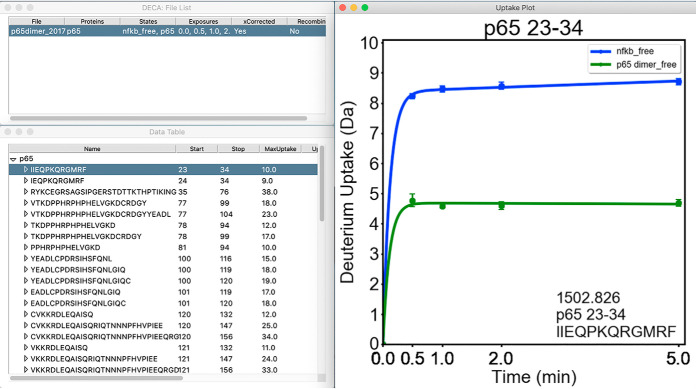
The DECA interface enables rapid review and visualization of HDXMS data (Fig. 1). From the main window, the user can import a data file, which will display the contents of the file in a spreadsheet and enable data correction and visualization functions. Deuterium uptake plots are displayed adjacent to the data table, whereas additional figures will be displayed in separate windows. Diagnostic messages and errors are printed to a console window that opens with the main interface.
Fig. 1.
Example of the DECA Interface. DECA is a Python program built to run on Windows and MacOS. The GUI simplifies import and analysis of HDX-MS data in multiple formats. Typically, data can be rapidly screened using the Main window (top left) lists open projects, the data table containing the peptide list and their uptake data for the selected project, and the uptake plot is shown for each selected peptide.
File Merging
HDX experiments from a single study may be analyzed separately because of gaps in time between the experiments, changes to the instrumental setup, or in order to reduce the computational demand. Because data sets may contain redundant or complimentary data, DECA may be used to intelligently merge data sets together by combining data or renaming proteins/states. Additionally, File Merge may be implemented either before or after performing back exchange correction on separate files in order to compare data sets with different levels of back exchange.
Back Exchange Correction
DECA is designed around solving the need to perform back exchange correction on hydrogen-deuterium exchange data before further processing or visualization. Two distinct forms of back exchange may influence deuterium uptake. Back exchange can occur from the quench to the point of sample injection into the mass spectrometer, and this can vary from peptide to peptide because of differences in retention time. The most accurate back exchange correction comes from the use of a fully deuterated control sample in order to calculate the level of back exchange for each peptide.
The second form of back exchange is a systematic time point-dependent difference resulting from different liquid handling procedures for shorter and longer times of deuterium exposures. When a LEAP robot is used for sample preparation, for timepoints shorter than 2 min the mixing syringes skip a step resulting in a slightly lower back exchange.
Back Exchange Correction is implemented in DECA with two settings: (1) a global correction factor or a fully-deuterated exposure correction factor per peptide, and (2) the Long Exposure Adjustment Patch, a set of exposure correction factors which are applied universally to every peptide in the data set. These two settings may be used separately or in tandem. Back exchange corrected data can be saved and reimported as desired.
Fig. 2 demonstrates the necessity for both forms of back exchange correction. A perceptible difference of nearly a half deuteron from the first non-zero time point to the final time point demonstrates clear time point-dependent back exchange. Following global back exchange correction, LEAP correction values should be obtained from the peptide with the greatest difference between the maximum observed uptake, in this case 3.5 Da at 30s, and the uptake at the final time point (or fully deuterated control). This should correspond to the peptide with the highest fractional uptake (typically a spiked-in control peptide or a peptide corresponding to a completely disordered region of the protein). The correction factors for timepoints longer than the time point with the highest exchange will be set to adjust the uptake to the highest exchange value. The correction factors for each time point shorter than that with the highest exchange will be set to keep their ratio to the maximum the same. These correction factors are then applied to all other peptides.
Fig. 2.
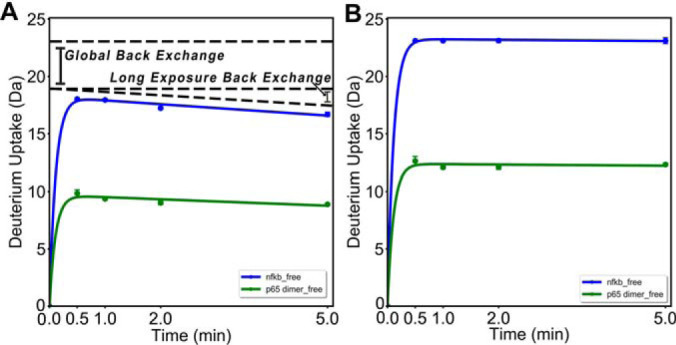
Global Back and Exposure Dependent Back Exchange Effects. A, HDX-MS data is affected by two forms of back exchange effects. This peptide should be fully exchanging in the state indicated by the blue line, yet at the longest exposure the uptake is only at ∼65% of the maximum uptake. This deficiency is the global back exchange observed. The greater back exchange at higher exposures is the result of systematic error introduced by the LEAP sample handling robot. B, After applying both the back exchange correction and the correction for systematic error introduced by the LEAP robot, the plot on the corrected plot is obtained.
Generation of Coverage Maps from Back-exchange Corrected Data
At this point, the heat map and uptake plots representing the complete data set can be rapidly generated in DECA. We recommend plotting the coverage map of all the final peptides for which data is analyzed and presented in the manuscript as also recommended recently by the HDXMS community (30). DECA provides additional functions allowing visualization of deuterium uptake, fractional uptake, standard deviation of uptake, or relative standard deviation of uptake, for all real peptides in the data set according to sequence position. The coverage maps reveal the sequence coverage as well as the redundancy or average number of peptides that cover each amino acid. Several colormaps are available to choose from, and the range of the color assignment can be manipulated to highlight features in the data set.
Generation of Publication-quality Deuterium Uptake Plots from Back-exchange Corrected Data
A key feature of DECA is the generation of deuterium uptake plots after back exchange correction (Fig. 2). Plots generated by DECA allow accurate comparison of deuterium uptake for different regions of a protein sequence, which requires prior correction of back exchange. The deuterium uptake plots generated by DECA show the deuterium-uptake for each peptide, with time on the x axis and deuterium uptake in Da on the y axis with the maximum corresponding to the maximum possible uptake. Publication quality deuterium uptake plots generated in DECA have various features such as automatic plotting of error bars, plot annotation with the peptide sequence and residue numbers, and options for data symbol types and colors. The data are most readily visualized by scrolling through the peptides viewing each uptake plot.
In the data set used as an example here, deuterium uptake into the RelA homodimer was compared with uptake into the RelA-p50 heterodimer. We wanted to compare the uptake into both RelA and p50 as well. These data were collected months apart and required file merging to present both the p50 uptake and the RelA uptake in a manner where they could be directly compared. This process, which took several weeks to be done manually took only one hour when done with DECA.
Comparison of Overlapping Peptides for Increased Resolution of Deuterium Uptake Data
DECA contains a feature called Overlapping Peptide Segmentation (OPS) which computationally increases the sequence resolution of the data. HDX-MS is limited by the size of peptides observable on a mass spectrometer, which usually is in the range of 10–30 amino acids. As a result, HDX data is spread over a large sequence range such that the uptake values may not always localize the exchange events effectively. Because of the use of nonspecific proteases for HDX-MS proteolysis, however, overlapping peptides are often produced. OPS exploits overlapping peptides to assign better-resolved uptake values to the non-overlapping regions in a manner similar to that previously described (31) (Fig. 3, Table I). This propagates error, however, and may lead to a mischaracterization of the data, so DECA implements this OPS only once per data set. In other words, the function may not be repeatedly applied to continue generating overlaps from overlap peptides until there are no new peptides being generated. HDX-MS analysis programs such as HDXWorkbench, HDsite and HRHDXMS offer similar features.
Fig. 3.
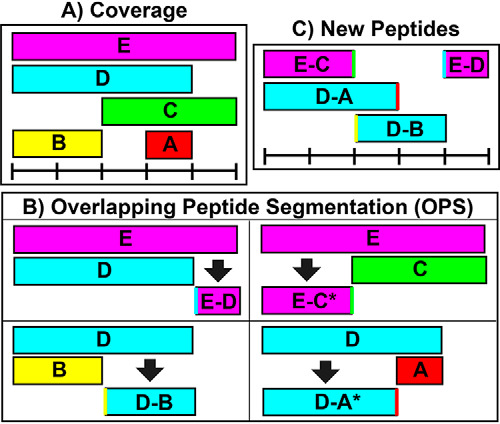
Overlapping peptide segmentation (OPS). Because of the partial specificity of “nonspecific” proteases like pepsin, the coverage resolution may be limited to longer peptide lengths. The resolution can be mathematically increased through Overlapping Peptide Segmentation (OPS). OPS takes advantage of peptide overlaps such as those in (A), where two peptides share exactly one terminus in common. B, shows how OPS uses such pairs to yield new peptides (C).
Table I. Overlapping peptide segmentation (OPS).
| Range | Uptake range | Sequence | Uptake | |
|---|---|---|---|---|
| Pep 1 | 1–16 | 2–16 | GAPVILMSTFYWNQDE | 8.78 |
| Pep 2 | 1–11 | 2–16 | GAPVILMSTFY | 6.32 |
| Pep 3 | 4–16 | 5–16 | VILMSTFYWNQDE | 7.89 |
| Pep1-Pep2a | 12–16 | 12–16 | WNQDE | 8.78–6.32 = 2.46 |
| Pep1-Pep3 | 1–3 | 2–4b | GAP | 8.78–7.89 = 0.89 |
aThe last two table entries are result peptides from the OPS analysis.
bWhen the new peptide contains the N-terminus, the resulting value may be affected by the need to disregard the N-terminal amino acid which is known to exchange rapidly.
Visualizing Highest Resolution Deuterium Exchange Data
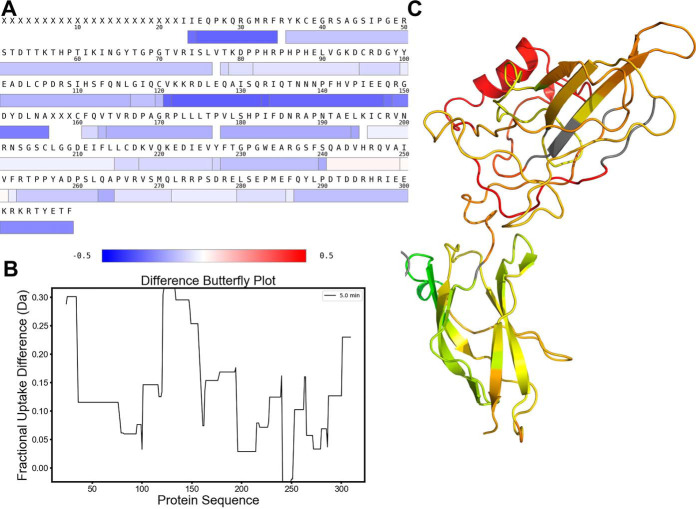
Heat maps, butterfly plots and pymol scripts for coloring 3D structures are generated in DECA using the highest resolution data at each residue by assigning the smallest peptide covering each amino acid to that position, including the OPS analysis, if performed (Fig. 4). The visualized data is subsequently taken from the assigned peptide at each position. Heat maps display data in the same format as coverage maps but with only a single value per residue instead of showing multiple peptides covering each position (Fig. 5A). Butterfly plots consist of two line plots for the comparison of two states (Fig. 5B). OPS can be used to isolate sites of deuterium uptake and visualize them in these types of plots.
Fig. 4.
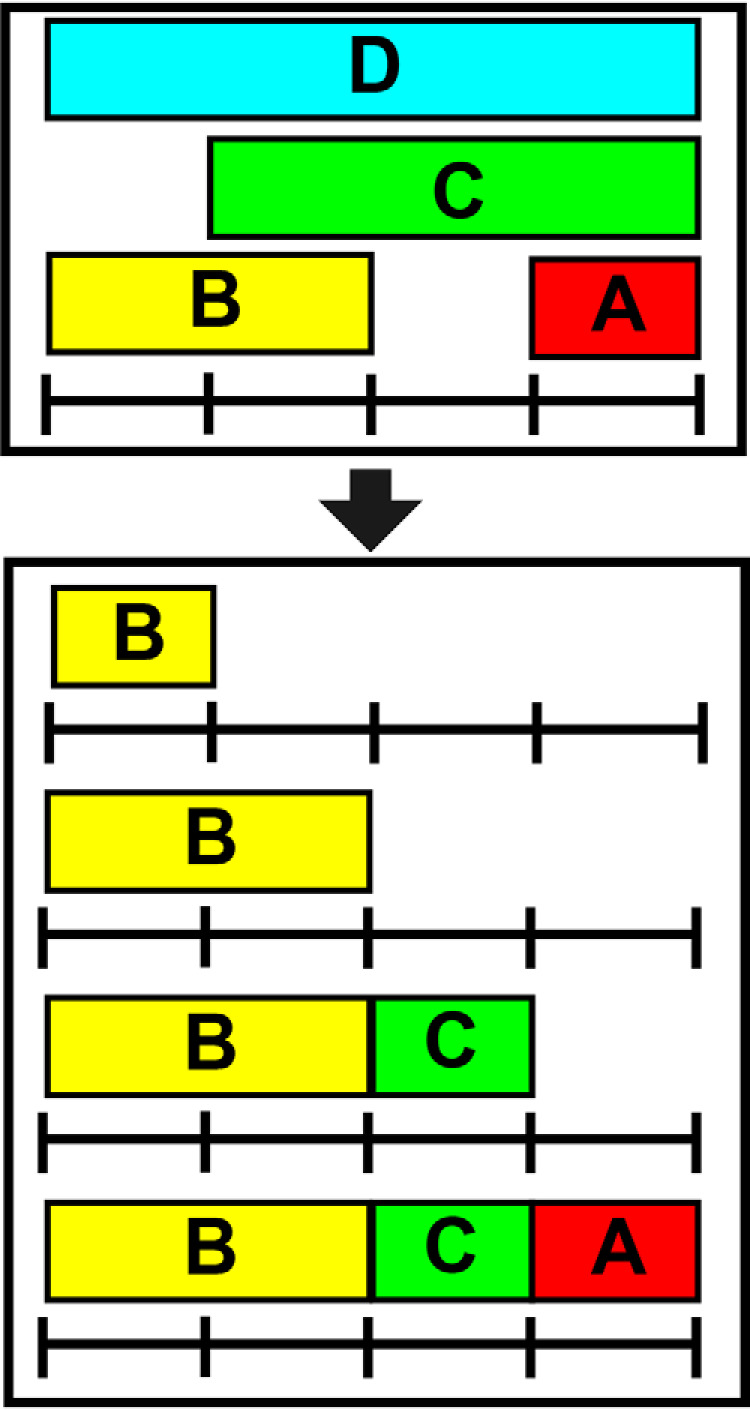
Peptide-to-Residue Assignment. In order to generate one-dimensional, residue-resolved data needed for heat maps, butterfly plots, and structure-coloring scripts, residues are assigned the data from the most representative (smallest) peptide covering that region of the protein.
Fig. 5.
Visualizing and Comparing Uptake Data. Several options for the visualization of HDX-MS data are provided in DECA. The full coverage map including uptake information may be generated, or, through Peptide-to-Residue assignment, the data can be displayed in one of the three formats shown above. Heat Maps (A), PyMOL coloring (B), and Butterfly Plots (C) can visualize fractional uptake differences between protein states.
The PyMOL Script function creates a script that can be imported into PyMOL to easily assign data values to the b factor of each residue of a protein structure. This script simultaneously assigns a color gradient and range to visualize the differences by replacing the b factor data column (Fig. 5C). Importantly, this feature implemented in DECA considers the back-exchange-corrected uptake amounts which is important for the colors to be comparable across the protein molecule.
Statistical Significance
DECA produces a report on the consistency and accuracy of ion assignments upon import of a DynamX project file. DECA flags outliers in each ion cluster and calculates the standard deviation of the m/z, retention time, and mobility values for every charge state and every replicate. In the example data sets, assigned ions were within 5% of the mean retention time and mean mobility per peptide. 93–98% of all assigned ions had a search error below 10 ppm. DECA makes such details accessible through the GUI in DECA or exported as a spreadsheet. The raw spectra can be visualized along m/z, retention time, and mobility dimensions in 2D or 3D plots to evaluate peak overlaps and the complexity of the data set.
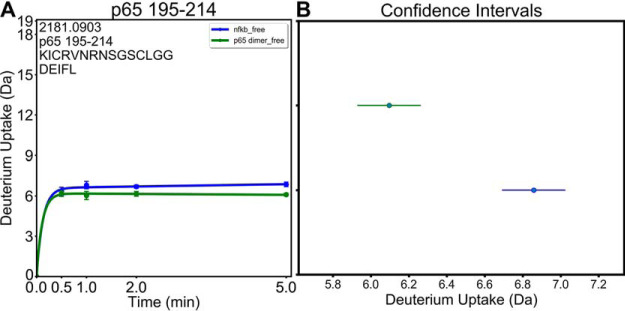
DECA can perform a series of tests to evaluate the statistical significance of differences observed between protein states, for example with or without ligand. For peptides from more than two states, DECA performs a Levene's test to ensure that the variance between the states is low enough to have confident results. This test is followed by a one-way ANOVA analysis to identify the presence of a statistical significance and a Tukey test on every combination of two states. For peptides with only two states, a t test is performed. These statistics are presented in the GUI and can be saved to a spreadsheet. Confidence intervals are plotted for each protein state with coloring matching the lines in the uptake plots. (Fig. 6).
Fig. 6.
Analysis of Variance Determines Significance. Analysis of Variance tests are implemented in DECA to identify statistically significant differences between deuterium uptake in each peptide from different protein states. A, Uptake plot for a peptide from two different states with a deuterium uptake difference of 0.76 Da at 5 min. A t test was used to determine that the difference is significant with a p value of 2.7 × 10⁻³. B, Confidence intervals can be calculated and plotted in DECA which illustrate the confident difference between the two states.
Data Export
DECA is designed to quickly generate consistent, publication-quality uptake plots that can be edited as desired by saving the plots in “.svg”, “.pdf”, or “.png” or “.tiff”formats. These plots can be exported individually or all at once.
Data merged or processed by back-exchange correction or peptide recombination may be saved into a comma-separated value (CSV) formatted spreadsheet mimicking an import format. Exported spreadsheets additionally contain information about any back-exchange correction performed on the data set which complies with community recommendations (28).
DISCUSSION
HDX-MS is a rapidly growing technique, yet back-exchange, noisy data, instrumental drift, and poor peptide resolution limit the information content of this type of data. Significant additions to the HDX-MS workflow over the last decade include back-exchange correction, analysis of overlapping peptides, and extraction of data from isotopic envelopes. Waters' DynamX uniquely enables the study of high complexity data sets that otherwise would be limited by spectral overlap through the implementation of ion mobility. Because IMS enables extension to much larger data sets, an automatic downstream data analysis tool is required to not only ascertain the statistical significance underlying large data sets but also to prepare back-exchange corrected uptake plots and PyMOL scripts in a seamless and rapid manner.
Here we present DECA, a feature-rich data analysis backend, that provides many of these functionalities in an open-source, cross-platform package. Although ion mobility enables the separation of otherwise-overlapping spectra, automatic processing of large data sets in DynamX can result in occasional incorrect assignments, and manual correction is time-consuming and can sometimes leave the incorrect assignments undetected. DECA performs statistical evaluation on DynamX assignments and implements well established back exchange correction as well as the Long Exposure Adjustment Patch, which corrects for systematic time point-dependent differences we have observed when the LEAP robot is used for sample preparation. DECA enables overlapping peptide analysis that has been previously implemented to take advantage of high redundancy and sequence coverage to generate virtual peptides with higher resolution. DECA can subsequently export the analyzed, filtered, and corrected data to a spreadsheet, or it can produce publication-ready visuals, including 2D and 3D spectra, deuterium uptake plots, coverage maps, heat maps, butterfly plots, and pymol scripts from the back-exchange corrected data.
DECA is developed entirely in Python and compiled into executable binaries compatible with macOS or Windows. DECA can also be run directly from the source code on any computer with Python installed, enabling developers to modify and improve the software. Both the source code and the executable files are available at https://github.com/komiveslab/DECA.
DATA AVAILABILITY
The sample data set raw files, DynamX project, and peptides list are available at the MassIVE repository (massive.ucsd.edu) under data set ID: MSV000084200.
Supplementary Material
Acknowledgments
We thank Dominic Narang for use of his previously published data.
Footnotes
* This work was supported by NSF MCB 1817774. No author has an actual or perceived conflict of interest with the contents of this article.
1 The abbreviations used are:
- HDX-MS
- hydrogen-deuterium exchange mass spectrometry
- DECA
- Deuterium Exchange Correction and Analysis
- OPS
- Overlapping Peptide Segmentation.
REFERENCES
- 1. Mandell, J. G., Falick, A. M., and Komives, E. A. (1998) Identification of protein-protein interfaces by decreased amide proton solvent accessibility. Proc. Natl. Acad. Sci. U.S.A. 95, 14705–14710 [DOI] [PMC free article] [PubMed] [Google Scholar]
- 2. Truhlar, S. M., Croy, C. H., Torpey, J. W., Koeppe, J. R., and Komives, E. A. (2006) Solvent accessibility of protein surfaces by amide H/2H exchange MALDI-TOF mass spectrometry. J. Am. Soc. Mass Spectrom. 17, 1490–1497 [DOI] [PubMed] [Google Scholar]
- 3. Rey, M., Sarpe, V., Burns, K. M., Buse, J., Baker, C. A., van Dijk, M., Wordeman, L., Bonvin, A. M., and Schriemer, D. C. (2014) Mass spec studio for integrative structural biology. Structure 22, 1538–1548 [DOI] [PMC free article] [PubMed] [Google Scholar]
- 4. Ramsey, K. M., Narang, D., and Komives, E. A. (2018) Prediction of the presence of a seventh ankyrin repeat in IkappaBepsilon from homology modeling combined with hydrogen-deuterium exchange mass spectrometry (HDX-MS). Protein Sci 27, 1624–1635 [DOI] [PMC free article] [PubMed] [Google Scholar]
- 5. Markwick, P., Peacock, R., and Komives, E. (2019) Accurate prediction of amide exchange in the fast limit reveals thrombin allostery. Biophys. J. 116, 49–56 [DOI] [PMC free article] [PubMed] [Google Scholar]
- 6. Kan, Z. Y., Walters, B. T., Mayne, L., and Englander, S. W. (2013) Protein hydrogen exchange at residue resolution by proteolytic fragmentation mass spectrometry analysis. Proc. Natl. Acad. Sci. U.S.A. 110, 16438–16443 [DOI] [PMC free article] [PubMed] [Google Scholar]
- 7. Zehl, M., Rand, K. D., Jensen, O. N., and Jorgensen, T. J. (2008) Electron transfer dissociation facilitates the measurement of deuterium incorporation into selectively labeled peptides with single residue resolution. J. Am. Chem. Soc. 130, 17453–17459 [DOI] [PubMed] [Google Scholar]
- 8. Pascal, B. D., Willis, S., Lauer, J. L., Landgraf, R. R., West, G. M., Marciano, D., Novick, S., Goswami, D., Chalmers, M. J., and Griffin, P. R. (2012) HDX workbench: software for the analysis of H/D exchange MS data. J. Am. Soc. Mass Spectrom. 23, 1512–1521 [DOI] [PMC free article] [PubMed] [Google Scholar]
- 9. Kan, Z. Y., Mayne, L., Chetty, P. S., and Englander, S. W. (2011) ExMS: data analysis for HX-MS experiments. J. Am. Soc. Mass Spectrom. 22, 1906–1915 [DOI] [PMC free article] [PubMed] [Google Scholar]
- 10. Zhang, Z., Zhang, A., and Xiao, G. (2012) Improved protein hydrogen/deuterium exchange mass spectrometry platform with fully automated data processing. Anal. Chem. 84, 4942–4949 [DOI] [PubMed] [Google Scholar]
- 11. Guttman, M., and Lee, K. K. (2016) Isotope labeling of biomolecules: structural analysis of viruses by HDX-MS. Methods Enzymol. 566, 405–426 [DOI] [PMC free article] [PubMed] [Google Scholar]
- 12. Henderson, S. C., Valentine, S. J., Counterman, A. E., and Clemmer, D. E. (1999) ESI/ion trap/ion mobility/time-of-flight mass spectrometry for rapid and sensitive analysis of biomolecular mixtures. Anal. Chem. 71, 291–301 [DOI] [PubMed] [Google Scholar]
- 13. Kanu, A. B., Dwivedi, P., Tam, M., Matz, L., and Hill, H. H., Jr. (2008) Ion mobility-mass spectrometry. J. Mass Spectrom. 43, 1–22 [DOI] [PubMed] [Google Scholar]
- 14. Iacob, R. E., Murphy, J. P., 3rd, and Engen, J. R. (2008) Ion mobility adds an additional dimension to mass spectrometric analysis of solution-phase hydrogen/deuterium exchange. Rapid Commun. Mass Spectrom. 22, 2898–2904 [DOI] [PMC free article] [PubMed] [Google Scholar]
- 15. Rand, K. D., Pringle, S. D., Murphy, J. P., Fadgen, K. E., Brown, J., and Engen, J. R. (2009) Gas-phase hydrogen/deuterium exchange in a travelling wave ion guide for the examination of protein conformations. Anal. Chem. 81, 10019–10028 [DOI] [PMC free article] [PubMed] [Google Scholar]
- 16. Weis, D. D., Engen, J. R., and Kass, I. J. (2006) Semi-automated data processing of hydrogen exchange mass spectra using HX-Express. J. Am. Soc. Mass Spectrom. 17, 1700–1703 [DOI] [PubMed] [Google Scholar]
- 17. Guttman, M., Weis, D. D., Engen, J. R., and Lee, K. K. (2013) Analysis of overlapped and noisy hydrogen/deuterium exchange mass spectra. J. Am. Soc. Mass Spectrom. 24, 1906–1912 [DOI] [PMC free article] [PubMed] [Google Scholar]
- 18. Slysz, G. W., Baker, C. A., Bozsa, B. M., Dang, A., Percy, A. J., Bennett, M., and Schriemer, D. C. (2009) Hydra: software for tailored processing of H/D exchange data from MS or tandem MS analyses. BMC Bioinformatics 10, 162. [DOI] [PMC free article] [PubMed] [Google Scholar]
- 19. Lou, X., Kirchner, M., Renard, B. Y., Kothe, U., Boppel, S., Graf, C., Lee, C. T., Steen, J. A., Steen, H., Mayer, M. P., and Hamprecht, F. A. (2010) Deuteration distribution estimation with improved sequence coverage for HX/MS experiments. Bioinformatics 26, 1535–1541 [DOI] [PubMed] [Google Scholar]
- 20. Liu, S., Liu, L., Uzuner, U., Zhou, X., Gu, M., Shi, W., Zhang, Y., Dai, S. Y., and Yuan, J. S. (2011) HDX-analyzer: a novel package for statistical analysis of protein structure dynamics. BMC Bioinformatics. 12, S43. [DOI] [PMC free article] [PubMed] [Google Scholar]
- 21. Hourdel, V., Volant, S., O'Brien, D. P., Chenal, A., Chamot-Rooke, J., Dillies, M. A., and Brier, S. (2016) MEMHDX: an interactive tool to expedite the statistical validation and visualization of large HDX-MS data sets. Bioinformatics 32, 3413–3419 [DOI] [PMC free article] [PubMed] [Google Scholar]
- 22. Lau, A. M. C., Ahdash, Z., Martens, C., and Politis, A. (2019) Deuteros: software for rapid analysis and visualization of data from differential hydrogen deuterium exchange-mass spectrometry. Bioinformatics 35, 3171–3173 [DOI] [PMC free article] [PubMed] [Google Scholar]
- 23. Jones, E., Oliphant, T., and Peterson, P. (2001) SciPy: open source scientific tools for python. https://www.scipy.org/
- 24. Hunter, J. D. (2007) Matplotlib: A 2D graphics environment. Comput. Sci. Engineering 9, 90–95 [Google Scholar]
- 25. Goloborodko, A. A., Levitsky, L. I., Ivanov, M. V., and Gorshkov, M. V. (2013) Pyteomics–a Python framework for exploratory data analysis and rapid software prototyping in proteomics. J. Am. Soc. Mass Spectrom. 24, 301–304 [DOI] [PubMed] [Google Scholar]
- 26. Cortesi, D. (2018) PyInstaller. http://www.pyinstaller.org/
- 27. Narang, D., Chen, W., Ricci, C. G., and Komives, E. A. (2018) RelA-Containing NFkappaB Dimers Have Strikingly Different DNA-Binding Cavities in the Absence of DNA. J. Mol. Biol. 430, 1510–1520 [DOI] [PMC free article] [PubMed] [Google Scholar]
- 28. Wales, T. E., Fadgen, K. E., Gerhardt, G. C., and Engen, J. R. (2008) High-Speed and High-Resolution UPLC Separation at Zero Degrees Celsius. Anal. Chem. 80, 6815–6820 [DOI] [PMC free article] [PubMed] [Google Scholar]
- 29. Ramsey KM, Dembinski HE, Chen W, Ricci CG, Komives, EA (2017) DNA and IKBα Both Induce Long-Range Conformational Changes in NFKB. J. Mol. Biol. 429, 999–1008 [DOI] [PMC free article] [PubMed] [Google Scholar]
- 30. Masson, G. R., Burke, J. E., Ahn, N. G., Anand, G. S., Borchers, C., Brier, S., Bou-Assaf, G. M., Engen, J. R., Englander, S. W., Faber, J., Garlish, R., Griffin, P. R., Gross, M. L., Guttman, M., Hamuro, Y., Heck, A. J. R., Houde, D., Iacob, R. E., Jørgensen, T. J. D., Kaltashov, I. A., Klinman, J. P., Konermann, L., Man, P., Mayne, L., Pascal, B. D., Reichmann, D., Skehel, M., Snijder, J., Strutzenberg, T. S., Underbakke, E. S., Wagner, C., Wales, T. E., Walters, B. T., Weis, D. D., Wilson, D. J., Wintrode, P. L., Zhang, Z., Zheng, J., Schriemer, D. C., and Rand, K. D. (2019) Recommendations for performing, interpreting and reporting hydrogen deuterium exchange mass spectrometry (HDX-MS) experiments. Nat. Methods 16, 595–602 [DOI] [PMC free article] [PubMed] [Google Scholar]
- 31. Del Mar, C., Greenbaum, E. A., Mayne, L., Englander, S. W., and Woods, V. L. J. (2005) Structure and properties of alpha-synuclein and other amyloids determined at the amino acid level. Proc. Natl. Acad. Sci. U.S.A. 102, 15477–15482 [DOI] [PMC free article] [PubMed] [Google Scholar]
Associated Data
This section collects any data citations, data availability statements, or supplementary materials included in this article.
Supplementary Materials
Data Availability Statement
The sample data set raw files, DynamX project, and peptides list are available at the MassIVE repository (massive.ucsd.edu) under data set ID: MSV000084200.


