Abstract
Long non‐coding RNAs (lncRNAs) are critical regulators in cancer. However, the involvement of lncRNAs in TGF‐β‐regulated tumorigenicity is still unclear. Here, we identify TGF‐β‐activated lncRNA LINC00115 as a critical regulator of glioma stem‐like cell (GSC) self‐renewal and tumorigenicity. LINC00115 is upregulated by TGF‐β, acts as a miRNA sponge, and upregulates ZEB1 by competitively binding of miR‐200s, thereby enhancing ZEB1 signaling and GSC self‐renewal. LINC00115 also promotes ZNF596 transcription by preventing binding of miR‐200s to the 5′‐UTR of ZNF596, resulting in augmented ZNF596/EZH2/STAT3 signaling and GBM tumor growth. Inhibition of EZH2 by genetic approaches or a small molecular inhibitor markedly suppresses LINC00115‐driven GSC self‐renewal and tumorigenicity. Moreover, LINC00115 is highly expressed in GBM, and LINC00115 expression or correlated co‐expression with ZEB1 or ZNF596 is prognostic for clinical GBM survival. Our work defines a critical role of LINC00115 in GSC self‐renewal and tumorigenicity, and suggests LINC00115 as a potential target for GBM treatment.
Keywords: EZH2, glioma stem‐like cell, lncRNA LINC00115, ZEB1, ZNF596
Subject Categories: Cancer, RNA Biology, Regenerative Medicine
The TGF‐β signaling pathway is critical for glioblastoma tumorigenicity. TGF‐β‐upregulated lncRNA LINC00115 acts as a miR‐200 sponge to maintain the self‐renewal capacity and tumorigenicity of glioma stem‐like cells.

Introduction
Glioblastoma (GBM) is the most common and lethal primary brain tumor in adults 1. Despite tremendous efforts to treat GBM, the median overall survival is still < 2 years after diagnosis 1, 2, 3. Accumulated evidence has shown that glioblastoma stem‐like cells (GSCs) facilitate tumorigenesis, radioresistance, chemoresistance, and recurrence 4, 5, 6, 7. However, the mechanism by which GSC tumorigenicity and self‐renewal are maintained is still unclear.
Transforming growth factor β (TGF‐β) is a multifunctional cytokine and plays important functions in regulating GBM progression and GSC self‐renewal 8, 9, 10, 11. High TGF‐β activity confers poor prognosis in glioma patients 12. TGF‐β1 promotes the self‐renewal of glioma‐initiating cells (GICs) through induction of LIF or Sox2 13, 14, and inhibition of TGF‐β activity decreases the CD44high/ID1high GIC population through inhibition of ID1 and ID3 11.
microRNAs (miRNAs) are small (20–22 nucleotides long) non‐coding RNAs (ncRNAs) that have been recognized to play important roles in development and cancer 15. Long non‐coding RNAs (lncRNAs) are a class of more than 200‐nucleotide ncRNAs that are a relatively abundant component of the mammalian transcriptome 16, 17. lncRNAs play diverse functions such as remodeling chromatin and genome architecture and regulating RNA stabilization 18. Moreover, lncRNAs function as miRNA sponges to inhibit miRNA activity 15. Dysregulation of lncRNAs has been linked to the control of tumorigenicity in cancers, including glioma as miRNA sponges 7, 19, 20, 21, 22, 23. Although the roles of lncRNAs and the underlying mechanisms in glioblastoma tumorigenesis have been reported, more specific mechanisms of lncRNAs in the maintenance of GSC tumorigenicity and self‐renewal need to be further teased out.
In this study, we performed RNA‐Seq analysis in GSCs and identified long intergenic non‐protein‐coding RNA 115 (LINC00115) as a highly activated lncRNA by TGF‐β1. We then assessed the roles of LINC00115 in GSC self‐renewal and tumorigenicity using cell culture and orthotopic xenograft models. Finally, we determined the mechanism by which LINC00115 regulates GSC self‐renewal and tumorigenicity.
Results
lncRNA LINC00115 is upregulated by TGF‐β1 in GSCs and is clinically relevant in GBM
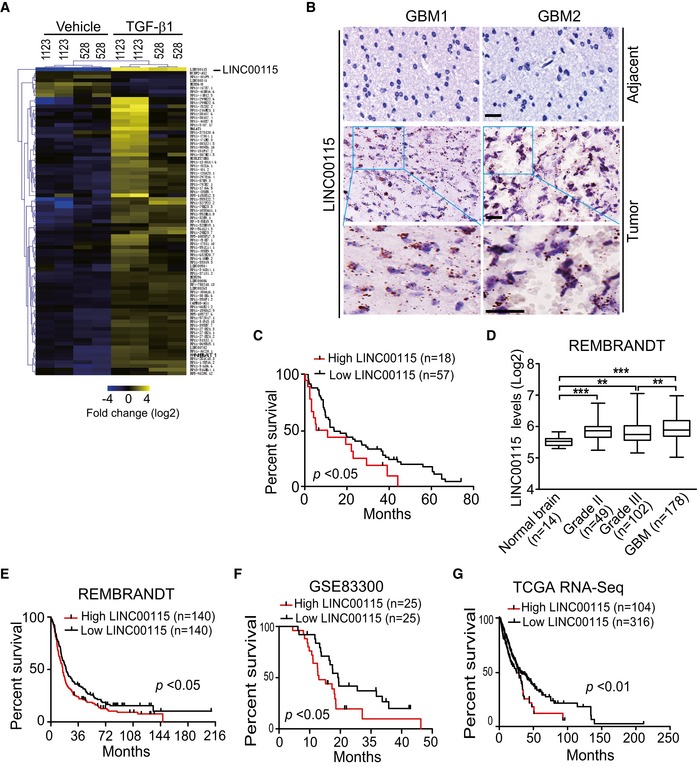
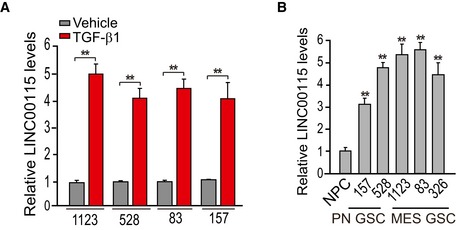
To identify lncRNAs that are induced by TGF‐β and mediate the role of TGF‐β in GSC tumorigenicity and self‐renewal, mesenchymal‐like (MES) 1123 and proneural‐like (PN) 528 GSCs were pre‐cultured for 16 h in DMEM/F12 medium with EGF (2 ng/ml) and bFGF (2 ng/ml) and then followed by co‐culturing with or without TGF‐β1 (20 μg/ml) for various times (Fig EV1). We found TGF‐β1‐induced higher levels of SMAD2 phosphorylation (p‐SMAD2) and a TGF‐β1 signaling downstream effector, inhibitor of DNA‐binding protein 1 (ID1) protein expression at 3 h compared with those at 0‐, 0.5‐, or 8‐h time points (Fig EV1). Thus, we performed RNA‐Seq transcriptome analysis to compare lncRNA expression levels treated with or without TGF‐β1 for 3 h in GSCs. Differential gene expression analysis identified 79 lncRNAs induced or repressed in both 1123 and 528 GSCs (false discovery rate < 0.05 and a folder change > 2) (Fig 1A). Among lncRNAs, LINC00115 is one of the top differentially expressed TGF‐β1‐induced genes (Fig 1A). To validate the RNA‐Seq results, we performed qRT–PCR analysis of LINC00115 expression, and the qRT–PCR data validated the results attained from RNA‐Seq analysis in 1123, 528, 83, and 157 GSCs (Fig EV2A). We also determined LINC00115 expression in neural progenitors (NPCs), and PN‐ and MES‐like GSCs 24, and found that LINC00115 was expressed relatively high levels in PN and MES GSCs compared with NPCs (Fig EV2B).
Figure EV1. TGF‐β activated SMAD2 phosphorylation and ID1 expression in GSCs.
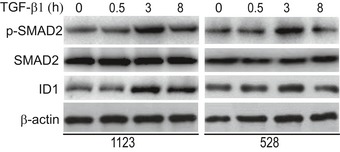
Western blotting of TGF‐β‐activated SMAD2 phosphorylation and ID1 expression in GSCs. 1123 and 528 GSCs were pre‐cultured for 16 h in DMEM/F12 medium with EGF (2 ng/ml) and bFGF (2 ng/ml) and then followed by co‐culturing with or without 20‐μg/ml TGF‐β1 for the indicated times. Data are representative of three independent experiments.
Figure 1. lncRNA LINC00115 is upregulated by TGF‐β1 in GSCs and is clinically relevant in GBM .
-
AHeatmap of RNA‐Seq analysis of differentially expressed lncRNAs (≥ 2‐fold change and FDR < 0.05) in mesenchymal (MES) 1123 and proneural (PN) 528 GSCs. GSCs were pre‐cultured for 16 h in DMEM/F12 medium with EGF (2 ng/ml) and bFGF (2 ng/ml) and then followed by co‐culturing with or without 20‐μg/ml TGF‐β1 for 3 h.
-
BRepresentative images of LINC00115 expression in clinical GBM tumors and adjacent tissue using RNAscope analysis. Images are representative of two independent experiments. Scale bars: 50 μm.
-
CKaplan–Meier analysis of patients with high versus low LINC00115‐expressing GBM tumors from (B). Median survival (in months): low, 13.9; high, 8.1. Black bars, censored data.
-
DExpression levels of LINC00115 are higher in LGG (low‐grade gliomas) versus normal brain tissues and GBM versus LGG. Expression data of LINC00115 were downloaded from the REMBRANDT dataset. Data are presented as mean ± SEM. **P < 0.01, ***P < 0.001, by two‐tailed t‐test.
-
E–GKaplan–Meier analysis of patients with high versus low LINC00115‐expressing grade III and GBM tumors from the REMBRANDT (E) or the TCGA (G) 26, and GBM from GSE83300 50 (F) datasets. Median survival (in months) in (E): low, 20.2; high, 15.9; in (F): low, 19.4; high, 13.0; in (G): low, 33.2; high, 25.4. Black bars, censored data.
Figure EV2. qRT–PCR analysis of LINC00115 expression in GSCs.
-
AqRT–PCR analysis of LINC00115 expression in 1123, 528, 83, and 157 GSCs stimulated with or without TGF‐β for 3 h.
-
BqRT–PCR analysis of LINC00115 expression in NPCs, PN, and MES GSCs.
To further validate the pathologic and clinical significance of LINC00115 expression in glioblastoma, we detected and compared LINC00115 expression by in situ hybridization using RNAscope analysis 25 in 75 paraffin‐embedded GBM and adjacent tissues. LINC00115 expression was higher in GBM tumors than in adjacent tissues (Fig 1B). Kaplan–Meier survival analysis showed that GBM patients with high LINC00115 expression had a worse prognosis compared with those with low LINC00115 expression (Fig 1C).
To support our findings, we downloaded REMBRANDT dataset (http://www.betastasis.com) and examined the expression level of LINC00115 in GBM, low‐grade glioma (LGG, WHO grade II and grade III), and normal brain tissue controls included in this dataset. As shown in Fig 1D, compared with normal brain tissues, the expression levels of LINC00115 were significantly elevated in GBM and LGG. Moreover, LINC00115 level was higher in GBM than that in LGG gliomas (Fig 1D). Segregating patients in the REMBRANDT (WHO grade III and GBM tumors) and GSE83300 (GBM tumors) datasets by LINC00115 expression revealed a statistically significant worse prognosis for patients with high LINC00115 (> median level) compared with those with low levels of LINC00115 (< median level) (Fig 1E and F). The median patient survival times of these patients were 15.9 and 20.2 months in REMBRANDT, and 13.0 and 19.4 months in GSE83300 dataset, respectively. In the TCGA RNA‐Seq (WHO grade III and GBM tumors) dataset 26, patients with high LINC00115 expression (upper quartile) also had a statistically significant poor prognosis (Fig 1G). These data suggested that LINC00115 is highly expressed in GBM and its expression is putatively correlated with glioma patient survival.
LINC00115 is important for GSC growth, neuro‐like sphere formation, and tumorigenicity
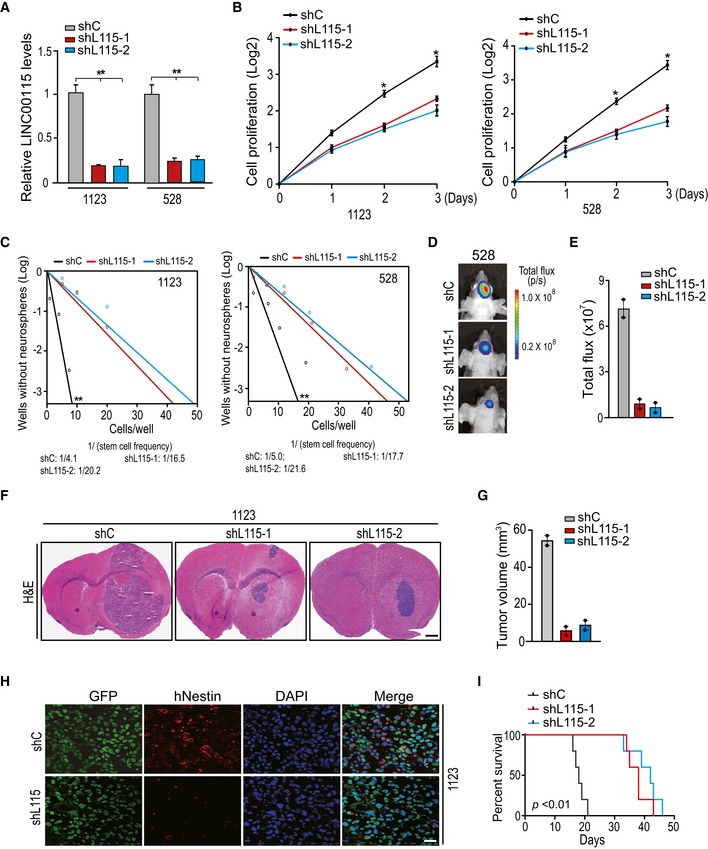
To demonstrate the role of LINC00115 in GSC tumorigenicity and self‐renewal, we used two different lentiviral‐mediated short hairpin RNAs (shRNAs) targeting LINC00115 or a non‐silencing control to deplete LINC00115 in 1123 and 528 GSCs. shRNA knockdown of endogenous LINC00115 markedly inhibited GSC proliferation (Fig 2A and B) and neuro‐like sphere formation (Fig 2C) in vitro.
Figure 2. LINC00115 is important for GSC growth, neuro‐like sphere‐forming frequency, and tumorigenicity.
-
AqRT–PCR analysis of LINC00115 knockdown using two different shRNAs, shL115‐1 and shL115‐2 in 1123 and 528 GSCs.
-
B, CEffects of LINC00115 knockdown on GSC proliferation (B) and neuro‐like sphere formation (C).
-
DRepresentative bioluminescence images of brains with indicated 528 GSC tumor xenografts expressing shC, shL115‐1, or shL115‐2 at 45 days after implantation. Images represent the results of five mice per group of two independent experiments.
-
EQuantification of the bioluminescence activity in (D).
-
FRepresentative hematoxylin and eosin (H&E)‐stained images of mouse brain sections with GSC1123 xenografts expressing shC, shL115‐1, or shL115‐2. Images represent the results of five mice per group of two independent experiments. Scale bars: 1 mm.
-
GQuantification of tumor volume in (F).
-
HImmunofluorescence (IF) analysis of Nestin expression in 1123 GSC control and LINC00115 knockdown xenograft tumors from (F). Images are representative of two independent experiments. Scale bars: 50 μm.
-
IKaplan–Meier analysis of animal implantation with 1123/shC, 1123/shL115‐1, or 1123/shL115‐2 GSCs. n = 10.
To further determine whether LINC00115 is critical for GSC tumorigenicity, 528 and 1123 GSCs transduced with shLINC00115‐1 (shL115‐1), shLINC00115‐2 (shL115‐2), or control shRNA (shC) were separately implanted intracranially into the brains of animals. The effects of LINC00115 depletion on GSC tumorigenicity were then assessed. Compared with the control xenograft models, knockdown of LINC00115 significantly reduced glioma tumor growth (Fig 2D–G) and human Nestin expression in GSC tumor xenografts (Fig 2H). Moreover, LINC00115 knockdown significantly prolonged the survival of animals compared with those in the control group (Fig 2I). These data support that LINC00115 is required for GSC growth, neuro‐like sphere formation, and tumorigenicity.
LINC00115 physically associates with miR‐200s
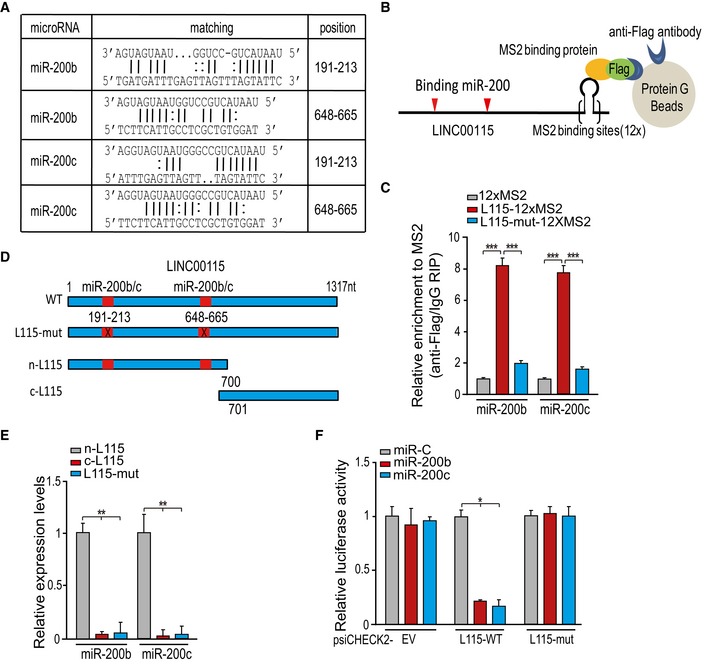
Considerable numbers of lncRNAs have been described as sequesters of endogenous RNA molecules by competitively binding miRNAs 27. To investigate molecular mechanisms for LINC00115 in GSC tumorigenicity, we searched the potential LINC00115‐binding miRNAs using the DIANA‐LncBase 28 (http://omictools.com/diana-lncbase-tool) and RNAhybrid 29 (https://bibiserv2.cebitec.uni-bielefeld.de/rnahybrid) prediction algorithms. We identified two potential miR‐200b and miR‐200c targeting sites in the 5′ sequence of LINC00115 (Fig 3A), thereby suggesting that LINC00115 has a strong potential to competitively bind miR‐200s.
Figure 3. LINC00115 physically associates with miR‐200s.
-
AThe prediction for miR‐200 binding sites in the LINC00115 transcript sequence.
-
B, CMS2‐RIP followed by qRT–PCR analysis of endogenous microRNA association with LINC00115. 12XMS2 empty vector, LINC00115‐12XMS2, or LINC00115‐mut‐12XMS2 with Flag‐tagged MS2 was co‐transfected into 1123 GSCs.
-
DSchematics of the predicted binding sites of miR‐200s on LINC00115 and LINC00115 mutants.
-
ERNA pull‐down and qRT–PCR assays of LINC00115 binding with miR‐200s. GSC1123 cell lysates were incubated with biotin‐labeled LINC00115.
-
FLuciferase activity analysis of 1123 GSCs co‐transfected with miR‐200s and luciferase reporters containing LINC00115 WT, mutant, or empty vector (EV).
To validate whether LINC00115 directly associates with miR‐200s, we performed RNA immunoprecipitation (RIP) analysis using a Flag‐MS2bp‐MS2bs system (Fig 3B) and qPCR assay to analyze endogenous miRNA association with LINC00115. When compared with a 12XMS empty vector control, LINC00115 wild type (WT) (LINC00115‐12XMS2), but not miR‐200‐binding deficient mutant [LINC00115‐mut (miR‐200)‐12XMS2], strongly associated with miR‐200b and miR‐200c (Fig 3C). The interaction between LINC00115 and miR‐200s was further assessed by affinity pull‐down analysis using in vitro‐transcribed biotin‐labeled LINC00115. A shown in Fig 3D and E, miR‐200b and miR‐200c bound with n‐LINC00115 mutant (n‐L115) but not c‐LINC00115 (c‐L115) or LINC00115‐mut (L115‐mut) mutant. To further support our observations, we constructed luciferase reporters containing the full length of LINC00115 WT and miR‐200‐binding deficient mutant. When compared with the control microRNA (miR‐C), exogenous expression of miR‐200b or miR‐200c reduced the luciferase activities of LINC00115 WT reporter but not an empty vector (EV) or the mutant reporter (Fig 3F). Taken together, our data support that LINC00115 physically associates with miR‐200s, and could competitively antagonize miR‐200 function.
LINC00115 upregulates ZEB1 signaling and GSC self‐renewal through competitively binding miR‐200s
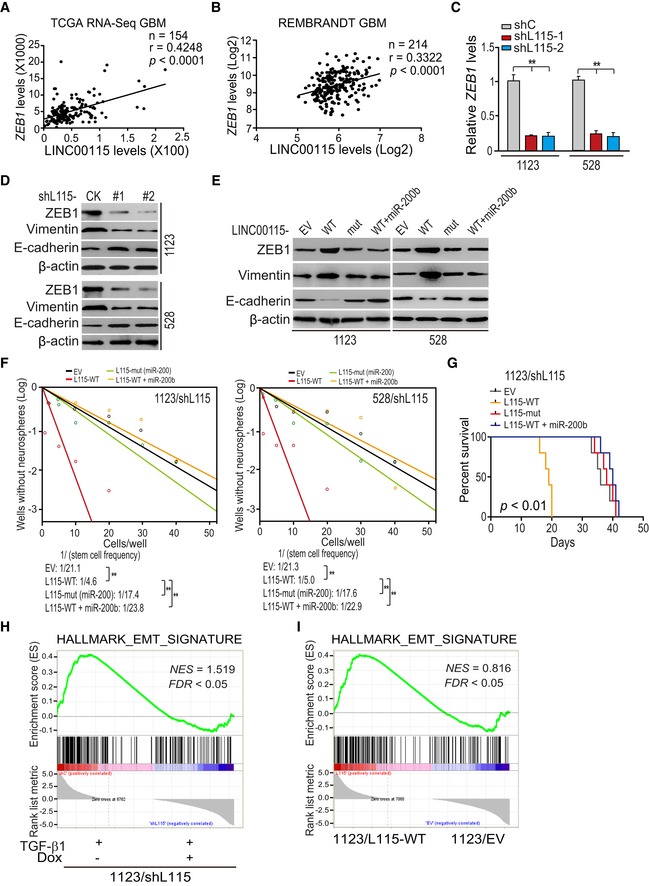
We and others have previously reported that ZEB1‐miR‐200 feedback loop regulates epithelial–mesenchymal transition (EMT) and tumor stem cell self‐renewal 30, 31, 32. Thus, we tested whether LINC00115 activates ZEB1 signaling to regulate GSC self‐renewal. Firstly, correlation assays using the TCGA GBM RNA‐Seq and REMBRANDT GBM array datasets revealed that LINC00115 and ZEB1 were significantly co‐expressed in these two cohorts of clinical GBM (Fig 4A and B) and LGG from TCGA RNA‐Seq but not REMBRANDT array datasets (Fig EV3A and B). Then, shRNA knockdown of LINC00115 reduced expressions of ZEB1 mRNA (Fig 4C) and protein (Fig 4D) in 1123 and 528 GSCs. Moreover, LINC00115 knockdown also inhibited the expression of vimentin, a known ZEB1 downstream target, and increased E‐cadherin expression (Fig 4D). Compared with the empty vector control, re‐expression of shRNA‐resistant LINC00115 WT but not the miR‐200‐binding deficient mutant (Appendix Fig S1) rescued shRNA knockdown‐inhibited ZEB1 and vimentin expression (Fig 4E), as well as neuro‐like sphere formation (Fig 4F) in vitro. Conversely, the re‐expression of shRNA‐resistant LINC00115 decreased shRNA knockdown‐upregulated E‐cadherin expression (Fig 4E). Overexpression of miR‐200b impaired the effects of re‐expression of shRNA‐resistant LINC00115 WT (Fig 4E and F). These data demonstrate that LINC00115 upregulates ZEB1 signaling by competitively binding miR‐200s in GSCs.
Figure 4. LINC00115 upregulates ZEB1 signaling and promotes GSC self‐renewal through competitively binding miR‐200s.
-
A, BCorrelation of expression between LINC00115 and ZEB1 from TCGA GBM RNA‐Seq dataset (A) and REMBRANDT GBM array dataset (B). ***P < 0.001, by two‐tailed t‐test.
-
CLINC00115 knockdown reduced ZEB1 mRNA expression in 1123 and 528 GSCs.
-
DEffects of LINC00115 knockdown on ZEB1, vimentin, and E‐cadherin protein expression.
-
EEffects of re‐expression of shRNA‐resistant LINC00115 WT (L115‐WT), and miR‐200‐binding mutant (L115‐mut) with or without miR‐200b on ZEB1 signaling activation.
-
FNeuro‐like sphere formation assay of effects of re‐expression of shRNA‐resistant LINC00115 WT and mutant with or without miR‐200b.
-
GKaplan–Meier analysis of animal implantation with 1123 GSCs with indicated modifications. n = 10. Statistical analysis was performed by log‐rank test.
-
H, IGSEA of EMT signature genes using ranked gene expression changes in TGF‐β1‐treated 1123/shLINC00115 GSCs versus the control (H) or in 1123 GSCs with ectopic expression of LINC00115 or an empty vector (EV) (I). NES, normalized enrichment score.
Figure EV3. Correlation of expression between LINC00115 and ZEB1 in grade II‐III glioma specimens.
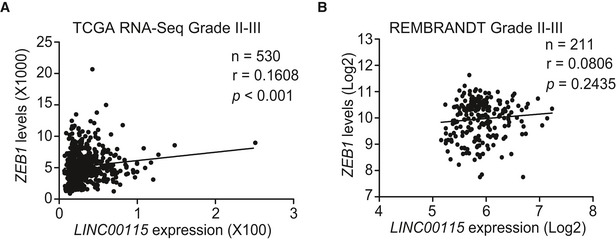
Corresponding to Fig 4A and B. Correlation of expression between LINC00115 and ZEB1 in grade II‐III glioma specimens from TCGA RNA‐Seq (A) and REMBRANDT array dataset (B). Statistical analysis was performed by two‐tailed t‐test.
We further assessed the effects of re‐expression of shRNA‐resistant LINC00115 WT, mutant, and WT together with miR‐200b on GSC tumor growth, and expression of ZEB1 and its downstream factors in vivo. Re‐expression of shRNA‐resistant LINC00115 WT but not its mutant abrogated shRNA knockdown‐prolonged animal survival (Fig 4G), restored shRNA knockdown‐inhibited expression of ZEB1 and vimentin, and reduced shRNA knockdown‐enhanced E‐cadherin expression in vivo (Appendix Fig S2). However, the expression of miR‐200b reversed the effects from exogenously expressed shRNA‐resistant WT LINC00115 (Fig 4G, and Appendix Fig S2) in vivo.
To demonstrate that LINC00115 is important for glioma EMT, we generated 1123 GSCs with doxycycline‐inducible LINC00115 shRNA or ectopic expression LINC00115 wild type (WT). GSEA showed that EMT gene signature was markedly lost in TGF‐β1‐treated 1123/shLINC00115 GSCs compared with the control and gained with ectopic expression of LINC00115 (Fig 4H and I). Taken together, these data support that LINC00115 acts as a miR‐200 sponge, resulting in enhanced ZEB1 signaling and GSC self‐renewal.
ZNF596 is important for LINC00115‐driven GSC tumorigenicity
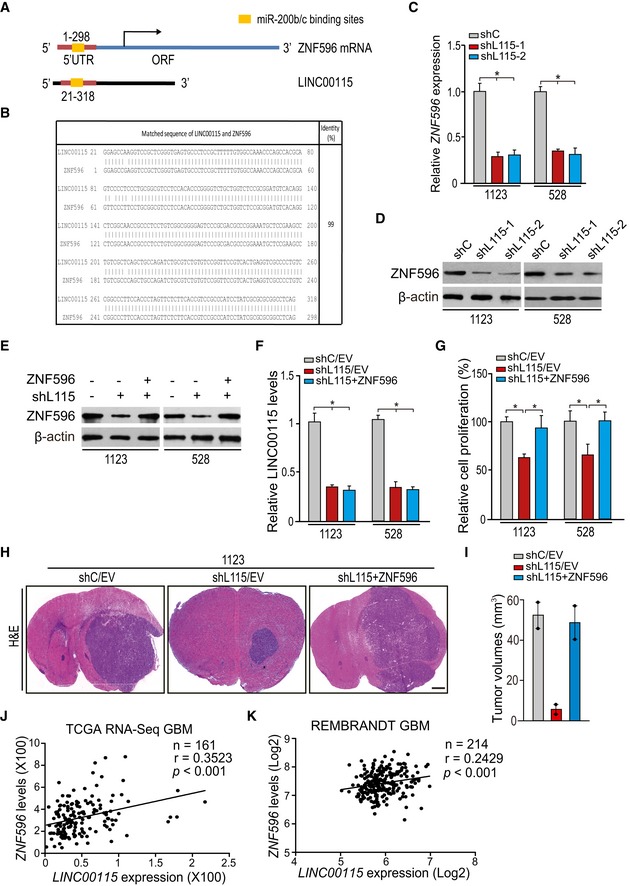
As ZEB1 signaling is known to regulate cell EMT and stemness, we reasoned that LINC00115 could also regulate other signaling pathways in GSC tumorigenicity. We aligned LINC00115 sequence with other human RNAs and found that LINC00115 sequence from nucleotides 21–318 is almost identical to the 5′‐UTR of zinc finger protein 596 (ZNF596) mRNA (99% identity) using BLAST (http://blast.ncbi.nlm.nih.gov; Fig 5A and B). ZNF596 is a member of zinc finger protein family, which are functional diversity including transcriptional activation 33, 34. Moreover, LINC00115 knockdown inhibited ZNF596 mRNA (Fig 5C) and protein (Fig 5D) expression in 1123 and 528 GSCs.
Figure 5. ZNF596 is important for LINC00115‐driven GSC tumorigenicity.
-
ASchematics of the 5′‐terminus of LINC00115 that is homologous to the 5′‐UTR of ZNF596 mRNA.
-
BSequence alignment of the 5′‐terminus of LINC00115 and the 5′‐UTR of ZNF596 mRNA.
-
C, DLINC00115 knockdown reduced ZNF596 mRNA (C) and ZNF596 protein (D) expression.
-
EEffects of exogenous ZNF596 expression on LINC00115 knockdown‐inhibited ZNF596 protein expression.
-
FZNF596 overexpression had no effect on LINC00115 expression.
-
GExpression of exogenous ZNF596 rescued LINC00115 knockdown‐inhibited cell proliferation.
-
HRepresentative H&E staining images of mouse brain sections with 1123/shC and 1123/shL115 GSC tumor xenografts with empty vector (EV) or ectopic ZNF596 expression. Images represent the results of five mice per group of two independent experiments. Scale bars: 1 mm.
-
IQuantification of tumor size in (H).
-
J, KCorrelation of expression between LINC00115 and ZEB1 from TCGA GBM RNA‐Seq dataset (J) and REMBRANDT GBM array dataset (K). **P < 0.01, by two‐tailed t‐test.
To assess the roles of ZNF596 in LINC00115‐modulated GBM tumorigenicity, we overexpressed ZNF596 in LINC00115‐knockdown GSCs (Fig 5E). Exogenous expression of ZNF596 did not affect LINC00115 expression in 1123 and 528 GSCs (Fig 5F). However, exogenously expressed ZNF596 reversed LINC00115 knockdown‐inhibited cell proliferation in vitro (Fig 5G) and tumor growth in vivo (Fig 5H and I). These data show that ZNF596 is a downstream effector of LINC00115‐driven GBM tumorigenicity.
We further test the pathological correlation between LINC00115 and ZNF596 in human glioma samples. As shown in Figs 5J and K, and EV4A and B, correlation assays using the TCGA GBM and LGG RNA‐Seq and REMBRANDT GBM but not LGG array datasets showed that LINC00115 and ZNF596 significantly co‐expressed in these two cohorts of clinical glioma samples. Taken together, our data support that ZNF596 and LINC00115 function together to regulate GBM tumorigenicity.
Figure EV4. Correlation of expression between LINC00115 and ZNF596 in grade II‐III glioma specimens.
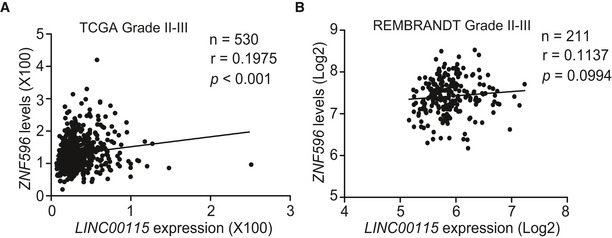
Corresponding to Fig 5J and K. Correlation of expression between LINC00115 and ZNF596 in grade II‐III glioma specimens from TCGA RNA‐Seq (A) and REMBRANDT array dataset (B). Statistical analysis was performed by two‐tailed t‐test.
LINC00115 promotes ZNF596 transcription by sequestering miR‐200s from binding to the 5′‐UTR of ZNF596
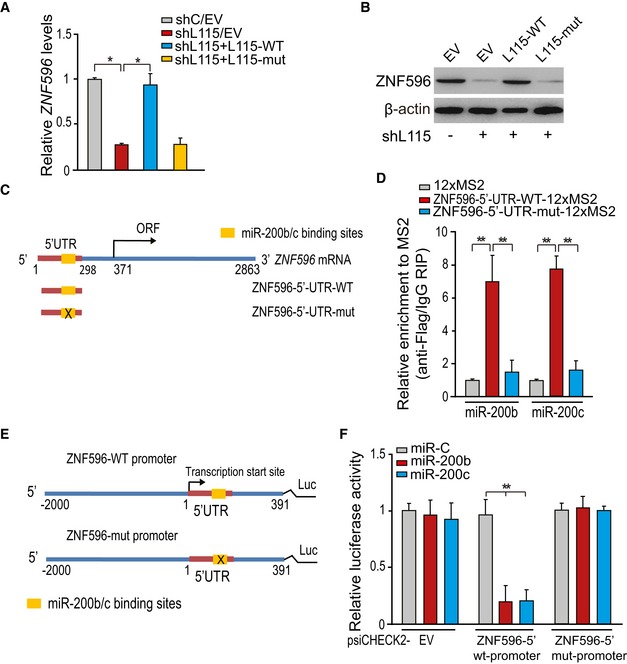
To reveal the mechanism by which LINC00115 regulates ZNF596 expression in GSCs, we examined the sequence of the 5′‐UTR of ZNF596 and identified a conserved miR‐200 binding site, with high homology to the sequence in the 5′‐terminal region of LINC00115 gene (Fig 5A). We proposed that LINC00115 promotes ZNF596 transcription by sequestrating miR‐200s from its association with 5′‐UTR of ZNF596 gene. To test this hypothesis, we determined the effects of re‐expression of shRNA‐resistant LINC00115 WT (L115‐WT) and a miR‐200‐binding deficient LINC00115 mutant (L115‐mut) on ZNF596 expression. Re‐expression of shRNA‐resistant L115‐WT but not L115‐mut rescued LINC00115 knockdown‐reduced expression of ZNF596 mRNA (Fig 6A) and protein (Fig 6B).
Figure 6. LINC00115 promotes ZNF596 transcription by sequestrating miR‐200s from binding to the 5′‐UTR of the ZNF596 gene.
-
A, BExpression of shRNA‐resistant LINC00115 WT but not mutant or empty vector (EV) rescued LINC00115 shRNA‐inhibited ZNF596 mRNA (A) and ZNF596 protein (B) expression in 1123 GSCs.
-
CSchematics of the predicted binding sites of miR‐200s on ZNF596 sequence. ZNF596‐5′‐UTR‐mut contains a mutated sequence in the miR‐200 binding site.
-
DMS2‐RIP followed by qRT–PCR for endogenous microRNA association with ZNF596. 12XMS2 empty vector, ZNF596‐5′‐UTR‐WT‐12XMS2, or ZNF596‐5′‐UTR‐mut‐12XMS2 with Flag‐tagged MS2 was co‐transfected into 1123 GSCs.
-
ESchematics of ZNF596 wild type (ZNF596‐WT) and miR‐200 binding site mutant (ZNF596‐mut) promoter.
-
FLuciferase activity in 1123 GSCs co‐transfected with miR‐200s and luciferase reporters containing ZNF596 5′‐UTR WT, mutant, or empty vector (EV).
To further test whether ZNF596 directly associates with miR‐200s, we performed RIP analysis using the Flag‐MS2bp‐MS2bs system and qPCR assay (Fig 6C and D). When compared with the 12XMS empty vector control, ZNF596 5′‐UTR WT (ZNF596‐5′‐UTR‐WT‐12XMS2) but not the miR‐200‐binding deficient mutant (ZNF596‐5′‐UTR‐mut‐12XMS2) strongly associated with miR‐200b and miR‐200c (Fig 6D). Moreover, in our luciferase reporter analysis, we found that when compared with the control miR (miR‐C), miR‐200b and miR‐200c markedly reduced luciferase activities of ZNF596 WT promoter, but not an empty control (EV) or a mutant promoter (Fig 6E and F). These results support that LINC00115 regulates ZNF596 transcriptional expression by sequestrating miR‐200s from binding to the 5′‐UTR of ZNF596.
LINC00115 activates the EZH2/STAT3 signaling through ZNF596
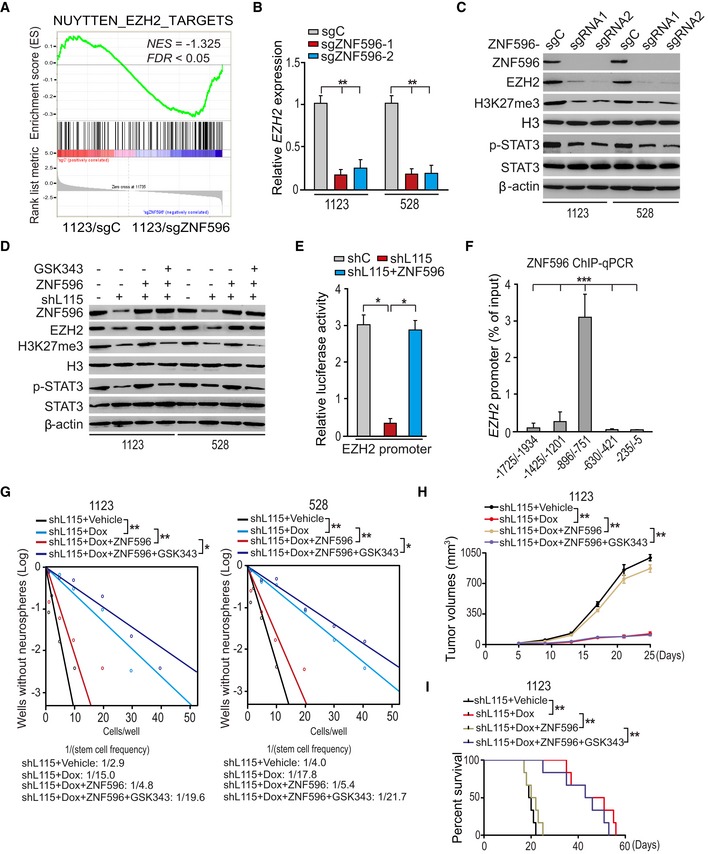
As ZNF596 is shown to encode a zinc finger protein, which is a putative transcription factor, we generated CRISPR knockouts of ZNF596 and performed RNA‐Seq analysis in 1123 GSCs to explore the targets transcriptionally regulated by ZNF596 in GSCs. GSEA showed that enhancer of zeste homolog 2 (EZH2)‐targeted gene signature 11 was significantly altered in ZNF596 knockout GSCs (Fig 7A). qRT–PCR and Western blotting assays validated that ZNF596 knockout inhibited the expression of EZH2 mRNA (Fig 7B) and protein (Fig 7C) in 1123 and 528 GSCs. Since EZH2 is a lysine methyltransferase and the enzymatic component of the polycomb repressive complex 2, which promotes histone H3 lysine 27 tri‐methylation (H3K27me3) and activates STAT3 signaling, resulting in enhanced GSC tumorigenicity 35, 36, we detected effect of ZNF596 knockout on H3K27 methylation and its downstream STAT3 signaling activity. As shown in Fig 7C, ZNF596 knockout inhibited EZH2‐mediated H3K27 methylation and its downstream STAT3 signaling activity in 1123 and 528 GSCs. These data suggested that ZNF596 regulates EZH2/STAT3 signaling in GSCs.
Figure 7. LINC00115 upregulates ZNF596 to activate EZH2/STAT3 signaling.
-
AGSEA of EZH2‐targeted signature genes using ranked gene expression changes in 1123 GSCs with ZNF596 sgRNA or a control sgRNA. NES, normalized enrichment score.
-
BqRT–PCR analysis of effect of ZNF596 knockout on EZH2 expression.
-
CZNF596 knockout impaired EZH2 expression, its downstream H3K27me3, and STAT3 phosphorylation in 1123 and 528 GSCs.
-
DLINC00115 regulated ZNF596/EZH2/STAT3 signaling. 1123 and 528 GSCs were treated with or without EZH2 inhibitor GSK343 (3 μM) for 6 h.
-
ELINC00115 and ZNF596 regulate EZH2 promoter activity.
-
FChIP‐qPCR analysis of ZNF596 binding with the EZH2 promoter.
-
GEZH2 inhibitor GSK343 impaired ZNF596 overexpression‐reversed and LINC00115 knockdown‐inhibited neuro‐like sphere formation. 1123 and 528 GSCs with an inducible ZNF596 shRNA were treated with or without Dox (2 μg/ml) and/or EZH2 inhibitor GSK343 (1 μM) for 7 days.
-
HGrowth kinetics of subcutaneous xenograft tumor with indicated genetic modifications after treatment with or without Dox and/or GSK343. Tumor‐bearing mice (five mice per group) were fed with 10% sucrose water with or without 2 mg/ml Dox and combined with treatment with or without GSK343 (5 mg/kg body weight from Monday to Friday via intraperitoneal injection) for 3 weeks beginning 5 days post‐xenograft transplantation. Data were from three independent experiments with five mice per group.
-
IKaplan–Meier analysis of animal implantation with GSC1123 with indicated modifications. n = 10. Statistical analysis was performed by log‐rank test.
Next, we tested the effects of LINC00115 knockdown on EZH2 expression and its downstream signaling. As shown in Fig 7D, LINC00115 knockdown markedly inhibited expressions of ZNF596 and EZH2, H3K27 tri‐methylation, and STAT3 phosphorylation in GSCs. Moreover, exogenous expression of ZNF596 rescued LINC00115 knockdown‐inhibited EZH2 expression, H3K27 tri‐methylation, and STAT3 phosphorylation (Fig 7D). Additionally, treatments with EZH2 inhibitor GSK343 37, 38 did not affect EZH2 expression but inhibited ZNF596 ectopic expression‐promoted H3K27 tri‐methylation and STAT3 phosphorylation (Fig 7D). Lastly, we performed correlation analyses using the TCGA RNA‐Seq and REMBRANDT array datasets and found that ZNF596 or LINC00115 and EZH2 significantly co‐expressed in these two cohorts of clinical glioma samples (Fig EV5A and B). These data support that LINC00115 activates EZH2/STAT3 signaling in GSCs through ZNF596.
Figure EV5. Correlation of expression between EZH2 and ZNF596 or LINC00115 in GBM specimens.
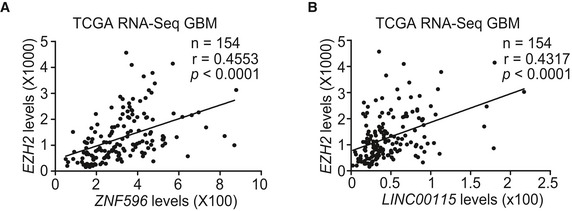
Correlation of expression between EZH2 and ZNF596 (A) or LINC00115 (B) in GBM specimens from TCGA RNA‐Seq dataset. Statistical analysis was performed by two‐tailed t‐test.
To test whether ZNF596 regulates EZH2 transcription, we analyzed the luciferase activity of EZH2 promoter. As shown in Fig 7E, compared with the shRNA control, knockdown of LINC00115 inhibited the luciferase activity of the EZH2 promoter. In contrary, overexpression of ZNF596 rescued LINC00115 knockdown‐inhibited luciferase activity of the EZH2 promoter (Fig 7E). When we examined the binding site(s) of ZNF596 in the EZH2 promoter, we found that ZNF596 associated with the locus within nucleotides −896 to −751 in the EZH2 promoter (Fig 7F). These data show that ZNF596 functions as a LINC00115 downstream transcriptional factor for EZH2.
To determine the roles of the EZH2/STAT3 signaling axis in LINC00115/ZNF596‐driven GBM tumorigenicity, we assessed the effects of EZH2 inhibitor GSK343 treatment on LINC00115‐regulated GSC sphere formation and tumorigenicity in doxycycline‐inducible LINC00115 shRNA 1123 and 528 GSCs. Consistent with our results described above, knockdown of LINC00115 inhibited capacities of 1123 and 528 GSCs in sphere formation in vitro (Fig 7G), subcutaneous tumor growth (Fig 7H), and animal survival with 1123 GSCs (Fig 7I). On the other hand, the expression of exogenous ZNF596 rescued LINC00115 knockdown‐impaired neuro‐like sphere formation in vitro, tumor growth, and animal survival in vivo (Fig 7G–I). Additionally, treatments with GSK343 reversed the effects of ZNF596 overexpression on neuro‐like sphere formation and their tumorigenic behaviors (Fig 7G–I). Collectively, these data suggest that LINC00115 activates EZH2/STAT3 signaling through ZNF596, thereby promoting GSC self‐renewal and tumorigenicity.
Correlative expression of LINC00115, ZEB1, and ZNF596 is prognostic factors for clinical GBM
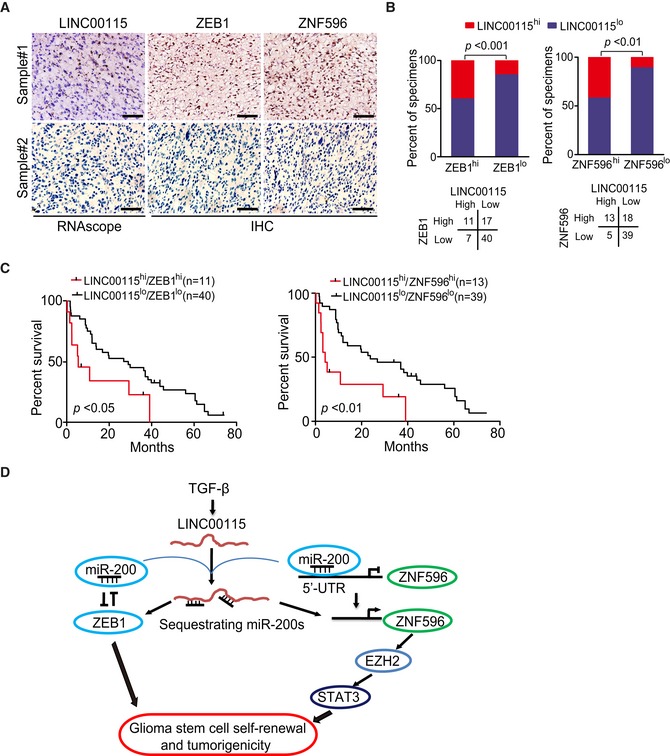
To further address the importance of LINC00115 signaling axis to GBM biological behavior, we determined expression levels of ZEB1 and ZNF596 in a total of 75 clinical GBM tumor samples, in which LINC00115 expression had been determined using the RNAscope method, by immunohistochemical (IHC) staining (Fig 8A, Appendix Fig S3A and S3B). A positive correlation between LINC00115 and ZEB1, or LINC00115 and ZNF596 was evident (Fig 8B). Moreover, Kaplan–Meier survival analysis revealed that GBM patients with high LINC00115 and high ZEB1 or high ZNF596 expression levels had a worse prognosis compared with those with low LINC00115 and low ZEB1 or low ZNF596 levels (Fig 8C). These data highlight the clinical implications of our findings.
Figure 8. LINC00115 is co‐expressed with ZEB1 and ZNF596 in GBM specimens.
-
ARepresentative images of RNAscope for LINC00115 and IHC for ZEB1 and ZNF596 expression in two GBM specimens, Sample #1 (positive) and Sample #2 (negative). Scale bar, 50 μm. Images are representative of two independent experiments.
-
BCorrelation of detected expression between ZEB1 or ZNF596, and LINC00115 as shown in (A) from a separate cohort of a total of 75 paraffin‐embedded clinical GBM samples. Statistical analysis was performed by chi‐square test.
-
CKaplan–Meier survival analysis of patients with GBM tumors expressing high or low levels of LINC00115 with high or low levels of ZEB1 or ZNF596 expression. Median survival (in months): LINC00115hi/ZEB1hi, 5.4; LINC00115lo/ZEB1lo, 27.9; LINC00115hi/ZNF596hi, 4.2; and LINC00115lo/ZNF596lo, 23.8. Statistical analysis was performed by log‐rank test.
-
DA working model of TGF‐β‐activated LINC00115‐driven GSC tumorigenicity and self‐renewal through sequestering miR‐200s from its binding targets, resulting in enhanced both ZEB1 signaling and ZNF596/EZH2/STAT3 signal axis.
Discussion
It has been established that lncRNAs are important regulators for cancer 16, 39, 40. In this study, we describe LINC00115 as a critical modulator in GSC self‐renewal and tumorigenicity. Our data show that LINC00115 is activated by TGF‐β and displays a binary role in regulating ZEB1‐ and ZNF596/EZH2/STAT3‐signaling‐promoted GSC self‐renewal and tumorigenicity through sequestrating miR‐200s (Fig 8D). Additionally, our results show that the expression of LINC00115 positively correlates with glioma progression and glioma patients with a higher level of LINC00115 have a worse prognosis.
In this study, we identified TGF‐β‐activated lncRNA LINC00115 as an important regulator for GSC self‐renewal and tumorigenicity. The TGF‐β pathway is critical for GIC self‐renewal and tumorigenicity 11, 13, 14, and several anti‐TGF‐β compounds are now under clinical development 26. However, TGF‐β inhibition often induces a rapid adaptive response that mediates resistance to TGF‐β inhibition 26. Thus, the specific downstream effectors of the TGF‐β pathway need to be explored further. LINC00115, an lncRNA, was demonstrated to be related to patient outcome of bladder cancer 9 and lung cancer 12. Here, we used two different subtypes of patient‐derived GSCs and identified LINC00115 as a downstream effector of TGF‐β pathway. LINC00115 knockdown was activated by TGF‐β and promoted GSC self‐renewal and tumorigenicity. EMT gene signature was markedly lost upon LINC00115 knockdown in TGF‐β1‐treated GSCs and gained with LINC00115 ectopic expression, indicating that LINC00115 regulates GSC self‐renewal and tumorigenicity through enhancing TGF‐β1 signaling‐driven EMT.
Our results indicate that LINC00115 functions as a miRNA sponge to competitively bind miR‐200s and activate ZEB1 signaling. Part of considerable development in our understanding of lncRNAs during the past decades is that lncRNAs act as competitive endogenous RNAs (ceRNAs) or miRNA sponges to regulate tumor progression 15. For example, the lncRNA activated by TGF‐β (lncRNA‐ATB) upregulated EMT factors by competitively binding the miR‐200 family in hepatocellular carcinoma invasion and metastasis 27. PVT1 played as a miR‐143 sponge and upregulated hexokinase 2 (HK2) expression levels in gallbladder cancer 13. In this study, we demonstrated LINC00115 as a new miRNA sponge of miR‐200 family to promote ZEB1 signaling in GBM. Depletion of LINC00115 inhibited ZEB1 signaling, neuro‐like sphere formation in vitro, and prolonged animal survival in vivo, but ectopic expression of LINC00115 reversed these biological effects. Additionally, ZEB1 signaling is considered as a master inducer of EMT 41, 42, and ZEB1‐miR‐200s forms a feedback loop to regulate EMT 27, 43. We and others had demonstrated that ZEB1‐miR‐200 loop was important for glioma EMT and GSC self‐renewal 32, 42. Thus, the present study not only corroborates these previous works but also presents LINC00115 as a regulator for ZEB1‐miR‐200 loop in gliomas.
Our results also demonstrated that LINC00115 enhances EZH2/STAT3 signaling and tumorigenicity through upregulating ZNF596. Although ZNF596 is predicted as a zinc finger protein, its functions are still not known. Firstly, gain‐function and loss‐function analyses in vitro and in vivo demonstrated that LINC00115 promotes ZNF596 transcription by preventing miR‐200s from binding to the 5′‐UTR of the ZNF596 gene. Secondly, although EZH2 has been shown to play important roles in GSC self‐renewal and tumorigenicity through regulating histone H3 lysine 27 tri‐methylation (H3K27me3) and STAT3 signaling activation 35, 36, the mechanisms which affect expression, stability, or activity of EZH2 are still unclear. In this study, we showed that ZNF596 regulates EZH2 signaling. ZNF596 knockout or EZH2 inhibitor treatment markedly impaired EZH2 expression and EZH2‐mediated H3K27 tri‐methylation and STAT3 phosphorylation, resulting in inhibited GSC self‐renewal and tumorigenicity. Finally, ChIP‐qPCR and promoter activity analyses further revealed that ZNF596 functions as a transcription factor of EZH2. Collectively, these findings suggest that the ZNF596/EZH2/STAT3 signaling activation of the LINC00115‐miR‐200 axis is another essential signaling for GSC self‐renewal and tumorigenicity.
Taken together, this study not only demonstrates that LINC00115 acts as a key regulator of TGF‐β pathway through regulating ZEB1 and ZNF596/EZH2/STAT3 signalings to maintain capacities of self‐renewal and tumorigenicity of GSCs by competitively binding miR‐200s, but also provides critical insights in advancing our understanding of glioma pathogenesis. Given the clinical and functional significance, targeting LINC00115 and its associated signaling axis may offer new targets for the treatment of gliomas.
Materials and Methods
Cell lines
Human GBM cell lines (U87, LN229, LN18, and T98G) from the American Type Culture Collection (Manassas, VA, USA) were cultured in 10% FBS/DMEM. Patient‐derived glioma stem‐like cells (GSCs) gifted from Dr. Nakano 24 were maintained in DMEM/F12 supplemented with B27 (1:50), heparin (5 mg/ml), basic FGF (20 ng/ml), and EGF (20 ng/ml) as we previously described 32, 44. Glioma cell lines were recently authenticated using STR DNA fingerprinting at Shanghai Biowing Applied Biotechnology Co., Ltd (Shanghai, China). Only early‐passage GSC cell lines were used.
Plasmids
LINC00115 and ZNF596 cDNAs were amplified by PCR using Q5 High‐Fidelity DNA Polymerase (BioLabs) from 1123 GSCs and subcloned into a pcDNA3 vector (Invitrogen) or a lentivirus pLVX‐Puro vector (Clontech). MS2‐HB was a gift from Marian Waterman (Addgene plasmid # 35573) 45, and pSL‐MS2‐12X was a gift from Robert Singer (Addgene plasmid # 27119) 46. pLVX‐LINC00115‐MS2‐12X and pLVX‐ZNF596‐5′‐UTR‐MS2‐12X were derived from pSL‐MS2‐12X. The lentiviral doxycycline‐inducible GFP‐IRES‐shRNA FH1tUTG construct 14 was a gift from Dr. Marco Herold (Walter and Eliza Hall Institute of Medical Research, Melbourne, Australia). Point mutations were constructed using a QuikChange Site‐Directed Mutagenesis Kit (Stratagene). shRNAs were designed using the web‐based software provided by Invitrogen (http://rnaidesigner.invitrogen.com/rnaiexpress/), and sgRNAs were designed as previously described 47.
RNA‐Seq and differentially expressed gene analysis
Total RNA was extracted and purified using the Qiagen RNeasy Mini Kit (Valencia, CA, USA) according to the manufacturer's instructions. The quality of RNA was assessed by Agilent 2100 Bioanalyzer before sequencing. Libraries for poly(A)+ RNA were prepared according to the Illumina protocol. Libraries were sequenced on Illumina HiSeqX Ten platforms. Differentially expressed genes were selected based on a fold change between groups and a false discovery rate (FDR) < 0.05. Expression patterns were clustered with Cluster 3.0 and viewed using Java Tree View 3.0.
Gene set enrichment analysis
Gene set enrichment analysis (GSEA) was performed using the GSEA software 48.
RNA‐binding protein immunoprecipitation (RIP) and RNA pull‐down assays
For Flag‐MS2bp‐MS2bs system, cells were stably co‐transfected with pLVX‐MS2, pLVX‐MS2‐LINC00115 WT, pLVX‐MS2‐LINC00115‐mut, and pLVX‐Flag‐MS2. Cells were used to perform RNA immunoprecipitation (RIP) experiments using anti‐Flag M2 (#F3165, 1:50) and protein G‐agarose beads. For in vitro‐transcribed biotin‐labeled RNA assay, cell lysates were incubated with biotinylated LINC00115 mutants, and streptavidin beads were used. The beads were washed with wash buffer, and then, the complexes were incubated with 0.1% SDS/0.5 mg/ml proteinase K (30 min at 55°C) to remove unbound proteins. The RNA concentration was measured using a NanoDrop Spectrophotometer (Thermo Scientific), and its quality was assessed using a bioanalyzer (Agilent, Santa Clara, CA). Finally, immunoprecipitated RNA was purified and analyzed by qRT–PCR.
Chromatin immunoprecipitation
Chromatin immunoprecipitation (ChIP) was done using the Chromatin Immunoprecipitation Kit (Upstate) according to the manufacturer's instruction. Briefly, cells were treated with 1% formaldehyde to cross‐link proteins to DNA. The cell lysates were sonicated to shear DNA to sizes of 300 to 1,000 bp. Equal aliquots of chromatin supernatants with 1 μg of anti‐ZNF596 (#SC‐98284) or anti‐IgG antibody were incubated overnight at 4°C. After reverse cross‐link of protein/DNA complexes to free DNA, PCR was performed using specific primers by following manufacturer's instructions.
In situ hybridization and immunohistochemistry (IHC)
In accordance with a protocol approved by Shanghai Jiao Tong University Institutional Clinical Care and Use Committee, according to the Declaration of Helsinki, clinical brain tissue specimens were collected at Ren Ji Hospital, School of Medicine, Shanghai Jiao Tong University, Shanghai, China. The investigators obtained informed written consent from all subjects. These specimens were examined and diagnosed by pathologists at Ren Ji Hospital. The in situ detection of LINC00115 was performed on paraffin‐embedded sections using RNAscope 2.5 HD Detection Reagent‐BROWN Kit (ACDBio). The specific LINC00115 probes were made by ACDBio. The tissue sections from paraffin‐embedded de‐identified human GBM specimens were stained with ZEB1 (1:50) and ZNF596 (1:20) antibodies as previously described 44. Tumors with 0 or 3 staining scores were considered as low expressing, and those with 4–7 scores were considered high expressing. Two separate individuals who were blinded to the slides examined and scored each sample.
Tumorigenicity studies
All experiments using animals were approved by Shanghai Jiao Tong University Institutional Animal Care and Use Committee (IACUC). Athymic (NCr nu/nu) female mice at ages of 6–8 weeks (SLAC, Shanghai, China) were used for all animal experiments. For orthotopic implantation, mice were randomly divided into 5 per group by one investigator. As previously described 5, 44, 4 × 10³ GSCs were stereotactically implanted into the brains of the animals. Mice were euthanized when neuropathological symptoms developed by another investigator. Tumor volumes were measured and estimated as (W2 × L)/2, (W < L), using H&E‐stained sections or measured in vivo luciferase activity using the IVIS Lumina imaging station (Caliper Life Sciences). For subcutaneous tumor xenograft, doxycycline‐inducible LINC00115 shRNA GSCs (1 × 10⁶) in 50 μl PBS were injected into the flanks of nude mice. Mice were fed with 10% sucrose water with or with doxycycline at 2 mg/ml after 5 days of xenograft. After 5 days, tumor‐bearing mice were fed with 10% sucrose water with or with doxycycline at 2 mg/ml and intraperitoneally injected with or without GSK343 (5 mg/kg body weight) from Monday to Friday for 3 weeks.
Western blotting analysis
Cells were lysed in a RIPA buffer (20 mM Tris–HCl, pH 7.5, 150 mM NaCl, 1 mM EDTA, 2 mM Na3VO4, 5 mM NaF, 1% Triton X‐100, and protease inhibitor cocktail) at 4°C for 30 min. Western blotting analyses were performed as previously described 44 with antibody against β‐actin (I‐19), ZEB1 (Cat#SC‐10570), ZNF596 (Cat#SC‐98284), and STAT3 (H‐190, Santa Cruz Biotechnology); Nestin (Cat#ABD69MI, Fisher Scientific); Flag (M2, Sigma‐Aldrich); and Vimentin (Cat#5741S), E‐cadherin (Cat#3195S), EZH2 (Cat#5246S), Tri‐Methyl‐Histone H3 (Lys27) (Cat#9733S), Histone H3 (Cat#9715S), and phospho‐STAT3 (Y705) (D3A7, Cell Signaling Technology).
Quantitative RT–PCR
First‐strand cDNA was generated using the PrimeScript® 1st Strand cDNA Synthesis Kit (Takara, Dalian, China). Real‐time PCR was performed as previously described 44 in the StepOne™ Real‐Time PCR System (Applied Biosystems, Foster City, USA) using FastStart Universal SYBR Green Master (ROX) (Roche). For microRNA analysis, real‐time PCR was performed as above, using TaqMan microRNA assays according to the manufacturer's instructions (Applied Biosystems). The relative expression of RNAs was calculated using the comparative Ct method. ACTB and U6 were employed as endogenous controls. Primers are listed in Appendix Table S1.
Luciferase analysis
Cells were seeded in triplicates in 48‐well plates and allowed to settle for 24 h. Luciferase reporter plasmids (100 ng) containing ZNF596 promoter (−2,000 to 391 nt) or EZH2 promoter (−2,000 to 50 nt), or the control luciferase plasmid, together with 1 ng of pRL‐TK Renilla plasmid (Promega), were transfected into cells using the Herrif Trans™ Liposomal Transfection Reagent (Yi Sheng, Shanghai, China). Luciferase and Renilla signals were measured 48 h after transfection using the Dual‐Luciferase Reporter Assay Kit (Promega) according to a protocol provided by the manufacturer.
Immunofluorescence analysis
Cells were fixed on glass slides and then incubated with antibodies against E‐cadherin (#3195S, 1:100), ZEB1 (#SC‐10570, 1:100), Vimentin (#5741S, 1:100), or Nestin (#ABD69MI, 1:100) for overnight at 4°C. The slides were incubated with secondary antibodies, mounted by adding DAPI Fluoromount‐G (#00‐4959‐52), and examined with a Zeiss Axiophot Photomicroscope (Carl Zeiss, Oberkochen, Germany).
Cell proliferation
Cell proliferation assays were performed using a WST‐1 Assay Kit (BioVision Inc., Milpitas, CA, USA).
Limited dilution analysis
As previously described 5, 32, dissociated cells were seeded in a 96‐well plates at density of 1–50 cells per well. After 7 days, each well was examined for the formation of tumor spheres. Stem cell frequency was calculated using extreme limiting dilution analysis (http://bioinf.wehi.edu.au/software/elda/).
Transfection
As previously described 44, lentiviruses were produced by co‐transfecting specified shRNAs or sgRNAs and packaging plasmids 49 into 293T cells using Lipofectamine 2000 reagent according to manufacturer's instruction (Invitrogen). Viruses were concentrated by ultracentrifugation and added into the culture media supplemented with 8 μg/ml polybrene. Transduced cells were harvested, and then, expressions of exogenous proteins were validated by Western blotting assays.
Statistical analysis
Sample size and statistics for each experiment are provided in the Results section and Figure legends. GraphPad Prism version 5.0 for Windows (GraphPad Software Inc., San Diego, CA, USA) was used to perform one‐way analysis of variance (ANOVA) with Newman–Keuls post hoc test or paired two‐tailed Student's t‐test. Kaplan–Meier survival analysis was carried out using log‐rank tests. The correlation of gene expression levels in human clinical GBM specimens was investigated using a chi‐squared test. A P‐value of < 0.05 was considered significant.
Author contributions
JT, YL, and HF designed the experiments. JT, BY, WZ, and YL performed the experiments. JT, BY, YL, and HF interpreted the data. JT, BY, AAA, BH, S‐YC, YL, and HF wrote and reviewed the manuscript. HF supervised the project.
Conflict of interest
The authors declare that they have no conflict of interest.
Supporting information
Appendix
Expanded View Figures PDF
Review Process File
Acknowledgements
We thank Ichiro Nakano for providing patient‐derived glioma neuro‐like spheres. This work was supported in part by National Natural Science Foundation of China (No. 81572467, 81874078 to H. Feng; No. 81772663, 81972341 to Y. Li); the Program for Professor of Special Appointment (Eastern Scholar) at Shanghai Institutions of Higher Learning (No. 2014024), Shanghai Municipal Education Commission‐Gaofeng Clinical Medicine Grant Support (No. 20161310), New Hundred Talent Program (Outstanding Academic Leader) at Shanghai Municipal Health Bureau (2017BR021), and the State Key Laboratory of Oncogenes and Related Genes in China (No. 91‐17‐25) to H. Feng. Pudong New Area Science & Technology Development Fund (PKJ2018‐Y47); and Shanghai Jiao Tong University Medical Engineering Cross Fund (No. YG2017MS32), Local High Level University Construction Project of Shanghai Jiao Tong University School of Medicine to Y.L.
EMBO Reports (2019) 20: e48170
Data availability
All relevant data are available from the authors. RNA‐Seq data reported in this study have been deposited with the Gene Expression Omnibus under the accession GEO ID: GSE134595 (https://www.ncbi.nlm.nih.gov/geo/query/acc.cgi?acc=GSE134595). All the other data supporting the finding of this study are available within the article and its Supplementary Information files or from the corresponding author on reasonable request.
References
- 1. Wen PY, Kesari S (2008) Malignant gliomas in adults. N Engl J Med 359: 492–507 [DOI] [PubMed] [Google Scholar]
- 2. Osuka S, Van Meir EG (2017) Overcoming therapeutic resistance in glioblastoma: the way forward. J Clin Invest 127: 415–426 [DOI] [PMC free article] [PubMed] [Google Scholar]
- 3. Stupp R, Mason WP, van den Bent MJ, Weller M, Fisher B, Taphoorn MJ, Belanger K, Brandes AA, Marosi C, Bogdahn U et al (2005) Radiotherapy plus concomitant and adjuvant temozolomide for glioblastoma. N Engl J Med 352: 987–996 [DOI] [PubMed] [Google Scholar]
- 4. Bao S, Wu Q, McLendon RE, Hao Y, Shi Q, Hjelmeland AB, Dewhirst MW, Bigner DD, Rich JN (2006) Glioma stem cells promote radioresistance by preferential activation of the DNA damage response. Nature 444: 756–760 [DOI] [PubMed] [Google Scholar]
- 5. Huang T, Kim CK, Alvarez AA, Pangeni RP, Wan X, Song X, Shi T, Yang Y, Sastry N, Horbinski CM et al (2017) MST4 phosphorylation of ATG4B regulates autophagic activity, tumorigenicity, and radioresistance in glioblastoma. Cancer Cell 32: 840–855 [DOI] [PMC free article] [PubMed] [Google Scholar]
- 6. Lathia JD, Mack SC, Mulkearns‐Hubert EE, Valentim CL, Rich JN (2015) Cancer stem cells in glioblastoma. Genes Dev 29: 1203–1217 [DOI] [PMC free article] [PubMed] [Google Scholar]
- 7. Zhang S, Zhao BS, Zhou A, Lin K, Zheng S, Lu Z, Chen Y, Sulman EP, Xie K, Bogler O et al (2017) m(6)A demethylase ALKBH5 maintains tumorigenicity of glioblastoma stem‐like cells by sustaining FOXM1 expression and cell proliferation program. Cancer Cell 31: 591–606 [DOI] [PMC free article] [PubMed] [Google Scholar]
- 8. Gargiulo G, Cesaroni M, Serresi M, de Vries N, Hulsman D, Bruggeman SW, Lancini C, van Lohuizen M (2013) In vivo RNAi screen for BMI1 targets identifies TGF‐beta/BMP‐ER stress pathways as key regulators of neural‐ and malignant glioma‐stem cell homeostasis. Cancer Cell 23: 660–676 [DOI] [PubMed] [Google Scholar]
- 9. Jiang B, Hailong S, Yuan J, Zhao H, Xia W, Zha Z, Bin W, Liu Z (2018) Identification of oncogenic long noncoding RNA SNHG12 and DUXAP8 in human bladder cancer through a comprehensive profiling analysis. Biomed Pharmacother 108: 500–507 [DOI] [PubMed] [Google Scholar]
- 10. Li Z, Liu H, Zhong Q, Wu J, Tang Z (2018) LncRNA UCA1 is necessary for TGF‐beta‐induced epithelial‐mesenchymal transition and stemness via acting as a ceRNA for Slug in glioma cells. FEBS Open Bio 8: 1855–1865 [DOI] [PMC free article] [PubMed] [Google Scholar]
- 11. Nuytten M, Beke L, Van Eynde A, Ceulemans H, Beullens M, Van Hummelen P, Fuks F, Bollen M (2008) The transcriptional repressor NIPP1 is an essential player in EZH2‐mediated gene silencing. Oncogene 27: 1449–1460 [DOI] [PubMed] [Google Scholar]
- 12. Li DS, Ainiwaer JL, Sheyhiding I, Zhang Z, Zhang LW (2016) Identification of key long non‐coding RNAs as competing endogenous RNAs for miRNA‐mRNA in lung adenocarcinoma. Eur Rev Med Pharmacol Sci 20: 2285–2295 [PubMed] [Google Scholar]
- 13. Chen J, Yu Y, Li H, Hu Q, Chen X, He Y, Xue C, Ren F, Ren Z, Li J et al (2019) Long non‐coding RNA PVT1 promotes tumor progression by regulating the miR‐143/HK2 axis in gallbladder cancer. Mol Cancer 18: 33 [DOI] [PMC free article] [PubMed] [Google Scholar] [Retracted]
- 14. Herold MJ, van den Brandt J, Seibler J, Reichardt HM (2008) Inducible and reversible gene silencing by stable integration of an shRNA‐encoding lentivirus in transgenic rats. Proc Natl Acad Sci USA 105: 18507–18512 [DOI] [PMC free article] [PubMed] [Google Scholar]
- 15. Thomson DW, Dinger ME (2016) Endogenous microRNA sponges: evidence and controversy. Nat Rev Genet 17: 272–283 [DOI] [PubMed] [Google Scholar]
- 16. Khurana E, Fu Y, Chakravarty D, Demichelis F, Rubin MA, Gerstein M (2016) Role of non‐coding sequence variants in cancer. Nat Rev Genet 17: 93–108 [DOI] [PubMed] [Google Scholar]
- 17. Schmitt AM, Chang HY (2016) Long noncoding RNAs in cancer pathways. Cancer Cell 29: 452–463 [DOI] [PMC free article] [PubMed] [Google Scholar]
- 18. Ransohoff JD, Wei Y, Khavari PA (2018) The functions and unique features of long intergenic non‐coding RNA. Nat Rev Mol Cell Biol 19: 143–157 [DOI] [PMC free article] [PubMed] [Google Scholar]
- 19. Chen Q, Cai J, Wang Q, Wang Y, Liu M, Yang J, Zhou J, Kang C, Li M, Jiang C (2018) Long noncoding RNA NEAT1, regulated by the EGFR pathway, contributes to glioblastoma progression through the WNT/beta‐catenin pathway by scaffolding EZH2. Clin Cancer Res 24: 684–695 [DOI] [PubMed] [Google Scholar]
- 20. Katsushima K, Natsume A, Ohka F, Shinjo K, Hatanaka A, Ichimura N, Sato S, Takahashi S, Kimura H, Totoki Y et al (2016) Targeting the Notch‐regulated non‐coding RNA TUG1 for glioma treatment. Nat Commun 7: 13616 [DOI] [PMC free article] [PubMed] [Google Scholar]
- 21. Li H, Yuan X, Yan D, Li D, Guan F, Dong Y, Wang H, Liu X, Yang B (2017) Long non‐coding RNA MALAT1 decreases the sensitivity of resistant glioblastoma cell lines to temozolomide. Cell Physiol Biochem 42: 1192–1201 [DOI] [PubMed] [Google Scholar]
- 22. Mineo M, Ricklefs F, Rooj AK, Lyons SM, Ivanov P, Ansari KI, Nakano I, Chiocca EA, Godlewski J, Bronisz A (2016) The long non‐coding RNA HIF1A‐AS2 facilitates the maintenance of mesenchymal glioblastoma stem‐like cells in hypoxic niches. Cell Rep 15: 2500–2509 [DOI] [PMC free article] [PubMed] [Google Scholar]
- 23. Pastori C, Kapranov P, Penas C, Peschansky V, Volmar CH, Sarkaria JN, Bregy A, Komotar R, St Laurent G, Ayad NG et al (2015) The Bromodomain protein BRD4 controls HOTAIR, a long noncoding RNA essential for glioblastoma proliferation. Proc Natl Acad Sci USA 112: 8326–8331 [DOI] [PMC free article] [PubMed] [Google Scholar]
- 24. Mao P, Joshi K, Li J, Kim SH, Li P, Santana‐Santos L, Luthra S, Chandran UR, Benos PV, Smith L et al (2013) Mesenchymal glioma stem cells are maintained by activated glycolytic metabolism involving aldehyde dehydrogenase 1A3. Proc Natl Acad Sci USA 110: 8644–8649 [DOI] [PMC free article] [PubMed] [Google Scholar]
- 25. Wang H, Wang MX, Su N, Wang LC, Wu X, Bui S, Nielsen A, Vo HT, Nguyen N, Luo Y et al (2014) RNAscope for in situ detection of transcriptionally active human papillomavirus in head and neck squamous cell carcinoma. J Vis Exp 85: e51426 [DOI] [PMC free article] [PubMed] [Google Scholar]
- 26. Brennan CW, Verhaak RG, McKenna A, Campos B, Noushmehr H, Salama SR, Zheng S, Chakravarty D, Sanborn JZ, Berman SH et al (2013) The somatic genomic landscape of glioblastoma. Cell 155: 462–477 [DOI] [PMC free article] [PubMed] [Google Scholar]
- 27. Yuan JH, Yang F, Wang F, Ma JZ, Guo YJ, Tao QF, Liu F, Pan W, Wang TT, Zhou CC et al (2014) A long noncoding RNA activated by TGF‐beta promotes the invasion‐metastasis cascade in hepatocellular carcinoma. Cancer Cell 25: 666–681 [DOI] [PubMed] [Google Scholar]
- 28. Paraskevopoulou MD, Vlachos IS, Karagkouni D, Georgakilas G, Kanellos I, Vergoulis T, Zagganas K, Tsanakas P, Floros E, Dalamagas T et al (2016) DIANA‐LncBase v2: indexing microRNA targets on non‐coding transcripts. Nucleic Acids Res 44: D231–D238 [DOI] [PMC free article] [PubMed] [Google Scholar]
- 29. Kruger J, Rehmsmeier M (2006) RNAhybrid: microRNA target prediction easy, fast and flexible. Nucleic Acids Res 34: W451–W454 [DOI] [PMC free article] [PubMed] [Google Scholar]
- 30. Gregory PA, Bert AG, Paterson EL, Barry SC, Tsykin A, Farshid G, Vadas MA, Khew‐Goodall Y, Goodall GJ (2008) The miR‐200 family and miR‐205 regulate epithelial to mesenchymal transition by targeting ZEB1 and SIP1. Nat Cell Biol 10: 593–601 [DOI] [PubMed] [Google Scholar]
- 31. Kong D, Li Y, Wang Z, Banerjee S, Ahmad A, Kim HR, Sarkar FH (2009) miR‐200 regulates PDGF‐D‐mediated epithelial‐mesenchymal transition, adhesion, and invasion of prostate cancer cells. Stem Cells 27: 1712–1721 [DOI] [PMC free article] [PubMed] [Google Scholar]
- 32. Zhang L, Zhang W, Li Y, Alvarez A, Li Z, Wang Y, Song L, Lv D, Nakano I, Hu B et al (2016) SHP‐2‐upregulated ZEB1 is important for PDGFRalpha‐driven glioma epithelial‐mesenchymal transition and invasion in mice and humans. Oncogene 35: 5641–5652 [DOI] [PMC free article] [PubMed] [Google Scholar]
- 33. Cassandri M, Smirnov A, Novelli F, Pitolli C, Agostini M, Malewicz M, Melino G, Raschella G (2017) Zinc‐finger proteins in health and disease. Cell Death Discov 3: 17071 [DOI] [PMC free article] [PubMed] [Google Scholar]
- 34. Laity JH, Lee BM, Wright PE (2001) Zinc finger proteins: new insights into structural and functional diversity. Curr Opin Struct Biol 11: 39–46 [DOI] [PubMed] [Google Scholar]
- 35. Kim E, Kim M, Woo DH, Shin Y, Shin J, Chang N, Oh YT, Kim H, Rheey J, Nakano I et al (2013) Phosphorylation of EZH2 activates STAT3 signaling via STAT3 methylation and promotes tumorigenicity of glioblastoma stem‐like cells. Cancer Cell 23: 839–852 [DOI] [PMC free article] [PubMed] [Google Scholar]
- 36. Wang J, Cheng P, Pavlyukov MS, Yu H, Zhang Z, Kim SH, Minata M, Mohyeldin A, Xie W, Chen D et al (2017) Targeting NEK2 attenuates glioblastoma growth and radioresistance by destabilizing histone methyltransferase EZH2. J Clin Invest 127: 3075–3089 [DOI] [PMC free article] [PubMed] [Google Scholar] [Retracted]
- 37. Poirier JT, Gardner EE, Connis N, Moreira AL, de Stanchina E, Hann CL, Rudin CM (2015) DNA methylation in small cell lung cancer defines distinct disease subtypes and correlates with high expression of EZH2. Oncogene 34: 5869–5878 [DOI] [PMC free article] [PubMed] [Google Scholar]
- 38. Qu Y, Lu D, Jiang H, Chi X, Zhang H (2016) EZH2 is required for mouse oocyte meiotic maturation by interacting with and stabilizing spindle assembly checkpoint protein BubRI. Nucleic Acids Res 44: 7659–7672 [DOI] [PMC free article] [PubMed] [Google Scholar]
- 39. Geisler S, Coller J (2013) RNA in unexpected places: long non‐coding RNA functions in diverse cellular contexts. Nat Rev Mol Cell Biol 14: 699–712 [DOI] [PMC free article] [PubMed] [Google Scholar]
- 40. Gutschner T, Diederichs S (2012) The hallmarks of cancer: a long non‐coding RNA point of view. RNA Biol 9: 703–719 [DOI] [PMC free article] [PubMed] [Google Scholar]
- 41. Gibbons DL, Lin W, Creighton CJ, Rizvi ZH, Gregory PA, Goodall GJ, Thilaganathan N, Du L, Zhang Y, Pertsemlidis A et al (2009) Contextual extracellular cues promote tumor cell EMT and metastasis by regulating miR‐200 family expression. Genes Dev 23: 2140–2151 [DOI] [PMC free article] [PubMed] [Google Scholar]
- 42. Siebzehnrubl FA, Silver DJ, Tugertimur B, Deleyrolle LP, Siebzehnrubl D, Sarkisian MR, Devers KG, Yachnis AT, Kupper MD, Neal D et al (2013) The ZEB1 pathway links glioblastoma initiation, invasion and chemoresistance. EMBO Mol Med 5: 1196–1212 [DOI] [PMC free article] [PubMed] [Google Scholar]
- 43. Li SP, Xu HX, Yu Y, He JD, Wang Z, Xu YJ, Wang CY, Zhang HM, Zhang RX, Zhang JJ et al (2016) LncRNA HULC enhances epithelial‐mesenchymal transition to promote tumorigenesis and metastasis of hepatocellular carcinoma via the miR‐200a‐3p/ZEB1 signaling pathway. Oncotarget 7: 42431–42446 [DOI] [PMC free article] [PubMed] [Google Scholar]
- 44. Lv D, Li Y, Zhang W, Alvarez AA, Song L, Tang J, Gao WQ, Hu B, Cheng SY, Feng H (2017) TRIM24 is an oncogenic transcriptional co‐activator of STAT3 in glioblastoma. Nat Commun 8: 1454 [DOI] [PMC free article] [PubMed] [Google Scholar]
- 45. Tsai BP, Wang X, Huang L, Waterman ML (2011) Quantitative profiling of in vivo‐assembled RNA‐protein complexes using a novel integrated proteomic approach. Mol Cell Proteomics 10: M110.007385 [DOI] [PMC free article] [PubMed] [Google Scholar]
- 46. Bertrand E, Chartrand P, Schaefer M, Shenoy SM, Singer RH, Long RM (1998) Localization of ASH1 mRNA particles in living yeast. Mol Cell 2: 437–445 [DOI] [PubMed] [Google Scholar]
- 47. Shalem O, Sanjana NE, Hartenian E, Shi X, Scott DA, Mikkelson T, Heckl D, Ebert BL, Root DE, Doench JG et al (2014) Genome‐scale CRISPR‐Cas9 knockout screening in human cells. Science 343: 84–87 [DOI] [PMC free article] [PubMed] [Google Scholar]
- 48. Subramanian A, Tamayo P, Mootha VK, Mukherjee S, Ebert BL, Gillette MA, Paulovich A, Pomeroy SL, Golub TR, Lander ES et al (2005) Gene set enrichment analysis: a knowledge‐based approach for interpreting genome‐wide expression profiles. Proc Natl Acad Sci USA 102: 15545–15550 [DOI] [PMC free article] [PubMed] [Google Scholar]
- 49. Stewart SA, Dykxhoorn DM, Palliser D, Mizuno H, Yu EY, An DS, Sabatini DM, Chen IS, Hahn WC, Sharp PA et al (2003) Lentivirus‐delivered stable gene silencing by RNAi in primary cells. RNA 9: 493–501 [DOI] [PMC free article] [PubMed] [Google Scholar]
- 50. Pan YB, Zhang CH, Wang SQ, Ai PH, Chen K, Zhu L, Sun ZL, Feng DF (2018) Transforming growth factor beta induced (TGFBI) is a potential signature gene for mesenchymal subtype high‐grade glioma. J Neurooncol 137: 395–407 [DOI] [PubMed] [Google Scholar]
Associated Data
This section collects any data citations, data availability statements, or supplementary materials included in this article.
Supplementary Materials
Appendix
Expanded View Figures PDF
Review Process File
Data Availability Statement
All relevant data are available from the authors. RNA‐Seq data reported in this study have been deposited with the Gene Expression Omnibus under the accession GEO ID: GSE134595 (https://www.ncbi.nlm.nih.gov/geo/query/acc.cgi?acc=GSE134595). All the other data supporting the finding of this study are available within the article and its Supplementary Information files or from the corresponding author on reasonable request.


