

SUMMARY
The thymic function to produce self-protective and self-tolerant T cells is chiefly mediated by cortical thymic epithelial cells (cTECs) and medullary TECs (mTECs). Recent studies including single-cell transcriptomic analyses have highlighted a rich diversity in functional mTEC subpopulations. Because of their limited cellularity, however, the biochemical characterization of TECs, including the proteomic profiling of cTECs and mTECs, has remained unestablished. Utilizing genetically modified mice that carry enlarged but functional thymuses, here we show a combination of proteomic and transcriptomic profiles for cTECs and mTECs, which identified signature molecules that characterize a developmental and functional contrast between cTECs and mTECs. Our results reveal a highly specific impact of the thymoproteasome on proteasome subunit composition in cTECs and provide an integrated trans-omics platform for further exploration of thymus biology.
In Brief
Ohigashi et al. show that the use of cyclin D1-transgenic mice allows quantitative proteomic analysis of cortical and medullary thymic epithelial cells (TECs). Results provide a trans-omics platform for further exploration of TEC biology and reveal the specific impact of the thymoproteasome on proteasome subunit composition in cortical TECs.
Graphical Abstract
INTRODUCTION
The thymus is a pharyngeal epithelial organ that produces T cells, which play a central role in the immune system to protect our bodies from infectious agents and transformed malignancies. The T-cell-producing function of the thymus is chiefly mediated by thymic epithelial cells (TECs) and their subpopulations (Boehm 2008; Blackburn and Manley, 2004; Rodewald, 2008). Cortical TECs (cTECs)—which structurally constitute the thymic cortex—induce the differentiation of hematopoietic progenitor cells to the T-lymphoid lineage and promote the positive selection of functionally competent T cells, whereas medullary TECs (mTECs)—which primarily form the medullary region of the thymus—attract positively selected T cells from the cortex and install self-tolerance in positively selected T cells by deleting self-reactive T cells and promoting the generation of regulatory T cells (Anderson and Takahama, 2012; Derbinski and Kyewski, 2010; Takahama et al., 2017).
Unbiased transcriptomic analysis has powerfully advanced our understanding of the biology of TECs. Global gene expression analysis has identified promiscuous gene expression in mTECs (Anderson et al., 2002; Derbinski et al., 2005; Sansom et al., 2014; Miller et al., 2018), and single-cell RNA sequencing analysis has revealed an enormous diversity in mTEC subpopulations, including the recently described thymic tuft cells (Meredith et al., 2015; Bornstein et al., 2018). In addition to transcriptomic analysis, proteomic analysis is an unbiased and powerful approach to gain insight into the molecular basis for cellular development and functions. Proteomic profiling of cTECs and mTECs is particularly interesting because these self-antigen-presenting cells possess distinct machinery of protein processing and peptide presentation to coordinately shape the immunocompetent and self-tolerant TCR repertoire in T cells (Anderson and Takahama, 2012; Klein et al., 2014; Kondo et al., 2019). In contrast to transcriptomic analysis, however, proteomic analysis has not been established in TECs and their subpopulations. This is in part due to the necessity of a large number of cells for mass spectrometric proteomic analysis (i.e., typically >5 × 10⁵ cells in one run), despite the limited availability of mouse TEC cellularity (e.g., typically <5 × 10³ cTECs sorted from one mouse) and the loss of functionally relevant molecules in the monolayer propagation of TEC lines.
In the present study, we utilized a genetically modified mouse that carries an enlarged thymus to overcome the limited availability of TECs for proteomic analysis. The keratin 5 promoter-driven epithelial cell-specific expression of cyclin D1 causes epidermal proliferation and severe thymic hyperplasia (Robles et al., 1996). The cyclin D1 expression in keratin 5-expressing TEC progenitors causes a massive enlargement of the thymus by increasing the cellularity of TECs (Klug et al., 2000). Importantly, the enlarged thymus maintains the corticomedullary structure and the capability to produce T cells (Robles et al., 1996; Klug et al., 2000; Bolner, 2015). We show that cTECs and mTECs in the enlarged thymuses of these mice are massively expanded in cellularity yet are functionally potent in supporting the development and selection of immunocompetent and self-tolerant T cells. RNA sequencing analysis verifies the developmental fidelity and functional potency of cTECs and mTECs isolated from keratin 5 promoter-driven cyclin D1-transgenic mice. By performing mass-spectrometry-based quantitative proteomic analysis of cTECs and mTECs in these mice, and in combination with RNA sequencing analysis of these cells, our integrated multi-layer omics data identify signature molecules that characterize a developmental and functional contrast between cTECs and mTECs.
By using the multi-layer omics (i.e., trans-omics) approach for the analysis of isolated TEC subpopulations, we further examined the proteomic as well as transcriptomic profiles of cTECs from β5t-deficient mice. β5t is a cTEC-specific component of the thymoproteasome, which is essential for the optimal production of immunocompetent CD8+ T cells (Murata et al., 2007; Nitta et al., 2010; Xing et al., 2013; Takada et al., 2015). It is speculated that MHC class-I-associated self-peptides produced in a cTEC-specific manner by β5t-containing thymoproteasome govern the positive selection of CD8+ T cells in the thymic cortex (Murata et al., 2007, 2018; Sasaki et al., 2015). However, it is still unclear how β5t contributes to the optimization of CD8+ T-cell development. Specifically, it is uncertain whether β5t alters the proteome and/or the transcriptome of cTECs to pervasively affect cellular functions of cTECs, in addition to providing the proteasomal uniqueness in the production of MHC class-I-associated unique self-peptides. Our trans-omics analysis reveals a highly specific impact of β5t on proteasomal subunit composition in cTECs, rather than a pervasive effect on cTEC functions, supporting the possibility that a β5t-containing thymoproteasome governs CD8+ T-cell development through the proteasomal production of MHC class-I-associated unique self-peptides in cTECs.
RESULTS
Hyperplastic Thymuses in Keratin 5 Promoter-Driven Cyclin D1-Transgenic Mice Are Capable of Producing and Selecting Functionally Competent and Self-Tolerant T Cells
It was reported that the thymuses in keratin 5 promoter-driven cyclin D1-transgenic (K5D1) mice were severely hyperplastic while maintaining the corticomedullary structure and the T-cell-producing capability (Robles et al., 1996; Klug et al., 2000; Bolner, 2015). We found that the enlarged thymuses in K5D1 mice contained approximately 80- to 100-fold larger numbers of TECs compared with the thymuses in age-matched control B6 mice (Figure 1A). The flow cytometric profiles of Ly51+ UEA1−cTECs and Ly51− UEA1+ mTECs in K5D1 thymuses were similar to those in B6 thymuses (Figures 1A and S1A). Accordingly, thymocyte cellularity in K5D1 mice increased to approximately 30- to 50-fold of that in B6 mice, without apparent alterations in CD4/CD8 and TCRβ/TCRδ profiles (Figure 1B). Similar to B6 thymuses, the cortical regions in the enlarged K5D1 thymuses were enriched with β5t+ cTECs and CD4/CD8 double-positive thymocytes, and the K5D1 thymic medullas contained Aire+ mTECs as well as CD4/CD8 single-positive thymocytes (Figure 1C). The β5t+ cTECs in K5D1 mice were functionally potent to optimize CD8+ T-cell production because CD4−CD8+ TCRβhigh thymocytes were significantly reduced in cellularity in β5t−/− K5D1 mice, in comparison with β5t+/− K5D1 mice (Figure 1D). The thymic hyperplasia in K5D1 mice coincided with an approximately 2- to 3-fold increase in the cellularity of T cells in the spleen (Figure 1E). Those spleen T cells were functionally competent to proliferate in response to allogeneic stimulator cells, but they were self-tolerant because they were unresponsive to syngeneic stimulator cells (Figure 1F). The deficiency in Aire, which controls a variety of mTEC functions including the ectopic expression of organ-specific self-antigens (Mathis and Benoist, 2009), in K5D1 mice resulted in the inflammation in various tissues, including the retinas and the salivary glands (Figure 1G), indicating that Aire+ mTECs play a role in the establishment of self-tolerance in T cells in K5D1 mice.
Figure 1. K5D1 Thymus Produces Functionally Competent and Self-Tolerant T Cells.

(A) Flow cytometric analysis of TECs from B6 and K5D1 mice. Plots on the left show the number (means and SEMs, n = 5) of CD45−EpCAM+PI− viable TECs. Dot plots on the right show UEA1 and Ly51 expression profiles of CD45−EpCAM+PI− viable TECs.
(B) Flow cytometric analysis of thymocytes from B6 and K5D1 mice. Plots on the left show the number (means and SEMs, n = 5) of total thymocytes. Dot plots on the right show CD4 and CD8 expression (left) and TCRβ and TCRδ expression (right) in PI− viable thymocytes.
(C) Immunofluorescence analysis of thymic sections from K5D1 mice. Top: β5t (green), UEA1 reactivity (blue), and Aire (magenta). Bottom: CD4 (green), CD8 (blue), and UEA1 reactivity (red). Representative data from three independent experiments are shown. Scale bars, 100 μm.
(D) Flow cytometric analysis of thymocytes from K5D1-β5t+/− heterozygous (Het) and K5D1-β5t−/− knockout (KO) mice. Plots show cell number (means and SEMs, n = 3) of CD4+CD8−TCRβhigh and CD4−CD8+TCRβhigh thymocytes.
(E) Flow cytometric analysis of spleen cells from B6 and K5D1 mice. Dot plots on the left show CD4 and CD8 expression in TCRβhigh PI− viable cells. Plots on the right show cell number (means and SEMs, n = 5) of CD4+CD8−TCRβhigh and CD4−CD8+ TCRβhigh cells.
(F) Allogenic response of spleen T cells from B6 and K5D1 mice. Cell Trace Violet (CTV)-labeled splenocytes were cultured with stimulator cells for 6 days. Dot plots on the left show CTV fluorescence and CD25 expression in TCRβhigh viable cells from K5D1 mice cultured with indicated stimulator cells. Plots on the right show the frequency (means and SEMs, n = 6) of CTVlow CD25high cells in TCRβhigh viable cells from B6 mice (left) and K5D1 mice (right). Numbers in dot plots indicate frequency of cells within indicated area.
(G) Hematoxylin- and eosin-stained sections of eyes and salivary glands from indicated mice. Bars, 100 μm. Mice were analyzed at 10 to 20 weeks old in an age-matched manner. *p < 0.05; **p < 0.01; ***p < 0.001; n.s., not significant.
These results indicate that the hyperplastic thymic microenvironments, including the massively increased cellularities of cTECs and mTECs, in K5D1 mice are functionally capable of producing and selecting immunocompetent and self-tolerant T cells. These results also suggest that the thymuses in K5D1 mice could be a useful source of cTECs and mTECs for biochemical analysis, including proteomic analysis that requires relatively large-scale cell preparation.
Isolation of cTECs and mTECs from K5D1 Mice
We then isolated cTECs and mTECs from an enlarged K5D1 thymus for transcriptomic and proteomic analyses. According to the most widely used method for TEC purification (Gray et al., 2006; Sansom et al., 2014; Meredith et al., 2015; Miller et al., 2018; Bornstein et al., 2018; Anderson et al., 1993; Sakata et al., 2018), the K5D1 thymus and control B6 thymus were enzymatically digested, and cTECs and mTECs were purified simultaneously using magnetic enrichment followed by flow cytometric cell sorting. In comparison with the previous results (Sakata et al., 2018), cTECs and mTECs distributed similarly (Figures S1B–S1D) and were isolated in an equivalent efficiency (Figure S1E) between K5D1 and B6 thymuses. Microscopic inspection of the highly purified cTECs and mTECs (Figures 2A and S2) revealed that 15% and 22% of cTECs isolated from the B6 and K5D1 thymuses, respectively, were multicellular complexes, in which the cTECs enclosed four to eight CD4+CD8+ thymocytes (Figure 2B). These multicellular cTEC-thymocyte complexes, previously described as thymic nurse cells (TNCs), resulted from persistent interactions between a fraction of cTECs and long-lived CD4+CD8+ thymocytes (Wekerle and Ketelsen, 1980; Kyewski and Kaplan, 1982; Nakagawa et al., 2012). The CD4+CD8+ thymocytes in the TNC complexes were completely enclosed within large cTECs (Wekerle and Ketelsen, 1980; Kyewski and Kaplan, 1982; Nakagawa et al., 2012) and therefore were inevitably co-purified with cTECs that were purified on the basis of cell-surface molecules. Unlike cTECs, however, mTECs did not form multicellular complexes with thymocytes (Figure 2B).
Figure 2. Isolated cTECs but not mTECs Contain Thymic Nurse Cells.

(A) Flow cytometric analysis of enzyme-digested total thymic cells (top), CD45−EpCAM+UEA1−Ly51+ isolated cTECs (middle), and CD45−EpCAM+ UEA1+Ly51− isolated mTECs (bottom) from B6 and K5D1 mice. Shown are profiles of EpCAM and CD45+PI expression in total cells (left) and UEA1 reactivity and Ly51 expression in PI−CD45−EpCAM+ viable cells (right). Numbers in dot plots indicate frequency of cells within indicated area.
(B) Confocal microscopic analysis of isolated cTECs and mTECs. Cells were fixed, permeabilized, and stained for CD45. Shown on the left are representative images of CD45+ thymocytes (green) in Ly51+ cTECs (top) and UEA1+ mTECs (bottom) isolated from B6 mice (left) and K5D1 mice (right). Left plots show the frequency of thymocyte-containing cTECs (top) and mTECs (bottom) in total cTECs and mTECs, respectively. Numbers show average frequencies. Right plots show the number of thymocytes in thymocyte-containing cTEC (top) and mTEC (bottom). Numbers show average thymocyte numbers. Means and SEMs from 10 to 20 images in two independent experiments are shown.
(C) Fluorometric measurement of RNA amount (means and SEMs, n = 3) per 5 × 10³ flow-cytometry-isolated CD4+CD8+ (DP) thymocytes, cTECs, and mTECs from K5D1 mice. Numbers (pg) show deduced average RNA amount per cell.
(D) Fluorometric measurement of protein amount (means and SEMs, n = 3) per 1 × 10⁵ flow-cytometry-isolated CD4+CD8+ (DP) thymocytes, cTECs, and mTECs from K5D1 mice. Numbers (pg) show deduced average protein amount per cell.
Consequently, we estimated the contribution of TNC-enclosed CD4+CD8+ thymocytes in RNA and protein samples prepared from cTECs. Fluorometric measurements indicated that 21.3 ± 2.5 ng (n = 3) and 5.1 ± 0.4 ng (n = 3) of RNAs could be extracted from 5 × 10³ flow-cytometry-purified cTECs and CD4+CD8+ thymocytes, respectively (Figure 2C), which deduced 4.3 ± 0.5 pg and 1.0 ± 0.1 pg of RNAs from one cTEC and one CD4+CD8+ thymocyte, respectively (Figure 2C). Because the isolated cTECs from either K5D1 or B6 mice included 15% to 22% of TNC complexes containing four to eight CD4+CD8+ thymocytes (Figure 2B), we estimated from simple calculation (RNA amount per one CD4+CD8+ thymocyte × the number of CD4+CD8+ thymocytes per one TNC × the frequency of TNCs per total cTECs / RNA amount measured in one cTEC) that 73% to 80% of RNAs extracted from the isolated cTECs were indeed derived from cTECs, and the rest (20% to 27%) of those RNAs were actually derived from TNC-enclosed CD4+CD8+ thymocytes (Figure 2C). From similar fluorometric measurements of the amounts of proteins extracted from isolated cTECs and CD4+CD8+ thymocytes, we deduced that 95% to 97% of proteins extracted from the isolated cTECs were derived from cTECs, and the rest (3% to 5%) of those proteins from the isolated cTECs were derived from TNC-enclosed CD4+CD8+ thymocytes (Figure 2D). The difference in the contribution of CD4+CD8+ thymocytes to RNA compared to protein correlated with the difference in fold change in protein amount and RNA amount between large cTECs and small CD4+CD8+ thymocytes (Figure 2D).
These results demonstrate that we can isolate cTECs and mTECs at a high purity from K5D1 mice. However, current technologies for TEC purification inevitably include TNC complexes in the isolated cTECs. In both K5D1 and B6 cTECs, it was estimated that 20% to 27% of RNA and 3% to 5% of proteins extracted from the isolated cTECs were actually derived from TNC-enclosed CD4+CD8+ thymocytes. On the contrary, mTECs did not form those multicellular complexes with thymocytes and therefore could be isolated free from thymocytes.
RNA Sequencing Analysis of cTECs and mTECs Isolated from K5D1 Mice
By using the replicates (n = 3) of these highly purified cells (Figure S2), we next examined the transcriptomic profiles of isolated cTECs and mTECs from an enlarged K5D1 thymus by RNA sequencing analysis. All experimental replicates were sequenced at approximately 2 × 10⁷ reads for 1.5 to 2 × 10⁴ genes per sample (Figure S3A). The number of genes detected was larger in mTECs than in cTECs (Figure S3B), in agreement with previously reported results (Sansom et al., 2014) and likely reflecting promiscuous gene expression in mTECs (Anderson et al., 2002; Derbinski et al., 2005; Sansom et al., 2014). Unsupervised hierarchical cluster analysis validated the experimental replicates, all of which were closely clustered with each other (Figure 3A). We found that the global profiles of gene expression were highly distinct between cTECs and mTECs (Figure 3A), in agreement with previous reports (Sansom et al., 2014; Heng et al., 2008; Immunological Genome Project, http://www.immgen.org). Importantly, those profiles were very similar between K5D1 and B6 cells (Figure 3A). Principal component analysis confirmed differences in gene expression profiles between cTECs and mTECs and the similarities between K5D1 and B6 cells (Figure 3B). The correlation plot of the fold changes between mTEC signals and cTEC signals further pointed to the sharp contrast between cTECs and mTECs and the strong similarity between K5D1 and B6 cells in the gene expression profiles (Figure 3C). Comparable distribution in the mTEC/cTEC fold changes among individual samples further highlighted the similarity in global gene expression between K5D1 and B6 cells (Figure S3C).
Figure 3. RNA Sequencing Analysis of cTECs and mTECs.

(A) Unsupervised hierarchical cluster analysis and heatmap for detected genes in cTECs and mTECs (n = 3) isolated from B6 mice and K5D1 mice.
(B) Principal component (PC) analysis of RNA sequencing data of indicated cell populations.
(C) Correlation plot analysis of the transcriptome according to log2 fold change (mTECs/cTECs) between B6 and K5D1 TECs.
(D and E) Enrichment analysis of the ontology for genes that are differently expressed (RPKM > 1, log2 fold change > 1 or < 1, Q < 0.05) between B6 and K5D1 TECs. Bars show the adjusted p values of top 5 categories enriched in mTECs (D) and cTECs (E). Numbers in parentheses indicate the number of categorized genes.
(F) Unsupervised hierarchical cluster analysis and heatmap of genes that are associated with the unique functions of cTECs and mTECs.
(G) Unsupervised hierarchical cluster analysis and heatmap of Aire-dependent (top) and Aire-independent (bottom) promiscuously expressed genes. pGE, promiscuous gene expression.
The minor difference in mTEC genes between K5D1 and B6 mice, which was detected in the secondary principal components (Figure 3B), was primarily due to the overexpressed Ccnd1, encoding cyclin D1, and other cell-cycle-associated genes, including Ccnb1 (encoding cyclin B1), Ccna2 (cyclin A2), and Fbxo5 (F-box protein 5), more strongly expressed in K5D1 mTECs than in B6 mTECs (Figure 3D). Gene Ontology enrichment analysis confirmed that differentially expressed genes between B6 mTECs and K5D1 mTECs were involved in the cell cycle, mitotic nuclear division, and cell division (Figure 3D). Ccnd1 was also overexpressed in cTECs in K5D1 mice, but the overexpression of the other cell-cycle-associated genes was not clearly highlighted in K5D1 cTECs (Figure 3E), possibly because the keratin 5 promoter-driven gene expression is less pronounced in cTECs than in mTECs and cTEC/mTEC-bipotent TEC progenitors (Klug et al., 1998) and because cTECs are less proliferative than mTECs (Gray et al., 2006). Instead, the Gene Ontology enrichment analysis revealed that the minor difference in cTEC genes between K5D1 and B6 mice (Figure 3B) predominantly resulted from the difference in the expression of adaptive immune-cell-associated genes, including Rag2 (RAG2), Zap70 (ZAP70), and Cd8a (CD8α), which were detected more in B6 cTECs than in K5D1 cTECs (Figure 3E); this coincides with the slightly higher frequency of CD4+CD8+ thymocytes enclosed in isolated B6 TNCs (eight thymocytes in 15% cTECs) than in isolated K5D1 cTECs (four thymocytes in 22% cTECs) (Figure 2B).
The expression profiles of genes that were associated with the unique functions of cTECs (e.g., Ctsl [cathepsin L], Dll4 [DLL4], Psmb11 [β5t], and Prss16 [TSSP]) and mTECs (e.g., Xcl1 [XCL1], Ccl21a [CCL21Ser], Tnfrsf11a [RANK], Tnfrsf11b [OPG], and Aire [AIRE]) were markedly different between cTECs and mTECs but were indistinguishable between the cells prepared from K5D1 mice and those from B6 mice (Figure 3F). The genes that were highly detected in mTECs over cTECs included Aire-dependent and Aire-independent promiscuously expressed genes, encoding tissue-restricted self-antigens (Figure 3G).
These results indicate that the global profiles of gene expression in cTECs and mTECs isolated from K5D1 mice are very similar to those from B6 mice, except for the overexpressed cyclin D1 and the consequent expression of cell-cycle-associated genes. Our results also reconfirm the previously described sharp contrast in gene expression profiles between cTECs and mTECs. The genes detected in isolated cTECs inevitably include TNC-enclosed CD4+CD8+ thymocyte-derived genes, which were also detected in isolated cTECs in previous reports (Sansom et al., 2014; Immunological Genome Project, http://www.immgen.org).
Proteomic and Trans-omics Analyses of cTECs and mTECs
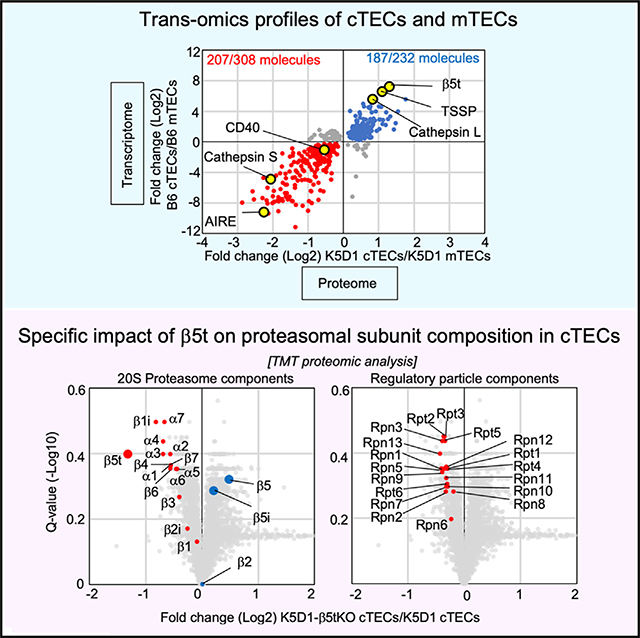
Because the use of K5D1 mice allowed us to readily collect >105 cTECs and >105 mTECs per mouse (Figure 1), and because the functional and transcriptomic profiles of cTECs and mTECs isolated from K5D1 mice were highly similar to those from B6 mice (Figures 1 and 3), we next performed mass-spectrometry-based quantitative proteomic analysis of cTECs and mTECs isolated from K5D1 mice. Proteins extracted from isolated cTECs and mTECs were digested with trypsin, and the peptides were labeled with tandem mass tags (TMTs). A high-confidence analysis at 1% false discovery rate (FDR) of liquid chromatographytandem mass spectrometric (LC-MS/MS) profiles identified and quantified 5,753 protein species from cTECs and mTECs isolated from K5D1 mice (Table S1). We found a sharp contrast between cTECs and mTECs in their proteomic profiles, including the cTEC-specific detection of cathepsin L, β5t, and TSSP proteins, which characterize functions unique to cTECs, and the mTEC-specific detection of cathepsin S, AIRE, and CD40 proteins, which characterize mTEC functions (Figure 4A).
Figure 4. Proteomic and Trans-omics Analyses of cTECs and mTECs.

(A) Volcano plot analysis of TMT-based quantitative proteomes for cTECs and mTECs. Detected proteins are plotted as log2 fold changes (K5D1 cTECs/K5D1 mTECs) versus −log10 Q values. Black horizontal line in the plot shows the Q value of 0.05.
(B and C) Correlation plot analysis of trans-omics profiles for cTECs and mTECs. Log2 fold changes of proteins differently (Q < 0.05) expressed between K5D1 cTECs and K5D1 mTECs are plotted against transcriptomic log2 fold changes between K5D1 cTECs and K5D1 mTECs (B) and B6 cTECs and B6 mTECs (C). Among the 308 molecules that are significantly (Q < 0.05) more abundant in mTECs than in cTECs in proteomic analysis, 202 (B) and 207 (C) molecules (red symbols) are more highly detected in mTECs than in cTECs in transcriptomic data. Among the 232 molecules that are significantly (Q < 0.05) more abundant in cTECs than mTECs in proteomic analysis, 199 (B) and 187 (C) molecules (blue symbols) are more highly detected in cTECs than in mTECs in transcriptomic data.
In agreement with our findings that 3% to 5% of proteins extracted from isolated cTECs were derived from TNC-enclosed CD4+CD8+ thymocytes, whereas 20% to 27% of RNAs extracted from isolated cTECs originated from TNC-enclosed CD4+CD8+ thymocytes (Figure 2), the proteomic profiles of cTECs were not as much affected by the co-isolated CD4+CD8+ thymocyte-derived proteins as were the transcriptomic profiles of cTECs (Figure S4A).
The top five proteins most abundantly detected in all TECs were kynureninase, cathepsin H, glutathione S-transferase α2, loricrin, and hornerin, all of which were relatively more abundant in mTECs than in cTECs (Table S1). The top five proteins most highly abundant in cTECs were β5t, indolethylamine N-methyltransferase, parvin β, NAD(P)H quinone dehydrogenase 1, and CD83 (Table S1).
Among the 27 promiscuously expressed tissue-restricted self-antigen genes detected in mTECs (Figure 3G), only two protein products were detected in mTECs in the proteomic analysis: Aire-dependent Hbb-y and Aire-independent Fabp9 (Table S1). The rest of these genes did not produce a detectable amount of proteins (Table S1).
This quantitative proteomic analysis identified 308 proteins that were significantly (Q < 0.05) more abundant in mTECs than in cTECs, and the combined multi-layer analysis with transcriptomic data revealed that 202 of those 308 molecules also showed significantly (Q < 0.05) higher mRNA expression in mTECs than in cTECs (Figure 4B). These molecules included nuclear proteins important for mTEC development, such as AIRE, relB, and NFκB2, as well as the recently described thymic tuft cell-associated proteins, such as DCLK1, Avil, and Trpm5 (Table S2). The rest of the molecules (308 – 202 = 106 proteins) that had significantly (Q < 0.05) higher protein expression, but not mRNA expression, in mTECs compared to cTECs included proteins with previously unknown roles in mTECs, although no clear enrichment was detected in the ontology for any biological process or cellular localization (Table S3).
On the contrary, among 232 molecules that were significantly (Q < 0.05) more abundant in cTECs than in mTECs, 199 proteins showed a significantly higher abundance in mRNA transcripts in cTECs than in mTECs (Figure 4B), which included proteolytic proteins important for cTEC functions, such as β5t, TSSP, and cathepsin L (Table S2). The rest of the molecules (232 – 199 = 33 proteins) that had significantly (Q < 0.05) higher protein expression, but not mRNA expression, in cTECs than in mTECs contained proteins with previously unknown roles in cTECs, without the enrichment of molecules in certain biological processes or cellular localization (Table S3).
In parallel, the combined multi-layer analysis of proteomic data from K5D1 TECs and transcriptomic data from B6 TECs revealed that 207 of the 308 molecules that had significantly (Q < 0.05) higher protein expression in mTECs than in cTECs in K5D1 mice showed significantly (Q < 0.05) higher mRNA expression in mTECs than cTECs in B6 mice, whereas 187 of the 232 molecules that had significantly (Q < 0.05) higher protein expression in cTECs than in mTECs in K5D1 mice showed significantly (Q < 0.05) higher mRNA expression in cTECs than in mTECs in B6 mice (Figure 4C). More than 90% (90.5% for cTECs and 92.3% for mTECs) of the molecules overlapped between the trans-omics plots using K5D1 transcriptomic profiles and the plots using B6 transcriptomic profiles (Figures 4B and 4C), reconfirming the relevance of proteomic and trans-omic profiles obtained from K5D1 TECs.
We also analyzed the molecules that were differentially detected in mRNAs but not proteins between cTECs and mTECs. We noticed that 2,989 molecules, which were significantly (Q < 0.05) more abundant in mTECs than cTECs in RNA sequencing analysis but were not detected in proteomic analysis, were highly enriched with the molecules with extracellular localization, including cytokines and chemokines such as CCL21Ser, XCL1, and IL25 (Figure S4B; Table S4). This likely reflects the removal of those secretory proteins from mTECs during single-cell preparation digested out of the thymus for proteomic and transcriptomic analyses. We also detected 1,070 kinds of mRNA transcripts that were significantly (Q < 0.05) more abundant in cTECs than in mTECs in RNA sequencing analysis but not in proteomic analysis (Table S4). The molecules that were detected abundantly only in either cTECs or mTECs in mRNAs, but not proteins, contained molecules with previously unknown roles in TECs, without showing highly biased enrichment in the ontology (Figure S4B; Table S4).
Thus, the combined proteomic and transcriptomic analyses (i.e., trans-omics analysis) identified a total of 401 molecules (202 molecules abundant in mTECs and 199 molecules in cTECs) whose mRNA and protein expression levels are significantly different between cTECs and mTECs. The results also identified many functionally unknown molecules that were detected in either cTEC or mTECs and were with discordant mRNA and protein abundance. The list of these molecules offers a useful resource for further exploring the biology of cTECs and mTECs.
RNA Sequencing Analysis of cTECs Isolated from β5t-Deficient K5D1 Mice
We then examined the transcriptomic and proteomic profiles of cTECs isolated from β5t-deficient K5D1 mice. The global profiles of gene expression in RNA sequencing analysis were highly similar between β5t−/− and β5t+/+ cTECs isolated from either K5D1 or B6 cells (Figure S5A). The principal component analysis (Figure 5A) and the fold-change correlation analysis (Figure 5B) confirmed the high similarity between β5t−/− and β5t+/+ cTECs isolated from either K5D1 or B6 cells. The minor difference between β5t−/− and β5t+/+ cTECs detected in the principal component analysis (Figure 5A) was primarily due to the difference in the expression of Psmb11, encoding β5t (Figure 5B). The difference in Psmb11 expression was robust in the RPKM (reads per kilobase of transcript, per million mapped reads) values of the RNA sequencing analysis and clearly confirmed by qRT-PCR analysis (Figure 5C). Unlike Psmb11, all other genes that were found to be prominently different in the RNA sequencing analysis between β5t−/− and β5t+/+ cTECs from either K5D1 or B6 mice were very low in the RPKM abundance, and the qRT-PCR analysis failed to reproduce the expression difference in most of those less abundant genes (Figure 5C). However, we noticed that the qRT-PCR analysis reproduced the differential expression in the functionally unknown gene Gm2004 at a significantly (p < 0.05) higher amount in β5t−/− cTECs than in β5t+/+ cTECs (Figure 5C).
Figure 5. RNA Sequencing Analysis of cTECs Isolated from β5t-Deficient Mice.

(A) Principal component (PC) analysis of RNA sequencing data of indicated cell populations. β5tKO, β5t-knockout.
(B) Correlation plot analysis of transcriptome according to log2 fold change (β5tKO cTECs/control cTECs) between B6 and K5D1 TECs. Red lines indicate −5 and 5 of log2 fold change.
(C) qPCR analysis of mRNA expression levels (means and SEMs, n = 3) of indicated genes relative to Gapdh levels in cTECs isolated from B6 and B6-β5tKO mice. Numbers at the bottom of the plots show average RPKM values and log2 fold change values (B6 cTECs/B6-β5tKO cTECs) of RNA sequencing data.
(D) qPCR analysis of mRNA expression levels (means and SEMs, n = 5 to 7) of indicated genes relative to Gapdh levels in B6 and B6-β5tKO cTECs. Numbers at the bottom of the plots show average RPKM values of RNA sequencing data.
(E) Flow cytometric analysis of β-catenin expression in cTECs. Histograms show β-catenin expression in B6-β5tHet cTECs (blue line) and B6-β5tKO cTECs (red line). Shaded area and black line represent the fluorescence in the absence of anti-β-catenin antibody in B6-β5tHet cTECs and B6-β5tKO cTECs, respectively. Plots on the right show relative fluorescence intensity index (means and SEMs, n = 3) of the fluorescence histograms.
(F) Flow cytometric analysis of semi-mature and mature thymocytes from B6-β5tHet and B6-β5tKO mice. Plots show cell numbers (means and SEMs, n = 4) of MHC class Ilow CD69high TCRβhigh CCR7high (semi-mature, SM), MHC class Ihigh CD69high TCRβhigh CCR7high (mature 1, M1), and MHC class Ihigh CD69low TCRβhigh CCR7high (mature 2, M2) subpopulations within CD4+CD8− thymocytes (left; 4SM, 4M1, and 4M2) and CD4−CD8+ thymocytes (right; 8SM, 8M1, and 8M2).
*p < 0.05; ***p < 0.001; n.s., not significant; n.d., not detected.
A recent study of RNA sequencing analysis reported that cTECs in β5t−/− mice had slightly (25% to 50%) reduced expression of cTEC genes, such as Enpep, Ly75, Ctsl, Prss16, Cxcl12, Ccl25, and Dll4, and interpreted that these reductions could reflect the acquisition of mTEC-like features by β5t−/− cTECs (Apavaloaei et al., 2019). However, none of the reported reductions in cTEC gene expression were reproduced in our data from RNA sequencing analysis or qRT-PCR measurement (Figures 5D and S5B). Some of the cTEC-associated transcripts, including Ctsl and Ccl25, were even slightly elevated in β5t−/− cTECs in qRT-PCR analysis (Figures 5D and S5B). In addition, unlike their description (Apavaloaei et al., 2019), β5t−/− cTECs showed neither the elevated expression of cell-adhesion-related genes—including Itgam, Fndc1, Col3a1, Cdh13, and Cldn4 (Figures 5D and S5B)—nor the increased abundance in β-catenin proteins (Figure 5E). Furthermore, despite their description (Apavaloaei et al., 2019), our analysis of thymocytes from B6 β5t−/− mice showed neither an increase in the number of MHC class Ihigh CD69low TCRβhigh CCR7high CD4+CD8− thymocytes (i.e., M2 CD4SP mature thymocytes) (Figures 5F and S5C) nor an increase in the expression of oxidative stress genes, including Hspa1a, Hspa1b, Fos, Jun, Gadd45a, Rhob, and Nr4a2, in TCRβhigh CD4+CD8− mature thymocytes (Figure S5D).
These results indicate that the gene expression profiles of cTECs are highly similar between β5t-deficient mice and control mice in B6 background. The pervasive effects reported in cTECs and CD4+CD8− thymocytes in β5t-deficient mice (Apavaloaei et al., 2019) are not reproduced in our β5t-deficient mice with B6 background and therefore cannot be generalized as a consequence of β5t deficiency. Their results could have been derived from the use of mice with a mixed genetic background, the use of cTECs without clarifying the purity, and/or the focus on the small difference detected by RNA sequencing analysis without confirmation by quantitative mRNA measurement (Apavaloaei et al., 2019).
To further evaluate the impact of loss of cell-type-specific β5 subunits onto TECs, we also performed the RNA sequencing analysis of mTECs and cTECs from β5i-deficient mice. The results showed similarities in gene expression profiles between TECs from B6-β5i-deficient mice and those from control B6 mice, indicating that the loss of β5i does not pervasively affect basic gene expression profiles in either mTECs or cTECs (Figure S6).
Alteration in Proteasome Components in cTECs in β5t-Deficient Mice
By the TMT-based quantitative proteomic analysis, we further examined cTECs isolated from β5t-deficient K5D1 mice and control K5D1 mice. We noticed that the proteomic profiles of cTECs were highly similar between β5t-deficient mice and control K5D1 mice (Figure 6A), in contrast to the marked difference detected in a parallel analysis between cTECs and mTECs (Figure 4A). Even though the analysis at the same stringency (Q < 0.05) as the analysis of cTECs and mTECs (Figure 4A) pointed to no significantly different molecules between β5t-deficient and control cTECs (Figure 6A), a relatively modest (Q < 0.4) but clear reduction in the abundance of β5t protein was detected in β5t-deficient cTECs (Figure 6A), in which β5t protein was completely absent (Murata et al., 2007; Ripen et al., 2011). The modest difference in the amount of β5t protein was most likely due to the well-known underestimation of the quantitative difference in the TMT-labeling strategy for proteomic analysis (Ting et al., 2011, described in detail in the STAR Methods). Nonetheless, our results revealed that among the quantified 5,753 proteins, β5t was the protein that had by far the largest difference in amount between β5t−/− and β5t+/+ cTECs (Figure 6A).
Figure 6. Alteration in Proteasome Components in cTECs in β5t-Deficient Mice.

(A) Volcano plot analysis of proteomes for K5D1-β5tKO cTECs and K5D1 cTECs. Detected proteins are plotted as log2 fold changes (K5D1-β5tKO cTECs/K5D1 cTECs) versus −log10 Q values. Black horizontal line in the plot shows the Q value of 0.05.
(B) Enrichment analysis of the ontology for proteins differently (Q < 0.4) expressed between K5D1 cTECs and K5D1-β5tKO cTECs. Bars show the adjusted p values of top 5 categories. Numbers in parentheses indicate the number of categorized proteins.
(C and D) Volcano plots for 20S proteasome components (C) and regulatory particle proteasome components (D). Plotted are log2 fold changes (K5D1-β5tKO cTECs/K5D1 cTECs) versus −log10 Q values for individual components.
(E) Label-free proteomic analysis of protein abundance of cTECs isolated from K5D1 and K5D1-β5tKO mice. Plotted are log2 fold changes (K5D1-β5tKO cTECs/K5D1 cTECs) of 20S proteasome components (left) and regulatory particle proteasome components (right) in two independent measurements.
(F) Immunoblot analysis of β5t, α6, α7, β3, Rpn1, and Rpn13 proteins in cTECs and mTECs isolated from K5D1 mice and K5D1-β5tKO mice. β-actin was examined as loading control.
(G) Immunoblot analysis of β5t, β5i, β5, β2i, β1i, β2, and β1 proteins in cTECs and mTECs isolated from K5D1 mice and K5D1-β5tKO mice. β-actin was examined as loading control. Numbers show relative amounts of the signals normalized with those of actin.
(H) Histograms show the flow cytometric detection of β5t (top) and α6 (middle) along with the background signals detected by isotype control reagents (bottom) in cTECs and mTECs from B6 mice (black line) and B6-β5tKO mice (red line). Numbers in histograms show the mean fluorescence intensity (MFI). Plots on the right show the relative fluorescence intensity indexes (RFI; means and SEMs, n = 4) of β5t (top) and α6 (bottom) expression. ***p < 0.001; n.s. not significant (comparison between B6 and KO groups).
(I) Coomassie Brilliant Blue stained SDS-PAGE gels showing the production and purification of β5t-His, β5i-His, and β5-His proteins (top). The absolute amounts of purified proteins were determined by a fluorometer and normalized to protein purity. Immunoblot analysis of indicated amounts of β5t-His, β5i-His, and β5-His proteins (middle). Standard curves between the amounts of purified β5t-His, β5i-His, and β5-His proteins on the x axis and the integrated density of the immunoblot signals on the y axis (bottom).
(J) Immunoblot analysis of β5t, β5i, and β5 proteins in indicated amounts (μg) of the lysates of cTECs and mTECs isolated from K5D1 mice and K5D1-β5tKO mice. The amounts of indicated proteins (n = 3) were deduced according to the standard curves shown in (I).
The ontology analysis for TMT-identified proteins that were differently (Q < 0.4) quantified between β5t-deficient and control cTECs revealed a highly specific alteration in proteasome components in β5t-deficient cTECs (Figure 6B). Among the 20S core particle components of the proteasomes, all seven α-ring components (α1–α7), all four non-catalytic β-ring components (β3, β4, β6, and β7), and all three thymoproteasome catalytic components (β1i, β2i, and β5t) were reduced in β5t-deficient cTECs (Figure 6C). In contrast, β5t-deficient cTECs showed a modest elevation of β5i and β5 expression (Figure 6C), which likely reflected the compensation for the loss of β5t to form the proteasome complexes, as previously reported (Murata et al., 2007, 2018; Nitta et al., 2010). All ATPase components (Rpt1–6) and non-ATPase components (Rpn1–13) of 19S regulatory particle components were also reduced in β5t-deficient cTECs (Figure 6D). It was also noted that unlike all other components of core and regulatory proteasomal particles, β2 showed no significant (Q > 0.9) differences in amount between β5t−/− and β5t+/+ cTECs (Figure 6C).
Label-free quantitative proteomic analysis (Figure 6E; Table S5) verified that in addition to the loss of β5t proteins, the majority of proteasome components were reduced in β5t-deficient cTECs. LC-MS/MS-based label-free quantification utilized the missing value imputation, which enabled the fold-change comparison of small amounts of proteins among multiple samples (Berg et al., 2019). We noticed that 10 out of 11 β5t-derived peptide signals were completely absent prior to the imputation in the label-free MS analysis of β5t-knockout cTEC samples (Table S6), reconfirming the absolute absence of actual β5t protein in β5t-deficient cTECs and suggesting that the only positively detected peptide signal actually represented a coincidentally detected false-positive signal unrelated to β5t.
In agreement with the MS measurements, immunoblot analysis demonstrated the loss in β5t subunit and the reduction in non-catalytic proteasome components (α6, α7, β3, Rpn1, and Rpn13) in cTECs from β5t-deficient mice (Figure 6F). Additional immunoblot analysis of the catalytic proteasome components reconfirmed the reduction in β1, β1i, and β2i; no apparent alteration in β2; and the increase in β5 and β5i in β5t-deficient cTECs (Figure 6G). Flow cytometric analysis further showed the complete absence of β5t and the approximately 40% reduction of α6 in cTECs from β5t-deficient mice in B6 background (Figure 6H).
To further verify the alteration in the amounts of β5 and β5i in cTECs from β5t-deficient mice, we synthesized β5, β5i, and β5t proteins in bacteria and determined their sensitivities for the absolute quantification of these proteins in immunoblot analysis (Figure 6I). Measurements of the absolute amounts of β5, β5i, and β5t proteins in equivalent amounts of TEC lysates isolated from K5D1 mice revealed that unlike β5t+/+ cTECs, which predominantly expressed the β5t subunit, the loss of β5t in β5t−/− cTECs was accompanied by the abundant expression of both β5 and β5i proteins (Figure 6J). In addition to the 2-fold increase in the absolute amount of β5i in β5t-deficient cTECs, the amount of β5 protein increased markedly, at approximately 5-fold in β5t−/− cTECs (Figure 6J). The predominant detection of β5i rather than β5 in β5t-deficient cTECs in a previous study (Nitta et al., 2010; also shown in Figure 6G) was likely due to the lower sensitivity of β5 than β5i by the antibody-mediated detection in the immunoblot analysis (Figure 6I).
These results indicate that the quantitative proteomic profiles of cTECs are highly similar between β5t−/− and β5t+/+ mice. However, the majority of proteasome components, including the 20S core particle components and the 19S regulatory particle components, are modestly but specifically reduced in the amount in cTECs as a consequence of a genetic loss of β5t. On the contrary, β5i and β5 are elevated in amount to potentially compensate the loss of β5t to maintain proteasome complexes in β5t-deficient cTECs.
No Constitutive Stress Response in cTECs in β5t-Deficient Mice
Our results indicate that β5t-deficient cTECs have modestly reduced amounts of most proteasome components. It was demonstrated that a deficiency in proteasomes would ignite a stress response in cells (Bush et al., 1997; Mathew et al., 1998). We finally examined whether the modest reduction in the amounts of many proteasome components detected in β5t-deficient cTECs would impair proteasome activity and subsequently trigger stress responses in cTECs. We found that the proteasome activity detected by a cell-permeable triple-leucine substrate-based fluorescent probe (Figure S7A) was not significantly altered in β5t-deficient cTECs, indicating that control and β5t-deficient cTECs were comparable in the chymotrypsin-like proteolytic activity of the proteasomes (Figure 7A). The absence of alteration in proteasome activity despite the reduction in the amount might be due in part to the compensatory incorporation of β5i into the proteasomes in β5t-deficient cTECs (Figure 6), which could lead to the expression of β5i-containing immunoproteasomes having higher chymotrypsin-like activity than β5t-containing thymoproteasomes (Murata et al., 2007; Sasaki et al., 2015).
Figure 7. No Constitutive Stress Response in cTECs in β5t-Deficient Mice.

(A) Proteasome activity in β5t-deficient and control cTECs. Histograms show the detection of proteasome activity by cell-permeable triple-leucine substrate-based fluorescent probe in cTECs and mTECs of B6 mice (blue line) and B6-β5tKO mice (red line). Shaded area and black line represent background fluorescence profiles without the addition of proteasome probe in B6 TECs and B6-β5tKO TECs, respectively. Plots on the right show relative fluorescence intensity index (means and SEMs, n = 10–11). B6-ctrl indicates B6 and B6-β5tHet mice. n.s., not significant.
(B) Immunoblot analysis of ubiquitin in cTECs and mTECs isolated from K5D1 and K5D1-β5tKO mice. NIH 3T3 cells with or without proteasome inhibitor MG132 treatment were also examined.
(C and D) qPCR analysis of mRNA expression levels (means and SEMs, n = 10) of p62/Sqstm1 (C) and Nrf1 (D) relative to Gapdh in cTECs and mTECs isolated from B6 and B6-β5tKO mice. n.s., not significant.
(E) Volcano plot analysis of TMT-based quantitative proteomes for K5D1-β5tKO cTECs and K5D1 cTECs, highlighting proteins with the ontology of ER stress response (yellow symbols). Detected proteins are plotted as log2 fold changes (K5D1-β5tKO cTECs/K5D1 cTECs) versus −log10 Q values. Black horizontal line in the plot shows the Q value of 0.05.
(F) Immunofluorescence analysis of LC3 (red) and β5t-venus (green) in the thymic sections of B6-β5tHet (β5tVenus/+) and B6-β5tKO (β5tVenus/Venus) mice. Representative data from two independent experiments are shown. Scale bars, 5 μm.
(G) Volcano plot analysis of TMT-based quantitative proteomes for K5D1-β5tKO cTECs and K5D1 cTECs, highlighting proteins with the ontology of autophagy (yellow symbols). Detected proteins are plotted as log2 fold changes (K5D1-β5tKO cTECs/K5D1 cTECs) versus −log10 Q values. Black horizontal line in the plot shows the Q value of 0.05.
In agreement with the lack of reduction in proteasome activity, we detected no accumulation of ubiquitinated proteins in β5t-deficient cTECs (Figures 7B and S7B), suggesting that ubiquitinated proteins were degraded in β5t-deficient cTECs. Accordingly, we detected no elevation of Sqstm1 mRNAs encoding the stress-responsive signaling adaptor protein p62 (Sánchez-Martín et al., 2019) in β5t-deficient cTECs isolated from B6 background mice (Figure 7C). We also detected no elevation of Nrf1 mRNAs in β5t-deficient cTECs (Figure 7D), a gene encoding a transcription factor that plays an essential role in the restoration of proteasome subunit genes during proteasome impairment (Koizumi et al., 2018). In addition, ontology analysis of proteomic profiles confirmed no manifestation of endoplasmic reticulum stress response in β5t-deficient cTECs (Figure 7E).
It is well appreciated that autophagy is constitutively active in cTECs even without nutritional deprivation and contributes to the optimization of self-antigen processing for inducing T-cell selection (Nedjic et al., 2008). It was therefore interesting to examine whether the loss of β5t would trigger signals to augment the constitutive autophagy in cTECs. However, we detected the comparable formation of LC3-containing autophagosomes in cTECs between B6-β5t-deficient mice and control B6 mice (Figure 7F). Proteins associated with the ontology of autophagy were neither significantly nor coordinately altered in β5t-deficient cTECs (Figure 7G).
In agreement with previous results showing the comparable expression of surface MHC-I molecules in cTECs from β5t-deficient mice of B6 background (Nitta et al., 2010) and the comparable decay in surface MHC-I molecules in embryonic fibroblasts that expressed β5t or β5i (Sasaki et al., 2015), we found that MHC-I expression and its decay in the presence of brefeldin A, representing the stability of MHC-I expression, were comparable between K5D1 cTECs and B6 cTECs in the absence or presence of β5t (Figure S7C).
These results indicate that despite the modest reduction in the amounts of many proteasome components, β5t-deficient cTECs are neither reduced in proteasomal chymotrypsin-like activity nor accumulated with ubiquitinated proteins. Consequently, the genetic loss of β5t neither triggers stress signals nor alters autophagy in cTECs.
DISCUSSION
The present results demonstrate that the enlarged thymuses in K5D1 mice are functionally potent in the production and selection of immunocompetent and self-tolerant T cells and so provide a useful source for the preparation of thymic cells, including TEC subpopulations for biochemical analysis including proteomic analysis, which requires a relatively large number of cells. In contrast to normal mice, from which fewer than 5 × 10³ cTECs and approximately 104 mTECs can be isolated per mouse (Gray et al., 2006; Sakata et al., 2018), K5D1 mice readily enable the isolation of more than 105 cTECs and more than 105 mTECs from one mouse, which would enable practical sample preparation for mass-spectrometry-based quantitative proteomic analysis of cTECs and mTECs. The results described in this study reveal previously unknown quantitative profiles of unbiased proteomes in freshly isolated cTECs and mTECs. In combination with transcriptomic analysis, our trans-omics analysis identifies signature molecules that functionally and developmentally characterize a sharp contrast between cTECs and mTECs.
The thymuses in K5D1 mice maintain the corticomedullary structure and the T-cell-producing capability (Robles et al., 1996; Klug et al., 2000; Bolner, 2015). Our results show that the flow cytometric profiles of cTECs and mTECs, as well as the CD4/CD8 and TCRβ/TCRδ profiles of thymocytes, are similar between K5D1 thymuses and B6 thymuses. Accordingly, similar to B6 thymuses, the cortical regions in the enlarged K5D1 thymuses are enriched with β5t+ cTECs and CD4/CD8 double-positive thymocytes, and the K5D1 thymic medullas contain Aire+ mTECs and CD4/CD8 single-positive thymocytes. Our results further show that β5t+ cTECs in K5D1 mice are functionally potent to optimize the CD8+ T-cell production, and Aire+ mTECs in K5D1 mice are essential for the establishment of self-tolerance in T cells. Indeed, peripheral T cells generated in K5D1 mice are functionally competent and self-tolerant. Thus, the hyperplastic thymic microenvironments, including cTECs and mTECs, in K5D1 mice are functionally capable of producing and selecting immunocompetent and self-tolerant T cells. Moreover, in comparison with previous data (Sakata et al., 2018), our results show that cTECs and mTECs can be isolated with an equivalent efficiency between K5D1 and B6 thymuses. Thus, the thymuses in K5D1 mice are a useful source of cTECs and mTECs for biochemical analysis, including proteomic analysis that requires relatively large-scale cell preparation.
Consequently, our trans-omics data (i.e., the combination of transcriptomic and proteomic data) from cTECs and mTECs offer a useful resource for further explorations of the biology of TECs and their subpopulations. The list of the molecules whose expression levels are significantly different between cTECs and mTECs coordinately in both transcriptomic and proteomic analyses can be particularly useful. For example, it was previously shown that the unique protein degradation machinery by cathepsin L, TSSP, and β5t in cTECs is important for inducing positive selection of functionally competent T cells (Murata et al., 2007; Nakagawa et al., 1998; Gommeaux et al., 2009; Kondo et al., 2019). Our trans-omics analysis identifies that in addition to cathepsin L, TSSP, and β5t, cathepsin D and calpain 1 are more abundant in cTECs than in mTECs. On the contrary, cathepsin C, cathepsin H, and cathepsin Z are expressed more abundantly in mTECs than cTECs, in addition to the previously described cathepsin S. These proteases, which are distinctively expressed in either cTECs or mTECs, may additionally play an important role in self-antigen processing for the TCR repertoire formation in T cells.
It is important to point out that cTECs isolated from either K5D1 or B6 mice contain multicellular TNC complexes that enclose CD4+CD8+ thymocytes. In comparison with cTECs, mTECs can be far more easily separated from thymocytes, so that both transcriptomic and proteomic profiles of mTECs are essentially free from signals derived from co-purified thymocytes. On the contrary, we have estimated that 20% to 27% of RNAs and 3% to 5% of proteins extracted from isolated cTECs originate from TNC-enclosed CD4+CD8+ thymocytes. Consequently, the transcriptomic profiles of cTECs are considerably affected by the co-purified CD4+CD8+ thymocytes, in agreement with the transcriptomic data of cTECs reported by other groups (Sansom et al., 2014; Immunological Genome Project, http://www.immgen.org). In contrast, the proteomic profiles of cTECs are only marginally affected by the proteins extracted from TNC-enclosed CD4+CD8+ thymocytes, so that our proteomic and trans-omics profiles of cTECs are largely free from signals derived from CD4+CD8+ thymocytes.
Our unbiased and quantitative proteomic profiles reveal a high similarity between cTECs isolated from β5t-deficient mice and those from control mice. Strikingly, however, our data also reveal that the majority of proteasome components, including the 20S core particle components and the 19S regulatory particle components, are modestly but specifically reduced in β5t-deficient cTECs. On the contrary, β5i and β5 are elevated in amount, potentially to compensate the loss of β5t and maintain proteasome complexes in β5t-deficient cTECs, as demonstrated previously (Murata et al., 2007; Nitta et al., 2010). Our RNA sequencing data show that the majority of proteasome components were not significantly altered in mRNA amount in β5t-deficient cTECs. The molecular mechanism for the coordinated reduction in the majority of proteasome components in β5t-deficient cTECs is unknown. It is known, however, that the β5 subunit acts as an intramolecular chaperone to support proteasome assembly (Chen and Hochstrasser, 1996; Hirano et al., 2008) and that β5i is incorporated preferentially over β5 into the proteasome intermediates containing β1i and β2i subunits (Griffin et al., 1998; Tanaka, 2009). It is possible that β5t is more efficient than β5i or β5 in assembling with other components to form thymoproteasomes, so that the loss of β5t gene expression may cause an inefficient proteasome assembly and thereby reduce the number of proteasomes in β5t-deficient cTECs.
Interestingly, our data further show that proteasome activity detected by a cell-permeable triple-leucine substrate-based fluorescent probe is not significantly altered in β5t-deficient cTECs, indicating that control and β5t-knockout cTECs are comparable in the chymotrypsin-like proteolytic activity of the proteasomes. We think that the proteasomes in β5t-knockout cTECs are altered in substrate preference and produce altered MHC-I-associated peptidome, as previously suggested by the experiments using embryonic fibroblasts (Sasaki et al., 2015). We speculate that the absence of alteration in triple-leucine substrate-based chymotrypsin-like activity in β5t-deficient cTECs may be due in part to the compensatory incorporation of β5i into proteasome complexes in β5t-deficient cTECs, which results in the expression of β5i-containing proteasomes having higher chymotrypsin-like activity than the β5t-containing proteasomes (Murata et al., 2007; Sasaki et al., 2015). Smaller amounts of proteasomes with higher chymotrypsin-like activity may result in no significant alteration of chymotrypsin-like activity in β5t-deficient cTECs. We are amenable to the previous suggestion that proteasomes in β5t-deficient cTECs are altered in substrate preference and produce altered MHC-I-associated peptidome. Indeed, a recent study showed that human thymoproteasomes and immunoproteasomes differ in cleavage preference quantitatively and qualitatively (Kuckelkorn et al., 2019).
We further show that despite the reduction in many proteasome components, β5t-deficient cTECs do not constitutively ignite stress responses. It was previously demonstrated that β5t-deficient cTECs are unable to optimize the production of functionally potent CD8+ T cells (Murata et al., 2018; Nitta et al., 2010; Takada et al., 2015). The present results showing the specific alteration in proteasome components in β5t-deficient cTECs without noticeable alteration in other proteins support the possibility that β5t in cTECs uniquely affects proteasome-mediated processing of self-antigen peptides, which are associated with MHC class I complexes to induce the positive selection of CD8+ T cells (Murata et al., 2007; Nitta et al., 2010; Sasaki et al., 2015; Tomaru et al., 2019), rather than pervasively affecting other biological processes in cTECs for the regulation of CD8+ T-cell production. It is important in the future to characterize MHC class-I-associated peptides displayed by cTECs in the presence or absence of β5t.
Our quantitative proteomic profiles also show that the majority of proteasome components, including the 20S core particle components and the 19S regulatory particle components, are significantly more abundant in cTECs than in mTECs. Indeed, higher proteasome activity is detected in cTECs than in mTECs. However, neither the accumulation of ubiquitinated proteins nor the elevation of p62 and Nrf1 mRNAs is detectable even in mTECs, suggesting that the proteasome activity detected in mTECs is sufficient for mTECs to maintain cellular homeostasis. As cTECs are larger in size (Nakagawa et al., 2012) and more abundant in proteins (this study) than mTECs, cTECs may require higher proteasome activity than mTECs to maintain cellular survival and functions.
Finally, our results show that the hyperplastic thymuses in K5D1 mice are functionally capable of producing and selecting immunocompetent and self-tolerant T cells. Our results also show that in comparison with the thymuses in normal B6 mice, the thymuses in K5D1 mice are massively enlarged with an approximately 80- to 100-fold larger number of TECs. Accordingly, the cellularity of thymocytes in K5D1 mice increases to approximately 30- to 50-fold the cellularity in B6 mice. We further note that T cells in the spleens of K5D1 mice are elevated in the cellularity with a 2- to 3-fold increase. It is clear that the numbers of both thymocytes and peripheral T cells are elevated proportionally with the increase in TEC cellularity, in agreement with a previous study of the engraftment of a graded number of thymic lobes (Berzins et al., 1999). However, the disparity between massive thymus enlargement and modest T-cell increase in the periphery suggests the presence of a homeostatic mechanism that limits peripheral T-cell numbers. These implications may be important to work seeking to improve the recovery of T cells in various clinical settings through the reconstitution of TECs (van den Brink et al., 2004; Chaudhry et al., 2016). It is possible that the export of mature thymocytes to the circulation is limited in the enlarged thymus in K5D1 mice, as suggested previously (Bolner, 2015).
In conclusion, the present study using K5D1 mice allows mass-spectrometry-based quantitative proteomic analysis of cTECs and mTECs. Our results reveal a highly specific impact of the thymoproteasome on proteasome subunit composition in cTECs. The reproducible reduction of proteasome components not only in β5t-deficient K5D1 cTECs, but also in β5t-deficient B6 cTECs, as well as the high similarity in transcriptomic profiles between K5D1 TECs and B6 TECs, verifies the usefulness of our proteomic profiles obtained from K5D1 TECs in studies of the biology of TECs. Although it is important in the future to reveal proteomic profiles of TECs in normal mice, the present results offer an integrated trans-omics platform for further explorations of the biology of TECs and thymic microenvironments.
STAR★METHODS
LEAD CONTACT AND MATERIALS AVAILABILITY
Further information and requests for reagents may be directed to and will be fulfilled by the Lead Contact, Yousuke Takahama (yousuke.takahama@nih.gov). This study did not generate new unique reagents.
EXPERIMENTAL MODEL AND SUBJECT DETAILS
Mice
C57BL/6 (B6) mice were obtained from SLC Japan and The Jackson Laboratory. BALB/c and DBA/2 mice as well as B6-β5i-deficient mice (Fehling et al., 1994) were obtained from The Jackson Laboratory. Keratin 5 promoter-driven cyclin D1-transgenic (K5D1) mice (Robles et al., 1996) and β5t-deficient mice (Murata et al., 2007; Ohigashi et al., 2013) were described previously and backcrossed to B6 background. For most experiments including proteomic analysis, male and female mice were analyzed at 12 to 20 weeks old in an age-matched and sex-matched manner. Mice were housed on a 12-hour light-dark cycle in climate-controlled, pathogen-free barrier facilities. All mouse experiments were performed with consent from the Animal Experimentation Committee of the University of Tokushima (T28–58) and from the Animal Care and Use Committee of the National Cancer Institute (ASP 18–431 and EIB-076–2).
Cells
NIH 3T3 cells (male) were grown in Dulbecco’s Modified Eagle Medium (Nacalai Tesque), supplemented with 10% fetal bovine serum (Invitrogen), penicillin (100 I.U./mL) and streptomycin (100 μg/mL) (GIBCO) at 37°C and 5% CO2. Where needed, NIH 3T3 cells were cultured in the presence of MG132 (100 μM) overnight.
METHOD DETAILS
Thymus section analysis
Thymus tissues were fixed with 4% (g/vol) paraformaldehyde (PFA) and embedded in OCT optimum cutting temperature compound (Sakura Finetek). Frozen thymuses were sliced into 10-μm-thick sections and stained with antibodies specific for β5t (Murata et al., 2007; MBL), Aire (Invitrogen, clone 5H12), and LC3B (Cell Signaling Technology, clone D11), followed by AlexaFluor-conjugated anti-IgG antibodies (Invitrogen). Sections were also stained for the reactivity with UEA1 (Vector Laboratories). For the staining with antibodies specific for CD4 (Invitrogen, clone RM4–5) and CD8α (Invitrogen, clone 53–6.7) in addition to the staining for the reactivity with UEA1, thymus tissues were embedded, sliced, and fixed with acetone. Images were visualized and analyzed with a TCS SP8 (Leica) or an ECLIPSE Ti2 (Nikon) confocal laser scanning microscope.
For the measurement of the area of thymic regions, frozen thymuses were sliced into 10-μm-thick sections, fixed with neutral buffered formalin, stained with hematoxylin and eosin (Muto Pure Chemicals), and imaged under an Eclipse E1000 microscope (Nikon). The areas of the cortical and medullary regions in the thymic sections were measured by using Photoshop software (Adobe).
Flow cytometric analysis
For the analysis of thymocytes and spleen cells, cells were multicolor stained for CD4 (BioLegend, clone RM4–5), CD8α (Invitrogen, clone 5H10), CD25 (BD PharMingen, clone PC61), CD69 (BD PharMingen, clone H1.2F3), H-2Kb MHC class I (Invitrogen, clone AF6–88.5.5.3), TCRβ (BioLegend, clone H57), and TCRδ (BD PharMingen, clone GL3). Where indicated, thymocytes were stained for CCR7 (Invitrogen, clone 4B12) at 37°C for 30 min before the staining with other antibodies. Multicolor flow cytometry was performed on FACSVerse, LSR II, LSRFortessa, and LSRFortessa X-20 (BD Biosciences). Flow cytometric data was analyzed using FlowJo.
Single-cell analysis and isolation of TECs
For single-cell analysis and isolation of TECs, minced thymuses were digested with 0.5 unit/mL Liberase TM (Roche) in the presence of 0.02% DNase I (Roche). Single-cell suspensions were stained for the expression of EpCAM (CD326, BioLegend, clone G8.8), CD45 (BioLegend, clone 30-F11), Ly51 (CD249, BioLegend, clone 6C3), and for the reactivity with UEA-1 (Vector Laboratories). For the intracellular staining of α6, β5t, and β-catenin in TECs, surface-stained cells were fixed with 2% (g/vol) paraformaldehyde, permeabilized with 0.05% saponin, and stained with anti-α6 antibody (Murata et al., 2007), anti-β5t antibody (Murata et al., 2007), and anti-β-catenin antibody (BD Transduction Laboratories, clone 14), followed by AlexaFluor-conjugated anti-IgG antibody (Invitrogen). For the measurement of proteasome activity in TECs, surface-stained cells were incubated with 1 μM cell-permeable fluorescent proteasome activity probe (Me4BodipyFL-Ahx3Leu3VS, Boston Biochem) at 37°C for 60 min. Where indicated, cells were incubated at 37°C for 30 min in the presence of 1 μM or 10 μM MG132 prior to the incubation with the proteasome activity probe.
For the measurement of cell-surface expression and its decay of MHC class I molecule H-2Kb (detected by clone AF6–88.5, BD Biosciences) on TECs, liberase-digested thymic cells were cultured in the presence of 5 μg/ml brefeldin A (Sigma Aldrich) for 2 and 4 hours before multicolor flow cytometric analysis of cell-surface molecules.
For the isolation of TECs, CD45− cells were enriched with magnetic-bead-conjugated anti-CD45 antibody (Miltenyi Biotec) before multicolor staining for flow cytometric cell sorting. For the isolation of TECs from enlarged K5D1 thymuses, cells were enriched by Percoll density gradient centrifugation before the magnetic enrichment of CD45− cells. Multicolor flow cytometry and cell sorting of TECs were performed on FACSVerse and FACSAria II (BD Biosciences).
Immunofluorescence analysis of isolated TECs
cTECs and mTECs were fixed with 4% (g/vol) PFA, permeabilized with 0.05% saponin, and stained with anti-CD45 antibody (BioLegend, clone 30-F11). Cells were collected on a slide glass by centrifugation at 1,800 rpm for 10 min by using Cytospin 4 (Thermo Fisher). Fluorescence images were analyzed under a TCS SP8 confocal laser scanning microscope (Leica).
Allogeneic T cell response
Spleen cells from 13~15-week-old B6 and K5D1 mice were labeled with 5 μM Cell Trace Violet (Thermo Fisher) at 37°C for 20 min. Spleen cells from 6- to 7-week-old mice were irradiated at 20 Gy for stimulator cells. Labeled cells (2 × 10⁶) were cultured with stimulator cells (8 × 10⁶) at 37°C for 6 days. Cell Trace Violet fluorescence in TCRβhigh T cells was measured by flow cytometry.
Fluorometric measurement of RNA and proteins
Total cellular RNA was extracted by using a RNeasy Plus Micro Kit (QIAGEN). For protein extraction, cells were lysed in 150 μL of 6 M guanidine-HCl containing 100 mM Tris-HCl, pH 8.0 and 2 mM DTT. The amounts of RNAs and proteins were measured using a Qubit RNA HS Assay Kit and a Qubit Protein Assay Kit, respectively, with a Qubit Fluorometer (Thermo Fisher).
RNA sequencing analysis
cDNAs were prepared from 3,000 isolated cells by using SMART-Seq v4 Ultra Low Input RNA Kit, according to the manufacturer’s protocol (Clontech). Sequencing libraries were generated by using a Nextera XT DNA Library Prep Kit, according to the manufacturer’s protocol (Illumina). The concentration of libraries was measured by an ABI PRISM 7500 Real-time PCR system in combination with a Power SYBR Green PCR Master Mix (Thermo Fisher). Single-end sequencing of cDNA libraries with a read length of 50 was performed with HiSeq 1500 platform (Illumina). Data were analyzed by using CLC Genomics Workbench 11 (QIAGEN) with default parameters.
TMT proteomic analysis
Approximately 1 to 3 × 10⁵ cells (K5D1 cTECs in quadruplicate, K5D1 mTECs in triplicate, and K5D1-β5tKO cTECs in triplicate) were lysed in 150 μL of 6 M guanidine-HCl containing 100 mM Tris-HCl, pH 8.0, and 2 mM DTT. The lysates were dissolved by heating and sonication, followed by centrifugation at 20,000 × g for 15 min at 4°C. The supernatants were reduced in 5 mM DTT at room temperature for 30 min and alkylated in 27.5 mM iodoacetamide at room temperature for 30 min in the dark. Proteins were purified by methanol/chloroform precipitation and solubilized with 25 μL of 0.1% RapiGest SF (Waters) in 50 mM triethylammonium bicarbonate buffer. After repeated sonication and vortexing, the proteins were digested with 0.5 μg of trypsin/Lys-C mix (Promega) for 16 hr at 37°C. Peptide concentration was determined using Pierce Quantitative Colorimetric Peptide Assay (Thermo Fisher). Approximately 10 μg of peptides for each sample was labeled with 0.2 mg of TMT10-plex reagents (Thermo Fisher) for 1 hr at room temperature. After the reaction was quenched with hydroxylamine, all the TMT-labeled samples were pooled, acidified with trifluoroacetic acid (TFA) and fractionated using a Pierce High pH Reversed-phase Peptide Fractionation Kit (Thermo Fisher). Ten fractions were collected using 5%, 10%, 12.5%, 15%, 17.5%, 20%, 22.5%, 25%, 50%, and 80% acetonitrile (ACN). Each fraction was evaporated in a SpeedVac concentrator and dissolved in 0.1% TFA.
LC-MS/MS analysis of the resultant peptides (1 μg each) was performed on an EASY-nLC 1200 UHPLC connected to a Q Exactive Plus mass spectrometer through a nanoelectrospray ion source (Thermo Fisher). The peptides were separated on a 75 μm inner diameter × 150 mm C18 reversed-phase column (Nikkyo Technos) with a linear gradient of 4%–20% ACN for 0–180 min and 20%–32% ACN for 180–220 min, followed by an increase to 80% ACN for 220–230 min. The mass spectrometer was operated in the data-dependent acquisition mode with a top 15 MS/MS method. MS1 spectra were measured at a resolution of 70,000, an automatic gain control (AGC) target of 3 × 10⁶ and a mass range of 375 to 1,400 m/z. HCD MS/MS spectra were acquired at a resolution of 35,000, an AGC target of 1 × 10⁵, an isolation window of 0.4 m/z, a maximum injection time of 100 msec and a normalized collision energy of 32. Dynamic exclusion was set to 30 s. Raw data were directly analyzed against Swiss-Prot database restricted to Mus musculus using Proteome Discoverer version 2.2 (Thermo Fisher) with Mascot search engine version 2.5 (Matrix Science) for identification and TMT quantification. The search parameters were (a) trypsin as an enzyme with up to two missed cleavages, (b) precursor mass tolerance of 10 ppm, (c) fragment mass tolerance of 0.02 Da, (d) TMT of lysine and peptide N terminus and carbamidomethylation of cysteine as fixed modifications, and (e) acetylation of protein N terminus and oxidation of methionine as variable modifications. Peptides and proteins were filtered at the false-discovery rate (FDR) of 1% using the percolator node and the protein FDR validator node, respectively.
Intrinsic to the TMT-MS technology, TMT target ions are frequently accompanied by a small amount of contaminating TMT ions (Ow et al., 2009; Ting et al., 2011; also described in Thermo Fisher technical information). When the amount of reporter signals from target ions is large, the contribution of the contaminating ions is negligible. However, when the amount of reporter signals from target ions is small or even zero, the contaminating ions dominate the signals and thus create bias in the quantification (Ow et al., 2009; Ting et al., 2011). In the case of TMT-MS measurement of β5t, the reason why a small amount of β5t was detected in β5t-deficient cTECs isolated from β5t-deficient mice is the detection of contaminating ions. Indeed, the abundant detection of β5t peptide signals in control cTEC samples created a precursor isolation window for all of the simultaneously analyzed samples, including cTEC samples from β5t-deficient mice. The precursor isolation window for β5t caused the distorted detection of contaminating ions in β5t-deficient cTEC samples.
Label-free proteomic analysis
Proteins were prepared as above (TMT proteomic analysis) and digested with trypsin/Lys-C mix for 16 hr at 37°C. The digests were desalted using GL-Tip SDB (GL Sciences), and the eluates were evaporated in a SpeedVac concentrator and dissolved in 0.1% TFA.
LC-MS/MS analysis of the resultant peptides (400 ng each) was performed on an EASY-nLC 1200 UHPLC connected to a Q Exactive Plus mass spectrometer. The peptides were separated with a linear gradient of 4%–28% ACN for 0–150 min followed by an increase to 80% ACN during 150–170 min. The mass spectrometer was operated in the data-dependent acquisition mode with the top 10 MS/MS method. MS1 spectra were measured at a resolution of 70,000, an AGC target of 1 × 10⁶ and a mass range of 350 to 1,500 m/z. HCD MS/MS spectra were acquired at a resolution of 17,500, an AGC target of 5 × 10⁴, an isolation window of 2.0 m/z, a maximum injection time of 60 msec and a normalized collision energy of 27. Dynamic exclusion was set to 10 s. Raw data were directly analyzed against Swiss-Prot database restricted to Mus musculus using Proteome Discoverer version 2.2 with Mascot search engine version 2.5 for identification and label-free precursor ion quantification.
The search parameters were (a) trypsin as an enzyme with up to two missed cleavages, (b) precursor mass tolerance of 10 ppm, (c) fragment mass tolerance of 0.02 Da, (d) carbamidomethylation of cysteine as a fixed modification, and (e) acetylation of protein N terminus and oxidation of methionine as variable modifications. Peptides and proteins were filtered at the FDR of 1% using the percolator node and the protein FDR validator node, respectively. Normalization was performed such that the sum total of abundance values for each sample over all peptides was the same.
Quantitative RT-PCR analysis
Total cellular RNA was reverse-transcribed (RT) with PrimeScript Reverse Transcriptase (TaKaRa). Quantitative real-time polymerase chain reaction (PCR) was performed using SYBR Premix Ex Taq (TaKaRa) and a StepOnePlus Real-Time PCR System or a QuantStudio 6 Flex Real-Time PCR System (Applied Biosystems). The amplified products were confirmed to be single bands by gel electrophoresis.
Purification of His-tag proteins
Full-length cDNAs encoding β5, β5i, and β5t were amplified from the tissues obtained from C57BL/6 mice and cloned into pET28a vector (Novagen). All constructs were verified by sequencing. BL21 (DL3) competent E. coli were transformed with the plasmids that encoded the polyhistidine-tagged (His-Tag) β5, β5i, or β5t proteins were induced by 1 mM isopropyl β-d-1-thiogalactopyranoside (IPTG) at 25°C for overnight, and purified by His Bind Kit according to the manufacturer’s protocol (Novagen).
Immunoblotting
Total cell lysates (2.5, 5, or 10 μg) were separated by electrophoresis on a 12% polyacrylamide gel and transferred onto a PVDF membrane (Millipore). After blocking with Blocking One solution (Nacalai Tesque), the membrane was incubated with primary antibodies overnight at room temperature, followed by incubation with HRP-conjugated secondary antibodies. Protein bands on the membrane were detected with a ChemiDoc Touch Imaging System (Bio-Rad) or a Light Capture II (Atto) after incubation of the membrane with Clarity Western ECL Substrate (Bio-Rad).
Gene ontology term analysis
Gene ontology for transcriptomic and proteomic data was analyzed by using DAVID Bioinformatics Resources 6.8 (https://david.ncifcrf.gov).
QUANTIFICATION AND STATISTICAL ANALYSIS
Statistical analysis was carried out using GraphPad Prism 7 software, unless otherwise noted. Statistical significance was assessed using the two-tailed unpaired Student’s t test with Welch’s correction for unequal variances. Q value was calculated using the multiple unpaired t test with the false discovery rate approach (Benjamini and Hochberg, 1995). Quantification of proteins detected by immunoblot analyses was performed by using ImageJ v1.49 software. All values are expressed as means and SEMs, unless otherwise specified. The n numbers are indicated in figure legends.
DATA AND CODE AVAILABILITY
RNA sequencing data have been deposited in The DNA Data Bank of Japan (DDBJ, https://www.ddbj.nig.ac.jp) with the accession number DRA008167 and DRA008878. MS proteomics data have been deposited to ProteomeXchange Consortium via jPOST partner repository (https://repository.jpostdb.org) with the dataset identifiers PXD013132 and PXD013133.
Supplementary Material
KEY RESOURCES TABLE.
| REAGENT or RESOURCE | SOURCE | IDENTIFIER |
|---|---|---|
| Antibodies | ||
| FITC anti-mouse CD4 antibody (RM4–5) | Invitrogen | Cat# 11–0042–85, RRID:AB_464897 |
| APC anti-mouse CD4 antibody (RM4–5) | Invitrogen | Cat# 17–0042–81, RRID:AB_469322 |
| APC-eFluor 780 anti-mouse CD4 antibody (RM4–5) | Invitrogen | Cat# 47–0042–82, RRID:AB_1272183 |
| Pacific Blue anti-mouse CD8α antibody (5H10) | Invitrogen | Cat# MCD0828TR, RRID:AB_2539693 |
| eFIuor 660 anti-mouse CD8α antibody (53–6.7) | Invitrogen | Cat# 50–0081–82, RRID:AB_10596646 |
| PE anti-mouse CD25 antibody (PC61) | BD PharMingen | Cat# 553866, RRID:AB_395101 |
| PE/Cy5 anti-mouse CD45 antibody (30F-11) | BioLegend | Cat# 103110, RRID:AB_312975 |
| FITC anti-mouse CD45 antibody (30F-11) | BioLegend | Cat# 103107, RRID:AB_312972 |
| PE/Cy7 anti-mouse CD45 Antibody (30F-11) | BioLegend | Cat# 103114, RRID:AB_312979 |
| BV421 rat anti-mouse CD45 (30F-11) | BD Horizon | Cat# 563890, RRID:AB_2651151 |
| Biotin anti-mouse CD69 antibody (H1.2F3) | BD PharMingen | Cat# 553235, RRID:AB_394724 |
| PE anti-mouse TCRβ antibody (H57) | BioLegend | Cat# 109207, RRID:AB_313430 |
| Alexa Fluor 647 anti-mouse TCRβ antibody (H57) | BioLegend | Cat# 109218, RRID:AB_493346 |
| FITC anti-mouse TCRγ/δ antibody (GL3) | BD PharMingen | Cat# 553177, RRID:AB_394688 |
| PE/Cy7 anti-mouse MHC class I (H-2Kb) antibody (AF6–88.5.5.3) | Invitrogen | Cat# 25–5958–82, RRID:AB_2573505 |
| BV786 anti-mouse MHC class I (H-2Kb) antibody (AF6–88.5) | BD OptiBuild | Cat# 742863, RRID:AB_2741105 |
| PE anti-mouse CD197 (CCR7) antibody (4B12) | Invitrogen | Cat# 12–1971–83, RRID:AB_657689 |
| PE/Cy7 anti-mouse CD326 (EpCAM) antibody (G8.8) | BioLegend | Cat# 118216, RRID:AB_1236471 |
| Brilliant Violet 421 anti-mouse CD326 (Ep-CAM) Antibody | BioLegend | Cat# 118225, RRID:AB_2563983 |
| Alexa Fluor 647 anti-mouse Ly51 antibody (6C3) | BioLegend | Cat# 108312, RRID:AB_2099613 |
| Biotin Ulex europaeus agglutinin I (UEA I) | Vector Laboratories | Cat# B-1065, RRID:AB_2336766 |
| DyLight 594 labeled Ulex Europaeus Agglutinin I (UEA I) | Vector Laboratories | Cat# DL-1067 |
| Streptavidin Alexa Fluor 546 | Invitrogen | Cat# S-11225, RRID:AB_2532130 |
| Streptavidin Alexa Fluor 594 | Invitrogen | Cat# S-11227 |
| Streptavidin APC-eFluor 780 | Invitrogen | Cat# 47–4317–82, RRID:AB_10366688 |
| Mouse anti-Catenin, beta monoclonal antibody (Clone 14) | BD Transduction Laboratories | Cat# 610154, RRID:AB_397555 |
| eFluor 660 anti-mouse Aire antibody (5H12) | Invitrogen | Cat# 50–5934–82, RRID:AB_2574257 |
| LC3B (D11) XP Rabbit mAb antibody | Cell Signaling Technology | Cat# 3868, RRID:AB_2137707 |
| Mouse anti-Ubiquitin monoclonal antibody (P4D1) | Cell Signaling Technology | Cat# 3936, RRID:AB_331292 |
| Rabbit anti-α6 antibody | Shigeo Murata, University of Tokyo | N/A |
| Rabbit anti-α7 antibody | Shigeo Murata, University of Tokyo | N/A |
| Rabbit anti-β1 antibody | Shigeo Murata, University of Tokyo | N/A |
| Rabbit anti-β1i antibody | Shigeo Murata, University of Tokyo | N/A |
| Rabbit anti-β2 antibody | Shigeo Murata, University of Tokyo | N/A |
| Rabbit anti-β2i antibody | Shigeo Murata, University of Tokyo | N/A |
| Rabbit anti-β3 antibody | Shigeo Murata, University of Tokyo | N/A |
| Rabbit anti-β5 antibody | Shigeo Murata, University of Tokyo | N/A |
| Rabbit anti-β5i antibody | Shigeo Murata, University of Tokyo | N/A |
| Rabbit anti-β5t antibody | Murata et al., 2007 | N/A |
| Rabbit anti-mouse β5t polyclonal antibody | MBL International Corporation | Cat# PD021, RRID:AB_2171885 |
| Rabbit anti-Rpn1 antibody | Shigeo Murata, University of Tokyo | N/A |
| Rat anti-Rpn13 antibody | Shigeo Murata, University of Tokyo | N/A |
| Rabbit anti-beta-Actin antibody (13E5) | Cell Signaling Technology | Cat# 4970, RRID:AB_2223172 |
| Alexa Fluor Plus 488 goat anti-mouse IgG (H+L) highly cross-adsorbed secondary antibody | Invitrogen | Cat# A32723, RRID:AB_2633275 |
| Donkey anti-rabbit IgG (H+L) antibody- Alexa Fluor 488 | Invitrogen | Cat# A-21206, RRID:AB_2535792 |
| Goat anti-rabbit IgG (H+L) antibody, Alexa Fluor 488 highly cross-adsorbed secondary antibody | Invitrogen | Cat# A-11034, RRID:AB_ 2576217 |
| Sheep anti-mouse IgG ECL antibody, HRP conjugated | GE Healthcare | Cat# NA9310–1ml, RRID:AB_772193 |
| Donkey anti-rabbit IgG ECL antibody, HRP conjugated | GE Healthcare | Cat# NA9340–1ml, RRID:AB_772191 |
| Goat anti-rat IgG, whole Ab ECL antibody, HRP conjugated | GE Healthcare | Cat# NA935, RRID:AB_772207 |
| Chemicals, Peptides, and Recombinant Proteins | ||
| Liberase TM Research Grade | Roche | Cat# 5401127001 |
| DNase I recombinant, RNase-free | Roche | Cat# 04716728001 |
| CD45 MicroBeads, mouse | Miltenyi Biotec | Cat# 130–052–301 |
| Me4BodipyFL-Ahx3Leu3VS (Proteasome activity probe) | BostonBiochem | Cat# I-190 |
| MG132 (Proteasome inhibitor) | AdooQ Bioscience | Cat# A11043 |
| MG-132, ≥ 95% by HPLC | Millipore | Cat# 474787 |
| Brefeldin A | Sigma Aldrich | Cat# B5936 |
| Critical Commercial Assays | ||
| Cell Trace Violet Cell Proliferation Kit | Thermo Fisher Scientific | Cat# C34557 |
| His Bind Purification Kit | Novagen | Cat# 70239 |
| RNeasy Plus Micro Kit | QIAGEN | Cat# 74034 |
| SMART-Seq v4 Ultra Low Input RNA Kit for Sequencing | Clontech | Cat# 634888 |
| Nextera XT DNA Library Preparation Kit | Illumina | Cat# FC-131–1024 |
| RapiGest SF Surfactant | Waters | Cat# 186001861 |
| Trypsin/Lys-C Mix, Mass Spec Grade | Promega | Cat# V5072 |
| Pierce Quantitative Colorimetric Peptide Assay | Thermo Fisher Scientific | Cat# 23275 |
| TMT10plex Isobaric Label Reagent Set | Thermo Fisher Scientific | Cat# 90309 |
| Pierce High pH Reversed-Phase Peptide Fractionation Kit | Thermo Fisher Scientific | Cat# 84868 |
| Deposited Data | ||
| RNA sequencing data | The DNA Data Bank of Japan | DRA008167, DRA008878 |
| MS proteomics data | jPOST partner repository | PXD013132, PXD013133 |
| Experimental Models: Cell Lines | ||
| NIH 3T3 | ATCC | Cat# CRL-1658, RRID:CVCL_0594 |
| Experimental Models: Organisms/Strains | ||
| Mouse: C57BL/6N | SLC Japan | N/A |
| Mouse: C57BL/6J | The Jackson Laboratory | RRID:IMSR_JAX:000664 |
| Mouse: BALB/cJ | The Jackson Laboratory | RRID:IMSR_JAX:000651 |
| Mouse: DBA/2J | The Jackson Laboratory | RRID:IMSR_JAX:000671 |
| Mouse: Keratin 5 promoter-driven Cyclin D1 Tg | Robles et al., 1996 | N/A |
| Mouse: β5t−/− (β5t Venus/Venus) | Murata et al., 2007 | N/A |
| Mouse: β5t−/− (β5t Cre/Cre) | Ohigashi et al., 2013 | N/A |
| Mouse: β5i−/− | Fehling et al., 1994 | N/A |
| Recombinant DNA | ||
| pET28a-β5 | Shigeo Murata, University of Tokyo | N/A |
| pET28a-β5i | Shigeo Murata, University of Tokyo | N/A |
| pET28a-β5t | Shigeo Murata, University of Tokyo | N/A |
| Software and Algorithms | ||
| GraphPad Prism | GraphPad Software | RRID:SCR_002798 |
| FlowJo | FlowJo | RRID:SCR_008520 |
| ImageJ | NIH | RRID:SCR_003070 |
| CLC Genomics Workbench | QIAGEN | RRID:SCR_011853 |
| DAVID | Leidos Biomedical Research, Inc | RRID:SCR_001881 |
| Proteome Discoverer | Thermo Fisher Scientific | RRID:SCR_014477 |
| Adobe Photoshop | Adobe | RRID:SCR_014199 |
Highlights.
Enlarged thymus in K5D1 mice produces immunocompetent and self-tolerant T cells
Enlarged thymus in K5D1 mice enables proteomic analysis of cTECs and mTECs
Trans-omics profiles identify signature molecules that characterize cTECs and mTECs
β5t deficiency specifically affects proteasomal subunit composition in cTECs
ACKNOWLEDGMENTS
We thank Drs. Dinah Singer, Alfred Singer, Richard Hodes, Avinash Bhandoola, and Jennifer Cowan for reading the manuscript. We also thank Hitomi Kyuma, Mie Sakata, Megumi Kawano, Felix Kalle-Youngoue, Susan Sharrow, and Alison Jacques for technical assistance. This work was supported by grants from MEXT-JSPS (16H02630 and 17K08884), the Takeda Science Foundation, Sumitomo Foundation, and Novartis Foundation for the Promotion of Science (I.O.); and by the Intramural Research Program of the NIH, the National Cancer Institute, and the Center for Cancer Research (Y. Takahama).
Footnotes
DECLARATION OF INTERESTS
The authors declare no conflicting interests.
SUPPLEMENTAL INFORMATION
Supplemental Information can be found online at https://doi.org/10.1016/j.celrep.2019.10.079.
REFERENCES
- Anderson G, and Takahama Y (2012). Thymic epithelial cells: working class heroes for T cell development and repertoire selection. Trends Immunol. 33, 256–263. [DOI] [PubMed] [Google Scholar]
- Anderson G, Jenkinson EJ, Moore NC, and Owen JJ (1993). MHC class II-positive epithelium and mesenchyme cells are both required for T-cell development in the thymus. Nature 362, 70–73. [DOI] [PubMed] [Google Scholar]
- Anderson MS, Venanzi ES, Klein L, Chen Z, Berzins SP, Turley SJ, von Boehmer H, Bronson R, Dierich A, Benoist C, and Mathis D (2002). Projection of an immunological self shadow within the thymus by the aire protein. Science 298, 1395–1401. [DOI] [PubMed] [Google Scholar]
- Apavaloaei A, Brochu S, Dong M, Rouette A, Hardy MP, Villafano G, Murata S, Melichar HJ, and Perreault C (2019). PSMB11 orchestrates the development of CD4 and CD8 thymocytes via regulation of gene expression in cortical thymic epithelial cells. J. Immunol 202, 966–978. [DOI] [PubMed] [Google Scholar]
- Benjamini Y, and Hochberg Y (1995). Controlling the false discovery rate: a practical and powerful approach to multiple testing. J. R. Stat. Soc. B 57, 289–300. [Google Scholar]
- Berg P, McConnell EW, Hicks LM, Popescu SC, and Popescu GV (2019). Evaluation of linear models and missing value imputation for the analysis of peptide-centric proteomics. BMC Bioinformatics 20, 102. [DOI] [PMC free article] [PubMed] [Google Scholar]
- Berzins SP, Godfrey DI, Miller JFAP, and Boyd RL (1999). A central role for thymic emigrants in peripheral T cell homeostasis. Proc. Natl. Acad. Sci. USA 96, 9787–9791. [DOI] [PMC free article] [PubMed] [Google Scholar]
- Blackburn CC, and Manley NR (2004). Developing a new paradigm for thymus organogenesis. Nat. Rev. Immunol 4, 278–289. [DOI] [PubMed] [Google Scholar]
- Boehm T (2008). Thymus development and function. Curr. Opin. Immunol 20, 178–184. [DOI] [PubMed] [Google Scholar]
- Bolner ML (2015). Preventing thymus involution in K5.Cyclin D1 transgenic mice sustains the naïve T cell compartment with age. UT GSBS Dissertations and Theses 636. [Google Scholar]
- Bornstein C, Nevo S, Giladi A, Kadouri N, Pouzolles M, Gerbe F, David E, Machado A, Chuprin A, Tóth B, et al. (2018). Single-cell mapping of the thymic stroma identifies IL-25-producing tuft epithelial cells. Nature 559, 622–626. [DOI] [PubMed] [Google Scholar]
- Bush KT, Goldberg AL, and Nigam SK (1997). Proteasome inhibition leads to a heat-shock response, induction of endoplasmic reticulum chaperones, and thermotolerance. J. Biol. Chem 272, 9086–9092. [DOI] [PubMed] [Google Scholar]
- Chaudhry MS, Velardi E, Dudakov JA, and van den Brink MR (2016). Thymus: the next (re)generation. Immunol. Rev 271, 56–71. [DOI] [PMC free article] [PubMed] [Google Scholar]
- Chen P, and Hochstrasser M (1996). Autocatalytic subunit processing couples active site formation in the 20S proteasome to completion of assembly. Cell 86, 961–972. [DOI] [PubMed] [Google Scholar]
- Derbinski J, and Kyewski B (2010). How thymic antigen presenting cells sample the body’s self-antigens. Curr. Opin. Immunol 22, 592–600. [DOI] [PubMed] [Google Scholar]
- Derbinski J, Gäbler J, Brors B, Tierling S, Jonnakuty S, Hergenhahn M, Peltonen L, Walter J, and Kyewski B (2005). Promiscuous gene expression in thymic epithelial cells is regulated at multiple levels. J. Exp. Med 202, 33–45. [DOI] [PMC free article] [PubMed] [Google Scholar]
- Fehling HJ, Swat W, Laplace C, Kühn R, Rajewsky K, Müller U, and von Boehmer H (1994). MHC class I expression in mice lacking the proteasome subunit LMP-7. Science 265, 1234–1237. [DOI] [PubMed] [Google Scholar]
- Gommeaux J, Grégoire C, Nguessan P, Richelme M, Malissen M, Guerder S, Malissen B, and Carrier A (2009). Thymus-specific serine protease regulates positive selection of a subset of CD4+ thymocytes. Eur. J. Immunol 39, 956–964. [DOI] [PubMed] [Google Scholar]
- Gray DH, Seach N, Ueno T, Milton MK, Liston A, Lew AM, Goodnow CC, and Boyd RL (2006). Developmental kinetics, turnover, and stimulatory capacity of thymic epithelial cells. Blood 108, 3777–3785. [DOI] [PubMed] [Google Scholar]
- Griffin TA, Nandi D, Cruz M, Fehling HJ, Kaer LV, Monaco JJ, and Colbert RA (1998). Immunoproteasome assembly: cooperative incorporation of interferon γ (IFN-γ)-inducible subunits. J. Exp. Med 187, 97–104. [DOI] [PMC free article] [PubMed] [Google Scholar]
- Heng TSP, and Painter MW; Immunological Genome Project Consortium (2008). The Immunological Genome Project: networks of gene expression in immune cells. Nat. Immunol 9, 1091–1094. [DOI] [PubMed] [Google Scholar]
- Hirano Y, Kaneko T, Okamoto K, Bai M, Yashiroda H, Furuyama K, Kato K, Tanaka K, and Murata S (2008). Dissecting β-ring assembly pathway of the mammalian 20S proteasome. EMBO J. 27, 2204–2213. [DOI] [PMC free article] [PubMed] [Google Scholar]
- Klein L, Kyewski B, Allen PM, and Hogquist KA (2014). Positive and negative selection of the T cell repertoire: what thymocytes see (and don’t see). Nat. Rev. Immunol 14, 377–391. [DOI] [PMC free article] [PubMed] [Google Scholar]
- Klug DB, Carter C, Crouch E, Roop D, Conti CJ, and Richie ER (1998). Interdependence of cortical thymic epithelial cell differentiation and T-lineage commitment. Proc. Natl. Acad. Sci. USA 95, 11822–11827. [DOI] [PMC free article] [PubMed] [Google Scholar]
- Klug DB, Crouch E, Carter C, Coghlan L, Conti CJ, and Richie ER (2000). Transgenic expression of cyclin D1 in thymic epithelial precursors promotes epithelial and T cell development. J. Immunol 164, 1881–1888. [DOI] [PubMed] [Google Scholar]
- Koizumi S, Hamazaki J, and Murata S (2018). Transcriptional regulation of the 26S proteasome by Nrf1. Proc. Jpn. Acad., Ser. B, Phys. Biol. Sci 94, 325–336. [DOI] [PMC free article] [PubMed] [Google Scholar]
- Kondo K, Ohigashi I, and Takahama Y (2019). Thymus machinery for T-cell selection. Int. Immunol 31, 119–125. [DOI] [PMC free article] [PubMed] [Google Scholar]
- Kuckelkorn U, Stübler S, Textoris-Taube K, Kilian C, Niewienda A, Henklein P, Janek K, Stumpf MPH, Mishto M, and Liepe J (2019). Proteolytic dynamics of human 20S thymoproteasome. J. Biol. Chem 294, 7740–7754. [DOI] [PMC free article] [PubMed] [Google Scholar]
- Kyewski BA, and Kaplan HS (1982). Lymphoepithelial interactions in the mouse thymus: phenotypic and kinetic studies on thymic nurse cells. J. Immunol 128, 2287–2294. [PubMed] [Google Scholar]
- Mathew A, Mathur SK, and Morimoto RI (1998). Heat shock response and protein degradation: regulation of HSF2 by the ubiquitin-proteasome pathway. Mol. Cell. Biol 18, 5091–5098. [DOI] [PMC free article] [PubMed] [Google Scholar]
- Mathis D, and Benoist C (2009). Aire. Annu. Rev. Immunol 27, 287–312. [DOI] [PubMed] [Google Scholar]
- Meredith M, Zemmour D, Mathis D, and Benoist C (2015). Aire controls gene expression in the thymic epithelium with ordered stochasticity. Nat. Immunol 16, 942–949. [DOI] [PMC free article] [PubMed] [Google Scholar]
- Miller CN, Proekt I, von Moltke J, Wells KL, Rajpurkar AR, Wang H, Rattay K, Khan IS, Metzger TC, Pollack JL, et al. (2018). Thymic tuft cells promote an IL-4-enriched medulla and shape thymocyte development. Nature 559, 627–631. [DOI] [PMC free article] [PubMed] [Google Scholar]
- Murata S, Sasaki K, Kishimoto T, Niwa S, Hayashi H, Takahama Y, and Tanaka K (2007). Regulation of CD8+ T cell development by thymus-specific proteasomes. Science 316, 1349–1353. [DOI] [PubMed] [Google Scholar]
- Murata S, Takahama Y, Kasahara M, and Tanaka K (2018). The immunoproteasome and thymoproteasome: functions, evolution and human disease. Nat. Immunol 19, 923–931. [DOI] [PubMed] [Google Scholar]
- Nakagawa T, Roth W, Wong P, Nelson A, Farr A, Deussing J, Villadangos JA, Ploegh H, Peters C, and Rudensky AY (1998). Cathepsin L: critical role in Ii degradation and CD4 T cell selection in the thymus. Science 280, 450–453. [DOI] [PubMed] [Google Scholar]
- Nakagawa Y, Ohigashi I, Nitta T, Sakata M, Tanaka K, Murata S, Kanagawa O, and Takahama Y (2012). Thymic nurse cells provide microenvironment for secondary T cell receptor α rearrangement in cortical thymocytes. Proc. Natl. Acad. Sci. USA 109, 20572–20577. [DOI] [PMC free article] [PubMed] [Google Scholar]
- Nedjic J, Aichinger M, Emmerich J, Mizushima N, and Klein L (2008). Autophagy in thymic epithelium shapes the T-cell repertoire and is essential for tolerance. Nature 455, 396–400. [DOI] [PubMed] [Google Scholar]
- Nitta T, Murata S, Sasaki K, Fujii H, Ripen AM, Ishimaru N, Koyasu S, Tanaka K, and Takahama Y (2010). Thymoproteasome shapes immunocompetent repertoire of CD8+ T cells. Immunity 32, 29–40. [DOI] [PubMed] [Google Scholar]
- Ohigashi I, Zuklys S, Sakata M, Mayer CE, Zhanybekova S, Murata S, Tanaka K, Holländer GA, and Takahama Y (2013). Aire-expressing thymic medullary epithelial cells originate from b5t-expressing progenitor cells. Proc. Natl. Acad. Sci. USA 110, 9885–9890. [DOI] [PMC free article] [PubMed] [Google Scholar]
- Ow SY, Salim M, Noirel J, Evans C, Rehman I, and Wright PC (2009). iTRAQ underestimation in simple and complex mixtures: “the good, the bad and the ugly”. J. Proteome Res 8, 5347–5355. [DOI] [PubMed] [Google Scholar]
- Ripen AM, Nitta T, Murata S, Tanaka K, and Takahama Y (2011). Ontogeny of thymic cortical epithelial cells expressing the thymoproteasome subunit β5t. Eur. J. Immunol 41, 1278–1287. [DOI] [PubMed] [Google Scholar]
- Robles AI, Larcher F, Whalin RB, Murillas R, Richie E, Gimenez-Conti IB, Jorcano JL, and Conti CJ (1996). Expression of cyclin D1 in epithelial tissues of transgenic mice results in epidermal hyperproliferation and severe thymic hyperplasia. Proc. Natl. Acad. Sci. USA 93, 7634–7638. [DOI] [PMC free article] [PubMed] [Google Scholar]
- Rodewald HR (2008). Thymus organogenesis. Annu. Rev. Immunol 26, 355–388. [DOI] [PubMed] [Google Scholar]
- Sakata M, Ohigashi I, and Takahama Y (2018). Cellularity of thymic epithelial cells in the postnatal mouse. J. Immunol 200, 1382–1388. [DOI] [PubMed] [Google Scholar]
- Sánchez-Martín P, Saito T, and Komatsu M (2019). p62/SQSTM1: ‘Jack of all trades’ in health and cancer. FEBS J. 286, 8–23. [DOI] [PMC free article] [PubMed] [Google Scholar]
- Sansom SN, Shikama-Dorn N, Zhanybekova S, Nusspaumer G, Macaulay IC, Deadman ME, Heger A, Ponting CP, and Holländer GA (2014). Population and single-cell genomics reveal the Aire dependency, relief from Polycomb silencing, and distribution of self-antigen expression in thymic epithelia. Genome Res. 24, 1918–1931. [DOI] [PMC free article] [PubMed] [Google Scholar]
- Sasaki K, Takada K, Ohte Y, Kondo H, Sorimachi H, Tanaka K, Takahama Y, and Murata S (2015). Thymoproteasomes produce unique peptide motifs for positive selection of CD8(+) T cells. Nat. Commun 6, 7484. [DOI] [PMC free article] [PubMed] [Google Scholar]
- Takada K, Van Laethem F, Xing Y, Akane K, Suzuki H, Murata S, Tanaka K, Jameson SC, Singer A, and Takahama Y (2015). TCR affinity for thymoproteasome-dependent positively selecting peptides conditions antigen responsiveness in CD8(+) T cells. Nat. Immunol 16, 1069–1076. [DOI] [PMC free article] [PubMed] [Google Scholar]
- Takahama Y, Ohigashi I, Baik S, and Anderson G (2017). Generation of diversity in thymic epithelial cells. Nat. Rev. Immunol 17, 295–305. [DOI] [PubMed] [Google Scholar]
- Tanaka K (2009). The proteasome: overview of structure and functions. Proc. Jpn. Acad., Ser. B, Phys. Biol. Sci 85, 12–36. [DOI] [PMC free article] [PubMed] [Google Scholar]
- Ting L, Rad R, Gygi SP, and Haas W (2011). MS3 eliminates ratio distortion in isobaric multiplexed quantitative proteomics. Nat. Methods 8, 937–940. [DOI] [PMC free article] [PubMed] [Google Scholar]
- Tomaru U, Konno S, Miyajima S, Kimoto R, Onodera M, Kiuchi S, Murata S, Ishizu A, and Kasahara M (2019). Restricted expression of the thymoproteasome is required for thymic selection and peripheral homeostasis of CD8+ T Cells. Cell Rep. 26, 639–651.e2. [DOI] [PubMed] [Google Scholar]
- van den Brink MR, Alpdogan O, and Boyd RL (2004). Strategies to enhance T-cell reconstitution in immunocompromised patients. Nat. Rev. Immunol 4, 856–867. [DOI] [PubMed] [Google Scholar]
- Wekerle H, and Ketelsen UP (1980). Thymic nurse cells–Ia-bearing epithelium involved in T-lymphocyte differentiation? Nature 283, 402–404. [DOI] [PubMed] [Google Scholar]
- Xing Y, Jameson SC, and Hogquist KA (2013). Thymoproteasome subunit-β5T generates peptide-MHC complexes specialized for positive selection. Proc. Natl. Acad. Sci. USA 110, 6979–6984. [DOI] [PMC free article] [PubMed] [Google Scholar]
Associated Data
This section collects any data citations, data availability statements, or supplementary materials included in this article.
Supplementary Materials
Data Availability Statement
RNA sequencing data have been deposited in The DNA Data Bank of Japan (DDBJ, https://www.ddbj.nig.ac.jp) with the accession number DRA008167 and DRA008878. MS proteomics data have been deposited to ProteomeXchange Consortium via jPOST partner repository (https://repository.jpostdb.org) with the dataset identifiers PXD013132 and PXD013133.