Abstract
Frequency-domain fluorescence spectroscopy was used to investigate the effects of temperature on the intensity and anisotropy decays of the single tryptophan residues of Staphylococcal nuclease A and its nuclease-conA-SG28 mutant. This mutant has the β-turn forming hexapeptide, Ser-Gly-Asn-Gly-Ser-Pro, substituted for the pentapeptide Tyr-Lys-Gly-Gln-Pro at positions 27–31. The intensity decays were analyzed in terms of a sum of exponentials and with Lorentzian distributions of decay times. The anisotropy decays were analyzed in terms of a sum of exponentials. Both the intensity and anisotropy decay parameters strongly depend on temperature near the thermal transitions of the proteins. Significant differences in the temperature stability of Staphylococcal nuclease and the mutant exist; these proteins show characteristic thermal transition temperatures (Tm) of 51 and 30 °C, respectively, at pH 7. The temperature dependence of the intensity decay data are shown to be consistent with a two-state unfolding model. For both proteins, the longer rotational correlation time, due to overall rotational diffusion, decreases dramatically at the transition temperature, and the amplitude of the shorter correlation time increases, indicating increased segmental motions of the single tryptophan residue. The mutant protein appears to have a slightly larger overall rotational correlation time and to show slightly more segmental motion of its Trp than is the case for the wild-type protein.
Steady-state and time-resolved fluorescence spectroscopy is widely used to characterize the structure and dynamics of proteins (Steiner, 1983; Steiner & Weinryb, 1971; Demchencko, 1986). More information is generally available from time-resolved measurements. The parameters that describe the intensity decay are generally sensitive to the protein and its structure (Beechem & Brand, 1985; Grinvald & Steinberg, 1976; Gryczynski et al., 1988; Alcala et al., 1987a,b). Time-dependent anisotropy decays of tryptophan or tyrosine residues in proteins reveal information about the overall rotational diffusion, the extent of segmental mobility of these residues, and the effect of protein conformation on the motion of the aromatic rings (Lakowicz et al., 1983; James et al., 1985; Ludescher et al., 1988). Time-resolved fluorescence measurements have thus been useful in studies of thermal and solute-induced denaturation of proteins (Eftink et al., 1989; Alcala et al., 1987a,b; Gratton & Barbieri, 1987; Gryczynski et al., 1988).
Site-directed mutagenesis has become an extremely important means for investigating the mechanism and energetics of enzyme catalysis (Fersht, 1988; Benkovic et al., 1988) and the thermodynamic stability and unfolding/refolding kinetics of globular proteins (Matthews, 1987; Schellman et al., 1981; Matsumura et al., 1988; Shortle et al., 1988; Antonio et al., 1989; Fox et al., 1986). The substitution of specific amino acid positions has been used in combination with NMR (Evans et al., 1987; Markley, 1987) and fluorescence spectroscopy to probe specific sites and to thus obtain structural/thermodynamic insights about proteins. Examples of fluorescence studies are the selective substitution of Trp residues in T4 lysozyme (wild-type has three Trp), tet repressor (wild-type has two Trp), lac repressor (wild-type has two Trp), and a bacterial lactate dehydrogenase (wild-type has three Trp) to resolve the fluorescence of the individual residues (Harris & Hudson, 1990; Royer et al., 1990; Waldman et al., 1987; Hansen et al., 1987), the introduction of Trp as a fluorescent probe in calmodulin (no Trp in wild-type) (Chabbert et al., 1989), and the substitution of other (non-Trp) residues in staphylococcal nuclease to produce mutants with possible altered structure and dynamics (and, hence, possible altered Trp fluorescence) (Eftink et al., 1989; Wages et al., 1988).
In the present report, we describe the effects of temperature on the fluorescence intensity and anisotropy decays of the single tryptophan residue (Trp-140) in Staphylococcal nuclease and its thermodynamically unstable nuclease-conA-SG28 mutant. This mutant has the hexapeptide sequence Ser-Gly-Asn-Gly-Ser-Pro substituted for the pentapeptide Tyr-Lys-Gly-Gln-Pro at the β-turn positions 27–31 of the wild-type. In a previous article, we reported studies of the unfolding of the nuclease-conA-SG28 mutant, which show it to be much less stable to thermal, solute, and pressure denaturation than the wild-type (Eftink et al., 1991). Whereas the wild-type nuclease has a Tm = 51 °C at neutral pH, the nucleaseconA-S28G mutant has a Tm = 30 °C. The fluorescence data reported here for these two proteins were obtained by the frequency-domain method, which yields good resolution of complex intensity and anisotropy decays. We have found a strong temperature dependence of the intensity and anisotropy decay parameters of these proteins. These data are considered in terms of a two-state transition for the proteins.
Experimental Procedures
Materials.
The protein samples were obtained as described in Eftink et al., (1991) and were kindly provided by Dr. R.O. Fox, Yale University. The approximate molecular mass of these proteins is 17 500 daltons. All solutions were in 0.01 M Tris-HCl and 0.1 M NaCl, pH 7.0, buffer.
Methods.
Frequency-domain measurements were performed with an instrument with an upper frequency limit of 2 GHz (Lakowicz et al., 1986b). The samples were excited at 300 nm, and emission was observed through a Schott WG 320 filter. For measurements of the intensity decay, the polarizers were at the magic-angle orientation.
Fluorescence intensity decays can be described as a sum of exponentials
| (1) |
where τi are the individual decay times and αi are the associated preexponential factors. The fractional intensity, fi, associated with each component i is given as fi = αiτi/Σαiτi.
The intensity decays can also be modeled by lifetime distributions (Vincent et al., 1988; James & Ward, 1986), which may reflect a greater level of complexity in the intensity decay (Lakowicz et al., 1987) or a distribution of conformations (Alcala et al., 1987). In this case, the preexponential factors are assumed to be continuous functions αi(τ) of the decay times τi. The intensity decay is then given by
| (2) |
where Σgi = 1.0. We chose a Lorentzian distribution for ,
| (3) |
where is the central value of the ith mode of the distribution and Γi is the full-width at half-maximum. The individual integrals ∫αi(τ)dτ are each equal to unity, and, if needed, they are normalized to account for lost amplitude below τ = 0 (Lakowicz et al., 1987). Hence, the are shape factors, and the gi are amplitude factors whose meaning is comparable to that of the preexponential (αi) factors in eq 1.
The measured quantities in the frequency domain are the phase angles (ϕω) and the modulation (mω) of the emission, measured relative to a scattering reference, over a range of circular modulation frequencies (ω = 2πF, where F is the frequency in Hertz). The parameters describing the intensity decays are determined by nonlinear least-squares fitting of the measured (ϕω and mω) to calculated values (ϕcω and mcω). These values were calculated as described previously for the multiexponential model (Lakowicz et al., 1984; Gratton et al., 1984) and for the distribution model (Lakowicz et al., 1987). The goodness-of-fit is determined from the minimum χR2.
| (4) |
where v is the number of degrees of freedom and δϕ (= 0.2) and δm (= 0.004) are the experimental uncertainties in the measured phase and modulation values. The subscript c indicates calculated value of the parameters. Global analyses were performed with the program GLOBAL (Beechem & Gratton, 1988).
The anisotropy decay can be described as a sum of exponentials
| (5) |
where θi are rotational correlation times and rogi represents the amplitude of the anisotropy that decays via the ith correlation time. In our analyses, all the individual rogi values are variable parameters. This results in the total anisotropy (ro = Σrogi) being a variable parameter.
If the total anisotropy in the absence of motion (ro) is known, the values of gi can be regarded as the fraction of the total anisotropy that decays via the ith correlation time. In the frequency domain, the anisotropy decay is determined from the differential phase angle between the polarized components of the decay and the modulated anisotropies (Lakowicz et al., 1985, 1987). In these fits to the anisotropy data, we used the intensity decay parameters from the triexponential fits to the data (Tables I and II).
Table I:
Multiexponential Analysis of Intensity Decays for Staphylococcal Nuclease A (Wild-Type)a
| temp (°C) | τ1 (ns) | α1 | τ2 (ns) | α2 | τ3 (ns) | α3 | χR2 |
|---|---|---|---|---|---|---|---|
| 10 | 5.78 | 1.0 | 33.8 | ||||
| 6.37 | 0.845 | 1.83 | 0.155 | 2.9 | |||
| 6.73 | 0.680 | 3.50 | 0.236 | 0.36 | 0.084 | 2.2 | |
| 20 | 5.34 | 1.0 | 33.7 | ||||
| 5.97 | 0.821 | 1.92 | 0.179 | 1.8 | |||
| 6.51 | 0.571 | 4.01 | 0.350 | 0.97 | 0.079 | 1.5 | |
| 30 | 4.97 | 1.0 | 36.8 | ||||
| 5.63 | 0.802 | 1.89 | 0.198 | 2.3 | |||
| 6.24 | 0.524 | 3.61 | 0.393 | 0.46 | 0.083 | 1.7 | |
| 40 | 4.50 | 1.0 | 47.0 | ||||
| 5.19 | 0.776 | 1.73 | 0.224 | 2.7 | |||
| 5.77 | 0.511 | 3.25 | 0.405 | 0.57 | 0.084 | 2.0 | |
| 45 | 4.02 | 1.0 | 49.8 | ||||
| 4.62 | 0.772 | 1.49 | 0.228 | 3.4 | |||
| 5.50 | 0.361 | 3.78 | 0.532 | 0.77 | 0.107 | 2.6 | |
| 50 | 2.62 | 1.0 | 318.3 | ||||
| 3.64 | 0.558 | 0.73 | 0.442 | 6.9 | |||
| 5.14 | 0.164 | 2.57 | 0.484 | 0.45 | 0.352 | 2.1 | |
| 55 | 2.11 | 1.0 | 690.5 | ||||
| 3.15 | 0.459 | 0.43 | 0.541 | 4.2 | |||
| 5.35 | 0.048 | 2.73 | 0.425 | 0.34 | 0.527 | 2.0 | |
| 60 | 1.14 | 1.0 | 640.6 | ||||
| 1.94 | 0.379 | 0.34 | 0.621 | 9.9 | |||
| 4.51 | 0.027 | 1.55 | 0.409 | 0.26 | 0.564 | 1.4 |
| Global Analysis | ||||||
|---|---|---|---|---|---|---|
| Ea,1 (kcal/mol) | A1 (ns−1) | Ea,2 (kcal/mol) | A2 (ns−1) | Ea,3 (kcal/mol) | A3 (ns−1) | χR2 |
| 〈1.0〉 | 0.9869 | 1.76 | 8.54 | 〈4.0〉 | 1383 | 8.7 |
All χR2 are calculated with δϕ = 0.2° and δm = 0.004. For the global analysis, Ea,1 and Ea,3 were fixed. The α1 and α3 values for the global analysis are given in Figure 10 as the open symbols; α2 is 1 – α1 – α3 and is not shown.
Table II:
Multiexponential Analysis of Intensity Decays for Nuclease-ConA-S28Ga
| temp (°C) | τ1 (ns) | α1 | τ2 (ns) | α2 | τ3 (ns) | α3 | χR2 |
|---|---|---|---|---|---|---|---|
| 10 | 5.34 | 1.0 | 82.8 | ||||
| 6.11 | 0.792 | 1.38 | 0.208 | 2.2 | |||
| 6.61 | 0.597 | 3.80 | 0.261 | 0.85 | 0.143 | 1.6 | |
| 20 | 4.92 | 1.0 | 89.4 | ||||
| 5.69 | 0.777 | 1.31 | 0.223 | 2.1 | |||
| 6.27 | 0.520 | 3.79 | 0.313 | 0.84 | 0.157 | 1.5 | |
| 25 | 4.54 | 1.0 | 142.7 | ||||
| 5.35 | 0.749 | 1.00 | 0.251 | 2.1 | |||
| 6.06 | 0.461 | 3.77 | 0.334 | 0.73 | 0.205 | 1.5 | |
| 30 | 3.89 | 1.0 | 311.1 | ||||
| 4.82 | 0.669 | 1.75 | 0.331 | 2.6 | |||
| 5.31 | 0.482 | 2.92 | 0.233 | 0.55 | 0.285 | 1.3 | |
| 35 | 2.67 | 1.0 | 599.2 | ||||
| 3.71 | 0.550 | 0.53 | 0.450 | 2.2 | |||
| 4.35 | 0.284 | 2.76 | 0.294 | 0.46 | 0.422 | 1.1 | |
| 40 | 1.84 | 1.0 | 583.1 | ||||
| 2.74 | 0.485 | 0.44 | 0.515 | 3.3 | |||
| 3.59 | 0.162 | 2.07 | 0.362 | 0.34 | 0.476 | 1.4 | |
| 45 | 1.45 | 1.0 | 558.0 | ||||
| 2.12 | 0.475 | 0.31 | 0.525 | 5.1 | |||
| 3.27 | 0.090 | 1.69 | 0.417 | 0.24 | 0.493 | 1.1 |
| Global Analysis | ||||||
|---|---|---|---|---|---|---|
| Ea,1 (kcal/mol) | A1 (ns−1) | Ea,2 (kcal/mol) | A2 (ns−1) | Ea,3 (kcal/mol) | A3 (ns−1) | χR2 |
| 〈1.0〉 | 0.977 | 1.88 | 9.66 | 〈4.0〉 | 1901 | 4.2 |
All χR2 are calculated with δϕ = 2.0° and δm = 0.004. For the global analysis, Ea,1 and Ea,3 were fixed. The α1 and α3 for the global analysis are given in Figure 10 as the open symbols.
Results
Intensity Decays.
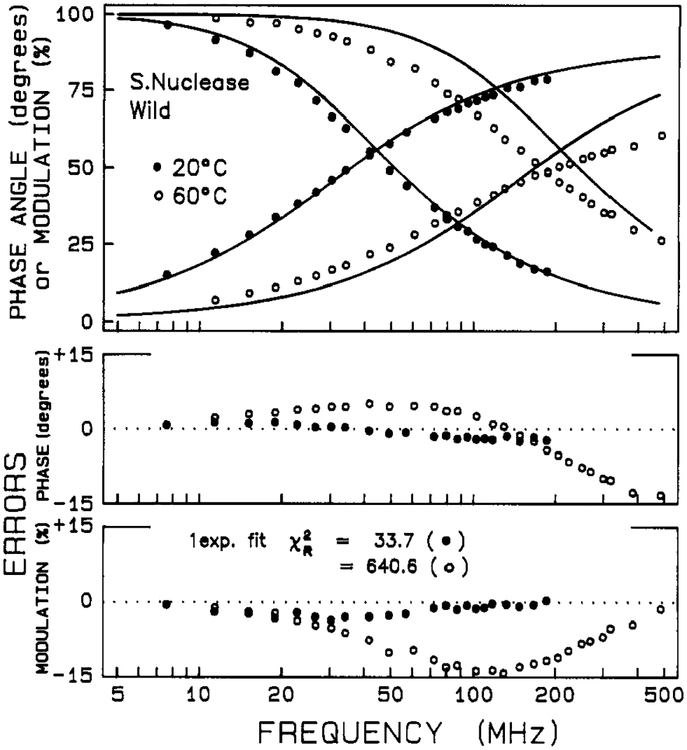
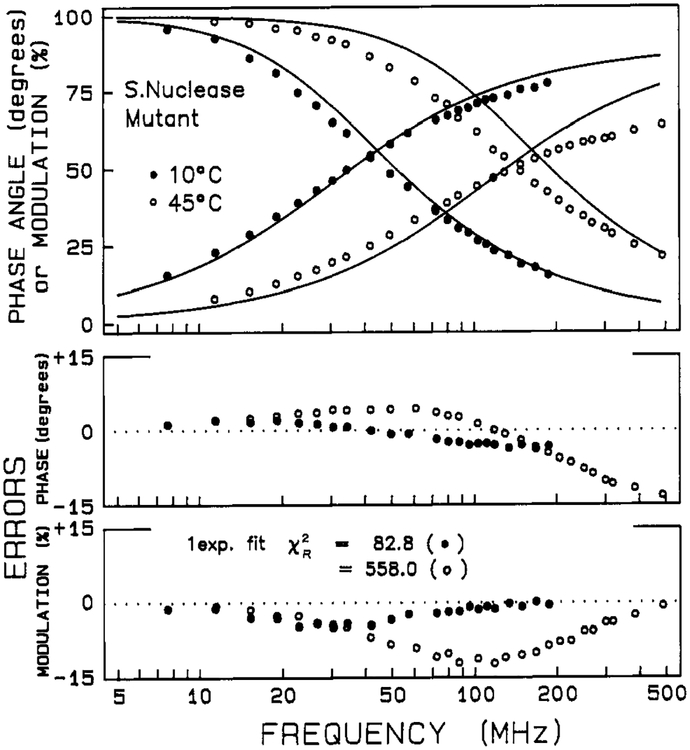
Phase and modulation data for intensity decays of Staphylococcal nuclease and its mutant are shown in Figures 1 and 2, respectively. The solid lines show the best single-exponential fits. At low temperature the decays are nearly a single exponential (i.e., χR2 = 33 and 83 for wild-type and mutant at 10 °C), but at elevated temperatures the decays depart significantly from a single exponential (i.e., χR2 = 640 for the wild-type at 60 °C and χR2 = 560 for the mutant at 45 °C). In Tables I and II are given parameters for mono-, bi-, and triexponential decay fits for the two proteins as a function of temperature. In the low-temperature range, the data are well described by either a biexponential or triexponential decay law, but at the higher temperatures a triexponential decay is required. There is a decrease in the weighted average fluorescence lifetime 〈τ〉 with increasing temperature. For the biexponential and triexponential fits, there is also a decrease in τ1 and τ2 with increasing temperature.
FIGURE 1:
Phase and modulation data for the intensity decay of wild-type nuclease. The solid lines show the best single-exponential fit.
FIGURE 2:
Phase and modulation data for the intensity decay of mutant nuclease-conA-SG28. The solid lines show the best single-exponential fit.
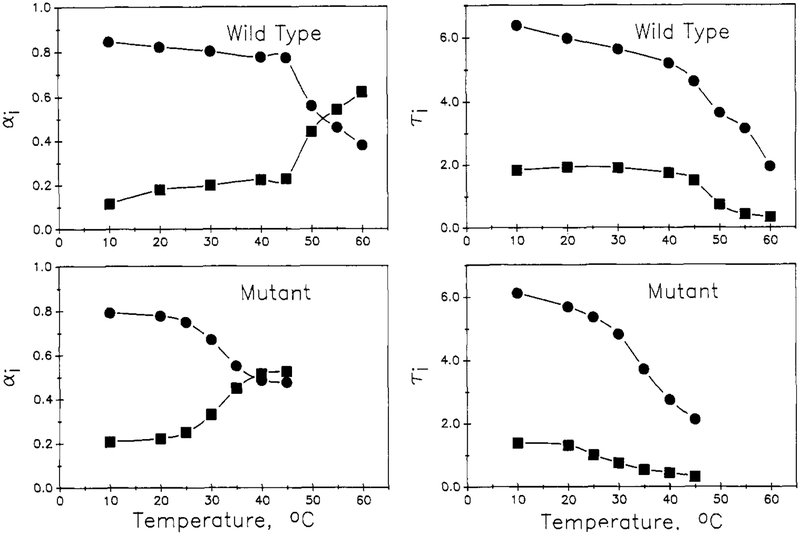
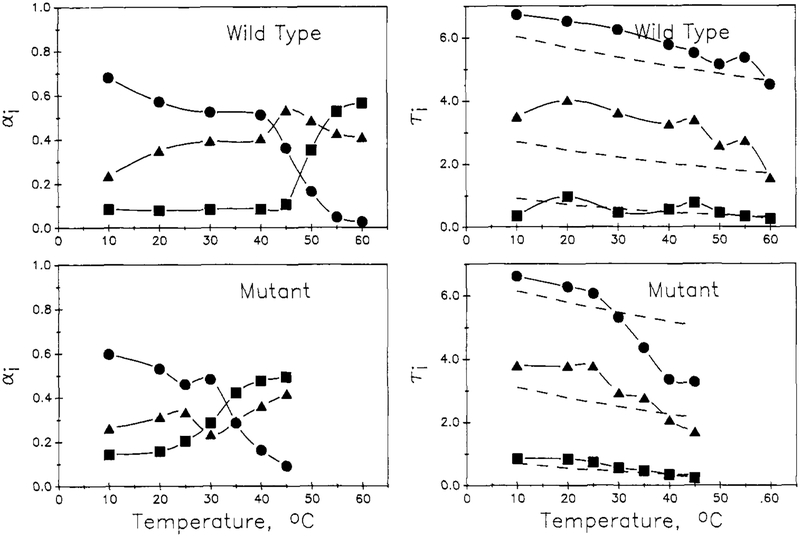
The temperature dependence of the decay parameters appears to reflect the thermal unfolding transitions of the two proteins. In Figures 3 and 4 are shown plots of the τi and preexponential αi parameters, for both the biexponential (Figure 3) and triexponential (Figure 4) fits, as a function of temperature for the two proteins. For the biexponential fitting parameters, the preexponential for the longer lived component, α1, is found to drop with an inflection near the thermal transition temperature, Tm, of 30 and 51 °C for the mutant and wild-type proteins, respectively. The α2 value increases in a complementary manner. Both the long (τ1) and short (τ2) lifetimes are found to decrease with increasing temperature and to show an inflection at the Tm range. For the triexponential fitting parameters, the long-lived component α1 decreases with increasing temperature, with an inflection near Tm; likewise, the preexponential for the shortest component, a3, increases with temperature, with an inflection near Tm. The preexponential for the intermediate component, α2, shows a general increase with temperature with a blip near Tm. For wild-type nuclease, the τi for the triexponential fit show a gradual decrease with temperature, as expected for an Arrhenius type of behavior. For the mutant, however, the τi for the triexponential fit each show an inflection near Tm. Under Discussion, we will show how these temperature-dependence patterns can be related to the thermal transition of the proteins.
FIGURE 3:
Temperature dependence of the preexponential αi and τi for biexponential fits for wild-type (top) and mutant (bottom) proteins. Long lifetime parameters (●) and short lifetime parameters (■) are given.
FIGURE 4:
Temperature dependence of the preexponential αi and τi for triexponential fits for wild-type (top) and mutant (bottom) proteins. Long lifetime (●), medium lifetime (▲), and short lifetime (■) are given. In the lifetime profiles (right), the dashed lines are the temperature-dependence profiles from the global Arrhenius analysis (see Discussion). For the wild-type, these dashed lines are for Ea,1 = 1.0 kcal/mol and A1 = 0.987 ns−1 for τ1; Ea,2 = 1.76 kcal/mol and A2 = 8.54 ns−1 for τ2; and Ea,3 = 4.0 kcal/mol and A3 = 1901 ns−1 for τ3.
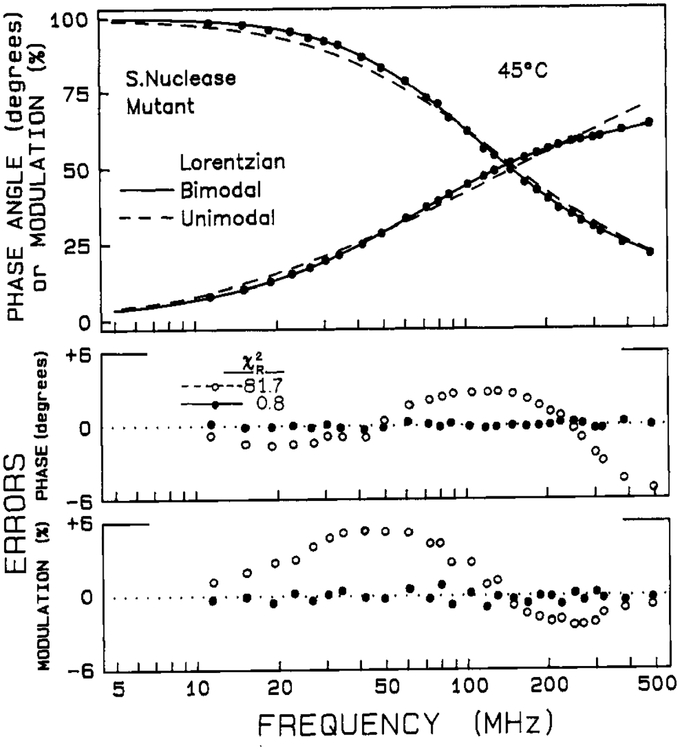
The intensity decay data were also analyzed by using Lorentzian unimodal and bimodal distributions of decay times. Representative data and fits are shown in Figure 5. In Tables III and IV are listed parameters for both unimodal and bimodal fits for the wild-type and mutant proteins as a function of temperature. A unimodal distribution adequately describes the data in the low-temperature range for both proteins. For wild-type nuclease, the resulting decreases monotonically with increasing temperature from 10–45 °C, and the distribution width Γ remains constant within this range. At temperatures in and above the Tm region, however, a bimodal distribution is required. This bimodal distribution model contains five variable parameters (, , Γ1, Γ2, and g1), which is the same number as the triexponential (discrete) model (τl, τ2, τ3, α1, and α2). Not surprisingly, these two models yield equivalent values of χR2 for fits to the high-temperature data (see Tables I–IV), and a choice between a distribution and discrete model cannot be made. It is noted that the centers, , of the bimodal distributions agree well with the τi for the discrete biexponential fits.
FIGURE 5:
Lifetime distribution fit for the tryptophan intensity decay of the nuclease-conA-SG28 mutant staphylococcal nuclease. The values of χR2 are 81.7 and 0.8 for the unimodal and bimodal fits, respectively.
Table III:
Lifetime Distribution Parameters for Staphylcoccal Nuclease A (Wild-Type)
| temp (°C) | Γ1 (ns) | g1 | Γ2 (ns) | g2 | χR2 | ||
|---|---|---|---|---|---|---|---|
| 10 | 6.21 | 1.08 | 1.0 | 2.2 | |||
| 6.28 | 0.87 | 0.972 | 1.67 | 2.63 | 0.028 | 2.4 | |
| 20 | 5.75 | 1.04 | 1.0 | 1.5 | |||
| 5.85 | 0.86 | 0.969 | 2.12 | 1.34 | 0.031 | 1.5 | |
| 30 | 5.36 | 1.05 | 1.0 | 1.7 | |||
| 5.49 | 0.86 | 0.985 | 2.31 | 0.90 | 0.035 | 1.8 | |
| 40 | 4.89 | 1.08 | 1.0 | 2.05 | |||
| 5.08 | 0.75 | 0.943 | 2.04 | 0.87 | 0.057 | 2.2 | |
| 45 | 4.35 | 1.01 | 1.0 | 2.6 | |||
| 4.54 | 0.67 | 0.938 | 1.79 | 0.80 | 0.062 | 2.8 | |
| 50 | 3.03 | 2.28 | 1.0 | 8.6 | |||
| 3.45 | 1.22 | 0.873 | 0.78 | 1.51 | 0.127 | 2.3 | |
| 55 | 2.40 | 2.78 | 1.0 | 49.8 | |||
| 3.09 | 0.77 | 0.841 | 0.23 | 0.72 | 0.159 | 2.1 | |
| 60 | 1.23 | 1.75 | 1.0 | 17.1 | |||
| 1.88 | 0.69 | 0.618 | 0.37 | 1.18 | 0.382 | 2.2 |
Table IV:
Lifetime Distribution Parameters for Nuclease-ConA-S28G
| temp (°C) | Γ1 (ns) | g1 | Γ2 (ns) | g2 | χR2 | ||
|---|---|---|---|---|---|---|---|
| 10 | 5.91 | 1.67 | 1.0 | 2.2 | |||
| 6.14 | 0.78 | 0.928 | 1.79 | 2.22 | 0.072 | 1.7 | |
| 20 | 5.45 | 1.64 | 1.0 | 2.2 | |||
| 5.71 | 0.71 | 0.920 | 1.41 | 1.41 | 0.080 | 1.5 | |
| 25 | 5.13 | 1.93 | 1.0 | 4.0 | |||
| 5.43 | 0.61 | 0.910 | 1.35 | 1.65 | 0.090 | 1.4 | |
| 30 | 4.49 | 2.52 | 1.0 | 13.3 | |||
| 4.92 | 0.56 | 0.878 | 0.98 | 1.64 | 0.122 | 1.3 | |
| 35 | 3.15 | 2.79 | 1.0 | 33.5 | |||
| 3.81 | 0.36 | 0.836 | 0.66 | 0.89 | 0.164 | 1.3 | |
| 40 | 2.11 | 2.19 | 1.0 | 29.7 | |||
| 2.82 | 0.32 | 0.746 | 0.53 | 1.02 | 0.254 | 1.5 | |
| 45 | 1.65 | 1.75 | 1.0 | 30.3 | |||
| 2.14 | 0.25 | 0.601 | 0.11 | 1.75 | 0.399 | 1.1 |
Anisotropy Decays.
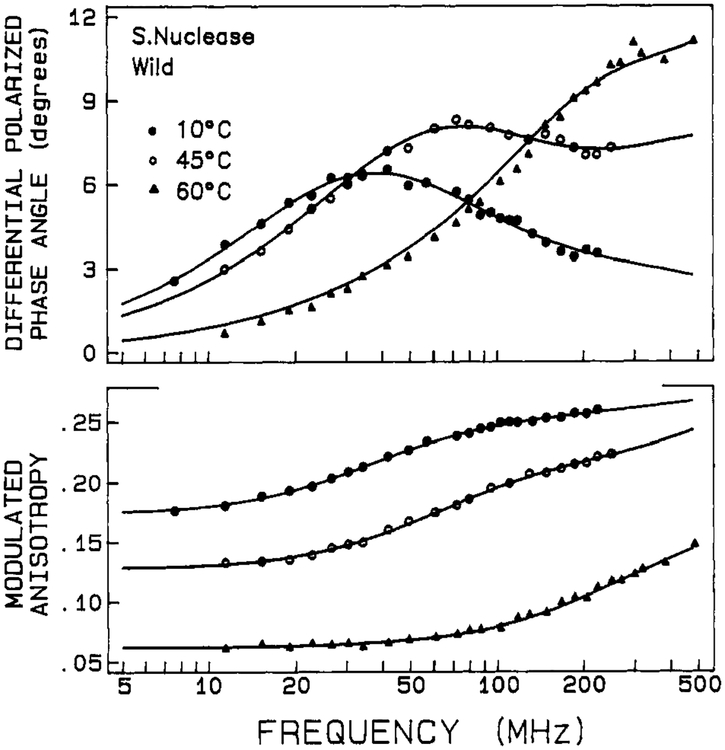
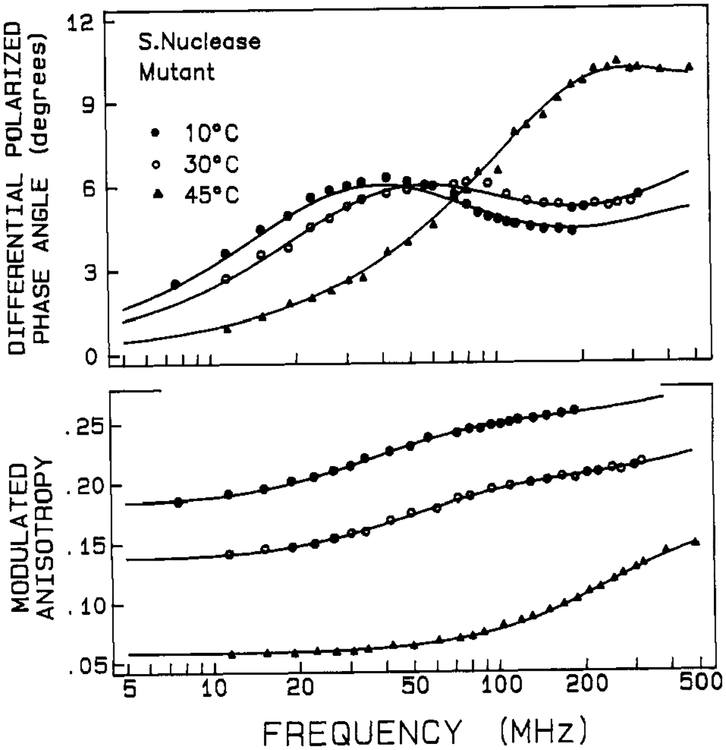
Frequency domain anisotropy decay data are shown in Figures 6 and 7 for the wild-type and mutant proteins, respectively. These data were fitted with a biexponential anisotropy decay law, and the results are given in Tables V and VI for the two proteins. The χR2 for monoexponential fits are also given for comparison, but they are inferior to the biexponential fits.
FIGURE 6:
Differential phase and modulated anisotropy data for anisotropy decays of wild-type nuclease. The solid lines show the best fit to two correlation times.
FIGURE 7:
Differential phase and modulated anisotropy data for anisotropy decays of nuclease-conA-SG28. The solid lines show the best fit to two correlation times.
Table V:
Anisotropy Decay Parameters for Staphylococcal Nuclease (Wild-Type)
| temp (°C) | θ1 (ns) | r0g1 | θ2 (ns) | r0g2 | χR2 |
|---|---|---|---|---|---|
| 10 | 12.91 | 0.254 | 0.36 | 0.025 | 1.0 (5.1)a |
| 20 | 10.45 | 0.249 | 0.43 | 0.035 | 0.9 (9.2) |
| 30 | 8.67 | 0.237 | 0.24 | 0.040 | 1.8 (8.5) |
| 40 | 7.04 | 0.221 | 0.34 | 0.051 | 0.9 (17.3) |
| 45 | 5.75 | 0.212 | 0.23 | 0.091 | 1.1 (24.7) |
| 50 | 4.07 | 0.191 | 0.17 | 0.115 | 0.9 (32.5) |
| 55 | 0.86 | 0.127 | 0.15 | 0.160 | 2.1 (5.0) |
| 60 | 0.85 | 0.108 | 0.12 | 0.185 | 2.2 (7.4) |
Goodness of fit for a single-component anisotropy decay fit is given in parentheses. The triexponential intensity decay parameters in Table I were used to analyze the data.
Table VI:
Anisotropy Decay Parameters for Nuclease-ConA-S28G
| temp (°C) | θ1 (ns) | r0g1 | θ2 (ns) | r0g2 | χR2 |
|---|---|---|---|---|---|
| 10 | 14.34 | 0.253 | 0.24 | 0.064 | 0.9 (12.0)a |
| 20 | 11.31 | 0.241 | 0.30 | 0.052 | 0.8 (13.3) |
| 25 | 10.39 | 0.229 | 0.23 | 0.073 | 0.8 (17.4) |
| 30 | 8.85 | 0.198 | 0.17 | 0.096 | 0.9 (40.0) |
| 35 | 4.64 | 0.146 | 0.09 | 0.173 | 1.5 (30.8) |
| 40 | 1.34 | 0.133 | 0.08 | 0.178 | 0.8 (7.7) |
| 45 | 0.83 | 0.143 | 0.07 | 0.158 | 0.9 (5.1) |
Goodness of fit for a single-component anisotropy decay fit is given in parentheses. The triexponential intensity decay parameters in Table II were used to analyze the data.
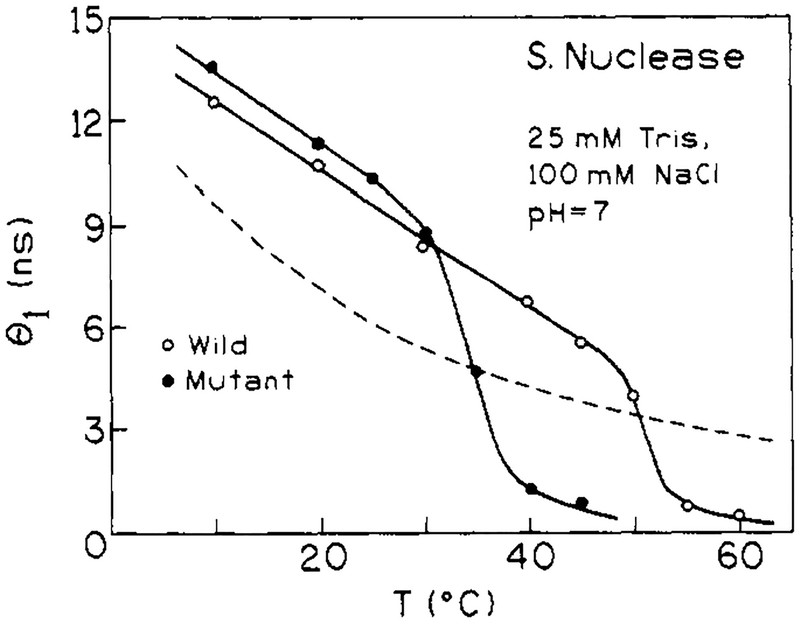
For both proteins in the low-temperature range, the anisotropy decay is dominated by a long (10–14 ns) rotational correlation time θ1. There is also a subnanosecond rotational correlation time, θ2, having a relatively smaller amplitude (defined as giro). The values of θ1 (i.e., at 10 °C) are in reasonable agreement with the value expected for overall rotational diffusion of these globular proteins. For a spherical macromolecule of molecular weight 17 500 and degree of hydration of 0.3 cm3/g, a rotational correlation time is calculated to be 10.0 ns (i.e., calculated as = , where M is molecular weight, is a partial specific volume of 0.73 cm3/g, h is the degree of hydration, and η is the viscosity of water at 283 K). Our value of θ1 for wild-type nuclease is also in agreement with previously published values, when differences in temperature are considered (Munro et al., 1979; Brochon et al., 1974; Lakowicz et al., 1986a). The value of θ1 for the mutant protein, in the 10–30 °C range, is about 10% higher than the value for the wild-type protein. The subnanosecond θ2 values are consistent with there being a small degree of rapid segmental motion of the Trp-140 residues. While the θ2 values appear similar for the wild-type and mutant proteins (at low temperature), the amplitude associated with this rapid component is significantly larger for the mutant protein.
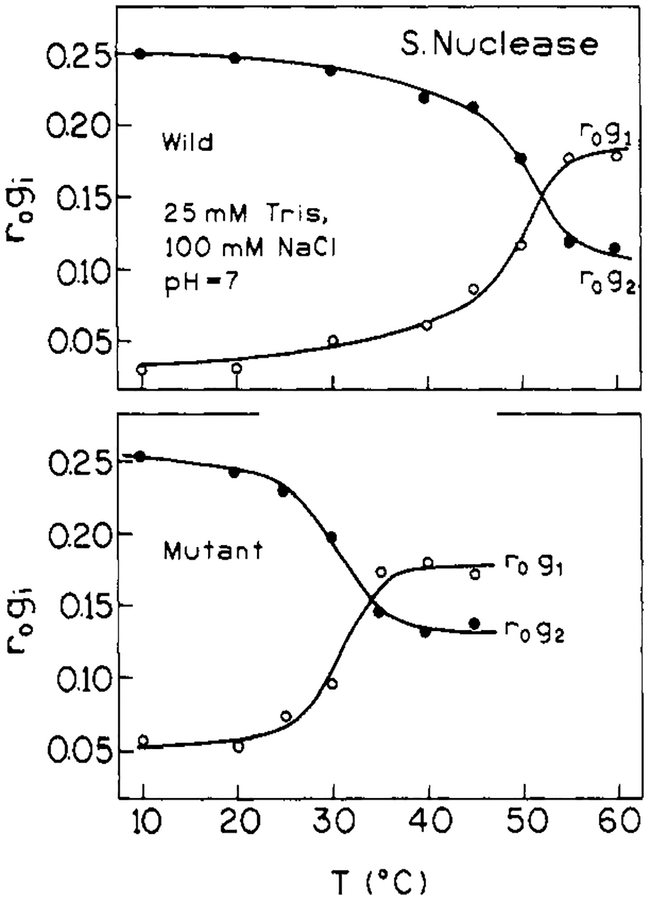
As temperature is increased the anisotropy decay data in Figures 6 and 7 shifts toward higher frequency, indicative of more rapid motion. The fitted values of both θ1 and θ2 decrease with increasing temperature, and the relative amplitude of the shorter component, θ2, increases at the expense of the longer component. These trends, which are shown in Figures 8 and 9, show inflections near the Tm value for the respective proteins. The gradual decrease in θ1 below Tm is expected for a hydrated sphere. (An Arrhenius plot of In (1/θ1) versus 1/T for the wild-type, between 10 and 45 °C, yields an activation energy of 3.9 kcal/mol for the overall rotational diffusion of the protein. This is the value expected for rotational diffusion in water.) Above the thermal transition region, both rotational correlation times are below 1 ns, consistent with very rapid segmental motion of the Trp-140 side chain in the unfolded protein. Also, as mentioned above, the shorter θ2 correlation time has the larger amplitude for the unfolded state, indicating that the dominant depolarizing process is very rapid and is probably due to rotation about the α–β or β–γ tryptophan side chain bonds.
FIGURE 8:
Amplitudes of the anisotropy decay for wild-type nuclease (top) and mutant nuclease-conA-SG28 (bottom) as a function of temperature.
FIGURE 9:
Temperature dependence of the overall (θ1) correlation times for wild-type nuclease (○) and mutant nuclease-conA-SG28 (●). The dashed line shows the temperature dependence of η/T.
Discussion
The comparison of nuclease A with nuclease-conA-S28G mutant affords us an opportunity both (1) to characterize the fluorescence properties of the native (and unfolded) states of these proteins and (2) to characterize how the fluorescence properties relate to the two-state thermal unfolding transition of the proteins, As shown in a previous article (Eftink et al., 1991), the native state of nuclease-conA-S28G is stabilized by only about 1.2 kcal/mol at 20 °C with respect to its unfolded state. By comparison, the wild-type is stabilized by 5.8 kcal/mol. The thermal unfolding of this mutant and the wild-type nucleases occurs at 30 and 51 °C, respectively, at pH 7.0. Thus it is possible that the difference in stability could result in altered fluorescence properties of Trp-140, and the large difference in Tm provides a good “test” of our ability to interpret time-resolved fluorescence data in terms of a two-state transition. Below we will first discuss the fluorescence properties of the native state of the mutant and wild-type nucleases. Then we will discuss how the temperature-dependence data relate to the thermal transition.
Fluorescence Properties of the Native States.
The intensity decay data for the native state (low-temperature range) of nuclease-conA-S28G are quite similar to those for the wild-type, suggesting a relatively similar microenvironment for Trpl40. A long-lived τ1 of ~6 ns is the dominant component for both proteins, and the decays can be described as a biexponential. The mutant protein shows a slightly more significant short-lived component. This is seen by the biexponential τ2 being slightly smaller for the mutant, as compared to the wild-type. Alternatively, the bimodal Lorentzian analysis shows a slightly larger amplitude (g2) for the short-lived component in the mutant. This difference between mutant and wild-type is subtle and cannot, at this time, be directly related to differences in structural/dynamic properties.
Anisotropy decay data for the two proteins are also similar but show some notable differences. The long rotational correlation times, θ1 = 12.9 ns for wild-type and θ1 = 14.3 ns for the mutant at 10 °C, are reasonable values for the overall rotational diffusion of a globular protein of the molecular weight of nuclease A. The θ1 for the mutant is about 10% larger than that for the wild-type. This suggests either a difference in hydration or effective hydrodynamic volume for the mutant. We have unpublished analytical size exclusion chromatography results that support the conclusion that nuclease conA S28G behaves as if it has an effective hydrodynamic volume that is ~10% larger than that of the wild-type (Eftink, 1991). Since the crystal structure of a related mutant (nuclease-conA) is known to be very similar to that of the wild-type (Hynes et al., 1989), the observation of a slightly larger hydrodynamic volume in solution suggests that the reduced structural stability allows a slight expansion of the globular structure in solution.
The anisotropy decay data also indicate that Trp-140 of the mutant has a little more freedom for rapid local motion. This is seen in the larger amplitude (= giro) for the subnanosecond θ2 rotational correlation time. The θ2 values for mutant and wild-type proteins cannot be distinguished, but g2ro is about twice as large for the mutant as for the wild-type. In terms of the “wobbling in a cone” model for anisotropy decays (Lipari & Szabo, 1980), these giro values can be interpreted in terms of the existence of rapid motion of Trp-140 within a cone of semiangle of 15–18° and 21–22° [calculated from glro/Σgiro = cos2 θ(l + cos θ)2/4, where θ is the cone angle] for the mutant and wild-type protein, respectively. Again, the reduced stability of the mutant may be the basis for this additional motional freedom.
For the thermally unfolded states of the two proteins, our data and fitting parameters are very similar (considering differences in temperature). Our data for these unfolded states are not extensive, but it is suggested that these states are similar for the two proteins.
Relation of Fluorescence Parameters to the Thermal Transitions.
Changes in the steady-state fluorescence of Trp-140 of nuclease A have been used to monitor the thermal (or denaturant induced) unfolding of this protein (Shortle et al., 1988; Eftink et al., 1991). The van’t Hoff enthalpy change, obtained from fluorescence data, is within 10% of the calorimetrically determined value, which indicates that the thermal transition is essentially two-state in nature (Griko et al., 1988). Although time-resolved fluorescence measurements are an expensive and difficult way to monitor an unfolding transition, it is important to explore how the decay parameters relate to such a transition, in order to better understand the physical meaning of these decay parameters and their relationship to the structures of a protein.
For a protein that can exist in two structural states (i.e., native, N, and unfolded, U), each state is expected to have its individual decay times. If these decay times are significantly
different for the states, then the variation of the preexponential amplitudes, αi, associated with the decay times should report the N ⇋ U transition, since these preexponential terms are, to a first approximation,1 proportional to the fraction of species in the given state. The dependence of such preexponential terms on temperature (or denaturant) will then directly monitor the two-state transition, enabling thermodynamic parameters to be extracted. If a decay time is not sufficiently distinct for an individual state, then it will be difficult to use it to track the population of a state.
Note that other fluorescence parameters, such as the monoexponential τ, the weighted average 〈τ〉 (≡ Σαiτi2/Σαiτi), the unimodal , the steady-state anisotropy r (=Σαiτiri/Σαiτi), or the rogi for anisotropy decay analyses, may show an inflection with temperature due to the thermal transition. Also, the width of a unimodal distribution fit may broaden in a transition range, due to the coexistence of species with different lifetimes. However, it is the intensity decay preexponential factors, αi, that are related to the population of molecular species, and any attempt to quantitatively describe time-resolved fluorescence data in terms of an unfolding (or any two-state) transition should focus on these preexponential factors. The preexponential rogi for anisotropy decay fits are actually related to the fractional fluorescence intensity (fi) of components, instead of the αi. Since different species may have different quantum yields, the analysis of rogi values, in terms of molecular transitions, will be complicated. Parameters such as rogi, 〈τ〉, and r will weigh more heavily contributions from components with higher yield/longer lifetime and thus will show skewed transitions.
For the temperature-dependent time-resolved fluorescence parameters reported in this study for nuclease A and its mutant, the decay time that is most characteristic of an individual state is the long intensity decay lifetime τ1 (see Tables I and II), which appears to be attributable to the native state of the proteins. (The long rotational correlation time, θ1, also appears to track the native state, as seen in Figure 8 and 9. However, as mentioned above, the rogl value for this correlation time is not easily related to the population of species.) Certain other decay times also seem to be primarily attributable to one state (i.e., τ3 to the unfolded state), but, in some cases, such as τ2 for the triexponential intensity decay fits, it appears that the decay parameter is representing both states.
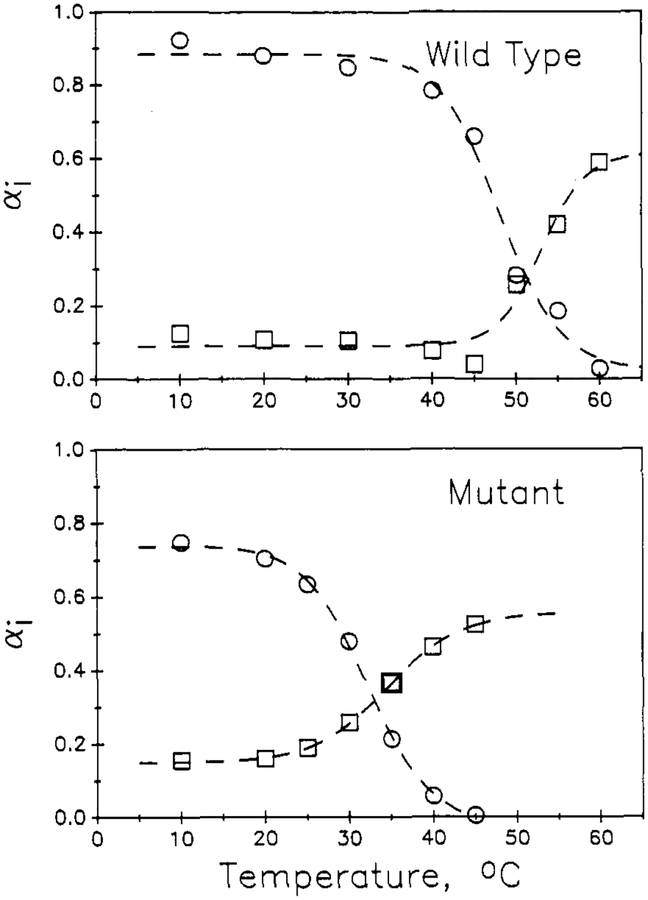
The plots of α1 (and α3) versus temperature in Figures 3 and 4 thus show inflections near the expected Tm of 51 °C for wild-type nuclease and 30 °C for the mutant. The τ1 for nuclease shows an Arrhenius-type decrease with increasing temperature, as expected. For the mutant, τ1 does not show this gradual decrease with temperature, but instead it drops with an inflection near Tm, which is not the expected pattern for a decay parameter attributable to a particular structural state. This may simply be a breakdown of the fitting process, so we performed a global analysis in which τi values were forced to follow an Arrhenius temperature dependence [1/τi = Ai exp(−Ea,i/RT)]. In performing this global analysis, we assumed a triexponential decay law,2 and we fixed the activation energy, Ea,1, for 1/τ1 to be 1.0 kcal/mol (this value was found for a separate global analysis of only the 10–40 °C data for the wild-type), and we fixed Ea,3, for 1/τ3, to be 4 kcal/mol. (There are limited data for the unfolded state, and this activation energy was used to be typical for an exposed Trp residue). The dashed lines in the right panels of Figure 4 are the temperature dependence of τ1 and τ3 imposed by these values. The open symbols in Figure 10 are the resulting temperature dependence of the α1 and α3 values obtained for this global analysis. The parameters for these global fits are given in Tables I and II. As can be seen, the global analysis, with Arrhenius behavior imposed on the τi, produces αi versus temperature patterns that are similar to those obtained by unlinked triexponential analyses (and with about half the total number of fitting parameters). The magnitude of α1 is high at low temperature and then drops to near zero at higher temperature, as expected if τ1 is assigned to the native state. The α3 value is small at low temperature and increases through the transition, indicating that the small τ3 primarily is attributed to the unfolded state.
FIGURE 10:
Temperature dependence of the α1(○)and α3 (□)for the global analysis or data sets with linkage via the Arrhenius equation (see Discussion). Values for α2 are not shown, but they are 1 – α1 – α3 and generally show a temperature dependence similar to that for α3 (but with an inflection at lower temperature, especially for the wild-type). The dashed line through these α1 and α3 points are fits of eq 6 for an assumed two-state transition. For the wild-type, this fit is for ΔHoUN = 55.9 kcal/mol, Tm = 48.0 °C, αN = 0.885, and αU = 0.019 for α1 and ΔHoUN = 79.9, Tm = 53.1 °C, αN = 0.091, and αU = 0.615 for α3. For the mutant, this fit is for ΔHoUN = 48.9 kcal/mol, Tm = 32.2 °C, αN = 0.746, and αU = −0.022 for α1, and ΔHoUN = 41.8 kcal/mol, Tm = 34.6 °C, αN = 0.152, and αU 0.555 for α3.
To further investigate how faithfully these α1 and α3 values track the population of native and unfolded states, we fitted the following expression for a two-state unfolding model to obtain the Tm and enthalpy change, ΔHoUN, for the transition for comparison with thermodynamic parameters previously obtained by more conventional methods.
| (6a) |
| (6b) |
In these equations αi(T) is the observed value of one of the intensity decay preexponentials as a function of temperature, αN,i and αU,i are the values for these preexponentials in the native and unfolded states, and fN and fU are the fraction of protein molecules in the native and unfolded states. The fraction of molecules in the native state can be related to the equilibrium constant for unfolding, KUN, and ΔHoUN and ΔSoUN by equ 6b (note that Tm = ΔHoUN/ΔSoUN and that, in this “low resolution” thermodynamic study, ΔHoUN and ΔSoUN are assumed to be independent of T). The dashed lines in Figure 10 are nonlinear least-squares fits of eq 6 to the global α1 and α3 values with average Tm, and ΔHoUN of 51 ± 3 °C and 68 ± 12 kcal/mol for the wild-type and Tm, and ΔHoUN of 33 ± 2 °C and 45 ± 4 kcal/mol for the mutant. Considering the limited number of temperatures used in this study and the complexity of our analysis, these values agree well with Tm and ΔHoUN values determined previously (Eftink et al., 1991).
Thus, time-resolved fluorscence data for nuclease A and nuclease-conA-S28G, measured as a function of temperature, are found to be consistent with a two-state unfolding transition, with the intensity decay preexponentials tracking the population of protein states. The difference between the fluorescence properties of the two proteins is primarily due to the difference in their Tm.
Acknowledgments
This research was supported by NSF Grant DMB 88-06113 to M.R.E and NSF Grants DMB-8511065 and DMB-8804931 to J.R.L. The fluorescence data were obtained at the Center for Fluorescence Spectroscopy, University of Maryland, supported by NSF Grant DIR-8710401.
Footnotes
This is the case if the molar extinction coefficient of each state is the same at the excitation wavelength and if the total emission is observed. If only a narrow emission wavelength range is observed and if there is a different Stokes shift for the two states, then the αi will not be proportional to the fraction of species. In the present study we have observed broad band emission from the sample.
The basis for selecting a triexponential decay law is that each state, N and U, will require a minimum biexponential decay and that by performing a global triexponential analysis certain τ values (Le., τ1 and τ3) will be able to correspond primarily to different states and the other τ value (i.e. τ2) will probably have some weight in each state. A global bimodal distribution analysis (Lorentzian in the activation energy terms) was also performed. It yielded higher χR2 and a temperature dependence of the two gi values that was similar to that for the α1 and α3 values as in Figure 10.
References
- Alcala JR, Gratton E, & Prendergast FG (1987a) Biophys. J 51, 587–596. [DOI] [PMC free article] [PubMed] [Google Scholar]
- Alcala JR, Gratton E, & Prendergast FG (1987b) Biophys. J 51, 925. [DOI] [PMC free article] [PubMed] [Google Scholar]
- Antonio L, Nakano T, & Fink AL (1989) J. Cell Biol 107, abstract no. 1136. [Google Scholar]
- Beechem JM, & Brand L (1985) Annu. Rev. Biochem 14, 43–71. [DOI] [PubMed] [Google Scholar]
- Beechem JM, & Gratton E (1988) Time-Resolved Laser Spectroscopy in Biochemistry, Proc. SOC. Photo-Opt. Instrum. Eng 909, 70–81. [Google Scholar]
- Benkovic SJ, Fierke CA, & Naylor AM (1988) Science 239, 1105–1110. [DOI] [PubMed] [Google Scholar]
- Brochon JC, Wahl P, & Auchet JC (1974) Eur. J. Biochem 41, 557–583. [DOI] [PubMed] [Google Scholar]
- Chabbert M, Kilhoffer M-C, Watterson DM, Haiech J, & Lami H (1989) Biochemistry 28, 6093–6098. [DOI] [PubMed] [Google Scholar]
- Demchencko AP (1986) Ultraviolet Spectroscopy of Proteins, Springer Verlag, New York. [Google Scholar]
- Eftink MR (1991) Biophys. J 59, 486a. [Google Scholar]
- Eftink MR, Ghiron CA, Kautz RA, & Fox RO (1989) Biophys. J 55, 575–579. [DOI] [PMC free article] [PubMed] [Google Scholar]
- Eftink MR, Ghiron CA, Kautz RA, & Fox RO (1991) Biochemistry 30, 1193–1199. [DOI] [PubMed] [Google Scholar]
- Evans PA, Dobson CM, Kautz RA, Hatfull G, & Fox RO (1987) Nature 329, 266–268. [DOI] [PubMed] [Google Scholar]
- Fersht AR (1988) Biochemistry 27, 1577–1580. [DOI] [PubMed] [Google Scholar]
- Fox RO, Evans PA, & Dobson CA (1986) Nature 320, 192–194. [DOI] [PubMed] [Google Scholar]
- Gratton E, & Barbieri B (1987) Proc. SOC. Photo-Opt. Instrum. Eng 743, 104. [Google Scholar]
- Gratton E, Lakowicz JR, Maliwal B, Cherek H, Laczko C, & Limkeman M (1984) Biophys. J 46, 479–486. [DOI] [PMC free article] [PubMed] [Google Scholar]
- Griko YV, Privalov PL, Sturtevant JM, & Venyaminov SY (1988) Proc. Natl. Acad. Sci. U.S.A 85, 3343–3347. [DOI] [PMC free article] [PubMed] [Google Scholar]
- Grinvald A, & Steinberg IZ (1976) Biochim. Biophys. Acta 427, 663–678. [DOI] [PubMed] [Google Scholar]
- Gryczynski I, Eftink M, & Lakowicz JR (1988) Biochim. Biophys. Acta 954, 244–252. [DOI] [PubMed] [Google Scholar]
- Hansen D, Altschmied L, & Hillen W (1987) J. Biol. Chem 262, 14030–14035. [PubMed] [Google Scholar]
- Harris DL, & Hudson BS (1990) Biochemistry 29, 5276–5285. [DOI] [PubMed] [Google Scholar]
- Hynes TR, Kautz RA, Goodman MA, Gill JF, & Fox R (1989) Nature 339, 73–76. [DOI] [PubMed] [Google Scholar]
- James DR, & Ware WR (1986) Chem. Phys. Lett 126, 7–11. [Google Scholar]
- James DR, Demmer DR, Steer RP, & Verrall RE (1985) Biochemistry 24, 5517–5526. [DOI] [PubMed] [Google Scholar]
- Lakowicz JR, Maliwal B, Cherek H, & Balter A (1983) Biochemistry 22, 1741–1752. [DOI] [PMC free article] [PubMed] [Google Scholar]
- Lakowicz JR, Gratton E, Laczko G, Cherek H, & Limkeman M (1984) Biophys. J 46, 463–477. [DOI] [PMC free article] [PubMed] [Google Scholar]
- Lakowicz JR, Cherek H, Maliwal B, & Gratton E (1985) Biochemistry 24, 376–383. [DOI] [PMC free article] [PubMed] [Google Scholar]
- Lakowicz JR, Laczko G, Gryczynski I, & Cherek H (1986a) J. Biol. Chem 261, 2240–2245. [PubMed] [Google Scholar]
- Lakowicz JR, Laczko G, Gryczynski I (1986b) Rev. Sci. Instrum 57, 2499–2506. [Google Scholar]
- Lakowicz JR, Laczko G, Gryczynski I, Joshi N, & Johnson ML (1987) Biophys. Chem 28, 35–50. [DOI] [PMC free article] [PubMed] [Google Scholar]
- Laws WR, Ross JBA, Wyssbrod HR, Beechem JM, Brand L, & Sutherland JC (1986) Biochemistry 25, 599–607. [DOI] [PubMed] [Google Scholar]
- Lipari G, & Szabo A (1980) Biophys. J 30, 489–506. [DOI] [PMC free article] [PubMed] [Google Scholar]
- Ludescher RD, Johnson ID, Volwerk JJ, de Haas GH, Jost PC, & Hudson BS (1988) Biochemistry 27, 6618–6628. [DOI] [PubMed] [Google Scholar]
- Markley JL (1987) in Protein Engineering (Oxender DL, & Fox CF, Eds.) pp 15–33, Alan R. Liss, Inc., New York. [Google Scholar]
- Matsumura M, Becktel WJ, & Matthews BW (1988) Nature 334, 406–410. [DOI] [PubMed] [Google Scholar]
- Matthews B (1987) Biochemistry 26, 6885–6888. [DOI] [PubMed] [Google Scholar]
- Munro I, Pecht I, & Stryer L (1979) Proc. Natl. Acad. Sci. U.S.A 76, 56–60. [DOI] [PMC free article] [PubMed] [Google Scholar]
- Royer CA, Gardner JA, Beechem JM, Brochon J-C, & Matthews KS, (1990) Biophys. J (in press). [DOI] [PMC free article] [PubMed] [Google Scholar]
- Schellman JA, Lindorfer M, Hawkes R, & Gutter M (1981) Biopolymers 20, 1989–1999. [DOI] [PubMed] [Google Scholar]
- Shortle D, Meeker AK, & Freire E (1988) Biochemistry 27, 4761–4768. [DOI] [PubMed] [Google Scholar]
- Steiner RF, Ed. (1983) Excited State of Biopolymers, Plenum Press, New York. [Google Scholar]
- Steiner RF, & Weinryb I, Eds. (1971) Excited State of Proteins and Nucleic Acids, Plenum Press, New York. [Google Scholar]
- Szabo AG, & Rayner DM (1988) J. Am. Chem. SOC 102, 554–563. [Google Scholar]
- Vincent M, Brochon JC, Merala F, Jordi W, & Galloy J (1988) Biochemistry 27, 8752–8761. [DOI] [PubMed] [Google Scholar]
- Wages J, Han M, Feitelson J, James EA, Baldick CJ, Knutson JR, & Brand L (1988) Biophys. J 53,296a. [Google Scholar]
- Waldman ADB, Clarke AR, Wigley DB, Hart KW, Chia WN, Barstow D, Atkinson T, Munro I, & Holbrook JJ (1987) Biochim. Biophys. Acta 913,66–71. [DOI] [PubMed] [Google Scholar]


