Abstract
Fenestrae are open transmembrane pores that are a structural hallmark of healthy liver sinusoidal endothelial cells (LSECs). Their key role is the transport of solutes and macromolecular complexes between the sinusoidal lumen and the space of Disse. To date, the biochemical nature of the cytoskeleton elements that surround the fenestrae and sieve plates in LSECs remain largely elusive. Herein, we took advantage of the latest developments in atomic force imaging and super‐resolution fluorescence nanoscopy to define the organization of the supramolecular complex(es) that surround the fenestrae. Our data revealed that spectrin, together with actin, lines the inner cell membrane and provided direct structural support to the membrane‐bound pores. We conclusively demonstrated that diamide and iodoacetic acid (IAA) affect fenestrae number by destabilizing the LSEC actin‐spectrin scaffold. Furthermore, IAA induces rapid and repeatable switching between the open vs closed state of the fenestrae, indicating that the spectrin‐actin complex could play an important role in controlling the pore number. Our results suggest that spectrin functions as a key regulator in the structural preservation of the fenestrae, and as such, it might serve as a molecular target for altering transendothelial permeability.
Keywords: actin, cytoskeleton, fenestrae (fenestrations), liver sinusoidal endothelial cells, membrane‐bound pores, spectrin, transendothelial transport
Spectrin, together with actin, lines the inner cell membrane and provides direct structural support to the membrane‐bound pores. Using spectrin‐altering agents, we demonstrated that diamide and iodoacetic acid (IAA) affect fenestrae number by destabilizing the LSEC actin‐spectrin scaffold. Furthermore, IAA induces rapid and repeatable switching between the open vs closed state of the fenestrae, indicating that the spectrin‐actin complex could play an important role in controlling the pore number.
1. INTRODUCTION
Spectrin is a protein that was first identified in close vicinity to the membrane of red blood cells.1 This actin cross‐linking scaffold protein connects the cell membrane to the filamentous actin cytoskeleton. The functions of this cytoskeletal protein are manifold and examples include a role in determining cell shape, membrane integrity, cell‐cell interactions, transmembrane proteins arrangement and the organization of cell organelles.2, 3 Spectrin has been reported to be present in fibroblasts, HeLa cells, monocytes, kidney epithelial cells, endothelial cells (aorta, heart microvascular endothelial cells), osteocytes, smooth muscle cells and neurons of many species3, 4, 5, 6, 7; however, the presence of spectrin in liver sinusoidal endothelial cells (LSECs) has not been previously reported.
Fenestrae, nanometer‐size transmembrane pores gathered in groups to form sieve plates, are unique morphological features of LSECs and a hallmark of their normal physiological state.8, 9, 10, 11 Each fenestra is supported by a fenestrae‐associated cytoskeletal ring (FACR), whose protein composition remains unknown.12, 13 To date, many studies have focused on the structural composition of the fenestrae. The structure of the fenestrae is most likely not caveolin‐1‐dependent and hence the fenestrae are most likely not derived from the pear‐shaped membrane caveolae invaginations.14 Additionally, the fenestrae do not colocalize with clathrin, what suggests that they are not maintained via a clathrin‐mediated pathway.15 Nonmuscle myosin and calmodulin may control the fenestrae diameters.8 Cogger et al, illustrated that the fenestrae can be induced in the nonraft microdomain areas of the LSECs' membrane bilayer.16 In our recent atomic force microscopy (AFM) studies, we observed such flat membrane structures in close proximity to the fenestrae.17 Nevertheless, how such a small and energetically demanding liposomal‐like structure of cell membrane around the fenestrae can exist without “immediate” cell membrane fusion remains unclear.
Recently, using novel super‐resolution fluorescence microscopy approach, the actin cytoskeleton was shown to constitute a major structural scaffold to maintain the fenestrae within sieve plates.18, 19, 20, 21, 22 In neurons, spectrin has been observed to arrange actin to form an actin‐spectrin ring‐like periodic structure.23 We believe that such a structure could be similar to the cytoskeletal ring‐like structures found in LSECs.
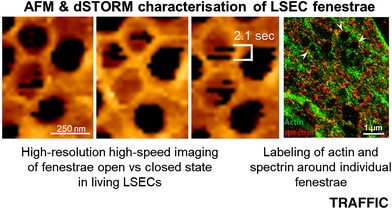
Our recent work demonstrated that even better insight into the dynamics of the fenestra structure could be achieved using multimodal AFM imaging. Dynamically tracking the detailed structure and dynamics of the fenestrae in vitro for the first time in living (ie, nonfixed) LSECs,13, 17, 24 enabled us to obtain time‐dependent high‐resolution images of the actin cytoskeleton that supports the fenestrae, confirming the previously reported fenestrae‐associated cytoskeletal structures.13 We showed that some FACRs are closed, that is, filled with lipid membrane, while others are open.13, 17 Those findings underlay the need for the coexistence of some structural proteins, other than actin, for maintaining and switching the fenestrae in an open vs closed state. These results suggested spectrin as a good candidate for the formation, structural maintenance and switching between the open/closed state of functional fenestrae.
In this study, we demonstrate the presence and structural localization of spectrin in LSECs using complementary AFM and super‐resolution fluorescence microscopies as well as biochemical characterization. We provide strong evidence that these cytoskeletal proteins, namely, the spectrin‐actin complex, play a pivotal role in the maintenance of the open fenestrae and in the formation of new fenestrae. We postulate that the actin‐spectrin cytoskeleton scaffold is a key supramolecular regulator in the structural preservation of fenestrae that acts as a functional molecular regulator to control bidirectional transendothelial LSEC transport.
2. RESULTS
The experimental results are presented in different sections starting from nanoscopy wide‐field fluorescence imaging combined with immunolabeling experiments, to dynamic AFM observations including the monitoring of pore changes using cytoskeletal‐altering agents. First, we present super‐resolution fluorescence microscopy images (direct stochastic optical reconstruction microscopy [dSTORM]) demonstrating that spectrin and actin are uniformly distributed in LSECs, including the areas around the fenestrae within the sieve plates of LSECs. Second, we focus directly on FACRs using AFM and find that an intact cytoskeleton ring is required to open a pore within. Third, we show that the oxidation of spectrin is sufficient to close a fenestra within FACR and this occurs without altering its structure. In the final section, we demonstrate that iodoacetic acid (IAA) causes rapid switching between the open and closed states of the fenestrae. These data unambiguously show the importance of the actin‐spectrin scaffold in pore dynamics and the structural maintenance of FACRs surrounding the fenestrae.
2.1. Spectrin and Actin colocalization within the sieve plates
To localize spectrin and actin with respect to the cell membrane, two‐colored dSTORM optical nanoscopy was performed. The dSTORM images of LSECs labeled with CellMask Deep Red and phalloidin‐Atto488 dyes are shown in Figure 1.
Figure 1.
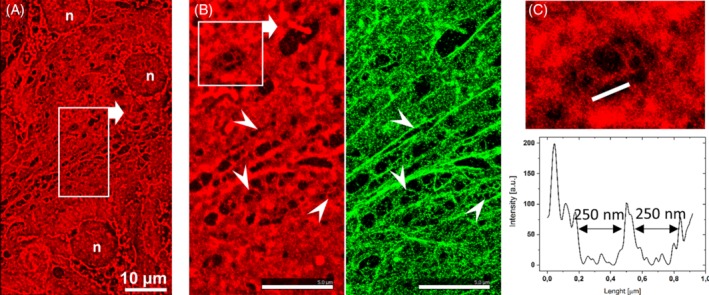
Two‐colored dSTORM images revealing the organization of the LSEC membrane and the localization of Actin. A, A low‐magnification image of the cell membrane (CellMask Deep Red) acquired at the interconnection of a few LSECs. B, Magnification of the area indicated in image A. The cell membrane (CellMask Deep Red, red) and actin (phalloidin‐Atto488, green) are shown. The arrowheads indicate the selected fenestrae that can be distinguished in both channels. C, Magnification of the area indicated in image B for CellMask presenting a single sieve plate with a few fenestrae. The cross section shows the diameters of the selected fenestrae determined based on the intensity of the fluorescence signal
As shown, the CellMask uniformly labeled the LSEC cell membrane. Considering that the fenestrae are transcellular pores, that is, empty holes through LSECs, we can easily identify the fenestrae as dark spots on the fluorescence images (Figure 1A). By staining actin on the cell membrane similarly to previous studies,25 we confirm that actin surrounds the fenestrae (Figure 1B, arrowheads). Moreover, CellMask staining enables clear visualization of the individual fenestrae (Figure 1C).
To assess the distribution of spectrin within LSECs, we applied two‐colored dSTORM optical nanoscopy of spectrin and actin. Spectrin always forms heterotetramers (two alpha units and two beta units).26, 27 The mammalian alpha subunits are reportedly similar in molecular weight but are structurally distinct and share only limited immunologic cross reactivity.28 Therefore, similar to others,7 we focused only on β‐II‐spectrin. Super‐resolution images of the fenestrae demonstrate that spectrin and actin are uniformly distributed within LSECs (Figure 2, control). In intact LSECs, a high signal of spectrin from the interior of the sieve plates is often observed (Figure 2, white ellipses, also Supplementary Figure 1).
Figure 2.
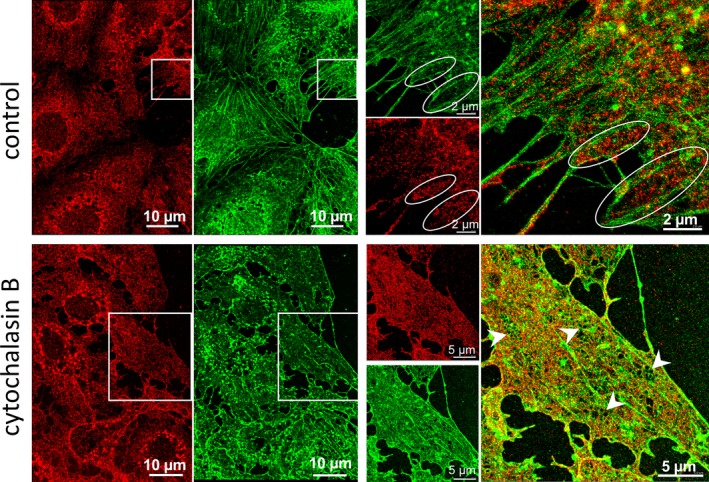
Two‐colored dSTORM images revealing the organization of actin and spectrin in the LSEC cytoskeleton. Intact control cells (first row) and LSECs treated with 21 μM CB for 30 minutes before fixation (second row). Spectrin (red, spectrin β II Antibody conjugated with Alexa Fluor 647) and actin (green, phalloidin Atto488) distribution at the interconnection of several LSECs are shown in the left panels. The right panels present the magnifications of the selected areas (white squares) where independent and merged channels are shown. In the control samples, the encircled areas indicate sieve plates. The individual fenestrae are identified only in CB‐treated samples in TIRF mode as black (eg, arrowheads)
To decrease the cell height and to increase the number of visualized fenestrae (both of which facilitate dSTORM image resolution), additional experiments on LSECs treated with cytochalasin B (CB) were performed. Cytochalasins are widely used cytoskeletal‐altering drugs which disrupt actin filament organization. These drugs cause depolymerization of F‐actin which results in the formation of a large amount of short actin filaments.29 Cytochalasins are reported to increase the number of fenestrae by a factor of 3,30 which is similar to our observations; however, the mechanism explaining why new fenestrae are formed after depolymerization of actin remains unknown.18
Experimental dSTORM images for CB‐treated LSECs are presented in the lower panel of Figure 1. In general, spectrin is distributed more uniformly compared to the control samples. As expected, LSECs treated with CB present a flat morphology with bulging nuclei (see AFM data below), which enhances the signal‐to‐noise ratio in total internal reflection fluorescence (TIRF) mode and, in consequence, improves the resolution of the individual fenestrae images (Figure 3). The CB data confirm the observations obtained from control LSECs: that is, both spectrin and actin are present around the fenestrae (see also Supplementary Figure 2).
Figure 3.
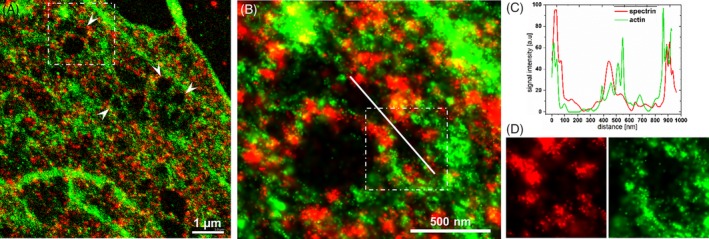
High‐magnification dSTORM image of the cytoskeleton of CB‐treated LSECs. A, The cytoplasmic distributions of actin (green, phalloidin Atto 488) and spectrin (red, spectrin β II antibody conjugated with Alexa Fluor 647). Arrowheads indicate individual fenestrae. B, Magnification of the selected white line indicating the cross section presented in C. D, Magnification of the single fenestrae marked in C. Separated channels show spectrin and actin distribution around the fenestra
2.2. The spectrin‐actin network and the effect of cytochalasins
CB was further used to study the role of the spectrin‐actin network in the formation of FACRs and the fenestrae, including the open vs closed status of the fenestrae. First, we performed AFM force vs distance measurements of the live LSECs to determine cell elasticity and stiffness (see Section 4). CB treatment clearly caused a decrease in cell stiffness compared to the control due to actin fiber depolymerization in the cell cytoskeleton (see Figure 4). These data are consistent with our early work on endothelium cell stiffness31, 32 and with the fluorescence microscopy data supporting the depolymerization of the LSEC actin cytoskeleton due to CB (Supplementary Figure 3).
Figure 4.
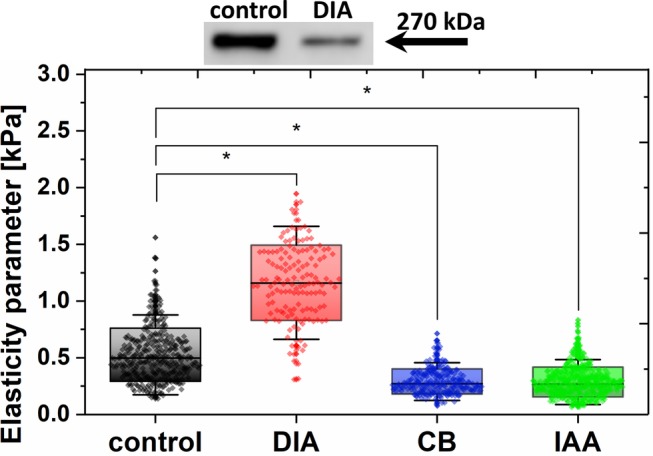
Western blot of spectrin in control and DIA‐treated LSECs (500 μM, 5 minutes) (top). Elasticity parameter (effective Young's modulus) calculated from Hertz‐Sneddon model fit to the force‐distance curves taken at the nuclear part of live LSECs, both untreated and treated with DIA (500 μM), CB (21 μM) or IAA (10 μM) (bottom). The boxes indicate SD (SD), with a line and black dot indicating the median and mean value, respectively. *P < .001
Because of the decreased stiffness (ie, relatively low Young's modulus) of living LSECs after CB treatment (see Figure 4), we were unable to trace FACRs in real time.24, 33, 34, 35 To further investigate the interconnection between actin and spectrin, we performed high‐resolution AFM imaging on fixed LSECs. The cells were fixed with 1% glutaraldehyde (GA) after 30 minutes of CB treatment (see Figure 5A). Fixation using GA increased the cell stiffness by approximately two orders of magnitude (effective Young's modulus increased from ~1 to ~100 kPa).24, 33
Figure 5.
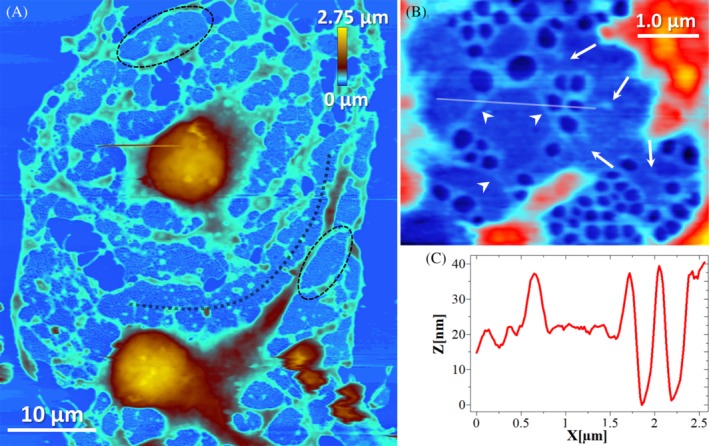
AFM image showing GA‐fixed LSECs after 30 minutes of CB treatment (21 μM). A, A bulging nucleus area (brown‐orange, >400 nm) is observed. Cell height on the periphery rarely exceeds 400 nm (blue, <400 nm). Black outlines indicate examples of the individual sieve plates, but some sieve plates are merged (eg, black dotted line). B, Magnification of a single sieve plate. Each fenestra in the sieve plate is surrounded with FACR. Actin filaments are often connected to each other and form long filaments (arrowheads). Incompletely closed FACRs do not contain an open pore within (arrows). C, A cross section presents the height of the FACR and flat regions within the sieve plate
Similar to previous reports, we detected bulging nuclei in the CB‐treated LSECs and a flat morphology on the cell peripheries.18, 19 AFM allowed us to quantify the height of LSECs and we found that the height on the cell periphery rarely exceeded 400 nm. Furthermore, high‐resolution imaging of FACRs in individual sieve plates indicated a significantly brighter contrast (higher elevation) around the FACR structures surrounding each fenestra (see Fig. 5, BC). As presented in Figure 4B, the actin filaments are often connected and form long filaments (Figure 5, arrowheads). We observed uncharacteristic “closed” fenestrae (ie, absence of the membrane opening within an incomplete ring) (marked by white arrows in Figure 5B). This finding suggests that a complete FACR is necessary to induce the formation of an open pore.
2.3. Oxidized spectrin is unable to keep the fenestrae open
We next investigated the role of spectrin and actin in building or reorganizing the FACR in the formation of open fenestrae in sieve plates of live LSECs using high‐resolution 4D‐AFM imaging.14 Untreated LSECs were compared with cells stimulated using diamide (DIA), a known cytoskeletal drug that disrupts spectrin.7 DIA causes mild oxidation of spectrin and affects its tertiary structure, both in cultured cells7 and in isolated protein in vitro.36 We treated living LSECs with 500 μM diamide (N,N‐dimethylamide, DIA) which resulted in an immediate disappearance of the fenestrae, from 1.0 to 1.8 fenestrae/μm up to 0.18 fenestrae/μm (n = 5). Scans performed on a similar area of the LSECs after just ~3 minutes from the addition of DIA exhibited a complete loss of the fenestrae and only a few gaps >400 nm could be distinguished (Figure 6). Interestingly, a well‐organized dense net of FACR clumps were still present after DIA treatment, which clearly indicates that the destabilization of spectrin using DIA is sufficient to close the fenestrae in LSECs.
Figure 6.
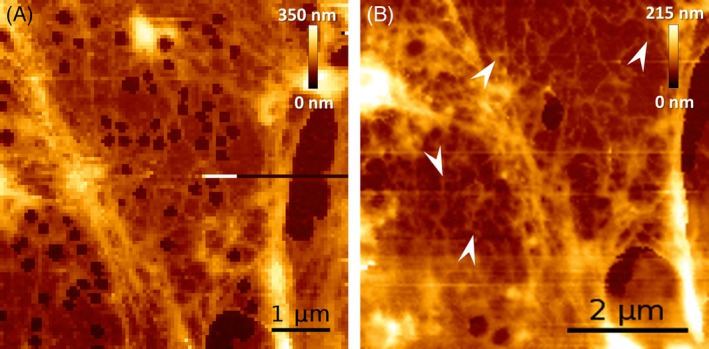
AFM images highlighting FACRs in LSECs. A, Peripheral part of an LSEC sieve plate presenting fenestrated morphology (control). A net of FACRs can be observed as brighter (higher) parts within the cell cytoplasm. B, After injection of 500 μM DIA to the medium, a similar area of the same LSEC was visualized and shows immediate (<5 minutes) closing of the fenestrae. The measurement initiated after ~3 minutes (8 minutes long) from the injection presents the F‐actin filament structure around FACR (arrowheads)
Additional measurements on the effects of DIA were performed using AFM nanoindentation and Western blot analysis to assess the effect of DIA (Figure 4). In Figure 4, we show that DIA induced the cross‐linking of both spectrin heterodimers and spectrin with actin filaments, leading to a significant increase in LSEC stiffness. The corresponding results obtained via actin‐stained optical fluorescence microscopy are presented in Supplementary Figure 3. The formation of thick actin fibers in the cortical region of LSECs was pronounced. Our observations on the elasticity of DIA‐treated cells are in agreement with other reports.37, 38, 39, 40 Moreover, Western blot analysis of LSECs exposed to DIA for 5 minutes (Figure 4, upper row) revealed a significant decrease in the spectrin band intensity, which is consistent with the observed protein disruption.
Notably, DIA does not interact exclusively with spectrin.41 DIA was previously shown to also cause calcium ion concentration changes/fluctuations in bovine aortic endothelial cells.41 Therefore, to evaluate the impact of the Ca2+ ion concentration on the fenestrae structure, we performed an experiment in which LSECs were exposed to calcium ionophores (1.0 μM) for 2 hours. We did not detect any significant changes after treatment in the stability of the fenestrae or in the fenestrae number (Supplementary Figure 4).
2.4. Rapid switching between open and closed states of the fenestrae after treatment with IAA
Finally, we selected IAA to further investigate the impact of the actin‐spectrin complexes on LSEC dynamics and functionality. IAA irreversibly inhibits the glycolytic enzyme glyceraldehyde‐3‐phosphate dehydrogenase and depletes cellular glutathione.42 The side‐effect of IAA is its interaction with thiol groups, especially in cysteines, leading to the formation of S‐carboxymethylated cysteines.43 This effect may additionally oxidize spectrin dimers, similarly to DIA. Opas et al.44 reported that IAA caused the depolymerization of actin stress filaments in embryonic chick retinal pigmented epithelial cells. Therefore, we posited that IAA could act on both the actin and spectrin structures.
Indeed, in our experiments, LSECs exposed to 10 μM IAA showed degraded thick stress filaments and decreased cell height in the peripheral regions of the cells (effect on actin). In Figure 4, we present the results of cell elasticity measurements via AFM indentation of live LSECs. IAA treatment caused decreased cell stiffness compared to the control, similar to the effect of CB. These data are consistent with the fluorescence micrographs supporting the depolymerization of the LSEC actin cytoskeleton as shown in Supplementary Figure 3.
Subsequently, 4D‐AFM tracking on a single sieve plate area of a live LSEC revealed that individual fenestrae changed from the open to closed state and vice versa in a time window as small as 1 second, without altering the FACR structure (Figure 7 and Supplementary Animation 1). Note that “regular” LSEC dynamics (for untreated cells) invokes the fenestrae with a mean lifetime of 18 minutes (with many closing in a few minutes time).13 In contrast, after IAA treatment the switching occurred in a time period of seconds—one to two orders of magnitude faster. On a longer time scale, however, the total number of open fenestrae increased, such that after 1 hour of treatment the total cell porosity rose by approximately 20% to 30% (see Supplementary Figure 3). This effect was not observed in CB‐treated LSECs, or LSECs treated with any other agent investigated so far. A summary of the most important experimental findings is listed in Table 1.
Figure 7.
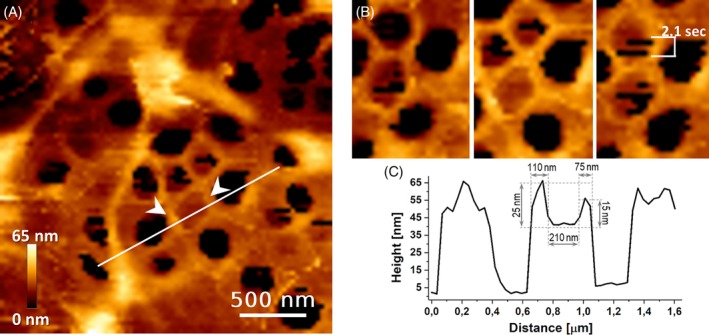
High‐resolution AFM image on a part of a single‐laying sieve plate within a live LSEC. A, Note, measurements are derived after exposure to 10 μM IAA. B, FACRs (white arrowheads) remained unchanged while the fenestrae changed from an open to closed state. C, The cross section indicated as a white line in A shows elevated FACR surrounding a closed fenestra. Each AFM image/frame took 55 seconds and consisted of 80 × 80 pixels. See Supplementary Animation 1 for the corresponding 18‐minute long video animation
Table 1.
Summary of LSEC fenestrae structure and functionality changes due to various actin/spectrin active agents
| Active agent | Actin structure modification | Spectrin oxidation | Cell stiffness | Fenestrae open/closed | Porosity |
|---|---|---|---|---|---|
| CB | Depolymerization | No | Low | Largely open | Increased by 200% |
| DIA | Actin cross‐linking | Yes | High | Closed | Greatly reduced |
| IAA | Depolymerization | Yes | Low | Fast switching | Increased by 20%‐30% |
3. DISCUSSION
Using conventional electron microscopy (EM) methods and cryo‐EM,8, 22, 45, 46 actin filaments have been shown to support the LSEC membrane through a ring‐like structure organization that forms FACRs. In the present work, (see Figures 1, 2, and 4, 5, 6, 7) such structures could readily be characterized by means of AFM imaging and to some extent by super‐resolution fluorescence nanoscopy. Importantly, only completely closed FACR structures contained fenestrae in the open state, as documented in Figure 4B. Although selected cytoskeletal‐altering drugs that affect actin structure also increase the number of the fenestrae,8 how actin could be organized into rings that constitute FACRs around the fenestrae is unknown. To study this question, we performed a series of experiments focused on the candidate protein, spectrin, which we hypothesized to be involved in the formation and structural integrity of the fenestrae.
Spectrin's functional length is approximately 55 to 65 nm but can extend up to 200 nm,26 which makes it a perfect candidate to control the fenestrae in their open vs closed states. One could expect that the interaction between spectrin units and actin across the cell membrane is greatly facilitated at the cell periphery because the cell height is reduced and because of the presence of numerous short actin filaments. Consequently, spectrin should be able to efficiently arrange actin to form FACRs and control fenestrae formation, through a mechanism similar to that observed in axons.23
Our dSTORM and AFM imaging measurements on untreated and CB‐treated LSECs clearly indicate that spectrin remains colocalized with the actin scaffold surrounding the fenestrae (see Figures 1 and 2). We also observed that the fenestrae are formed at the peripheral parts of the cells, where the distance between the upper and lower parts of the cell membrane (the cell local height) is lower than 300 to 400 nm (Figure 4). The proposed spectrin‐actin scaffold structure can also explain the speed of alterations in the fenestrae number at the peripheral parts of LSECs. Rapid changes are typically observed in the first hours of culture during cell spreading on a glass slide in contrast to relatively stable fenestra structures in the area close to cell‐cell interconnections.13, 17 One can reasonably postulate that during LSECs spreading, the cells rearrange their actin cytoskeletal filaments causing continuous rapture of the spectrin‐actin connections across the cell membrane. These actin‐spectrin complexes are strong enough to allow migration of the individual fenestrae across the cell membrane, supporting previous reports.13 In high local height areas of the cell, such as around the perinuclear area, spectrin units cannot maintain an open pore. In such cases, only small invaginations in the cell membrane19, 24 or fenestrae labyrinths47 could be observed. Consequently, all the cytoskeletal drugs that cause the depolymerization or reorganization of actin simultaneously cause a decrease in cell height at the peripheries and as a result increase the porosity.8, 19, 46 In contrast, the cross‐linking of spectrin‐actin complexes and the facilitation of a spectrin‐spectrin bond either by other external agents or due to intracellular signaling processes, increase the stiffness of LSECs (decrease the deformability of the cytoskeleton) and leads to fenestrae closure. This statement is supported by the observations shown in Figures 6 and 7 and Supplementary Animation 1.
DIA has been shown to stoichiometrically oxidize the thiol group of cysteine without generating radicals.36 DIA reduces the actin‐spectrin binding mediated by band 4.1 in red blood cells and thus this drug is widely used as spectrin‐specific compound.7, 36, 39, 48 Ferru et al49 showed that spectrin promoted band 3 phosphorylation causing its release from the red blood cell cytoskeleton. This effect, together with the decrease in binding to ankyrin, affects actin‐spectrin connections in close proximity to the cell membrane. A similar observation is reported here, where FACRs remained unaffected but spectrin oxidation caused a weaker connection to the cell membrane resulting in cell membrane fusion around the FACRs (Figure 6).
The effect of IAA covers the combined effect on the actin‐spectrin complex. IAA acts on cysteines in spectrin, similar to DIA (Figure 7 and Supplementary Figure 5). This process is likely to be proceeded (or occurs concurrently) by the initial cytoskeleton degradation due to IAA as documented by lowering cell stiffness (see Figure 4) and transformation of the actin cytoskeleton structure shown in the fluorescence micrographs (Supplementary Figure 3). The resulting cell flattening implies that some new areas at the cell peripheries are reaching the conditions (critical thickness) required for FACR formation as described above. Concurrent disruption of the actin‐spectrin scaffold facilitated by IAA gives rise to quick switching between the open/close state. Interestingly, the actin FACRs of switching fenestrae are unaffected. Importantly, fast switching without affecting the FACRs cannot be explained by cell flattening alone and was not observed for untreated LSECs and for CB‐treated LSECs. We hypothesize that fast “blinking” of the fenestrae is caused by a fine balance of actin depolymerization and cytoskeleton degradation that involves spectrin oxidation. Furthermore, IAA can also affect glycolysis in LSECs which may influence the open vs closed state of the fenestrae. Therefore, we performed additional experiments using 50 mM 2‐deoxy‐d‐glucose (2DG), which affects glycolysis. After treatment, the fast switching between the open and closed states of the fenestrae was not observed (data not shown).
In conclusion, we have shown that spectrin, due to its rod‐shape, its ability to easily change length from approximately 50 to 200 nm, and its ability to bind to membrane proteins, forms the necessary scaffold to form and maintain such energetically unfavorable structures as open fenestrae. Using contemporary super‐resolution microscopy techniques such as AFM force‐ and dSTORM nanoimaging, we obtained structural data that indicates a close correlation between the spectrin‐actin cytoskeleton network and the open status of LSEC fenestrae. We show strong evidence that the rapid switching between the open and closed status of the fenestrae is determined by the actin‐spectrin scaffold. The IAA experiments designate spectrin as a key regulator in controlling this switching process and the structural integrity of the fenestrae. Hence, we therefore suggest spectrin as a candidate molecular target to alter the porosity of the liver sinusoidal endothelium. Interfering with the spectrin cytoskeleton for example might beneficially affect the permeability of LSECs and thereby contribute to overall liver health.
4. METHODS
4.1. Animals and experimental design
Male C57BL/6 mice (6‐8 weeks old) were obtained from the Centre for Experimental Medicine (Bialystok, Poland) and kept under standard laboratory conditions. The number of mice dedicated for LSEC isolation was obtained from at least three animals per group. The animals were housed in colony cages in a temperature‐controlled environment (22°C‐25°C) with a 12 hours light/dark cycle. The mice had free access to food and water. At the end of the experiment, the mice were weighed to obtain their final body mass and anesthetized with ketamine (100 mg/kg) and xylazine (10 mg/kg) administered intraperitoneally. All procedures involving animals were conducted according to the Guidelines for Animal Care and Treatment of the European Union and were approved by the I Local Animal Ethics Commission at Jagiellonian University in Kraków, Poland (Permit No. 292/2015).
4.2. Isolation of LSECs
LSECs were isolated according to the procedure described in detail elsewhere.13 Isolated and purified cells were seeded on round glass coverslips (80 000 cells/slide) and cultured overnight (12‐14 hours). Next, the cells were measured live or fixed with 1% GA for 2 minutes or 3.6% paraformaldehyde (PFA) for 15 minutes.
4.3. Drug treatment
After a 1 hour preincubation in fresh medium, LSECs were treated with the agents detailed below. When investigated using AFM, the agents in a 40 to 50 μL volume were added directly to the BioCell (JPK Instruments) in a concentration necessary to obtain a desired final concentration in the working solution (max volume of 500 μL). Briefly, CB (from Dreschslera dematioi; Sigma Aldrich) was added to LSECs at a final concentration of 21 μM in EGM‐2 medium (Lonza). Afterward, the cells were exposed to CB action for 30 minutes before fixation. The stock solution of CB was prepared in dimethyl sulphoxide (DMSO). The final concentration of DMSO in a working solution did not exceed 1:1000, which was tested to have no effect on the cytoskeleton and on the porosity of LSECs. Diamide (DIA; Sigma Aldrich) was added to a final concentration of 500 μM in EGM‐2 medium for 5 minutes (Western blot) and up to 1 hour (4‐D AFM). IAA (Sigma Aldrich) was added to a final concentration of 10 μM in EBM‐2 medium and investigated for 2 hours. Calcium ionophore (Sigma Aldrich) was added to a final concentration of 0.5 μM for live LSECs and 1 μM for 2 hours for fixed LSECs. 2DG (Sigma Aldrich) was freshly prepared and added to a final concentration of 50 mM to EBM‐2 medium.
4.4. Atomic force microscopy
Measurements were conducted using the Nanowizard 3 AFM instrument (JPK Instruments). Round glass coverslips with LSECs were placed in a liquid cell (BioCell, JPK Instruments) and analyzed at 37°C for the living LSECs and at 25°C for the GA‐fixed LSECs under ambient conditions. For live cell measurements, 25 mM 4‐(2‐hydroxyethyl)‐1‐piperazine ethanesulfonic acid buffered medium was used. For time‐dependent AFM measurements, a group of two to five cells was selected and investigated for 1‐3 hours. Each experiment was repeated at least three times and a single representative experimental data set was shown in the paper. For fixed LSECs, at least five images from three independent samples were analyzed. All AFM data were performed utilizing the “quantitative imaging” mode (JPK Instruments) as described in detail before.13, 17, 50 Raw AFM images were subject to minimum processing (plane fitting, contrast corrections) by employing the JPK Processing Software, except Figure 4 for in which the WSxM 5.0 software was used.51
The number of fenestrae per square micrometer was calculated using methodology published elsewhere.50 Briefly, the area of LSECs where the fenestrae could be formed (ie, without gaps and cell nuclei) was measured using the Fiji software. The number of fenestrae was counted manually. Finally, the ratio of the counted number of fenestrae to the area of the cell was calculated independently for five images per group, representing two to five LSECs per image.
Atomic force spectroscopy measurements were conducted in force mapping mode to assess the LSEC elasticity parameter. In detail, an 8 × 8 μm2 area over the top of the cell nucleus was selected and a matrix of 8 × 8 force‐distance curves was acquired with an acquisition speed of 2 μm/s. The loading force of 300 pN was selected to determine the mechanical properties of the cortical layer only.52, 53 We performed measurements using Novascan V‐shaped cantilevers with a nominal spring constant 0.01 N/m and a spherical polystyrene tip (7.9 μm diameter). Elasticity was calculated according to the Hertz model using JPK Processing Software. We randomly selected 10 to 15 LSECs per group. Because DIA and CB affected LSECs quickly, they were added to the cell medium for 15 minutes and then removed by applying fresh medium. The AFM experiments were then performed within 60 minutes. IAA was added to the medium and the measurements were performed within 60 minutes.
4.5. Statistical analysis
The statistical significance of each difference between a control and treated LSEC was calculated with Student's t test for unpaired data. The values are expressed as the mean ± SD. A P value less than .05 was considered significant.
4.6. Direct stochastic optical reconstruction microscopy
To reduce autofluorescence, PFA (3.6%, 15 minutes) was used as a fixative agent for the fluorescence experiments. PFA‐fixed cells were treated for 7 minutes with 0.1% Triton X‐100 followed by 60 minutes of blocking in a 1% fetal bovine serum solution. Then, the LSECs were labeled using 1:200 monoclonal spectrin βII primary antibodies (Santa Cruz Biotechnology; overnight, at 4°C) in blocking buffer, followed by staining using 1:200 secondary polyclonal antibodies conjugated with AlexaFluor647 in PBS. Next, LSECs were stained for 30 minutes using phalloidin‐Atto488 (Sigma Aldrich) diluted 1:500 from stock solutions in PBS. Finally, LSECs were postfixed using 3.6% PFA for 30 minutes. dSTORM data were acquired on the Nanoimager S Mark IB from ONI (Oxford Nanoimaging Ltd.) with the lasers 405 nm/150 mW, 473 nm/1 W, 561 nm/500 mW, 640 nm/1 W and dual emission channels split at 640 nm. To increase the resolution, the imaging was performed in TIRF mode. The data were processed via NimOS from ONI. During the two‐colored dSTROM experiments, the signal was first acquired for spectrin using a 640 nm laser (20 000‐30 000 frames) followed by a similar acquisition for actin using a 473 nm laser. To assess the specificity of the antibodies, the samples were treated with secondary antibodies only (ie, negative control) and a negligible signal was observed. The labeling experiment was repeated three times and from at least three different animals.
4.7. Spectrin βII Western Blot
The protein concentration in each sample was measured by the bicinchoninic acid Protein Assay Kit (Thermo Fisher Scientific). Samples containing 5 μg of total proteins were loaded into 7.5% SDS‐PAGE gels, separated electrophoretically under constant voltage (100 V/h) and transferred (80 mA/ overnight) onto PVDF membranes (Bio‐Rad). The membranes were blocked in a 1x Tris‐buffered saline (TBS; pH 7.5) containing 5% wt/vol nonfat dry milk, incubated with a primary mouse monoclonal Anti‐Spectrin βII antibody (Santa Cruz Biotechnology) 1:1000 in TBS buffer for 1.5 hours at room temperature, and with mouse IgG kappa binding protein (m‐IgGκ BP) conjugated to horseradish peroxidase (Santa Cruz Biotechnology), 1:5000 for 45 minutes. Immunoreactive band detection was achieved by chemiluminescence (ChemiDocMP; Bio‐Rad) and normalized to the total protein content detected on the membranes using the ImageLab software (Bio‐Rad). The experiment was repeated using four different LSEC samples originating from one single isolation.
Supporting information
Appendix S1: Supplementary animation
Supplementary Fig. 1 Two‐colored dSTORM imaging revealing the organization of actin and spectrin in the cytoskeleton of intact, control LSECs. The left panel represents spectrin (red, spectrin β II Antibody conjugated with Alexa Fluor 647), middle actin (green, phalloidin Atto488), and right merged signals on the interconnection of three LSECs. Encircled areas indicate example sieve plates.
Supplementary Figure 2 High‐magnification of the selected area of intact, control LSEC, visualized using two‐colored dSTORM imaging. The left panel represents spectrin (red, spectrin β II Antibody conjugated with Alexa Fluor 647) and actin (green, phalloidin Atto488), and right merged signals. Few fenestrae were indicated with arrowheads.
Supplementary Figure 3. Fluorescence micrographs of LSECs labeled with phalloidin‐Atto488 for actin. Similar to elasticity data presented in Figure 3 ‐ untreated (control) LSECs and LSECs treated with DIA (500 μM), CB (21 μM), IAA (10 μM) were presented. Scale bar: 20 μm.
Supplementary Figure 4. The number of fenestrae per μm2 calculated for 1% GA fixed LSECs for control (untreated) LSECs and LSECs treated with 1 μM calcium ionophore for 60 minutes. n = 8 and n = 5 for control and calcium ionophore group respectively.
Supplementary Figure 5. AFM data illustrating the interconnection of three live LSECs measured before (left) and after (right) 60 minutes of IAA treatment. An overall cell height decreased in the peripheral region of LSECs, which was connected with ~30% increase in porosity as calculated as the ratio of the area occupied by the fenestra to the LSEC cytoplasmic area. The experiment was repeated 4 times with similar results (n = 4). Scan size 20 × 20 μm; 256 × 256 force‐distance curves.
ACKNOWLEDGMENT
This work is supported by the Polish National Science Centre under the “SYMFONIA 3” Project, Grant Agreement No.: UMO‐2015/16/W/NZ4/00070.
Zapotoczny B, Braet F, Kus E, et al. Actin‐spectrin scaffold supports open fenestrae in liver sinusoidal endothelial cells. Traffic. 2019;20:932–942. 10.1111/tra.12700
Peer Review The peer review history for this article is available at https://publons.com/publon/10.1111/tra.12700/
Funding information Narodowe Centrum Nauki, Grant/Award Number: UMO‐2015/16/W/NZ4/00070
REFERENCES
- 1. Marchesi V, Steers EJ. Selective solubilization of a protein component of the red cell membrane. Science. 1968;159(811):203‐204. [DOI] [PubMed] [Google Scholar]
- 2. Baek HJ, Lee YM, Kim TH, et al. Caspase‐3/7‐mediated cleavage of β2‐spectrin is required for acetaminophen‐induced liver damage. Int J Biol Sci. 2016;12(2):172‐183. 10.7150/ijbs.13420. [DOI] [PMC free article] [PubMed] [Google Scholar]
- 3. Machnicka B, Grochowalska R, Bogusławska DM, Sikorski AF, Lecomte MC. Spectrin‐based skeleton as an actor in cell signaling. Cell Mol Life Sci. 2012;69(2):191‐201. 10.1007/s00018-011-0804-5. [DOI] [PMC free article] [PubMed] [Google Scholar]
- 4. Heltianu C, Bogdan I, Constantinescu E, Simionescu M. Endothelial cells express a spectrin‐like cytoskeletal protein. Circ Res. 1986;58(4):605‐610. [DOI] [PubMed] [Google Scholar]
- 5. Levine J, Fodrin WM. Axonally transported polypeptides associated with the internal periphery of many cells. J Cell Biol. 1981;90(3):631‐643. 10.1083/jcb.90.3.631. [DOI] [PMC free article] [PubMed] [Google Scholar]
- 6. Burridge K, Kelly T, Mangeat P. Nonerythrocyte spectrins: Actin‐membrane attachment proteins occurring in many cell types. J Cell Biol. 1982;95(2):478‐486. 10.1083/jcb.95.2.478. [DOI] [PMC free article] [PubMed] [Google Scholar]
- 7. Wu XT, Sun LW, Yang X, Ding D, Han D, Fan YB. The potential role of spectrin network in the mechanotransduction of MLO‐Y4 osteocytes. Sci Rep. 2017;7:1‐12. 10.1038/srep40940. [DOI] [PMC free article] [PubMed] [Google Scholar]
- 8. Braet F, Wisse E. Structural and functional aspects of liver sinusoidal endothelial cell fenestrae: a review. Comp Hepatol. 2002;1:1‐17. 10.1186/1476-5926-1-1. [DOI] [PMC free article] [PubMed] [Google Scholar]
- 9. Fraser R, Cogger VC, Dobbs B, et al. The liver sieve and atherosclerosis. Pathology. 2012;44(3):181‐186. 10.1097/PAT.0b013e328351bcc8. [DOI] [PubMed] [Google Scholar]
- 10. Poisson J, Lemoinne S, Boulanger C, et al. Liver sinusoidal endothelial cells: physiology and role in liver diseases. J Hepatol. 2016; 66(1):212‐227. 10.1016/j.jhep.2016.07.009. [DOI] [PubMed] [Google Scholar]
- 11. Svistounov D, Warren A, Mcnerney GP, et al. The relationship between fenestrations, sieve plates and rafts in liver sinusoidal endothelial cells. PLoS One. 2012;7(9):1‐9. 10.1371/journal.pone.0046134. [DOI] [PMC free article] [PubMed] [Google Scholar]
- 12. Braet F, De Zanger R, Crabbe E, Wisse E. New observations on cytoskeleton and fenestrae in isolated rat liver sinusoidal endothelial cells. J Gastroenterol Hepatol. 1995;10:3‐7. 10.1111/j.1440-1746.1995.tb01792.x. [DOI] [PubMed] [Google Scholar]
- 13. Zapotoczny B, Szafranska K, Kus E, et al. Tracking fenestrae dynamics in live murine liver sinusoidal endothelial cells. Hepatology. 2019;69(2):876‐888. 10.1002/hep.30232. [DOI] [PubMed] [Google Scholar]
- 14. Warren A, Cogger VC, Arias IM, McCuskey RS, LeCouteur DG. Liver sinusoidal endothelial fenestrations in caveolin‐1 knockout mice. Microcirculation. 2010;17(1):32‐38. 10.1111/j.1549-8719.2009.00004.x. [DOI] [PMC free article] [PubMed] [Google Scholar]
- 15. Falkowska‐Hansen B, Falkowski M, Metharom P, Krunic D, Goerdt S. Clathrin‐coated vesicles form a unique net‐like structure in liver sinusoidal endothelial cells by assembling along undisrupted microtubules. Exp Cell Res. 2007;313(9):1745‐1757. 10.1016/j.yexcr.2007.02.026. [DOI] [PubMed] [Google Scholar]
- 16. Cogger VC, Roessner U, Warren A, Fraser R, Le Couteur DG. A sieve‐raft hypothesis for the regulation of endothelial fenestrations. Comput Struct Biotechnol J. 2013;8(11):1‐9. 10.5936/csbj.201308003. [DOI] [PMC free article] [PubMed] [Google Scholar]
- 17. Zapotoczny B, Szafranska K, Owczarczyk K, Kus E, Chlopicki S, Szymonski M. Atomic force microscopy reveals the dynamic morphology of fenestrations in live liver sinusoidal endothelial cells. Sci Rep. 2017;7(1):7994 10.1038/s41598-017-08555-0. [DOI] [PMC free article] [PubMed] [Google Scholar]
- 18. Braet F, De Zanger R, Jans D, Spector I, Wisse E. Microfilament‐disrupting agent Latrunculin A induces an increased number of fenestrae in rat liver sinusoidal endothelial cells: comparison with cytochalasin B. Hepatology. 1996;24(3):627‐635. 10.1053/jhep.1996.v24.pm0008781335. [DOI] [PubMed] [Google Scholar]
- 19. Spector I, Braet F, Shochet NR, Bubb MR. New anti‐actin drugs in the study of the organization and function of the actin cytoskeleton. Microsc Res Tech. 1999;47(1):18‐37. . [DOI] [PubMed] [Google Scholar]
- 20. Braet F, Muller M, Vekemans K, Wisse E, Le Couteur DG. Antimycin A‐induced defenestration in rat hepatic sinusoidal endothelial cells. Hepatology. 2003;38(2):394‐402. 10.1053/jhep.2003.50347. [DOI] [PubMed] [Google Scholar]
- 21. Mönkemöller V, Øie C, Hübner W, Huser T, McCourt P. Multimodal super‐resolution optical microscopy visualizes the close connection between membrane and the cytoskeleton in liver sinusoidal endothelial cell fenestrations. Sci Rep. 2015;5:16279 10.1038/srep16279. [DOI] [PMC free article] [PubMed] [Google Scholar]
- 22. Di Martino J, Mascalchi P, Legros P, et al. Actin depolymerization in dedifferentiated liver sinusoidal endothelial cells promotes fenestrae re‐formation. Hepatol Commun. 2018;0(0):1‐7. 10.1002/hep4.1301. [DOI] [PMC free article] [PubMed] [Google Scholar]
- 23. Xu K, Zhong G, Zhuang X. Actin, spectrin, and associated proteins form a periodic cytoskeletal structure in axons. Science (80‐ ). 2013;339(6118):452‐456. 10.1126/science.1232251. [DOI] [PMC free article] [PubMed] [Google Scholar]
- 24. Zapotoczny B, Owczarczyk K, Szafranska K, Kus E, Chlopicki S, Szymonski M. Morphology and force probing of primary murine liver sinusoidal endothelial cells. J Mol Recognit. 2017;30(7):1‐8. [DOI] [PubMed] [Google Scholar]
- 25. Øie CI, Mönkemöller V, Hübner W, et al. New ways of looking at very small holes ‐ using optical nanoscopy to visualize liver sinusoidal endothelial cell fenestrations. Nanophotonics. 2018;7(3):575‐596. 10.1515/nanoph-2017-0055. [DOI] [Google Scholar]
- 26. Brown JW, Bullitt E, Sriswasdi S, Harper S, Speicher DW, McKnight CJ. The physiological molecular shape of spectrin: a compact supercoil resembling a Chinese finger trap. PLoS Comput Biol. 2015;11(6):1‐20. 10.1371/journal.pcbi.1004302. [DOI] [PMC free article] [PubMed] [Google Scholar]
- 27. Bennett V, Spectrin BAJ. Ankyrin‐based pathways: metazoan inventions for integrating cells into tissues. Physiol Rev. 2017;81(3):1353‐1392. 10.1152/physrev.2001.81.3.1353. [DOI] [PubMed] [Google Scholar]
- 28. Coleman TR, Fishkind DJ, Mooseker MS, Morrow JS. Functional diversity among spectrin isoforms. Cell Motil Cytoskeleton. 1989;12(4):225‐247. 10.1002/cm.970120405. [DOI] [PubMed] [Google Scholar]
- 29. Cooper J. Effects of cytochalasin B on actin filaments. Cold Spring Harb Symp Quant Biol. 1987;37(0):585‐593. 10.1101/SQB.1973.037.01.069. [DOI] [Google Scholar]
- 30. Steffan AM, Gendrault JL, Kirn A. Increase in the number of fenestrae in mouse endothelial liver cells by altering the cytoskeleton with cytochalasin B. Hepatology. 1987;7(6):1230‐1238. 10.1002/hep.1840070610. [DOI] [PubMed] [Google Scholar]
- 31. Szymonski M, Targosz‐Korecka M, Malek‐Zietek KE. Nano‐mechanical model of endothelial dysfunction for AFM‐based diagnostics at the cellular level. Pharmacol Rep. 2015;67(4):728‐735. 10.1016/j.pharep.2015.05.003. [DOI] [PubMed] [Google Scholar]
- 32. Szczygiel AM, Brzezinka G, Targosz‐Korecka M, Chlopicki S, Szymonski M. Elasticity changes anti‐correlate with NO production for human endothelial cells stimulated with TNF‐α. Pflugers Arch. 2012;463(3):487‐496. 10.1007/s00424-011-1051-1. [DOI] [PMC free article] [PubMed] [Google Scholar]
- 33. Braet F, Rotsch C, Wisse E, Radmacher M. Comparison of fixed and living liver endothelial cells by atomic force microscopy. Appl Phys A Mater Sci Process. 1998;66:575‐578. 10.1007/s003390051204. [DOI] [Google Scholar]
- 34. Braet F, Wisse E. AFM imaging of fenestrated liver sinusoidal endothelial cells. Micron. 2012;43(12):1252‐1258. 10.1016/j.micron.2012.02.010. [DOI] [PubMed] [Google Scholar]
- 35. Braet F, Taatjes DJ, Wisse E. Probing the unseen structure and function of liver cells through atomic force microscopy. Semin Cell Dev Biol. 2018;73:13‐30. 10.1016/j.semcdb.2017.07.001. [DOI] [PubMed] [Google Scholar]
- 36. Becker PS, Cohen CM, Lux SF. The effect of mild diamide oxidation on the structure and function of human erythrocyte spectrin. J Biol Chem. 1986;261(10):4620‐4628. [PubMed] [Google Scholar]
- 37. Sinha A, Chu TTT, Dao M, Chandramohanadas R. Single‐cell evaluation of red blood cell bio‐mechanical and nano‐structural alterations upon chemically induced oxidative stress. Sci Rep. 2015;5:1‐8. 10.1038/srep09768. [DOI] [PMC free article] [PubMed] [Google Scholar]
- 38. Sosa JM, Nielsen ND, Vignes SM, Chen TG, Shevkoplyas SS. The relationship between red blood cell deformability metrics and perfusion of an artificial microvascular network. Clin Hemorheol Microcirc. 2014;57(3):291‐305. 10.3233/CH-131719. [DOI] [PMC free article] [PubMed] [Google Scholar]
- 39. Fischer TM, Haest CWM, Stöhr M, Kamp D, Deuticke B. Selective alteration of erythrocyte deformability by SH‐reagents. Evidence for an involvement of spectrin in membrane shear elasticity. BBA‐Biomembranes. 1978;510(2):270‐282. 10.1016/0005-2736(78)90027-5. [DOI] [PubMed] [Google Scholar]
- 40. Safeukui I, Buffet PA, Deplaine G, et al. Sensing of red blood cells with decreased membrane deformability by the human spleen. Blood Adv. 2018;2(20):2581‐2587. 10.1182/bloodadvances.2018024562. [DOI] [PMC free article] [PubMed] [Google Scholar]
- 41. Lock JT, Sinkins WG, Schilling WP. Effect of protein S‐glutathionylation on Ca2+ homeostasis in cultured aortic endothelial cells. Am J Physiol Heart Circ Physiol. 2011;300:493‐506. 10.1152/ajpheart.01073.2010. [DOI] [PMC free article] [PubMed] [Google Scholar]
- 42. Schmidt MM. Differential effects of iodoacetamide and iodoacetate on glycolysis and glutathione metabolism of cultured astrocytes. Front Neuroenergetics. 2009;1(March):1‐10. 10.3389/neuro.14.001.2009. [DOI] [PMC free article] [PubMed] [Google Scholar]
- 43. Aitken A, Learmonth M. Carboxymethylation of cysteine using iodoacetamide/iodoacetic acid In: Walker JM, ed. The Protein Protocols Handbook. Totowa, NJ: Humana Press Inc.; 2002. 10.1385/1-59259-169-8:455. [DOI] [Google Scholar]
- 44. Opas M, Turksen K, Kalnins VI. Effects of iodoacetic acid on cytoskeleton and adhesiveness of the chick RPE cells in vitro. Investig Ophthalmol Vis Sci. 1986;27(7):1068‐1074. [PubMed] [Google Scholar]
- 45. Braet F, Bomans PHH, Wisse E, Frederik PM. The observation of intact hepatic endothelial cells by cryo‐electron microscopy. J Microsc. 2003;212(2):175‐185. 10.1046/j.1365-2818.2003.01229.x. [DOI] [PubMed] [Google Scholar]
- 46. Braet F, Spector I, De Zanger R, Wisse E. A novel structure involved in the formation of liver endothelial cell fenestrae revealed by using the actin inhibitor misakinolide. Proc Natl Acad Sci U S A. 1998;95(23):13635‐13640. 10.1073/pnas.95.23.13635. [DOI] [PMC free article] [PubMed] [Google Scholar]
- 47. Braet F, Riches J, Geerts W, Jahn KA, Wisse E, Frederik P. Three‐dimensional organization of fenestrae labyrinths in liver sinusoidal endothelial cells. Liver Int. 2009;29(4):603‐613. 10.1111/j.1478-3231.2008.01836.x. [DOI] [PubMed] [Google Scholar]
- 48. Middelkoop E, Van der Hoek EE, Bevers EM, et al. Involvement of ATP‐dependent aminophospholipid translocation in maintaining phospholipid asymmetry in diamide‐treated human erythrocytes. BBA‐Biomembranes. 1989;981(1):151‐160. 10.1016/0005-2736(89)90093-X. [DOI] [PubMed] [Google Scholar]
- 49. Ferru E, Giger K, Pantaleo A, et al. Regulation of membrane‐cytoskeletal interactions by tyrosine phosphorylation of erythrocyte band 3. Blood. 2011;117(22):5998‐6006. 10.1182/blood-2010-11-317024. [DOI] [PMC free article] [PubMed] [Google Scholar]
- 50. Zapotoczny B, Szafranska K, Kus E, Chlopicki S, Szymonski M. Quantification of fenestrations in liver sinusoidal endothelial cells by atomic force microscopy. Micron. 2017;101:48‐53. 10.1016/j.micron.2017.06.005. [DOI] [PubMed] [Google Scholar]
- 51. Horcas I, Fernández R, Gómez‐Rodríguez JM, Colchero J, Gómez‐Herrero J, Baro AM. WSXM: a software for scanning probe microscopy and a tool for nanotechnology. Rev Sci Instrum. 2007;78(1):1‐8. 10.1063/1.2432410. [DOI] [PubMed] [Google Scholar]
- 52. Grimm KB, Oberleithner H, Fels J. Fixed endothelial cells exhibit physiologically relevant nanomechanics of the cortical Actin web. Nanotechnology. 2014;25(21):1‐7. 10.1088/0957-4484/25/21/215101. [DOI] [PubMed] [Google Scholar]
- 53. Fels J, Jeggle P, Kusche‐Vihrog K, Oberleithner H. Cortical Actin nanodynamics determines nitric oxide release in vascular endothelium. PLoS One. 2012;7(7):1‐11. 10.1371/journal.pone.0041520. [DOI] [PMC free article] [PubMed] [Google Scholar]
Associated Data
This section collects any data citations, data availability statements, or supplementary materials included in this article.
Supplementary Materials
Appendix S1: Supplementary animation
Supplementary Fig. 1 Two‐colored dSTORM imaging revealing the organization of actin and spectrin in the cytoskeleton of intact, control LSECs. The left panel represents spectrin (red, spectrin β II Antibody conjugated with Alexa Fluor 647), middle actin (green, phalloidin Atto488), and right merged signals on the interconnection of three LSECs. Encircled areas indicate example sieve plates.
Supplementary Figure 2 High‐magnification of the selected area of intact, control LSEC, visualized using two‐colored dSTORM imaging. The left panel represents spectrin (red, spectrin β II Antibody conjugated with Alexa Fluor 647) and actin (green, phalloidin Atto488), and right merged signals. Few fenestrae were indicated with arrowheads.
Supplementary Figure 3. Fluorescence micrographs of LSECs labeled with phalloidin‐Atto488 for actin. Similar to elasticity data presented in Figure 3 ‐ untreated (control) LSECs and LSECs treated with DIA (500 μM), CB (21 μM), IAA (10 μM) were presented. Scale bar: 20 μm.
Supplementary Figure 4. The number of fenestrae per μm2 calculated for 1% GA fixed LSECs for control (untreated) LSECs and LSECs treated with 1 μM calcium ionophore for 60 minutes. n = 8 and n = 5 for control and calcium ionophore group respectively.
Supplementary Figure 5. AFM data illustrating the interconnection of three live LSECs measured before (left) and after (right) 60 minutes of IAA treatment. An overall cell height decreased in the peripheral region of LSECs, which was connected with ~30% increase in porosity as calculated as the ratio of the area occupied by the fenestra to the LSEC cytoplasmic area. The experiment was repeated 4 times with similar results (n = 4). Scan size 20 × 20 μm; 256 × 256 force‐distance curves.


