

Abstract
Background
Childhood obesity is rising in developed and developing countries, while childhood underweight is rising mainly in developing countries. Childhood underweight has been shown to increase a child’s risk of rapid weight gain. Overweight and obese children are more likely to become obese adults, which increases the risk of type-II diabetes and cardiovascular diseases. Studies concerning obesity among Palestinian children are scarce. The prevalence of obesity among Palestinian children has increased from 3 to 6% within 5 years in comparison to the worldwide rise from 1 to 7%, within 41 years. We aim to determine the current prevalence of underweight, overweight and obesity among Palestinian school-age children and to assess the role of dietary and sociodemographic factors.
Methodology
A cross sectional study was conducted in Palestine in 2017. A total of 1320 school-age children and their 2640 corresponding parents were recruited. A written questionnaire was filled out by the parents. Anthropometric indices were measured and categorized according to the Center for Disease Control and prevention (CDC).
Results
The mean ± SD age of the children was 9.5 ± 1.5 years and 48.8% were females. The prevalence of underweight, overweight and obesity among the children was approximately 7.3% (95% CI = 5.9–8.8%), 14.5% (95% CI = 12.7–16.6%) and 15.7% (95% CI = 13.8–17.8%) respectively. Multinomial logistic regression analysis demonstrated a significant correlation of waist circumference, age, gender and living place with the body mass indexes of the students.
Conclusion
Our findings highlighted the accelerated increase in the prevalence of underweight, overweight and obesity (37.5%) among Palestinian children within a very short time in comparison to the globe. Therefore, Interventions aiming to prevent obesity and underweight at an early stage might be vital to avoid obesity later in life and its health-related co-morbidities, e.g. type-II diabetes and cardiovascular diseases.
Keywords: Childhood obesity, Childhood overweight, Childhood underweight, Dietary factors and socio-demographic factors
Background
Obesity is escalating at an alarming rate worldwide, affecting children and adults in both developed and developing countries. According to the World Health Organization report in 2016, more than 1.9 billion adults (~ 39%) were overweight. Of these, over 600 million were obese (~ 13%) worldwide [1]. However, the prevalence of obesity alone among men and women of the USA population was 37.9 and 41.1% respectively [2]. The trends in obesity prevalence among adults in Palestine are similar to those of the USA, 30% among men and 49% among women [3, 4]. Concerning childhood obesity, in 2016, the prevalence of obesity worldwide and in the USA has been shown to be approximately 7% [1] and 18.5% respectively [2, 5, 6]. Studies concerning obesity among Palestinian children are scarce.
Obesity presents a major risk to health. It has been shown to be responsible for an estimated 216,000 deaths accounting for about 1 in 10 deaths in US adults [7]. Obesity increases the risk of chronic diseases such as metabolic syndrome, insulin resistance syndrome, cardiovascular diseases, type-II diabetes mellitus and some cancers [8]. According to the Palestinian Ministry of Health, these diseases are the leading causes of death in Palestine, accounting for approximately 50% of deaths [9]. Furthermore, it has been estimated that obesity-related illnesses in adults cost $209.7 billion of the US national medical care costs, which equals 20.6% of the US national health expenditures [10]. On the other hand, underweight among children and adolescents is associated with higher risk of infectious diseases and leads to overweight and obesity in adulthood [11]. Consequently, obesity in Palestine requires serious attention due to the high prevalence in adults and scarcity of studies on children, who constitute approximately 50% of the Palestinian population [12].
There are a few earlier Palestinian studies concerning childhood obesity and underweight which focused on the prevalence while very little attention was paid to the risk factors. Furthermore, earlier studies were either self-reported or had a small range of students’ ages and most of them concerned with older ages (> 12 years old). These studies are old and the last one was conducted in 2009, in which it has been shown that the prevalence of overweight and obesity among Palestinian school age children was approximately 13 and 6% respectively [13, 14]. Therefore, this is the first time (1) to determine the prevalence of underweight, overweight and obesity amongst Palestinian children with younger and greater age diversity (between 6 and 12 years old) and (2) to assess the role of some environmental factors such as dietary factors, physical activities, and socio-economic and demographic factors.
Methods
Study design, sample size and population
This is a cross-sectional study, which was conducted in the governorate of Nablus, in the north of Palestine, between June 2017 and December 2017. The total population of Nablus was 387,240, which represented 8.2% of the total population of the West Bank (PCBS-2017). The total number of students studying in both private and governmental schools in Nablus was 65,169 students (2016–2017). In order to obtain a representative sample, the schools enrolled were selected from various areas of the governorate and were either governmental or private schools. Included students were from the city, a village and refugee camps. However, the students who reside in the refugee camps, included in this study, were those studying in private or governmental schools, not in schools belonging to the United Nations Relief and Works Agency for Palestine Refugees (UNRWA). Unfortunately, we were not able to obtain permission from UNRWA to include its students.
The inclusion criteria were; age between 6 and 12 years old, acceptance to participation, ability to give the anthropometric records and enrollment in governmental or private schools. The proportion of students enrolled from private schools represented 14% of the sample. This is due to the limited number of private schools and students in this sector in Palestine as the governmental (public) sector is the main provider of education and health in Palestine.
Data collection procedure
Permission was obtained from the department of school’s health, ministry of education, Palestine. This study was approved by An-Najah National University Institutional Review Board (8/August/2016). Then the researchers visited the chosen schools to inform them about the survey and to distribute the consent forms. After having received the consents from the parents/guardians of children, the researchers recorded the height, weight and waist circumference (WC) for each student in the examination room of the school. The researchers also recorded age as well as gender of each student. Then the students were asked to take the questionnaire to their homes to be filled out by one of their parents or guardians. The questionnaire was designed to gather personal, socioeconomic and demographic and life-style information (Food frequency, physical activity, transportation and electronic device use). The questions included in the questionnaire were tailored to the objectives of the study and the population sample. This is based on risk factors associated with childhood obesity investigated in many earlier studies worldwide [15, 16]. However, only the factors applied to the context of Nablus governorate were included in our questionnaire. Regarding the food frequency questionnaire, unfortunately, there is no Palestinian standardized and validated food frequency questionnaire for this specific dietary assessment and this age group (6–12 years). Therefore, the nutritionists in the research team conducted a 24-h recall for a small group of children (6–12 years) to assess the food items consumed by this group of children in the governorate of Nablus. The identified food items were included in the modified FFQ based on the one validated by Hamdan et al. [17].
Anthropometric measurements
Weight was measured to the nearest 0.1 kg in light clothing and bare feet using a digital balance (Omron, BF511). Standing height was measured to the nearest 0.5 cm using a portable tape measure without shoes. WC was recorded using an inelastic flexible standard plastic measuring tape on minimal clothing in the abdominal area in a standing position and measurement was recorded to the nearest 0.1 cm. All measurements were taken twice using a standard method of anthropometric assessment described earlier [18] and then averages were used to calculate body mass index (BMI). All children were fasting when measurements took place.
BMI was calculated as weight in kilograms divided by height in meters squared. It was categorized based on age and sex-specific cut-off values of the 2000 Centers for Disease Control and Prevention (CDC) growth charts. The categories were underweight (< 5th percentile), normal weight (5th to 85th percentile), overweight (85th to 95th percentile), and obese (> 95th percentile) [19].
Statistical analysis
Descriptive statistics and bivariate analysis were performed to assess the relationship between the independent variables (sociodemographic and questionnaire responses) and the child BMI as a dependent variable. BMI was calculated by dividing the child weight in kg by the child square height in meter. Therefore, the child weight and/or height were never considered as independent variables in any stage of the analysis due to strong correlation with the dependant variable (BMI).
Child’s BMI was categorized as underweight, normal, overweight and obese according to 2000 CDC reference. Chi square test was used to assess the relationship between categorical independent variables and dependent variable, while ANOVA was used to assess the relationship between the continuous independent variables and dependent variable. A P value less than 0.05 was always considered significant. Variables showed significance in the bivariate analysis was then entered in the multinomial logistic regression analysis using enter method.
Results
Participants’ characteristics
The total number of students aged (6–12) years old in private and governmental sectors in the province was 65,169 students. To achieve an acceptable margin of error up to 5% at the 95% confidence level, the sample size should be at least 400 participants. We expected a low response rate due to psychological aspects of obesity among the Palestinian people; therefore, we chose a convenient sample of 1320 to ensure obtaining a good study response rate. Clearly, this 1320 sample size gave a margin of error of 3%. It should be noted that this study estimated different categories of BMI (i.e., normal, underweight, overweight and obesity), therefore, calculating the sample size based on any single BMI category would not be accurate. We distributed consent forms to 1320 families and got 100% agreement to participate in this study. We recorded anthropometric indices, age and gender for their children. Then children were asked to take the questionnaire to their homes to be filled by one of their parents/guardians. In this study phase, the response rate was approximately 58% (i,e., not all families filled the requested information). The mean ± SD of the age was 9.5 ± 1.5 years and 48.8% were females. As shown in Table 1, approximately 58.9% of the children were living in the city, 34.5% in villages and 6.6% in refugee camps. The majority (73%) of parents declared that their children walked to school, while 5.8, 25.5 and 68.8% of the children have spent less than 30, 60 and above 60 min in daily physical activities. On the other hand, 15.4, 37.4 and 47.3% of children have spent less than 30, 60 and above 60 min respectively watching on a screen as declared by their parents. The majority of the mothers (83.6%) had at least high school education, while it was 76.9% in the case of the fathers. However, only 20% of the mothers were employed. Fifth of the mothers (21%) had a caesarean section. Mothers declared that feeding regimens in the first 6 months of their children’s lives were 68.3, 7.7% or 23.9% for breastfeeding, formula milk or a combination of both respectively. Regarding parents’ anthropometrics, 38.5% of mothers and 46.1% of fathers were overweight, while 18.3 and 27.2% of mothers and fathers were obese, respectively. Almost one third (29.8%) of the mothers had gestational diabetes and only 4% of the mothers were smokers. Children had various dietary habits which were described in Table 2.
Table 1.
Association between socio-demographic and physical activity factors with child’s BMI
| BMI of Children | |||||||
|---|---|---|---|---|---|---|---|
| Characteristics | Normal n (%) | Overweight n (%) | Obese n (%) | Underweight n (%) | Total n (%) | p-value | |
| Living place | City |
229 69.6% |
42 12.8% |
50 15.2% |
8 2.4% |
329 100.0% |
0.002 |
| Village |
115 59.6% |
33 17.1% |
29 15.0% |
16 8.3% |
193 100.0% |
||
| Refugees Camp |
19 51.4% |
5 13.5% |
12 32.4% |
1 2.7% |
37 100.0% |
||
| Maternal education level | Not educated |
8 80.0% |
2 20.0% |
0 .0% |
0 .0% |
10 100.0% |
0.928 |
| Primary school |
52 65.8% |
10 12.7% |
15 19.0% |
2 2.5% |
79 100.0% |
||
| High school |
149 64.5% |
37 16.0% |
35 15.2% |
10 4.3% |
231 100.0% |
||
| College |
35 64.8% |
6 11.1% |
10 18.5% |
3 5.6% |
54 100.0% |
||
| BA or more |
105 62.5% |
24 14.3% |
30 17.9% |
9 5.4% |
168 100.0% |
||
| Paternal education level | Not educated |
7 63.6% |
3 27.3% |
1 9.1% |
0 .0% |
11 100.0% |
0.315 |
| Primary school |
74 64.9% |
19 16.7% |
15 13.2% |
6 5.3% |
114 100.0% |
||
| High school |
144 64.0% |
35 15.6% |
34 15.1% |
12 5.3% |
225 100.0% |
||
| College |
34 56.7% |
12 20.0% |
13 21.7% |
1 1.7% |
60 100.0% |
||
| BA or more |
91 68.9% |
10 7.6% |
26 19.7% |
5 3.8% |
132 100.0% |
||
| Maternal work | Housewife |
279 64.9% |
60 14.0% |
71 16.5% |
20 4.7% |
430 100.0% |
0.882 |
| Others |
68 63.0% |
18 16.7% |
18 16.7% |
4 3.7% |
108 100.0% |
||
| House hold income (NIS)* | < 2000 |
72 69.2% |
11 10.6% |
16 15.4% |
5 4.8% |
104 100.0% |
0.717 |
| 2000–2999 |
110 65.5% |
28 16.7% |
23 13.7% |
7 4.2% |
168 100.0% |
||
| 3000–3999 |
90 60.8% |
21 14.2% |
32 21.6% |
5 3.4% |
148 100.0% |
||
| > 4000 |
69 62.7% |
16 14.5% |
19 17.3% |
6 5.5% |
110 100.0% |
||
| Maternal BMI | Normal |
149 70.0% |
34 16.0% |
22 10.3% |
8 3.8% |
213 100.0% |
0.049 |
| Overweight |
118 60.2% |
25 12.8% |
45 23.0% |
8 4.1% |
196 100.0% |
||
| Obese |
54 58.1% |
17 18.3% |
20 21.5% |
2 2.2% |
93 100.0% |
||
| Underweight |
4 57.1% |
1 14.3% |
1 14.3% |
1 14.3% |
7 100.0% |
||
| Paternal BMI | Normal |
98 75.4% |
15 11.5% |
12 9.2% |
5 3.8% |
130 100.0% |
0.005 |
| Overweight |
152 65.5% |
37 15.9% |
33 14.2% |
10 4.3% |
232 100.0% |
||
| Obese |
74 54.0% |
20 14.6% |
38 27.7% |
5 3.6% |
137 100.0% |
||
| Underweight |
4 100.0% |
0 .0% |
0 .0% |
0 .0% |
4 100.0% |
||
| Having gestational diabetes | Yes |
155 68.5% |
31 13.7% |
31 13.7% |
10 4.4% |
227 100.0% |
0.773 |
| No |
347 65.0% |
76 14.2% |
88 16.5% |
23 4.3% |
534 100.0% |
||
| Mode of delivery | Normal |
291 66.3% |
60 13.7% |
67 15.3% |
21 4.8% |
439 100.0% |
0.199 |
| Caesarean |
69 59.0% |
20 17.1% |
25 21.4% |
3 2.6% |
117 100.0% |
||
| Feeding | Breastfeeding |
246 66.0% |
51 13.7% |
59 15.8% |
17 4.6% |
373 100.0% |
0.341 |
| Formulas |
28 66.7% |
3 7.1% |
8 19.0% |
3 7.1% |
42 100.0% |
||
| Both |
79 60.3% |
25 19.1% |
24 18.3% |
3 2.3% |
131 100.0% |
||
| Smoking during pregnancy | Yes |
10 66.7% |
2 13.3% |
3 20.0% |
0 .0% |
15 100.0% |
0.740 |
| No |
202 56.4% |
60 16.8% |
75 20.9% |
21 5.9% |
358 100.0% |
||
| Transporting means to school | Family Car or School Bus |
89 59.3% |
20 13.3% |
36 24.0% |
5 3.3% |
150 100.0% |
0.031 |
| Walking |
274 67.5% |
59 14.5% |
55 13.5% |
18 4.4% |
406 100.0% |
||
| Screen time (minutes) | < 30 |
52 61.9% |
14 16.7% |
12 14.3% |
6 7.1% |
84 100.0% |
0.069 |
| 60 |
145 71.1% |
28 13.7% |
24 11.8% |
7 3.4% |
204 100.0% |
||
| > 60 |
154 59.7% |
37 14.3% |
56 21.7% |
11 4.3% |
258 100.0% |
||
| Physical activity (minutes) | < 30 |
18 56.3% |
7 21.9% |
5 15.6% |
2 6.3% |
32 100.0% |
0.560 |
| 60 |
86 61.4% |
18 12.9% |
30 21.4% |
6 4.3% |
140 100.0% |
||
| > 60 |
249 66.2% |
54 14.4% |
57 15.2% |
16 4.3% |
376 100.0% |
||
|
WC mean + SD (N) |
Walking | 68.2 ± 6.5 (106) | 78.1 ± 9.0 (119) | 57.1 ± 4.8 (33) | 756 | 0.000 | |
|
Birth weight (Kg) mean + SD (N) |
3.2 ± 0.6 (349) | 3.3 ± 0.7 (80) | 3.2 ± 0.6 (91) | 2.9 ± 0.5 (24) | 544 | 0.154 | |
|
Child’s daily allowance* mean + SD (N) |
2.7 ± 1.4 (356) | 2.9 ± 1.3 (80) | 3.0 ± 1.4 (92) | 2.8 ± 1.9 (24) | 552 | 0.557 | |
|
Total number of family members mean + SD (N) |
6.4 ± 2.2 (356) | 6.4 ± 1.7 (80) | 6.2 ± 1.5 (92) | 6.8 ± 1.3 (24) | 552 | 0.592 | |
*:NIS: New Israeli Shekel
Table 2.
Association between dietary factors and child’s BMI
| BMI of Children | |||||||
|---|---|---|---|---|---|---|---|
| Characteristics | Normal n (%) | Overweight n (%) | Obese n (%) | Underweight n (%) | Total n (%) | p-value | |
| Having breakfast | Never |
25 67.6% |
5 13.5% |
4 10.8% |
3 8.1% |
37 100.0% |
0.239 |
| Once a month |
28 59.6% |
7 14.9% |
7 14.9% |
5 10.6% |
47 100.0% |
||
| Twice a week |
43 64.2% |
11 16.4% |
11 16.4% |
2 3.0% |
67 100.0% |
||
| Most days |
190 61.9% |
45 14.7% |
59 19.2% |
13 4.2% |
307 100.0% |
||
| More than once a day |
48 78.7% |
7 11.5% |
6 9.8% |
0 .0% |
61 100.0% |
||
| Meat intake | Never |
15 60.0% |
6 24.0% |
3 12.0% |
1 4.0% |
25 100.0% |
0.139 |
| Once a month |
26 55.3% |
11 23.4% |
5 10.6% |
5 10.6% |
47 100.0% |
||
| Twice a week |
153 63.8% |
32 13.3% |
48 20.0% |
7 2.9% |
240 100.0% |
||
| Most days |
141 68.8% |
25 12.2% |
29 14.1% |
10 4.9% |
205 100.0% |
||
| More than once a day |
14 63.6% |
5 22.7% |
2 9.1% |
1 4.5% |
22 100.0% |
||
| Fish intake | Never |
63 60.0% |
19 18.1% |
20 19.0% |
3 2.9% |
105 100.0% |
0.076 |
| Once a month |
208 67.1% |
44 14.2% |
45 14.5% |
13 4.2% |
310 100.0% |
||
| Twice a week |
50 59.5% |
8 9.5% |
21 25.0% |
5 6.0% |
84 100.0% |
||
| Most days |
14 66.7% |
2 9.5% |
4 19.0% |
1 4.8% |
21 100.0% |
||
| More than once a day |
4 57.1% |
1 14.3% |
0 .0% |
2 28.6% |
7 100.0% |
||
| Diary intake | Never |
7 77.8% |
1 11.1% |
1 11.1% |
0 .0% |
9 100.0% |
0.497 |
| Once a month |
19 67.9% |
6 21.4% |
3 10.7% |
0 .0% |
28 100.0% |
||
| Twice a week |
55 62.5% |
13 14.8% |
15 17.0% |
5 5.7% |
88 100.0% |
||
| Most days |
164 65.1% |
42 16.7% |
38 15.1% |
8 3.2% |
252 100.0% |
||
| More than once a day |
108 64.3% |
16 9.5% |
34 20.2% |
10 6.0% |
168 100.0% |
||
| Rice and Pasta intake | Never |
3 42.9% |
3 42.9% |
0 .0% |
1 14.3% |
7 100.0% |
0.094 |
| Once a month |
27 79.4% |
5 14.7% |
1 2.9% |
1 2.9% |
34 100.0% |
||
| Twice a week |
100 60.2% |
25 15.1% |
31 18.7% |
10 6.0% |
166 100.0% |
||
| Most days |
182 66.7% |
36 13.2% |
48 17.6% |
7 2.6% |
273 100.0% |
||
| More than once a day |
40 59.7% |
11 16.4% |
11 16.4% |
5 7.5% |
67 100.0% |
||
| Cereals at breakfast | Never |
126 61.2% |
34 16.5% |
34 16.5% |
12 5.8% |
206 100.0% |
0.511 |
| Once a month |
76 72.4% |
10 9.5% |
17 16.2% |
2 1.9% |
105 100.0% |
||
| Twice a week |
78 63.9% |
19 15.6% |
21 17.2% |
4 3.3% |
122 100.0% |
||
| Most days |
49 60.5% |
15 18.5% |
12 14.8% |
5 6.2% |
81 100.0% |
||
| More than once a day |
9 56.3% |
2 12.5% |
5 31.3% |
0 .0% |
16 100.0% |
||
| Bread intake | Never |
3 60.0% |
1 20.0% |
0 .0% |
1 20.0% |
5 100.0% |
0.4 |
| Once a month |
23 65.7% |
5 14.3% |
5 14.3% |
2 5.7% |
35 100.0% |
||
| Twice a week |
22 57.9% |
7 18.4% |
9 23.7% |
0 .0% |
38 100.0% |
||
| Most days |
118 67.8% |
26 14.9% |
24 13.8% |
6 3.4% |
174 100.0% |
||
| More than once a day |
185 64.2% |
39 13.2% |
51 17.7% |
14 4.9% |
289 100.0% |
||
| Fruits intake | Never |
4 66.7% |
0 .0% |
2 33.3% |
0 .0% |
6 100.0% |
.895 |
| Once a month |
21 67.7% |
4 12.9% |
4 12.9% |
2 6.5% |
31 100.0% |
||
| Twice a week |
72 63.2% |
16 14.0% |
22 19.3% |
4 3.5% |
114 100.0% |
||
| Most days |
146 65.2% |
30 13.4% |
39 17.4% |
9 4.0% |
224 100.0% |
||
| More than once a day |
107 63.3% |
30 17.8% |
23 13.6% |
9 5.3% |
169 100.0% |
||
| Fruit juice intake | Never |
18 47.4% |
9 23.7% |
9 23.7% |
2 5.3% |
38 100.0% |
0.45 |
| Once a month |
49 62.8% |
14 17.9% |
13 16.7% |
2 2.6% |
78 100.0% |
||
| Twice a week |
116 61.7% |
26 13.8% |
37 19.7% |
9 4.8% |
188 100.0% |
||
| Most days |
128 69.9% |
21 11.5% |
25 13.7% |
9 4.9% |
183 100.0% |
||
| More than once a day |
40 69.0% |
9 15.5% |
7 12.1% |
2 3.4% |
58 100.0% |
||
| Vegetables intake | Never |
6 42.9% |
3 21.4% |
3 21.4% |
2 14.3% |
14 100.0% |
0.695 |
| Once a month |
34 63.0% |
8 14.8% |
9 16.7% |
3 5.6% |
54 100.0% |
||
| Twice a week |
90 65.7% |
20 14.6% |
21 15.3% |
6 4.4% |
137 100.0% |
||
| Most days |
157 66.5% |
34 14.4% |
39 16.5% |
6 2.5% |
236 100.0% |
||
| More than once a day |
63 61.8% |
13 12.7% |
19 18.6% |
7 6.9% |
102 100.0% |
||
| Salad intake | Never |
13 54.2% |
3 12.5% |
5 20.8% |
3 12.5% |
24 100.0% |
0.515 |
| Once a month |
34 68.0% |
9 18.0% |
5 10.0% |
2 4.0% |
50 100.0% |
||
| Twice a week |
161 64.9% |
39 15.7% |
40 16.1% |
8 3.2% |
248 100.0% |
||
| Most days |
111 64.2% |
19 11.0% |
33 19.1% |
10 5.8% |
173 100.0% |
||
| More than once a day |
32 64.0% |
9 18.0% |
8 16.0% |
1 2.0% |
50 100.0% |
||
| Chips intake | Never |
11 52.4% |
1 4.8% |
6 28.6% |
3 14.3% |
21 100.0% |
0.337 |
| Once a month |
35 72.9% |
7 14.6% |
4 8.3% |
2 4.2% |
48 100.0% |
||
| Twice a week |
69 66.3% |
16 15.4% |
17 16.3% |
2 1.9% |
104 100.0% |
||
| Most days |
129 63.2% |
31 15.2% |
33 16.2% |
11 5.4% |
204 100.0% |
||
| More than once a day |
109 64.5% |
24 14.2% |
30 17.8% |
6 3.6% |
169 100.0% |
||
| Chocolate intake | Never |
10 52.6% |
6 31.6% |
2 10.5% |
1 5.3% |
19 100.0% |
0.016 |
| Once a month |
28 63.6% |
5 11.4% |
8 18.2% |
3 6.8% |
44 100.0% |
||
| Twice a week |
87 61.7% |
28 19.9% |
24 17.0% |
2 1.4% |
141 100.0% |
||
| Most days |
132 60.6% |
27 12.4% |
43 19.7% |
16 7.3% |
218 100.0% |
||
| More than once a day |
91 75.2% |
14 11.6% |
14 11.6% |
2 1.7% |
121 100.0% |
||
| Carbonated Beverages intake | Never |
72 60.5% |
18 15.1% |
22 18.5% |
7 5.9% |
119 100.0% |
0.581 |
| Once a month |
81 69.8% |
13 11.2% |
14 12.1% |
8 6.9% |
116 100.0% |
||
| Twice a week |
114 63.0% |
28 15.5% |
33 18.2% |
6 3.3% |
181 100.0% |
||
| Most days |
58 66.7% |
16 18.4% |
12 13.8% |
1 1.1% |
87 100.0% |
||
| More than once a day |
27 64.3% |
5 11.9% |
8 19.0% |
2 4.8% |
42 100.0% |
||
| Energy drinks intake | Never |
305 64.2% |
71 14.9% |
78 16.4% |
21 4.4% |
475 100.0% |
0.749 |
| Once a month |
12 60.0% |
3 15.0% |
4 20.0% |
1 5.0% |
20 100.0% |
||
| Twice a week |
20 71.4% |
0 .0% |
7 25.0% |
1 3.6% |
28 100.0% |
||
| Most days |
8 72.7% |
2 18.2% |
1 9.1% |
0 .0% |
11 100.0% |
||
| More than once a day |
5 55.6% |
2 22.2% |
1 11.1% |
1 11.1% |
9 100.0% |
||
| Diet carbonated drinks intake | Never |
312 65.4% |
69 14.5% |
75 15.7% |
21 4.4% |
477 100.0% |
0.087 |
| Once a month |
14 53.8% |
6 23.1% |
5 19.2% |
1 3.8% |
26 100.0% |
||
| Twice a week |
13 68.4% |
1 5.3% |
4 21.1% |
1 5.3% |
19 100.0% |
||
| Most days |
6 46.2% |
1 7.7% |
6 46.2% |
0 .0% |
13 100.0% |
||
| More than once a day |
3 42.9% |
3 42.9% |
0 .0% |
1 14.3% |
7 100.0% |
||
| Sweets (Knafeh, Cakes) | Never |
23 62.2% |
8 21.6% |
4 10.8% |
2 5.4% |
37 100.0% |
0.04 |
| Once a month |
101 63.1% |
20 12.5% |
33 20.6% |
6 3.8% |
160 100.0% |
||
| Twice a week |
147 62.6% |
40 17.0% |
42 17.9% |
6 2.6% |
235 100.0% |
||
| Most days |
66 73.3% |
7 7.8% |
9 10.0% |
8 8.9% |
90 100.0% |
||
| More than once a day |
15 65.2% |
5 21.7% |
1 4.3% |
2 8.7% |
23 100.0% |
||
| Fast food intake | Never |
26 57.8% |
8 17.8% |
9 20.0% |
2 4.4% |
45 100.0% |
0.656 |
| Once a month |
119 66.1% |
24 13.3% |
32 17.8% |
5 2.8% |
180 100.0% |
||
| Twice a week |
137 62.3% |
31 14.1% |
38 17.3% |
14 6.4% |
220 100.0% |
||
| Most days |
55 71.4% |
11 14.3% |
8 10.4% |
3 3.9% |
77 100.0% |
||
| More than once a day |
16 61.5% |
6 23.1% |
4 15.4% |
0 .0% |
26 100.0% |
||
| Nuts intake | Never |
23 59.0% |
7 17.9% |
9 23.1% |
0 .0% |
39 100.0% |
0.829 |
| Once a month |
118 65.2% |
25 13.8% |
29 16.0% |
9 5.0% |
181 100.0% |
||
| Twice a week |
131 62.1% |
37 17.5% |
33 15.6% |
10 4.7% |
211 100.0% |
||
| Most days |
62 69.7% |
8 9.0% |
15 16.9% |
4 4.5% |
89 100.0% |
||
| More than once a day |
16 66.7% |
3 12.5% |
4 16.7% |
1 4.2% |
24 100.0% |
||
Prevalence of underweight, overweight and obesity and the role of gender and age
As shown in Fig. 1, the prevalence of underweight, overweight and obesity among the 1320 students were approximately 7.3% (95% CI = 5.9–8.8%), 14.5% (95% CI = 12.7–16.6%) and 15.7% (95% CI = 13.8–17.8%) respectively. As shown in Fig. 2 a and b, we have conducted a chi-square analysis for gender (male, female) and age (6,7,8,9,10,11 and 12 years) among BMI categories (normal, underweight, overweight and obesity) and the chi-square p-value in both cases was found to be < 0.001. The percentage of the normal-weight female was 61% while the percentage of the overweight female was 15.1%. On the other hand, the percentage of those of 9 years old and had normal weight was 65%, while only 5% of the same age was underweight. Also, those who were 12-year-old and normal weight represented nearly 66%, while nearly 17% were obese for the same age. For the distribution of the percentages of gender and age among BMI categories refer to Fig. 2 a and b.
Fig. 1.
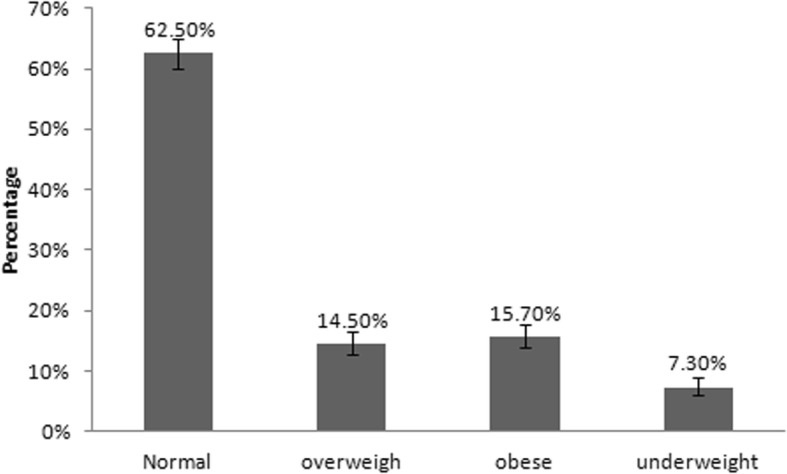
Prevalence of underweight, overweight and obesity among school age children. Error bars represent CI. N = 1320
Fig. 2.

a Distribution of Gender among BMIs categories: b Distribution of age among BMIs categories. N = 1320
Bivariate analysis
Out of 1320 questionnaires sent to the families of the children, only 761 were filled out. Such questionnaires were used to calculate the association of students’ BMIs with sociodemographic, physical activity and dietary factors. As described in Table 1 (sociodemographic factors), living place (P = 0.001), maternal BMI (P = 0.049), paternal BMI (P = 0.005) and WC (P < 0.00049) were shown to have significant associations with BMIs of school-age children. However, parental education, maternal work, household income, gestational diabetes, mode of delivery, breastfeeding, smoking, birth weight, daily allowance and total number of family members had no associations with BMI categories. Levels of physical activity are shown in Table 2. It was found that only transportation means had a significant effect (P = 0.031). Screen time had no significant effect, however, it has a borderline effect (P = 0.069). The food frequency questionnaire (Table 2) has revealed that chocolate (P = 0.016) and sweets (P = 0.04) had significant effect on the BMIs of the students.
Multinomial logistic regression analysis
To further analyze and understand the relationship between the aforementioned factors, variables showed to be significant in the above bivariate analysis were entered in multinomial logistic regression analysis where we built a multivariate model to assess the multi-factorial effect of independent variables on child’s BMI. This model showed that WC, age, gender and living place remained significantly associated with BMIs of the students (Table 3). Interestingly, this model indicated that the variables in the model could explain 72% of the variation in BMIs of the students. Females were more likely to be underweight (OR = 23.5; 95% CI = 3.87–141.77). Students living in the city were more likely to be obese (OR = 3.6; 95% CI = 1.09–11.81), simultaneously, they were less likely to be underweight (OR = 0.04; 95% CI = 0.01–0.21). Older ages were significantly less likely to be overweight and obese (ORs and 95%CIs were; 0.67 and 0.51–0.88 for overweight and; 0.39 and 0.26–0.58 for obese). Students with higher WC were significantly more likely to be overweight and obese (ORs and 95%CIs were; 1.4 and 1.27–1.50 for overweight and; 1.8 and 1.59–2.02 for obese). However, higher WC were significantly less likely to be underweight (OR and 95% CI were 0.72 and 0.60–0.87).
Table 3.
Multinomial regression analysis model for the variables associated with child’s BMI #
| Variable | Overweight | Obese | Underweight | Pseudo R-Square (Nagelkerke) |
||||||
|---|---|---|---|---|---|---|---|---|---|---|
| B | SE | OR (95%CI) | B | SE | OR (95%CI) | B | SE | OR (95%CI) | ||
|
Gender* Female |
0.47 | 0.35 | 1.6 (0.8–3.20) | 0.87 | 0.54 | 2.24 (0.78–6.44) | 3.16 | 0.92 | 23.47 (3.87–141.77) | 0.72 |
|
Screen time‡ < 30 min |
0.81 | 0.48 | 2.25 (.89–5.70) | 0.8 | 0.73 | 2.22(0.54–9.25) | 0.05 | 0.8 | 1.05 (0.22–5.04) | |
| 60 min | −0.24 | 0.39 | 0.79 (0.37–1.69) | − 0.94 | 0.58 | 0.39 (0.13–1.20) | − 0.36 | 0.64 | 0.70 (0.20–2.42) | |
|
Fish intake± Never |
−0.40 | 0.45 | 0.67 (0.28–1.60) | −0.6 | 0.63 | 0.55 (0.16–1.87) | − 0.12 | 0.76 | 0.89 (0.20–3.92) | |
|
Chocolate± Never |
0.75 | 0.83 | 2.11 (0.41–10.77) | 0.05 | 1.42 | 1.05 (0.06–16.99) | 2.68 | 1.39 | 14.61 (0.96–221.74) | |
|
Diet beverage± Never |
−0.50 | 0.53 | 0.61 (0.22–1.70) | − 0.74 | 0.76 | 0.48 (0.11–2.13) | 1.18 | 1.17 | 3.25 (0.33–32.14) | |
|
Sweets intake± Never |
0.52 | 0.68 | 1.68 (0.44–6.34) | −0.66 | 0.98 | 0.52 (0.08–3.49) | 0.70 | 0.96 | 2.01 (0.31–13.18) | |
|
Living place© City |
0.41 | 0.41 | 1.50 (0.68–3.34) | 1.28 | 0.61 | 3.58 (1.09–11.81) | −3.11 | 0.79 | 0.04 (0.01–0.21) | |
|
Transporting means to school° Bus |
0.21 | 0.39 | 1.23 (0.58–2.65) | 0.6 | 0.53 | 1.82 (0.64–5.15) | −1.03 | 0.76 | 0.36 (0.08–1.57) | |
| Mothers weight^ | 0.001 | 0.02 | 1.00 (0.97–1.03) | 0.02 | .02 | 1.02 (0.97–1.06) | 0.02 | 0.03 | 1.02 (0.97–1.08) | |
| Fathers BMI^ | −0.002 | .04 | 1.00 (0.92–1.08) | 0.09 | 0.06 | 1.09 (0.98–1.22) | 0.10 | 0.06 | 1.11 (0.98–1.25) | |
| Age^ | −0.40 | 0.14 | 0.67 (0.51–0.88) | −0.95 | 0.21 | 0.39 (0.26–0.58) | 0.07 | 0.23 | 1.07 (0.68–1.68) | |
| WC^ | 0.32 | 0.04 | 1.38 (1.27–1.50) | 0.58 | 0.06 | 1.79 (1.59–2.02) | −0.33 | 0.1 | 0.72 (0.60–0.87) | |
#: Reference category (Normal weight); *: male; ‡:> 60 min; ±: yes;©: village; °: walking; ^: OR: odd ratio. CI: confidence intervals
Discussion
Overweight and obese children are more likely to become obese adolescents and adults, with major short and long-term health and economic consequences [20–22]. Obesity-related disorders, such as metabolic syndrome, insulin resistance, type 2 diabetes and cardiovascular diseases, which are known to occur only in adults now appear in children [23]. Strikingly, childhood underweight increases the risk of overweight and obesity later in life [11]. Therefore, determining the current prevalence and understanding the factors related to obesity and/or underweight in children are vital.
In the current study, we found that the prevalence of overweight and obesity were 14.5 and 15.7% respectively. This is similar to the prevalence in the USA and some neighboring Middle Eastern countries such as Jordan [24]. Nevertheless, it is still lower than the prevalence of other Middle Eastern countries such as Saudi Arabia (20–28%). The observed prevalence of obesity in this study, but not overweight, is higher than the prevalence determined in earlier studies in Palestine. In 2004, the prevalence of overweight and obesity among Palestinian children [25] was approximately 13.3 and 3.2% respectively; while in 2009, it was approximately 13 and 6% respectively [13, 26]. Together with the current findings, a fast rise in the prevalence of obesity, but not overweight, in Palestinian children has been revealed within a very short period of time, which is alarming. The prevalence of obesity worldwide has risen from 1 to 7% within 41 years [1]; similarly, it has increased in Palestine, however, in a very accelerated manner from 3.2 to 15.7% within 14 years. This agrees with the prevalence of Middle Eastern countries, where Palestine geographically is located [27].
Although studies concerning childhood obesity are scarce in Palestine; the attention paid to underweight prevalence and its associated factors, is even less. In the present study, we have found that the prevalence of underweight is approximately 7.3%, which was 2 folds higher than the prevalence observed in an earlier Palestinian study of a similar age [13] and of that in the USA [28]. The prevalence of underweight found in the current study, was even higher than the prevalence in similar age group of neighbouring countries such as Jordan (5.7%) [24]. Our data suggest that the prevalence of underweight in Palestinian children has doubled within a short period of time (10 years).
This is the first time in Palestine to study the association of BMI of young children (6–12 years) with a wide range of factors, such as sociodemographic, physical activity and dietary factors. Employing bivariate analysis, we found that gender, age, living place, maternal and paternal BMI, WC, transportation means and chocolate and sweet intake were significantly associated with BMIs of children. However, employing the multivariate model, we found that gender, age, living place and WC remained significant, while the rest failed to show such significant associations. This could be due to the notion that all students who had one or more missing data were removed from the multivariate model. However, this missing data was random with no specific pattern of characteristics among participants. For example, no missing data was shown regarding gender, age and WC (i.e., these variables were entered in the multivariate model).
Our results demonstrate the coexistence of underweight, overweigh and obese children in Palestine at the same time, which contribute to approximately 37.5% of unhealthy body weight, which was found to be almost 2 folds higher than described earlier (2009) in Palestine [13]. This is a common and a major problem in low and middle income countries and is described as a double burden of malnutrition [29, 30]. Our data agree with Massad, et al. [13] findings, where that underweight was associated with gender and physical activity of the Palestinian children. In contrast to our study, Massad, et al. [13] showed an association between underweight and unemployed mothers. Our results also agree with Mikki’s, et al. [14] findings, who reported that living place had a significant effect on BMI, while education of mothers and family size had no association. On the other hand, they did not show an association with age, in contrast to our findings.
Although the questionnaires were self reported, the prevalence of many variables was similar to the ones described in earlier Palestinian studies, suggesting that our data is reliable. For example the prevalence of caesarean section observed in our study (21%) corresponds with a recent study in Palestine [31] and with the global rate [32]. We also found that 56.5% of mothers and 73.4% of fathers were overweight and obese, which agrees with earlier Palestinian studies [2, 33–35]. The percentage of the smoking mothers (4%) is similar to the percentage described earlier (3.5%) [36].
We found that approximately 30% of the mothers had gestational diabetes mellitus (GDM). To our knowledge, this is the first study in Palestine to investigate the prevalence of GDM. The observed prevalence is extremely high in comparison to neighboring countries such as Jordan (13.5–17.3% [37, 38] and Saudi Arabia (24.2%) [39] and European countries (2–6%) [40]. This high prevalence could be an overestimate as a result of self-reporting; however, this indicates the need to further study the prevalence of GDM and its related risk factors in Palestine in the future.
We found some factors that were significantly associated with BMIs, using bivariate analysis, but not by multivariate analysis. This could be due to the limited size of the sample of these factors. For example, the majority of parents were overweight and obese and 4% of the sample was smoking mothers. This is one of the limitations of the current study, which make it difficult to investigate its relation to BMIs of the children. Another limitation was self reported questionnaires. In addition, this study was limited to Nablus governorate; however, together with earlier and recent studies in Palestine, obesity prevalence is high and increasing in children.
Conclusion
Prevalence of underweight, overweight and obesity among Palestinian school age children was found to be high. It has been rising dramatically in an accelerated manner within a short period of time in comparison with the international figures. Rise in obesity prevalence is most probably due to the fast urbanization and the transition from conventional to western-life style after the establishment of the Palestinian authority. Furthermore, unfortunately, Palestine is located in a conflict area that is politically and economically unstable, where people are exposed to food insecurity and movement restrictions at the time of conflicts. This may unfortunately enable the coexistence of underweight, overweigh and obese children in Palestine at the same time, which result in approximately 40% of children at increased health risks due to being in an unhealthy weight. In our study, we found that gender, age, living place and WC have been associated with BMIs of the Palestinian children. As a consequence, our findings call for a serious attention to obesity in Palestinian children, who constitute approximately 50% of the total population in Palestine [12]. Therefore, obesity prevention should be a national public health priority to reduce and prevent it at an early stage, and consequently preventing its related disorders and economic consequences.
Acknowledgements
We gratefully acknowledge the Palestinian Ministries of Education, Higher Education and Research for their permission and facilitation of our visits to the schools.
Abbreviations
- BMI
Body mass index
- CDC
Center for Disease Control and prevention
- GDM
Gestational diabetes mellitus
- NIS
New Israeli Shekel
- UNRWA
United Nations Relief and Works Agency for Palestine Refugees
- WC
Waist circumference
Authors’ contributions
SA conceptualized and designed the study, wrote the proposal, drafted and revised the manuscript and participated in collection, entry, analysis and interpretation of the data. HA conducted the statistical analysis, interpreted the results and participated in drafting and revising the MS. OA helped in data analysis interpretation and revising the manuscript. AI, MA, LB, RM, RH, TA, SJ, BA measured anthropometric indices, collected and entered the data and revised the manuscript. MAl, MD, FN, RT and NJ helped in the design of the study, entered data and participated in critical revision of the manuscript for the important intellectual content. All authors had read and approved the final version of the manuscript and agree to be accountable for all aspects of the work in ensuring that questions related to the accuracy or integrity of any part of the work are appropriately investigated and resolved.
Funding
The Financial support of An-Najah National University to undertake this work under grant number ANNU-1718-Sc030 is highly acknowledged. The content is solely the responsibility of the authors and does not necessarily represent the official views of the funder. The funders had no role in the study design or collection, analysis, or interpretation of data, nor in writing this manuscript.
Availability of data and materials
The datasets used and/or analysed during the current study are available from the corresponding author on reasonable request.
Ethics approval and consent to participate
The study was approved by the Institutional Review Board at An-Najah National University. The reference number for the ethics committee is 8/August/2016. The committee evaluated the ethical aspects of the study in accordance with The World Medical Association’s Declaration of Helsinki. Informed written consent was obtained from the parents before commencement of the study.
Consent for publication
Not applicable.
Competing interests
The authors declare that they have no competing interests.
Footnotes
Publisher’s Note
Springer Nature remains neutral with regard to jurisdictional claims in published maps and institutional affiliations.
References
- 1.W.H.O. Obesity and overweight fact sheets 2014; Available from: http://www.who.int/mediacentre/factsheets/fs311/en/
- 2.Hales CM, et al. Prevalence of obesity among adults and youth: United States, 2015–2016. 2017. [PubMed] [Google Scholar]
- 3.Ng M, et al. Global, regional, and national prevalence of overweight and obesity in children and adults during 1980-2013: a systematic analysis for the global burden of disease study 2013. Lancet. 2014;384(9945):766–781. doi: 10.1016/S0140-6736(14)60460-8. [DOI] [PMC free article] [PubMed] [Google Scholar]
- 4.Abdul-Rahim HF, et al. Obesity in a rural and an urban Palestinian West Bank population. Int J Obes Relat Metab Disord. 2003;27(1):140–146. doi: 10.1038/sj.ijo.0802160. [DOI] [PubMed] [Google Scholar]
- 5.Hales CM, C.M., Fryar CD, Ogden and CL., Prevalence of obesity among adults and youth: United States . NCHS data brief, no 288. Hyattsville, MD: National Center for Health Statistics; 2015. p. 2017. [PubMed] [Google Scholar]
- 6.Ogden CL, et al. Prevalence of obesity among adults and youth: United States, 2011–2014. NCHS data brief. 2015;219(219):1–8. [PubMed] [Google Scholar]
- 7.Danaei G, et al. The preventable causes of death in the United States: comparative risk assessment of dietary, lifestyle, and metabolic risk factors. PLoS Med. 2009;6(4):e1000058. doi: 10.1371/journal.pmed.1000058. [DOI] [PMC free article] [PubMed] [Google Scholar]
- 8.Berrington de Gonzalez A, et al. Body-mass index and mortality among 1.46 million white adults. N Engl J Med. 2010;363(23):2211–2219. doi: 10.1056/NEJMoa1000367. [DOI] [PMC free article] [PubMed] [Google Scholar]
- 9.Health annual report, Ministry of Health, PHIC, health status, Palestine, 2015, October 2016.
- 10.Cawley J, Meyerhoefer C. The medical care costs of obesity: an instrumental variables approach. J Health Econ. 2012;31(1):219–230. doi: 10.1016/j.jhealeco.2011.10.003. [DOI] [PubMed] [Google Scholar]
- 11.Caballero B. A nutrition paradox--underweight and obesity in developing countries. N Engl J Med. 2005;352(15):1514–1516. doi: 10.1056/NEJMp048310. [DOI] [PubMed] [Google Scholar]
- 12.Statistics, P.C.B.o. and (PCBS), Palestinian Child's Day, P.C.B.o. Statistics and (PCBS), Editors. 2014.
- 13.Massad S, et al. Double burden of Undernutrition and obesity in Palestinian schoolchildren: a cross-sectional study. Food Nutr Bull. 2016;37(2):144–152. doi: 10.1177/0379572116637720. [DOI] [PubMed] [Google Scholar]
- 14.Mikki N, et al. Prevalence and sociodemographic correlates of stunting, underweight, and overweight among Palestinian school adolescents (13-15 years) in two major governorates in the West Bank. BMC Public Health. 2009;9:485. doi: 10.1186/1471-2458-9-485. [DOI] [PMC free article] [PubMed] [Google Scholar]
- 15.Weng SF, et al. Systematic review and meta-analyses of risk factors for childhood overweight identifiable during infancy. Arch Dis Child. 2012;97(12):1019–1026. doi: 10.1136/archdischild-2012-302263. [DOI] [PMC free article] [PubMed] [Google Scholar]
- 16.Reilly JJ, et al. Early life risk factors for obesity in childhood: cohort study. BMJ. 2005;330(7504):1357. doi: 10.1136/bmj.38470.670903.E0. [DOI] [PMC free article] [PubMed] [Google Scholar]
- 17.Hamdan M, et al. Development and validation of a nutritional questionnaire for the Palestine population. Public Health Nutr. 2014;17(11):2512–2518. doi: 10.1017/S1368980013002711. [DOI] [PMC free article] [PubMed] [Google Scholar]
- 18.Lee, R. and D. Nieman, Nutritional Assessment: Sixth Edition. 2012: McGraw-Hill Higher Education.
- 19.Kuczmarski RJ, et al. CDC growth charts for the United States: methods and development. Vital Health Stat 11. 2000;2002(246):1–190. [PubMed] [Google Scholar]
- 20.Organization, W.H., Report of the commission on ending childhood obesity. 2016: World Health Organization.
- 21.Sassi F. Obesity and the economics of prevention: fit not fat. París. Francia: OECD; 2010. [Google Scholar]
- 22.Cunningham SA, Kramer MR, Narayan KV. Incidence of childhood obesity in the United States. N Engl J Med. 2014;370(5):403–411. doi: 10.1056/NEJMoa1309753. [DOI] [PMC free article] [PubMed] [Google Scholar]
- 23.Daniels S. Complications of obesity in children and adolescents. Int J Obes. 2009;33(S1):S60. doi: 10.1038/ijo.2009.20. [DOI] [PubMed] [Google Scholar]
- 24.Zayed AA, et al. Prevalence of short stature, underweight, overweight, and obesity among school children in Jordan. BMC Public Health. 2016;16(1):1040. doi: 10.1186/s12889-016-3687-4. [DOI] [PMC free article] [PubMed] [Google Scholar]
- 25.Al Sabbah H, et al. Associations of overweight and of weight dissatisfaction among Palestinian adolescents: findings from the national study of Palestinian schoolchildren (HBSC-WBG2004) J Hum Nutr Diet. 2009;22(1):40–49. doi: 10.1111/j.1365-277X.2008.00901.x. [DOI] [PubMed] [Google Scholar]
- 26.Isbaih MA. Prevalence of overweight and obesity among school-age children in Nablus City. Nablus, Palestine: MSc thesis, An-Najah National University; 2009. [Google Scholar]
- 27.Popkin BM. The shift in stages of the nutrition transition in the developing world differs from past experiences! Public Health Nutr. 2002;5(1A):205–214. doi: 10.1079/PHN2001295. [DOI] [PubMed] [Google Scholar]
- 28.Yanovski JA. Obesity: trends in underweight and obesity - scale of the problem. Nat Rev Endocrinol. 2018;14(1):5–6. doi: 10.1038/nrendo.2017.157. [DOI] [PMC free article] [PubMed] [Google Scholar]
- 29.Akombi Blessing J., Chitekwe Stanley, Sahle Berhe W., Renzaho Andre M.N. Estimating the Double Burden of Malnutrition among 595,975 Children in 65 Low- and Middle-Income Countries: A Meta-Analysis of Demographic and Health Surveys. International Journal of Environmental Research and Public Health. 2019;16(16):2886. doi: 10.3390/ijerph16162886. [DOI] [PMC free article] [PubMed] [Google Scholar]
- 30.Caleyachetty R, et al. The double burden of malnutrition among adolescents: analysis of data from the global school-based student health and health behavior in school-aged children surveys in 57 low- and middle-income countries. Am J Clin Nutr. 2018;108(2):414–424. doi: 10.1093/ajcn/nqy105. [DOI] [PubMed] [Google Scholar]
- 31.Zimmo MW, et al. Caesarean section in Palestine using the Robson ten Group classification system: a population-based birth cohort study. BMJ Open. 2018;8(10):e022875. doi: 10.1136/bmjopen-2018-022875. [DOI] [PMC free article] [PubMed] [Google Scholar]
- 32.Betran AP, et al. The increasing trend in caesarean section rates: global, regional and National Estimates: 1990-2014. PLoS One. 2016;11(2):e0148343. doi: 10.1371/journal.pone.0148343. [DOI] [PMC free article] [PubMed] [Google Scholar]
- 33.Stene L, et al. Obesity and associated factors in a Palestinian West Bank village population. Eur J Clin Nutr. 2001;55(9):805. doi: 10.1038/sj.ejcn.1601230. [DOI] [PubMed] [Google Scholar]
- 34.Abdeen Z, et al. Overweight and obesity among Palestinian adults: analyses of the anthropometric data from the first National Health and nutrition survey (1999-2000) J Obes. 2012;2012:213547. doi: 10.1155/2012/213547. [DOI] [PMC free article] [PubMed] [Google Scholar]
- 35.El Kishawi RR, et al. Obesity and overweight: prevalence and associated socio demographic factors among mothers in three different areas in the Gaza strip-Palestine: a cross-sectional study. BMC Obes. 2014;1:7. doi: 10.1186/2052-9538-1-7. [DOI] [PMC free article] [PubMed] [Google Scholar]
- 36.Statistics, P.C.B.o., Final Report of the Palestinian Family Survey 2010. Ramallah – State of Palestine, 2013.
- 37.Basha AS, et al. Prevalence of gestational diabetes and contributing factors among pregnant Jordanian women attending Jordan University hospital. Int J Diabetes Dev Ctries. 2019;39(1):132–138. doi: 10.1007/s13410-018-0635-0. [DOI] [Google Scholar]
- 38.Zalzala, B., S. Hijazi, O. Al-Kuran, Prevalence of gestational diabetes mellitus in North of Jordan. 2009, Master’s thesis, Faculty of graduate studies, The Jordan University of.
- 39.Wahabi H, et al. Prevalence and complications of Pregestational and gestational diabetes in Saudi women: analysis from Riyadh mother and baby cohort study (RAHMA) Biomed Res Int. 2017;2017:6878263. doi: 10.1155/2017/6878263. [DOI] [PMC free article] [PubMed] [Google Scholar]
- 40.Buckley BS, et al. Gestational diabetes mellitus in Europe: prevalence, current screening practice and barriers to screening. Rev Diabet Med. 2012;29(7):844–854. doi: 10.1111/j.1464-5491.2011.03541.x. [DOI] [PubMed] [Google Scholar]
Associated Data
This section collects any data citations, data availability statements, or supplementary materials included in this article.
Data Availability Statement
The datasets used and/or analysed during the current study are available from the corresponding author on reasonable request.