

SUMMARY
Environmental influences (infections and diet) strongly affect a host’s microbiota. However, host genetics may influence commensal communities, as suggested by the greater similarity between the microbiomes of identical twins compared to nonidentical twins. Variability of human genomes and microbiomes complicates the understanding of polymorphic mechanisms regulating the commensal communities. Whereas animal studies allow genetic modifications, they are sensitive to influences known as “cage” or “legacy” effects. Here, we analyze exgerm-free mice of various genetic backgrounds, including immunodeficient and major histocompatibility complex (MHC) congenic strains, receiving identical input microbiota. The host’s polymorphic mechanisms affect the gut microbiome, and both innate (anti-microbial peptides, complement, pentraxins, and enzymes affecting microbial survival) and adaptive (MHC-dependent and MHC-independent) pathways influence the microbiota. In our experiments, polymorphic mechanisms regulate only a limited number of microbial lineages (independently of their abundance). Our comparative analyses suggest that some microbes may benefit from the specific immune responses that they elicit.
In Brief
The importance of polymorphic genes in shaping commensal repertoire is unclear. Khan et al. use genetically different GF mice transferred with identical microbiotas to show that polymorphism in both innate and adaptive immune mechanisms influence the output microbiomes. These mechanisms are likely to work in concert with nonpolymorphic microbiota-controlling mechanisms.
Graphical Abstract
INTRODUCTION
Commensal microbes are indispensable for the existence of their eukaryotic hosts and provide essential functions (nutrition and pathogen colonization resistance) required for the host’s survival, as well as performing a number of accessory functions such as influencing the status of the immune system, vascularization, and behavior (Belkaid and Hand, 2014). The composition of microbial communities varies from individual to individual and is shaped by multiple factors, including the mode of transmission during birth, breastfeeding, alimentary infections, and diet. The overall microbial composition can change rapidly in response to the latter two factors (Carmody et al., 2015; Rothschild et al., 2018), but tends to return to the pre-challenge state (David et al., 2014), albeit with some irreversible losses (Sonnenburg et al., 2016). Previous studies suggested that the host’s genetics shape the microbial repertoire. Microbiotas cross-transplanted between animals of distant classes acquire features dictated by the new host (Rawls et al., 2006), which could be an extreme example. A more proximate example is the greater similarity of the microbiomes between identical twins than between nonidentical twins (Goodrich et al., 2014, 2016). However, two important questions remain unanswered: to what extent and which host’s polymorphic mechanisms are involved in shaping the repertoire of the commensals?
Since genetic manipulation in humans is not possible, these issues could only be addressed by animal experiments. The animal approach has intrinsic problems that are illustrated by conflicting findings made by using the same mouse strains at different institutions (Elinav et al., 2018; Wullaert et al., 2018). These discrepancies arise because, even with other environmental factors held constant, variation in the colonizing input microbiota defines the outcomes. Several approaches can be used to reduce the influence of “cage” or “legacy” effects, such as using littermates or the single housing of animals. However, the litter size usually limits the numbers of animals of different genotypes available for statistical analyses, so that the cage effects from separate housing of animals of different genotypes inevitably confound experimental outcomes.
Here, by using the same input microbiota to colonize genetically distinct germ-free (GF) animals, we learned how polymorphic host genes shape the intestinal microbial communities.
RESULTS
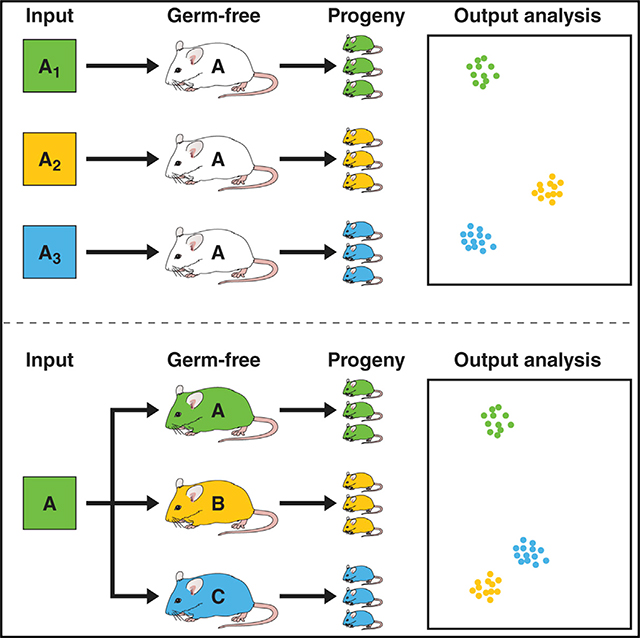
First, we sought to define to what extent the input microbiota determines the outcome of colonization experiments (Figure 1A). We performed several independent experiments colonizing GF C57BL/6J (B6) mice with the cecal contents of specific-pathogen-free (SPF) B6 mice either obtained from The Jackson Laboratory (JAX) and maintained in our colony (B6-UC, cohort 1), straight from JAX (JAX, cohort 4), or straight from Taconic (B6TAC, cohorts 2 and 3) (Table S1). In all of the experiments, female recipient mice (G0) were colonized within minutes of obtaining donor material inside gnotobiotic isolators and were bred to produce offspring (G1). Subsequently, the microbiomes of 8-weekold G1 mice were analyzed by 16S rRNA targeted amplicon sequencing. G1 microbiomes did not segregate from the microbiomes of the G0 mothers (Figure S1). However, principal-component analysis (PCA) of the sequencing results of the female microbiomes obtained from the SPF B6 to GF B6 microbiota transfers clearly segregated recipients (cohorts 1–4) by different input (Figure 1B; Table S1) visualizing the legacy effects (Figure 1B; Table S1). Thus, finding a clear definition for a “B6specific microbiome” was not a trivial task.
Figure 1. Input Microbiome Defines the Output Microbiota Composition in Genetically Identical Gnotobiotic Mice.

(A) Experimental scheme. Generation 0 (G0) mice were transferred with cecal contents from C57BL/6J mice (input microbiota). Generation 1 (G1) progeny were used to isolate cecal microbial DNA at 8 weeks of age. DNA was analyzed by targeted amplicon sequencing of 16S rRNA encoding genes. Experiments were repeated multiple times with variable input.
(B) Principal-component analysis (PCA) of the microbiomes of ex-germ-free C57BL/6J female mice transferred with C57BL/6J microbiota in four independent experiments (left panel) and relative abundance of common taxonomic families (right panel) in the microbiomes of individual mice from the same experiments. Colored dots, individual mice. The numbers of animals from all of the cohorts used in experiments are shown in Table S1.
This problem, however, does not preclude comparison of the microbiomes of mice from different strains within the same microbiota transfer experiment (Figure 2A; a combined summary of strain usage for all of the experiments in this study is shown in Table S1). The transfer of SPF B6 cecal contents to GF B6, GF BALB/cJ, and GF C3H/HeN mice resulted in the clear segregation of commensal repertoires in the recipients (Figures 2B, 2C, and S2A–S2G). Previously reported gender-driven differences of microbiomes within a given strain (Yurkovetskiy et al., 2013) were also detectable in this study (Figures 2D and S2H). These differences, however, appeared to be dominated bymicrobiome differences between strains (Figures 2E and S2H), allowing us to include mice of both genders in strain comparisons.
Figure 2. Mouse Strains Shape Intestinal Microbiota Composition in a Genetic Background- and an Input-Dependent Manner.

(A) Experimental scheme. Within the same cohort, GF mice of different genetic backgrounds were repopulated with cecal microbiota from the same input source. The cecal microbiota of their progeny was obtained at 8 weeks of age and analyzed by sequencing 16S rRNA gene amplicons.
(B and C) Microbiomes of mice from three ex-GF mouse strains (C57BL/6J [red], C3H/HeN [blue], and BALB/cJ [orange]) repopulated with the microbiota from SPF C57BL/6 mice in two independent experiments (cohorts 1, B, and 2, C) were compared by PCA analysis using a relative abundance of bacterial genera. Individual mice are represented by rectangles (males) and circles (females).
(D) Comparison of the microbiomes of ex-GF C57BL/6J males and females from cohort 1. Males are represented by red rectangles and females by black circles. (E–H) Comparison of the microbiomes of two ex-GF strains (C57BL/6J and BALB/cJ) colonized with the same microbiotas shown as PCA (E), or as heatmaps for lineages with statistically significant differences (p < 0.05, FDR-adjusted t test) in cohorts 1 (F), 3 (G), and (H). Non-specific genera identified at family, order, or class level are marked with an asterisk. Lineages that are commonly present in mice of the same genetic background in more than one experiment are in bold. (I) Relative operational taxonomic unit (OTU) abundance of the 3 lineages that were found enhanced in C57BL/6J mice compared to BALB/cJ mice in cohorts 1 and 3, but not in cohort 2 (see Figure S2).
(J and K) Comparison of the microbiomes of ex-GF BALB/cJ and C3H/HeN mice repopulated with the same microbiota from a C57BL/6J donor (J) and heatmaps for statistically significant lineage differences (p < 0.05, FDR-adjusted t test) (K).
Second, we sought to test whether the abundance of specific microbes was associated with the genetic background of the host. Comparisons of the BALB/c and B6 microbiomes from 3 independent microbiota transfer experiments, in which B6-UC or B6-TAC microbiota donors were used, identified bacterial lineages with a statistically significant variation (p < 0.05, false discovery rate [FDR]-adjusted t test) in abundance between the two recipient mouse strains (Figures 2F–2H). Moreover, three lineages defined as Turicibacter, and members of the Clostridiaceae and Peptostreptococcaceae families were excluded from BALB/c microbiomes in cohorts 1 and 3 and were present in B6 microbiomes independently of the mouse gender (Figures 2F and 2G). However, in the third experiment (cohort 2; Figures 2H and S2F), these lineages were not rendered as different in the microbiomes of recipient BALB/c and B6 mice. When the relative abundances of these lineages in B6 mice were compared between all of the experiments, it became clear that two lineages (Turicibacter and members of family Peptostreptococcaceae) were undetectable and one lineage (members of family Clostridiaceae) was reduced in the B6 mice from cohort 2 compared to the B6 mice from other cohorts (Figure 2I). Thus, this result could be simply explained by the paucity of these lineages in the microbiota of the donor used in this experiment.
Figures 2J and 2K (and Figures S2C and S2D) illustrate the establishment of distinct microbiome patterns between another two unrelated mouse strains, BALB/cJ and C3H/HeN (cohort 1), that we transferred with the same input microbiota.
The microbiomes are likely shaped by different forces, including immune (innate and adaptive) mechanisms, which differ in the ways that they sense the microbiota and in the effector mechanisms triggered by the recognition. Adaptive mechanisms based on T cell reactivity and/or T cell-dependent antibody responses rely on antigen presentation by molecules of the major histocompatibility complexes (MHCs) expressed on the surface of specialized cells. To address the importance of MHCs in shaping the microbiomes, we rederived four additional GF strains–BALB/c.H-2j (congenic to BALB/c with the H-2j MHC allele derived from I/LnJ mice; Figure S3A); BALB.B (congenic to BALB/c, but carrying the MHC H-2b allele found in B6 mice); and another pair of strains, I/LnJ (H-2j) and I/LnJ.H-2k (congenic to I/LnJ, carrying the H-2k MHC allele from C3H/He mice; Figure S3A)–and used them as recipients in microbiota transfer experiments. In one of the experiments, the microbiomes of ex-GF BALB/cJ mice (H-2d) were compared to the microbiomes of exGF BALB/c.H-2j (H-2j) as well as to unrelated B6 and C3H/HeN mice (Figure 3A). The distinction between the microbiomes of these two BALB-based MHC congenic strains when simultaneously compared to B6 and C3H microbiomes was visualized by a 3-dimensional PCA plot (cohort 1; Figure 3A). That distinction was not as obvious in the 2-dimensional (2D) plot (Figure S3B) due to the shorter distance between BALB/c and BALB/c-H-2j microbiomes compared to their distance from B6 and C3H/HeN microbiomes in PCA space. A direct comparison of the two microbiomes (Figures 3B and S3C) revealed their separation. Comparison of the microbiomes of other MHC congenic mice, BALB/c (H-2d) and BALB.B (H-2b) (cohort 2; Figures 3C and S3D), revealed differences between them as well. The microbiomes of I/LnJ (H-2j) and I/LnJ.C3H (H-2k) repopulated with the B6 microbiota differed from the microbiomes of control B6 recipients as expected (cohort 3; Figure 3D), but were not separable in either PCA or principal-coordinate analysis (PCoA) paired comparison (Figures 3E and S3E). Overall, MHC congenic strains carried microbiomes that were either not separable by 16S rRNA gene analyses or were closer to one another than to the microbiomes of mice from unrelated strains.
Figure 3. MHC-Dependent and -Independent Adaptive Mechanisms Contribute Moderately to the Shaping of the Intestinal Microbiota.

(A) Mutual positioning of the microbiomes of MHC congenic strains BALB/cJ (H-2d) and BALB/c (H-2j) compared to positions of the microbiomes of C57BL/6J and C3H/HeN mice in PCA space (see also Figure S3).
(B and C) Pairwise comparisons of the microbiomes of mice from MHC congenic strains BALB/c versus BALB/c.H-2j (B) and BALB/c versus BALB.B (C).
(D) Microbiomes of ex-GF C57BL/6J mice compared to the microbiomes of a pair of MHC congenic strains (I/LnJ [H-2] and I/LnJ-H-2k) transferred with the same microbiota.
(E) Pairwise analysis of I/LnJ and I/LnJ-H-2k microbiomes from the same experiment.
(F) Statistically significant bacterial lineage differences between BALB.B (H-2b) and MHC congenic BALB/c (H-2d) mice (p < 0.05, FDR-adjusted t test) shown as a contiguous heatmap (left) and their similarity with lineages observed in C57BL/6J mice (H-2b) (separate heatmap at right). Mice were from the same cohort 2. Genera significantly differentially abundant between BALB/cJ and C57BL/6J (p < 0.05, FDR-adjusted t test) are marked in bold.
(G) Heatmap showing abundances of bacterial lineages significantly (p < 0.05, FDR-adjusted t test) different between MHC-sharing ex-GF C57BL/6J and BALB.B mice.
(H) Bacterial lineages with significantly (p < 0.05, FDR-adjusted t test) different abundances in BALB/cJ and BALB/c.Rag1−/−mice. Dehalobacterium (bold) is also present in (G).
(I) qPCR comparison of the SFB loads in three BALB/c-based strains (BALB.B, BALB/cJ, and BALB/c.Rag1−/−). Log2 (fold change) compared to B6 was calculated as described in Experimental Model and Subject Details. Horizontal lines indicate the means of values obtained for each individual data point ± SD. Significance for real-time PCR was calculated by ordinary one-way ANOVA.
(J and K) Comparison of IgA+ and IgA- bacteria found in ex-GF MHC congenic BALB/cJ (J) and BALB.B (K) mice transferred with the same input microbiota. Shared genera are marked in bold. Heatmaps show lineages with statistically significant differences (p < 0.05, FDR-adjusted t test).
Error bars indicate SD.
Comparison of the microbiomes of recipient BALB/c (H-2d), BALB.B (H-2b), and B6 (H-2b) mice allows a simultaneous analysis of the MHC- and non-MHC-dependent control of the microbial composition of the gut. First, microbial lineages with statistically different abundances between BALB/c and BALB.B strains (p < 0.05, FDR-adjusted t test) were identified. Second, their abundance in the B6 (H-2b) mice used in the same association experiment was measured (cohort 2; Figures 3C and 3F). The pattern of significant differences in the representation of bacterial lineages between BALB/c and BALB.B mice was similar to the differences between BALB/c and B6 mice (Figure 3F). Notably, the abundances of Holdemania, Mucispirillum, and Coprococcus were higher in BALB.B and B6 mice (p < 0.05, FDR-adjusted t test) compared to BALB/c mice (Figure 3F). Thus, expansion of the listed bacteria was favored in mice of the H-2b MHC haplotype. At the same time, some bacterial lineages differentially amplified in the microbiomes of MHC-identical B6 and BALB.B mice (Figure 3G) pointed at the influences of non-MHC genes on microbial composition.
Another way to measure the input of adaptive immunity in controlling the microbiota is to use mice lacking an adaptive immune system, such as recombination-activating gene (RAG) recombinase animals. A comparison of the microbiota of simultaneously repopulated GF BALB/c and BALB/c.Rag1−/− mice revealed an enhanced presence of several microbial lineages, including Holdemania and Coprococcus in Rag1-deficient mice (Figure 3H). The same lineages were also enhanced in BALB.B and B6 compared to MHC-disparate BALB/c mice (Figure 3F), suggesting that the low abundance of these lineages in BALB/c mice was due to antigen-specific adaptive immune mechanisms.
Another lineage enhanced in BALB/c.Rag1−/− mice was Dehalobacterium (Figure 3H). It was reduced in BALB.B mice compared to B6 that have the same MHC (Figure 3G), meaning that this bacterium’s control was MHC independent. Thus, this lineage could be controlled by mechanisms that involve somatically rearranged immunoreceptors that are independent of MHC, such as receptors of NKT cells or of gamma-delta T cells.
Bacteria identified as Candidatus Arthromitus (also known as segmented filamentous bacteria [SFB]) presented an interesting case. SFB were more abundant in B6 than in BALB/c mice in cohort 1 (Figure 2F) (similar to a previously reported GF association experiment; Fransen et al., 2015; Figure S4A), and in BALB.B mice, this bacterium showed a trend of higher abundance compared to BALB/c mice (cohort 2; Figure S4B). Thus, we used qPCR to validate these findings and to compare SFB abundances in BALB/c, BALB.B, BALB/c.Rag1−/−, and B6 mice from the same transfer experiment (Figure 3I). Whereas BALB.B demonstrated an SFB abundance similar to B6, both BALB/c and, most important, BALB/c.Rag1−/− mice, had reduced abundances of this bacterium. These results suggested that the H-2b MHC haplotype favors SFB replication. Previous publications have revealed that B6 mice mount anti-SFB responses (Th17 response [Ivanov et al., 2009] and T cell-dependent immunoglobulin A [IgA] response [Bunker et al., 2015]). BALB/c RAG-deficient mice cannot mount such responses, yet they demonstrated a paucity of SFB compared to BALB.B and B6 mice. The data led to the conclusion that SFB benefits from immune responses induced in H-2b mice.
To test whether MHC differences affect anti-commensal IgA responses, we used the IgA sequencing (IgA-seq) method (Palm et al., 2014) to compare microbes bound by IgA in MHC congenic BALB/c and BALB.B mice. Thus, IgA+ and IgA microbes were sorted from the colonic contents of BALB/c and BALB.B mice colonized with the same microbiota (Figure S4C) and analyzed for 16S rRNA gene variation. Whereas the majority of IgA antibodies in the steady state recognize microbial and dietary antigens in a T cell-independent and broadly specific manner (Bunker et al., 2017), pathogens induce highly specific IgA antibodies, and some commensals are enriched in the IgA+ fraction when sequences of sorted IgA+ and IgA microbes are compared (Palm et al., 2014; Bunker et al., 2015).
Lineage variations with statistical significance (p < 0.05, FDR-adjusted t test) were found between the IgA+ and IgA fractions in mice from both strains (Figures 3J and 3K). Most IgA lineages were identical between BALB/c and BALB.B mice, whereas IgA+ lineages were distinct between the two congenic strains. For example, both Mucispirillum and SFB were found to be coated with IgA in BALB.B mice, but they were excluded from the IgA+ fractions in BALB/c mice (Figures 3J and 3K). These two lineages were previously described in B6 (H-2b) mice as stimulating production of IgA in a T cell-dependent manner (Bunker et al., 2015). Thus, our approach demonstrates that the ability to induce such IgA responses depends on the specific alleles of MHC molecules.
Finally, to define microbiota-controlling effector mechanisms that are polymorphic, we profiled gene expression in the different compartments of the guts of mice from two genetically distinct backgrounds. We isolated RNA from three regions of the gut (duodenum + jejunum, DJ; ileum, I; and colon, C) of ex-GF B6 and BALB/c mice from cohort 2 and used it for RNA sequencing (RNA-seq) analysis. Variation in gene expression between the two strains was obvious in all three regions of the gut (Figure 4A), and, as expected, the gene expression profiles were distinct between the regions of the gut (Figures 4B and 4C).
Figure 4. Polymorphic Gene Expression in the Intestinal Compartments of Ex-GF C57BL/6J and BALB/cJ Mice Colonized with the Same Microbiota (Cohort 2).

(A) PCA of RNA-seq data generated from different intestinal compartments from the two mouse strains. A total of 6 BALB/c and 7 C57BL/6 mice were used.
(B) Heatmaps showing significant (p < 0.05, FDR-adjusted t test) differences in gene expression identified between the two strains using log2 fold change as a readout. Gene names in bold reflect statistical significance in a specific compartment.
(C) Differences in the expression of defensins alpha between mice from the two strains. BLAST sequence similarity of BALB/c sequence and C57BL/6J reference gene sequence is indicated at right.
Significant gene expression differences between B6 and BALB/cJ strains were identified using both log2 fold change (detected at >1 transcript per million [TPM]) and p < 0.05 (FDR-adjusted t test). The expression of both adaptive and innate immunity genes showed strain-specific variations (Figure S5). B6 and BALB/cJ mice used distinct sets of Ig VH and VL genes. However, this polymorphism is not uniquely linked to anti microbial antibodies (Collins et al., 2015).
Aside from adaptive immunity genes, the functions of the remaining host genes differentially expressed in BALB/c and B6 mice were analyzed using Gene Ontology (GO) (Ashburner et al., 2000). We were specifically interested in differentially expressed genes with functions that may regulate intestinal homeostasis. Two broad functional categories of genes differentially expressed in the intestinal compartments of B6 and BALB/c mice were identified. The first group included genes supporting a wide range of innate immune functions, including negative regulators of peptidase activity (Serpin A family members), complement proteins, interferon-stimulated genes, an inflammasome component, pentraxins, and osteopontin (Figure 4B). The detailed description of the genes in this eclectic group is shown in Table S2. The second large group of discordant genes included antimicrobial peptides—defensins alpha (Defa) (Figure 4C). The complete list of genes with significantly different expression between B6 and BALB/c mice is shown in Table S3.
DISCUSSION
Overall, the results of our studies demonstrate that when the living environment of the animal is strictly controlled, including controlled microbial repopulation, the influences of host genetics on microbial composition could be detected and studied. We have compared the microbiomes of post-pubescent G1 mice, the progeny of the microbiota recipient G0 mice of different genetic backgrounds. This strategy allowed us to analyze stabilized commensal communities after they have been shaped by pregnancy, transfer to newborns, early infancy, and exposure to milk and solid food. Recently demonstrated genetic variations, such as Tlr5 deficiency (Fulde et al., 2018) affected the microbiota composition in neonatal mice more strongly than in adults, supporting our choice of the experimental protocol.
Unambiguously, the input microbiota strongly determined the resultant microbiota in its recipients (Figures 1B and 2F–2I). For instance, comparison of the microbiota of B6 and BALB/c repopulated ex-GF mice from different colonization experiments identified several common lineages, such as Turicibacter, Clostridiaceae, and Peptostreptococcaceae differentially abundant in cohorts 1 and 3 (Figures 2F and 2G), but not in cohort 2 (Figure 2H). These results were explained by the lack of Turicibacter and Peptostreptococcaceae lineages in the donor microbiota used to repopulate mice in cohort 2 (Figure 2I). Bacteria from the Clostridiaceae family found in mice from cohort 2 did not show differential abundance in recipient BALB/c and B6 microbiota (Figure 2I). That was most likely due to the presence of different members of the Clostridiaceae family in mice from cohort 2 compared to mice from cohorts 1 and 3. We have also processed the data from a previously published experiment (Fransen et al., 2015), in which the bacterial species of ex-GF B6 and BALB/c adult GF recipient mice associated with the B6 microbiota were compared at 8 weeks post-transfer. We found that the differential abundance of bacterial lineages between BALB/ cJ and B6 mice described in that study did not overlap with our results (Figure S4A), supporting the point that the input microbiota defines the output results in the transfer studies. These results suggest that the only way to overcome the legacy effects is to compare microbiomes of mice within the same transfer experiment.
Using congenic and gene-targeted GF mice, it is possible to detect microbial lineages that are controlled by different types of immune mechanisms. MHC congenic GF mouse strains are a valuable tool to address the role of adaptive immune mechanisms in the control of microbial composition. Although it was previously suggested that mice with different MHC alleles may have distinct microbial compositions (Kubinak et al., 2015), the experimental setup used could not exclude the influence of input variations on the results. By excluding input variations, we were able to detect MHC-dependent microbial shifts in two of three congenic mouse strain combinations tested (Figures 3B, 3D, and 3E). Whereas the microbiomes of MHC congenic strains on the BALB/c genetic background carrying H-2j, H-2b, and H-2d haplotypes were separable by PCA (Figures 3B and 3C) or PCoA (Figures S3C and S3D) analyses, the microbiomes of the I/LnJ MHC congenic strains (H-2j versus H-2k) were not (Figures 3E and S3E). Furthermore, the overall distances between the microbiomes of BALB/c MHC congenic mice were smaller than the distances between the microbiomes of the strains of completely different backgrounds (Figure 3A). Although such experiments should be repeated using frozen aliquoted microbiota stocks or defined microbial communities, our experiments suggested that the role of MHC-dependent adaptive immunity in shaping the gut microbiota is somewhat limited and is likely reserved for specific colonizers, such as pathogens, or intrusive commensals, such as SFB (Ladinsky et al., 2019).
Adaptive immune receptors require RAG recombinases for their rearrangements, and thus, RAG-deficient mice are free of adaptive immunity. RAG-deficient mice lack alpha-beta T cells, gamma-delta T cells, and NKT cells, as their invariable T cell receptor α (TCR-α) chains require RAG-dependent somatic gene rearrangement. Human gamma-delta T cells were shown to recognize alkylamines from Proteus species (Bukowski et al., 1999). Coincidentally, Proteus was enhanced in RAG-deficient mice compared to RAG-sufficient mice (Figure 3H). NKT cells were shown to regulate the production of anti-microbial peptides by Paneth cells (Farin et al., 2014). We found that Dehalobacterium was significantly enhanced in RAG-deficient mice compared to RAG-sufficient mice (Figure 3H). We have also analyzed the data from a previous study describing the microbiota of CD1d-deficient mice (lacking NKT cells) (Selvanantham et al., 2016) and found that Dehalobacterium was enhanced in these mice (p = 0.015). These data suggest that NKT cells could control Dehalobacterium by regulating the production of anti-microbial peptides.
Analysis of RAG-deficient mice has also led to some unexpected results. We found that BALB/c mice had significantly less SFB compared to mice from the B6 and BALB.B strains (Figure 3I). SFB was also found to be more abundant in B6 mice compared to BALB/c mice in a previously published dataset that we have analyzed (Fransen et al., 2015; Figure S4A). This result could be explained by an ability of the H-2d but not the H-2b allele to mount a strong anti-SFB response. However, the lack of SFB expansion in BALB/c RAG-deficient mice indicates that the specific immune response is likely promoting SFB survival. In agreement with that, we found that BALB.B (H-2b) mice mounted stronger IgA responses to SFB compared to BALB/c (H-2d) mice (Figure 3I). A beneficial role of IgAs for some microbes has been recently demonstrated (Donaldson et al., 2018), but the dependence of this response on the specific MHC haplotypes (and hence on adaptive immunity) has not been documented. It could also be argued that IgA suppresses SFB as it is enhanced in activation-induced cytidine deaminase-(AID) mice (which cannot class switch their Igs) compared to AID+ mice (Suzuki et al., 2004). However, AID-deficient mice demonstrate microbe-independent spontaneous inflammation in the gut (Hase et al., 2008), which could activate the ileal epithelium to produce factors promoting SFB expansion. At present, we have no direct evidence to determine whether IgA responses or anti-SFB T cell responses (Ivanov et al., 2009) promote SFB in B6 mice. However, the fact that SFB enables a specific type of endocytosis to produce vesicles loaded with a T cell-inducing antigen, and its importance for Th17 activation (Ladinsky et al., 2019), suggest that the activation of immune responses by SFB in general could be an adaptation evolved by this bacterium for its own benefit.
A number of other bacterial lineages were preferentially coated by IgA in BALB.B mice (Figure 3J), including Mucispirillum, which was previously demonstrated to induce a T cell-dependent IgA response (Bunker et al., 2015). Thus, it is possible that bacteria other than SFB could also enhance their replication in mice with specific MHC haplotypes by stimulating IgA responses against themselves.
In addition to adaptive immunity, multiple innate mechanisms may control the microbiota composition. These innate mechanisms may be immune or metabolic in nature, or they may control aspects of intestinal physiology such as motility and acidity. To identify innate polymorphic mechanisms operating in the gut, we profiled gene expression (using RNA-seq) in three intestinal compartments from B6 and BALB/c mice populated with the same input microbiota (Figure 4; Tables S2 and S3). Among the polymorphic innate factors, we found a family of antimicrobial peptides, defensins alpha (Defa), which differ in expression between mouse strains and between the regions of the gut (Volynets et al., 2016; Karlsson et al., 2008; Shanahan et al., 2011). Since RNA-seq reads are tested against a reference B6 genome, some genes that are either deleted or too different between B6 and BALB/c mice may not be properly identified. In fact, Defa sequence identity was lower than the sequence identity of the other genes among BALB/c and B6 genomes (Figure 4C) (Zerbino et al., 2018). Defa show some degree of anti-microbial specificity (Salzman et al., 2010). Thus, the highly variable array of defensins could be one of the genetically polymorphic forces shaping the commensal repertoire.
Overall, it can be concluded that genetic backgrounds shape input microbial repertoires in their own idiosyncratic fashion. However, we find it remarkable that the host-determined polymorphic influences on microbial composition are limited in scope and target only select microbial lineages (Figure S6). That implies that total control over the enormous body of microorganisms by the host immunity is unlikely (probably due to its extremely high cost) and that both non-polymorphic control mechanisms and other natural forces could be involved. Despite the significant evolutionary restriction of the variety of commensal bacterial phyla compared to free-living microbes (Dethlefsen et al., 2007), gut commensals must still follow the general rules of initial colonization and assembly found in other ecological systems (e.g., substrate attachment, establishment of the redox cascades, interdependence of the members), which may function in the mammalian host without its direct control.
We expect that further carefully arranged and controlled studies of genetically modified gnotobiotic animals using engineered communities of different complexities will elucidate the input of individual genetic mechanisms in host-commensal symbiosis.
STAR★METHODS
LEAD CONTACT AND MATERIALS AVAILABILITY
Further information and requests for resources and reagents should be directed to and will be fulfilled by the lead contact Alexander Chervonsky (ahervon@bsd.uchicago.edu). This study did not generate new unique reagents.
EXPERIMENTAL MODEL AND SUBJECT DETAILS
Mouse lines
Specific pathogen free (SPF) mice
C57BL6/J (B6), I/LnJ, BALB/cJ, C.B10-H2b/LilMcdJ (BALB/c mice with the H2b MHC locus derived from B6 mice, a.k.a BALB.B) and C.129S7(B6)-Rag1tm1Mom/J (BALB/c RAG1−/−) mice were purchased from The Jackson Laboratory (Bar Harbor, ME). B6NTac were purchased from Taconic Biosciences, Inc (Rensselaer, NY). C3H/HeN mice originally obtained from the National Cancer Institute Frederick Cancer Research Facility (Frederick, MD) were maintained in our mouse colony at The University of Chicago.
To generate the BALB/cJ-H-2J and I/LnJ-H-2K congenic lines, BALB/cJ or I/LnJ mice were crossed to I/LnJ and C3H/HeN mice, respectively. F1 mice were then backcrossed to parental BALB/cJ or I/LnJ mice and resulting N2 females were genotyped with the markers on Chromosome 17 at 33.9 and 34.3 Mb flanking the MHC locus (Figure S2). BALB/cJ mice inheriting the I/LnJ MHC locus and I/LnJ mice inheriting the C3H/HeN MHC locus were backcrossed to BALB/cJ mice and I/LnJ, respectively, to produced N3 mice. At each generation, only those offspring that had acquired I/LnJ (for BALB/cJ-H-2J line) or C3H/HeN (for I/LnJ-H-2K line) MHC locus were selected for the next round of backcrossing. Two 10th-generation BALB/cJ carriers of the I/LnJ and I/LnJ carriers of the C3H/ HeN MHC locus were intercrossed, and offspring homozygous for MHC locus were selected to continue the line through brothersister mating. All animals were housed at The University of Chicago SPF facility.
The studies described here have been reviewed and approved by the Animal Care and Use Committees at The University of Chicago accredited by the Association for Assessment and Accreditation of Laboratory Animal Care (AAALAC).
Germ free mice
Germ-free (GF) BALB/cJ, I/LnJ, C3H/HeN, BALB/cJ-H-2J, I/LnJ-H-2K were re-derived at Taconic Biosciences through an embryo transfer procedure. GF C57BL/6J (B6) mice were a gift from Dr. E. Chang (The University of Chicago).
Eight-week-old males and females were used at approximately 50:50 ratio in all experiments.
METHOD DETAILS
Monitoring sterility in gnotobiotic isolators
DNA was extracted from freshly frozen caecal contents or fecal pellets using a bead-beating/phenol-chloroform extraction protocol (Ley et al., 2005) and amplified with a set of primers that hybridize to all bacterial 16S rRNA gene sequences (Turner et al., 1999). Tests were conducted weekly using fecal samples from individual cages. Additionally, microbiological cultures were set up with GF fecal pellets, positive (SPF mouse fecal pellets), sham (sterile saline), and negative (sterile culture medium) controls for each sample batch. Samples were inoculated into BHI, Nutrient, and Sabaroud Broth tubes. Every sample in each of the respective culture media was incubated at 37°C and 42°C in both aerobic and anaerobic environments. Cultures were monitored daily for evidence of growth and were followed for 5 days until cultures were declared negative.
Transfer of gastrointestinal microbiota
SPF B6NTac donors of the commensal microbiota were housed in gnotobiotic isolators for a week upon arrival to recover from transportation-induced stress. SPF C57BL6/J mice were used straight from the shelf in our animal room. Donors were euthanized and their cecal contents were immediately homogenized in sterile PBS and gavaged (0.4 mL/mouse) into recipient germ free mice of both genders (generation 0, G0), which were then bred. Cecal microbiota of their progeny [generation 1 (G1)] was analyzed at 8 weeks of age.
DNA extraction, 16S rRNA amplicon sequencing and analysis
Cecal contents and IgA-coated and non-coated bacterial fractions were collected and snap frozen at −80°C. DNA was extracted from the samples using the DNeasy PowerSoil HTP 96 Kit (QIAGEN, Germantown, MD) according to the manufacturer’s instructions. The V4 region of the 16S rRNA-encoding gene (515F−806R) was PCR amplified to survey the total bacterial community in the extracted samples using the Illumina MiSeq platform as described (Walters et al., 2015; Caporaso et al., 2012). PCR reactions were carried out in triplicate for each sample using sterile, DNase-free 96 well plates with appropriate (DNA template-free) negative controls using the 5 PRIME HotMasterMix kit (Quantabio, Beverly, MA). PCR reactions were conducted using an initial denaturation step of 95°C for 3 min, followed by 35 cycles at 95°C for 30 s, 55°C for 45 s, then 72°C for 1.5 min. A single extension step at 72°C for 10 min was used at the end. Triplicate PCR reactions were then pooled together, primer dimers were removed from the pooled products using the UltraClean 96 PCR Cleanup Kit (QIAGEN, Germantown, MD) and total DNA was quantified using the PicoGreen® dsDNA Assay (Invitrogen/Thermo Fisher Scientific, Carlsbad, CA) and resuspended at 2 ng/μl. Amplicons were sequenced on an Illumina MiSeq using 151 × 151 base pair paired-end sequencing at the Environmental Sample Preparation and Sequencing Facility at Argonne National Laboratory. Raw sequence data were processed using the QIIME 1.9 analysis pipeline (Caporaso et al., 2010b). Initially, paired-end reads were joined and then aligned to a database of reference sequences using PyNAST (Caporaso et al., 2010a). These were clustered into operational taxonomic units (OTUs) using UCLUST at 97% similarity (Edgar, 2010), and a consensus taxonomy from the Greengenes reference database (McDonald et al., 2012) was assigned to each sequence using the UCLUST taxonomy assigner. The accession number for 16S sequencing data reported in this paper is Github:https:/github.com/akds/microbiome-MHC.
RNA isolation, sequencing (RNASeq), and analysis
Duodenum, jejunum, ileum, and colonic sections were harvested and washed with two volumes of 10 mL each of PBS to clear luminal contents. Immediately following collection, samples were stored at −80°C. RNA from intestinal tissues was isolated using a PureLink RNA Mini Kit (Thermo Fisher Scientific). All samples were DNase treated during RNA purification.
RNASeq libraries were prepared using Illumina TotalRNA TruSEQ kits (RiboZero depletion) and sequenced using an Illumina HiSEQ4000 (single-end 50bp).
Sequence identity of genes expressed differentially between BALB/cJ and C57BL/6J mice was determined using a BLASTN alignment of the reference C57BL/6J transcript to the BALB/cJ genome (http://useast.ensembl.org/Mus_musculus_BALB_cJ/Info/Index; default settings). Multiple putative alignments were distinguished based on the longest full-length alignment of the reference transcript to the BALB/cJ genome. The percentage of the aligned transcript sequence that is identical to the BALB/cJ genome sequence was calculated. The median sequence BLAST identity from one or more exons of the transcript was reported. The accession number for RNA-seq data reported in this paper is GEO:GSE136572.
Purification of IgA-coated and uncoated bacteria from colons
Colonic contents stored at −80°C were resuspended in sterile PBS and protease inhibitor (Roche) at 10mg of cecal contents per 100 uL of PBS. Mixtures were vortexed and centrifuged at 400 g to pellet debris. The supernatant was filtered through 70 μM nylon mesh and centrifuged at 8000 g for 5 min. The bacterial pellet was resuspended in sterile PBS/0.25% BSA/10% normal goat serum (Jackson ImmunoResearch) and stained with goat anti-mouse IgA antibodies (Southern Biotech). IgA-positive and IgA-negative fractions were isolated by autoMACS (Miltenyi). The bacterial pellet was resuspended in 5uM SYTO-13 (Life Technologies), and then stained with anti-mouse IgA-biotin (Southern Biotech), followed by streptavidin-APC (BioLegend). SYTO-13-positive, APC-negative or positive populations were sorted using a BD FACS Aria III.
Real-time quantitative PCR
An Applied Biosystems StepOnePlus Real-Time PCR system and SYBR Green master mix (Thermo Fisher Scientific) were used to perform real-time PCR on cecal DNA isolated from recipient gnotobiotic BALB/cJ, BALB/cJ RAG1−/−, BALB.B, C57BL/6J mice and donor B6NTac mice. Each reaction was performed in technical triplicates. Primers specific to mouse SFB (SFB736F- GACGCT GAGGCATGAGAGCAT, SFB844R- GACGGCACGGATTGTTATTCA (Barman et al., 2008) and broad-range 16S rRNA primers (Uni 926F- AAACTCAAAKGAATTGACGG, Uni 1062R- CTCACRRCACGAGCTGAC) (Bacchetti De Gregoris et al., 2011) were used. The 2−ΔΔCT log2 (fold change) was calculated as follows: ΔCT = CT for an individual DNA sample amplified with SFB specific primers minus CT for the same sample amplified with broad range 16S rRNA primers; ΔDCT = ΔCT minus average CT for all B6 DNA samples amplified with 16S ribosomal RNA specific primers. Graphs and statistics were generated using Prism 8 (GraphPad).
QUANTIFICATION AND STATISTICAL ANALYSIS
Statistical analysis of the 16S dataset was carried out with the MATLAB (MathWorks, Natick, MA, USA) software package. Principal component analysis (PCA) of the microbiomes was performed using the relative abundance of genera from each sample. The percent variance explained by each principal component was calculated and reported in corresponding figures. Principal coordinate analysis (PCoA) visualization was also generated using multidimensional scaling with Bray–Curtis metric and Weighted UniFrac as distance measures. To establish if there was a significant difference between two conditions, the β diversity of samples in a specific comparison was estimated using the Bray-Curtis distance. A one-sided non-parametric Wilcoxon rank sum test was then used to determine if the microbial differences between strains (or distances of all pairs of mice between two conditions) was greater than differences within a strain.
Differentially abundant OTUs between conditions were identified using an unpaired two-sample t test. We controlled for multiple-hypothesis testing with the q value method by adjusting the p value to reflect the false discovery rate using the procedure described by Storey (2002). Significantly different OTUs classified at the genus level (adjusted p < 0.05) were depicted using a red-blue heatmap where OTU abundance was transformed with zero mean and unit variance across all mice. Nonspecific OTUs not classified at the genus level were marked with asterisks (*) and reported using the most specific higher taxonomic classification level (family, order or class) associated with the OTU. Family level OTUs were used for PCA visualization and the percent variance explained by each axis was reported.
RNA-seq reads were aligned to the Mus musculus reference C57BL/6J transcriptome with Ensembl gene annotation (GRCm38) by Kallisto (v0.44.0; default settings) (Bray et al., 2016) in order to generate mRNA expression quantifications. The k mer-based pseudoalignment algorithm performed by Kallisto is robust to minor differences between reads and the reference transcriptome and, thus, is reasoned to be well suited for instances of modest genetic differences between strains. mRNA expression was quantified at transcript level (transcript per million; TPM) and then summarized into gene level (TPMs summed over all gene transcripts) measurements. Gene level TPMs were log2(n+1)-transformed for further analysis. Differentially expressed genes between BALB/cJ and C57BL/6J were identified using two criteria: (1) an unpaired two-sample t test and (2) log2 expression difference greater > 1. We controlled for multiple-hypothesis testing with the q value method by adjusting the p value to reflect the false discovery rate using the procedure described by Storey (2002).
All qPCR assays were done in triplicate (n = 3). Error bars represent standard deviation (SD). Significance for real-time PCR was calculated by ordinary one-way ANOVA.
The statistical details of experiments can be found in the figure legends, figures, and experimental procedures including the statistical tests used; exact value of n, where n represents the number of animals used in experiments, is either indicated or is obvious from the number of symbols representing individual animals; and precision measures (mean value and SD). No randomization or blinding was used.
DATA AND CODE AVAILABILITY
The datasets generated during this study are available at GEO: GSE136572 and https://github.com/akds/microbiome-MHC
Supplementary Material
KEY RESOURCES TABLE.
| REAGENT or RESOURCE | SOURCE | IDENTIFIER |
|---|---|---|
| Antibodies | ||
| Normal goat serum | Jackson ImmunoResearch | Cat#005–000–121; RRID:AB_2336990 |
| Goat anti-mouse IgA | SouthernBiotech | Cat#1040–01; RRID:AB_2314669 |
| Goat anti-mouse IgA-biotin | SouthernBiotech | Cat#1040–08; RRID:AB_2794374 |
| Chemicals, Peptides, and Recombinant Proteins | ||
| Protease inhibitor cocktail | Roche | Cat#11626400 |
| SYTO-13 | Life Technologies | Cat#S7575 |
| Critical Commercial Assays | ||
| DNeasy PowerSoil HTP 96 Kit | QIAGEN | Cat#12955–4 |
| 5 PRIME HotMaster Mix kit | Quantabio | Cat# 2200410 |
| UltraClean 96 PCR Cleanup Kit | QIAGEN | Cat#12596–4 |
| Quant-iT PicoGreen dsDNA Assay Kit | Invitrogen/Thermo Fisher Scientific | Cat# P11496 |
| PureLink RNA Mini Kit | Thermo Fisher Scientific | Cat#12183018A |
| TotalRNA TruSEQ kits RiboZero depletion | Illumina | Cat# 20020599 |
| SYBR Green master mix | Thermo Fisher Scientific | Cat#4364346 |
| Deposited Data | ||
| RNA-seq data | This paper | GEO: GSE136572 |
| 16S data | This paper | Github: https:/github.com/akds/microbiome-MHC |
| 16S dataset | Selvanantham et al., 2016 | OTU table from authors |
| 16S dataset | Fransen et al., 2015 | OTU table from authors |
| Experimental Models: Organisms/Strains | ||
| Mouse: I/LnJ | The Jackson Laboratory | JAX:000674 |
| Mouse: C57BL/6J (B6) | The Jackson Laboratory | JAX:000664 |
| Mouse: BALB/cJ | The Jackson Laboratory | JAX:000651 |
| Mouse: CB10-H2b/LilMcdJ | The Jackson Laboratory | JAX:001952 |
| Mouse: C.129S7(B6)-Rag1tm1Mom/J | The Jackson Laboratory | JAX: 003145 |
| Mouse: C57BL/6NTac | Taconic Biosciences | B6NTac |
| Mouse: C3H/HeN | Dr. T. Golovkina University of Chicago | N/A |
| Mouse: BALB/cJ-H-2J | Dr. T. Golovkina University of Chicago | N/A |
| Mouse: I/LnJ-H-2k | Dr. T. Golovkina University of Chicago | N/A |
| Mouse: Germ-free I/LnJ | Dr. T. Golovkina University of Chicago | N/A |
| Mouse: Germ-free BALB/cJ | Dr. T. Golovkina University of Chicago | N/A |
| Mouse: Germ-free C3H/HeN | Dr. T. Golovkina University of Chicago | N/A |
| Mouse: Germ-free BALB/cJ-H-2J | Dr. T. Golovkina University of Chicago | N/A |
| Mouse: Germ-free I/LnJ-H-2k | Dr. T. Golovkina University of Chicago | N/A |
| Mouse: Germ-free C57BL/6J (B6) | Dr. E. Chang, University of Chicago | N/A |
| Oligonucleotides | ||
| Real-time forward PCR primer for SFB, SFB736F GACGCTGAGGCATGAGAGCAT | Barman et al., 2008 | N/A |
| Real-time reverse PCR primer for SFB, SFB844R GACGGCACGGATTGTTATTCA | Barman et al., 2008 | N/A |
| Real-time forward PCR primer for 16S rRNA genes, Uni 926F AAACTCAAAKGAATTGACGG | Bacchetti De Gregoris et al., 2011 | N/A |
| Real-time reverse PCR primer for 16S rRNA genes, Uni 1062R CTCACRRCACGAGCTGAC | Bacchetti De Gregoris et al., 2011 | N/A |
| Forward PCR primer to monitor sterility in GF isolators, 8F AGAGTTTGATCCTGGCTCAG | Turner et al., 1999 | N/A |
| Reverse PCR primer to monitor sterility in GF isolators, 1391R GACGGGCGGTGWGTRCA | Turner et al., 1999 | N/A |
| Software and Algorithms | ||
| QIIME 1.9 analysis pipeline | Caporaso et al., 2010b | http://qiime.org/ |
| PyNAST | Caporaso et al., 2010a | https://biocore.github.io/pynast/ |
| UCLUST | Edgar, 2010 | http://www.drive5.com/usearch/ |
| MATLAB software package 9.3 (R2017b) | MathWorks | https://www.mathworks.com/products/matlab.html |
| Kallisto | Bray et al., 2016 | https://pachterlab.github.io/kallisto/ |
| Prism 8 | GraphPad | https://www.graphpad.com/scientific-software/prism/ |
| Other | ||
| Streptavidin-APC | Biolegend | Cat#405207 |
Highlights.
Input microbiota defines output microbiomes upon transfer in syngeneic GF mice
Genetic backgrounds define outputs after transfer with identical input microbiota
Polymorphisms in innate and adaptive immunity genes affect commensal composition
Some microbes may use immune mechanisms for their own advantage
ACKNOWLEDGMENTS
We thank Dr. Andre Ouellette (University of Southern California, Los Angeles, CA) for helpful discussion and Drs. Maria Rescigno, Bruno Fosso (Universita’ di Milano, Milan, Italy), and Thierry Mallevaey (University of Toronto, Toronto, ON, Canada) for sharing their primary sequencing data. A.C. is supported by NIH grants R01AI082418 and R01AI127411. A.C. and R.d.P. are supported by Department of Defense (DOD) grant W911NF-17-1-0402. A.C. is supported by NIH R01AI082418. T.G. was supported by NIH grant R01AI090084. L.Y. and J.M.P. were supported by NIH T32 GM007183 and T32 AI065382, respectively. This work was also supported by NIH/ NIDDK Digestive Disease Research Core Center grant DK42086 and by NIH grant P30 CA014599.
Footnotes
DECLARATION OF INTERESTS
The authors declare no competing interests.
SUPPLEMENTAL INFORMATION
Supplemental Information can be found online at https://doi.org/10.1016/j.celrep.2019.09.010.
SUPPORTING CITATIONS
Brodziak et al., 2013; Chen et al., 2014; Costa et al., 2018; Grasberger et al., 2013; Haber et al., 2017; Han et al., 2013; Hosokawa, 2008; Huang et al., 2015; MacMicking, 2004; Mihara et al., 2016; Ozato et al., 2008; Toyonaga et al., 2015; van der Meer-van Kraaij et al., 2007; Wang et al., 2011; Williams et al., 2015; Yuan et al., 2018.
REFERENCES
- Ashburner M, Ball CA, Blake JA, Botstein D, Butler H, Cherry JM, Davis AP, Dolinski K, Dwight SS, Eppig JT, et al. ; The Gene Ontology Consortium (2000). Gene ontology: tool for the unification of biology. Nat. Genet 25, 25–29. [DOI] [PMC free article] [PubMed] [Google Scholar]
- Bacchetti De Gregoris T, Aldred N, Clare AS, and Burgess JG (2011). Improvement of phylum- and class-specific primers for real-time PCR quantification of bacterial taxa. J. Microbiol. Methods 86, 351–356. [DOI] [PubMed] [Google Scholar]
- Barman M, Unold D, Shifley K, Amir E, Hung K, Bos N, and Salzman N (2008). Enteric salmonellosis disrupts the microbial ecology of the murine gastrointestinal tract. Infect. Immun 76, 907–915. [DOI] [PMC free article] [PubMed] [Google Scholar]
- Belkaid Y, and Hand TW (2014). Role of the microbiota in immunity and inflammation. Cell 157, 121–141. [DOI] [PMC free article] [PubMed] [Google Scholar]
- Bray NL, Pimentel H, Melsted P, and Pachter L (2016). Near-optimal probabilistic RNA-seq quantification. Nat. Biotechnol 34, 525–527. [DOI] [PubMed] [Google Scholar]
- Brodziak F, Meharg C, Blaut M, and Loh G (2013). Differences in mucosal gene expression in the colon of two inbred mouse strains after colonization with commensal gut bacteria. PLoS One 8, e72317. [DOI] [PMC free article] [PubMed] [Google Scholar]
- Bukowski JF, Morita CT, and Brenner MB (1999). Human gamma delta T cells recognize alkylamines derived from microbes, edible plants, and tea: implications for innate immunity. Immunity 11, 57–65. [DOI] [PubMed] [Google Scholar]
- Bunker JJ, Flynn TM, Koval JC, Shaw DG, Meisel M, McDonald BD, Ishizuka IE, Dent AL, Wilson PC, Jabri B, et al. (2015). Innate and Adaptive Humoral Responses Coat Distinct Commensal Bacteria with Immunoglobulin A. Immunity 43, 541–553. [DOI] [PMC free article] [PubMed] [Google Scholar]
- Bunker JJ, Erickson SA, Flynn TM, Henry C, Koval JC, Meisel M, Jabri B, Antonopoulos DA, Wilson PC, and Bendelac A (2017). Natural polyreactive IgA antibodies coat the intestinal microbiota. Science 358, eaan6619. [DOI] [PMC free article] [PubMed] [Google Scholar]
- Caporaso JG, Bittinger K, Bushman FD, DeSantis TZ, Andersen GL, and Knight R (2010a). PyNAST: a flexible tool for aligning sequences to a template alignment. Bioinformatics 26, 266–267. [DOI] [PMC free article] [PubMed] [Google Scholar]
- Caporaso JG, Kuczynski J, Stombaugh J, Bittinger K, Bushman FD, Costello EK, Fierer N, Peñ a AG, Goodrich JK, Gordon JI, et al. (2010b). QIIME allows analysis of high-throughput community sequencing data. Nat. Methods 7, 335–336. [DOI] [PMC free article] [PubMed] [Google Scholar]
- Caporaso JG, Lauber CL, Walters WA, Berg-Lyons D, Huntley J, Fierer N, Owens SM, Betley J, Fraser L, Bauer M, et al. (2012). Ultrahigh-throughput microbial community analysis on the Illumina HiSeq and MiSeq platforms. ISME J. 6, 1621–1624. [DOI] [PMC free article] [PubMed] [Google Scholar]
- Carmody RN, Gerber GK, Luevano JM Jr., Gatti DM, Somes L, Svenson KL, and Turnbaugh PJ (2015). Diet dominates host genotype in shaping the murine gut microbiota. Cell Host Microbe 17, 72–84. [DOI] [PMC free article] [PubMed] [Google Scholar]
- Chen S, Duan G, Zhang R, and Fan Q (2014). Helicobacter pylori cytotoxin-associated gene A protein upregulates a-enolase expression via Src/MEK/ERK pathway: implication for progression of gastric cancer. Int. J. Oncol 45, 764–770. [DOI] [PubMed] [Google Scholar]
- Collins AM, Wang Y, Roskin KM, Marquis CP, and Jackson KJ (2015). The mouse antibody heavy chain repertoire is germline-focused and highly variable between inbred strains. Philos. Trans. R. Soc. Lond. B Biol. Sci 370, 20140236. [DOI] [PMC free article] [PubMed] [Google Scholar]
- Costa NA, Gut AL, Azevedo PS, Polegato BF, Magalha~es ES, Ishikawa LLW, Bruder RCS, Silva EAD, Gonc¸ alves RB, Tanni SE, et al. (2018). Peptidylarginine deiminase 4 concentration, but not PADI4 polymorphisms, is associated with ICU mortality in septic shock patients. J. Cell. Mol. Med 22, 4732–4737. [DOI] [PMC free article] [PubMed] [Google Scholar]
- David LA, Materna AC, Friedman J, Campos-Baptista MI, Blackburn MC, Perrotta A, Erdman SE, and Alm EJ (2014). Host lifestyle affects human microbiota on daily timescales. Genome Biol. 15, R89. [DOI] [PMC free article] [PubMed] [Google Scholar]
- Dethlefsen L, McFall-Ngai M, and Relman DA (2007). An ecological and evolutionary perspective on human-microbe mutualism and disease. Nature 449, 811–818. [DOI] [PMC free article] [PubMed] [Google Scholar]
- Donaldson GP, Ladinsky MS, Yu KB, Sanders JG, Yoo BB, Chou WC, Conner ME, Earl AM, Knight R, Bjorkman PJ, and Mazmanian SK (2018). Gut microbiota utilize immunoglobulin A for mucosal colonization. Science 360, 795–800. [DOI] [PMC free article] [PubMed] [Google Scholar]
- Edgar RC (2010). Search and clustering orders of magnitude faster than BLAST. Bioinformatics 26, 2460–2461. [DOI] [PubMed] [Google Scholar]
- Elinav E, Henao-Mejia J, Strowig T, and Flavell R (2018). NLRP6 and Dysbiosis: Avoiding the Luring Attraction of Over-Simplification. Immunity 48, 603–604. [DOI] [PubMed] [Google Scholar]
- Farin HF, Karthaus WR, Kujala P, Rakhshandehroo M, Schwank G, Vries RG, Kalkhoven E, Nieuwenhuis EE, and Clevers H (2014). Paneth cell extrusion and release of antimicrobial products is directly controlled by immune cell-derived IFN-g. J. Exp. Med 211, 1393–1405. [DOI] [PMC free article] [PubMed] [Google Scholar]
- Fransen F, Zagato E, Mazzini E, Fosso B, Manzari C, El Aidy S, Chiavelli A, D’Erchia AM, Sethi MK, Pabst O, et al. (2015). BALB/c and C57BL/6 Mice Differ in Polyreactive IgA Abundance, which Impacts the Generation of Antigen-Specific IgA and Microbiota Diversity. Immunity 43, 527–540. [DOI] [PubMed] [Google Scholar]
- Fulde M, Sommer F, Chassaing B, van Vorst K, Dupont A, Hensel M, Basic M, Klopfleisch R, Rosenstiel P, Bleich A, et al. (2018). Neonatal selection by Toll-like receptor 5 influences long-term gut microbiota composition. Nature 560, 489–493. [DOI] [PubMed] [Google Scholar]
- Goodrich JK, Waters JL, Poole AC, Sutter JL, Koren O, Blekhman R, Beaumont M, Van Treuren W, Knight R, Bell JT, et al. (2014). Human genetics shape the gut microbiome. Cell 159, 789–799. [DOI] [PMC free article] [PubMed] [Google Scholar]
- Goodrich JK, Davenport ER, Beaumont M, Jackson MA, Knight R, Ober C, Spector TD, Bell JT, Clark AG, and Ley RE (2016). Genetic Determinants of the Gut Microbiome in UK Twins. Cell Host Microbe 19, 731–743. [DOI] [PMC free article] [PubMed] [Google Scholar]
- Grasberger H, El-Zaatari M, Dang DT, and Merchant JL (2013). Dual oxidases control release of hydrogen peroxide by the gastric epithelium to prevent Helicobacter felis infection and inflammation in mice. Gastroenterology 145, 1045–1054. [DOI] [PMC free article] [PubMed] [Google Scholar]
- Haber AL, Biton M, Rogel N, Herbst RH, Shekhar K, Smillie C, Burgin G, Delorey TM, Howitt MR, Katz Y, et al. (2017). A single-cell survey of the small intestinal epithelium. Nature 551, 333–339. [DOI] [PMC free article] [PubMed] [Google Scholar]
- Han NY, Choi W, Park JM, Kim EH, Lee H, and Hahm KB (2013). Label-free quantification for discovering novel biomarkers in the diagnosis and assessment of disease activity in inflammatory bowel disease. J. Dig. Dis 14, 166–174. [DOI] [PubMed] [Google Scholar]
- Hase K, Takahashi D, Ebisawa M, Kawano S, Itoh K, and Ohno H (2008). Activation-induced cytidine deaminase deficiency causes organ-specific autoimmune disease. PLoS One 3, e3033. [DOI] [PMC free article] [PubMed] [Google Scholar]
- Hosokawa M (2008). Structure and catalytic properties of carboxylesterase isozymes involved in metabolic activation of prodrugs. Molecules 13, 412–431. [DOI] [PMC free article] [PubMed] [Google Scholar]
- Huang YL, Chassard C, Hausmann M, von Itzstein M, and Hennet T (2015). Sialic acid catabolism drives intestinal inflammation and microbial dysbiosis in mice. Nat. Commun 6, 8141. [DOI] [PMC free article] [PubMed] [Google Scholar]
- Ivanov II, Atarashi K, Manel N, Brodie EL, Shima T, Karaoz U, Wei D, Goldfarb KC, Santee CA, Lynch SV, et al. (2009). Induction of intestinal Th17 cells by segmented filamentous bacteria. Cell 139, 485–498. [DOI] [PMC free article] [PubMed] [Google Scholar]
- Karlsson J, Pu€tsep K, Chu H, Kays RJ, Bevins CL, and Andersson M (2008). Regional variations in Paneth cell antimicrobial peptide expression along the mouse intestinal tract. BMC Immunol. 9, 37. [DOI] [PMC free article] [PubMed] [Google Scholar]
- Kubinak JL, Stephens WZ, Soto R, Petersen C, Chiaro T, Gogokhia L, Bell R, Ajami NJ, Petrosino JF, Morrison L, et al. (2015). MHC variation sculpts individualized microbial communities that control susceptibility to enteric infection. Nat. Commun 6, 8642. [DOI] [PMC free article] [PubMed] [Google Scholar]
- Ladinsky MS, Araujo LP, Zhang X, Veltri J, Galan-Diez M, Soualhi S, Lee C, Irie K, Pinker EY, Narushima S, et al. (2019). Endocytosis of commensal antigens by intestinal epithelial cells regulates mucosal T cell homeostasis. Science 363, eaat4042. [DOI] [PMC free article] [PubMed] [Google Scholar]
- Ley RE, Bä ckhed F, Turnbaugh P, Lozupone CA, Knight RD, and Gordon JI. (2005). Obesity alters gut microbial ecology. Proc. Natl. Acad. Sci. USA 102, 11070–11075. [DOI] [PMC free article] [PubMed] [Google Scholar]
- MacMicking JD (2004). IFN-inducible GTPases and immunity to intracellular pathogens. Trends Immunol. 25, 601–609. [DOI] [PubMed] [Google Scholar]
- McDonald D, Price MN, Goodrich J, Nawrocki EP, DeSantis TZ, Probst A, Andersen GL, Knight R, and Hugenholtz P (2012). An improved Greengenes taxonomy with explicit ranks for ecological and evolutionary analyses of bacteria and archaea. ISME J. 6, 610–618. [DOI] [PMC free article] [PubMed] [Google Scholar]
- Mihara E, Hirai H, Yamamoto H, Tamura-Kawakami K, Matano M, Kikuchi A, Sato T, and Takagi J (2016). Active and water-soluble form of lipidated Wnt protein is maintained by a serum glycoprotein afamin/a-albumin. eLife 5, e11621. [DOI] [PMC free article] [PubMed] [Google Scholar]
- Ozato K, Shin DM, Chang TH, and Morse HC 3rd. (2008). TRIM family proteins and their emerging roles in innate immunity. Nat. Rev. Immunol 8, 849–860. [DOI] [PMC free article] [PubMed] [Google Scholar]
- Palm NW, de Zoete MR, Cullen TW, Barry NA, Stefanowski J, Hao L, Degnan PH, Hu J, Peter I, Zhang W, et al. (2014). Immunoglobulin A coating identifies colitogenic bacteria in inflammatory bowel disease. Cell 158, 1000–1010. [DOI] [PMC free article] [PubMed] [Google Scholar]
- Rawls JF, Mahowald MA, Ley RE, and Gordon JI (2006). Reciprocal gut microbiota transplants from zebrafish and mice to germ-free recipients reveal host habitat selection. Cell 127, 423–433. [DOI] [PMC free article] [PubMed] [Google Scholar]
- Rothschild D, Weissbrod O, Barkan E, Kurilshikov A, Korem T, Zeevi D, Costea PI, Godneva A, Kalka IN, Bar N, et al. (2018). Environment dominates over host genetics in shaping human gut microbiota. Nature 555, 210–215. [DOI] [PubMed] [Google Scholar]
- Salzman NH, Hung K, Haribhai D, Chu H, Karlsson-Sjö berg J, Amir E, Teggatz P, Barman M, Hayward M, Eastwood D, et al. (2010). Enteric defensins are essential regulators of intestinal microbial ecology. Nat. Immunol 11, 76–83. [DOI] [PMC free article] [PubMed] [Google Scholar]
- Selvanantham T, Lin Q, Guo CX, Surendra A, Fieve S, Escalante NK, Guttman DS, Streutker CJ, Robertson SJ, Philpott DJ, and Mallevaey T (2016). NKT Cell-Deficient Mice Harbor an Altered Microbiota That Fuels Intestinal Inflammation during Chemically Induced Colitis. J. Immunol 197, 4464–4472. [DOI] [PubMed] [Google Scholar]
- Shanahan MT, Tanabe H, and Ouellette AJ (2011). Strain-specific polymorphisms in Paneth cell a-defensins of C57BL/6 mice and evidence of vestigial myeloid a-defensin pseudogenes. Infect. Immun 79, 459–473. [DOI] [PMC free article] [PubMed] [Google Scholar]
- Sonnenburg ED, Smits SA, Tikhonov M, Higginbottom SK, Wingreen NS, and Sonnenburg JL (2016). Diet-induced extinctions in the gut microbiota compound over generations. Nature 529, 212–215. [DOI] [PMC free article] [PubMed] [Google Scholar]
- Storey JD (2002). A direct approach to false discovery rates. J. R. Stat. Soc. B 64, 479–498. [Google Scholar]
- Suzuki K, Meek B, Doi Y, Muramatsu M, Chiba T, Honjo T, and Fagarasan S (2004). Aberrant expansion of segmented filamentous bacteria in IgAdeficient gut. Proc. Natl. Acad. Sci. USA 101, 1981–1986. [DOI] [PMC free article] [PubMed] [Google Scholar]
- Toyonaga T, Nakase H, Ueno S, Matsuura M, Yoshino T, Honzawa Y, Itou A, Namba K, Minami N, Yamada S, et al. (2015). Osteopontin Deficiency Accelerates Spontaneous Colitis in Mice with Disrupted Gut Microbiota and Macrophage Phagocytic Activity. PLoS One 10, e0135552. [DOI] [PMC free article] [PubMed] [Google Scholar]
- Turner S, Pryer KM, Miao VP, and Palmer JD (1999). Investigating deep phylogenetic relationships among cyanobacteria and plastids by small subunit rRNA sequence analysis. J. Eukaryot. Microbiol. 46, 327–338. [DOI] [PubMed] [Google Scholar]
- van der Meer-van Kraaij C, Siezen R, Kramer E, Reinders M, Blokzijl H, van der Meer R, and Keijer J (2007). Dietary modulation and structure prediction of rat mucosal pentraxin (Mptx) protein and loss of function in humans. Genes Nutr. 2, 275–285. [DOI] [PMC free article] [PubMed] [Google Scholar]
- Volynets V, Rings A, Bá rdos G, Ostaff MJ, Wehkamp J, and Bischoff SC (2016). Intestinal barrier analysis by assessment of mucins, tight junctions, and a-defensins in healthy C57BL/6J and BALB/cJ mice. Tissue Barriers 4, e1208468. [DOI] [PMC free article] [PubMed] [Google Scholar]
- Walters W, Hyde ER, Berg-Lyons D, Ackermann G, Humphrey G, Parada A, Gilbert JA, Jansson JK, Caporaso JG, Fuhrman JA, et al. (2015). Improved Bacterial 16S rRNA Gene (V4 and V4–5) and Fungal Internal Transcribed Spacer Marker Gene Primers for Microbial Community Surveys. mSystems, Published online December 22, 2015. 10.1128/mSystems.00009-15. [DOI] [PMC free article] [PubMed] [Google Scholar]
- Wang Z, Klipfell E, Bennett BJ, Koeth R, Levison BS, Dugar B, Feldstein AE, Britt EB, Fu X, Chung YM, et al. (2011). Gut flora metabolism of phosphatidylcholine promotes cardiovascular disease. Nature 472, 57–63. [DOI] [PMC free article] [PubMed] [Google Scholar]
- Williams TM, Leeth RA, Rothschild DE, Coutermarsh-Ott SL, McDaniel DK, Simmons AE, Heid B, Cecere TE, and Allen IC (2015). The NLRP1 inflammasome attenuates colitis and colitis-associated tumorigenesis. J. Immunol 194, 3369–3380. [DOI] [PMC free article] [PubMed] [Google Scholar]
- Wullaert A, Lamkanfi M, and McCoy KD (2018). Defining the Impact of Host Genotypes on Microbiota Composition Requires Meticulous Control of Experimental Variables. Immunity 48, 605–607. [DOI] [PubMed] [Google Scholar]
- Yuan YY, Xie KX, Wang SL, and Yuan LW (2018). Inflammatory caspase-related pyroptosis: mechanism, regulation and therapeutic potential for inflammatory bowel disease. Gastroenterol. Rep. (Oxf.) 6, 167–176. [DOI] [PMC free article] [PubMed] [Google Scholar]
- Yurkovetskiy L, Burrows M, Khan AA, Graham L, Volchkov P, Becker L, Antonopoulos D, Umesaki Y, and Chervonsky AV (2013). Gender bias in autoimmunity is influenced by microbiota. Immunity 39, 400–412. [DOI] [PMC free article] [PubMed] [Google Scholar]
- Zerbino DR, Achuthan P, Akanni W, Amode MR, Barrell D, Bhai J, Billis K, Cummins C, Gall A, Giró n CG, et al. (2018). Ensembl 2018. Nucleic Acids Res. 46 (D1), D754–D761. [DOI] [PMC free article] [PubMed] [Google Scholar]
Associated Data
This section collects any data citations, data availability statements, or supplementary materials included in this article.
Supplementary Materials
Data Availability Statement
The datasets generated during this study are available at GEO: GSE136572 and https://github.com/akds/microbiome-MHC