Abstract
We describe the first fluorescence lifetime images of cells. To demonstrate this new capability we measured Intracellular Images of Ca2+ in COS cells based on the Ca2+-dependent fluorescence lifetime of Quin–2. Apparent fluorescence lifetimes were measured by the phase-modulation method using a gain-modulated image intensifier and a slow-scan CCD camera. We describe methods to correct the images for photobleaching during acquisition of the data, and to correct for the position-dependent response of the image intensifier. The phase angle Quin–2 images were found to yield lower than expected Ca2+ concentrations, which appears to be the result of the formation of fluorescent photoproducts by Quin–2. Fluorescence lifetime imaging (FLIM) does not require wavelength-ratiometric probes and appears to provide new opportunities for chemical imaging of cells.
Measurement and imaging of intracellular concentrations of Ca2+ are of considerable interest because of me central role of (Ca2+ in signal transduction and other cellular processes [1-6]. Consequently, many laboratories have proposed improved methods to image Ca2+ [7-9]. At present, most [Ca2+] images are obtained using the wavelength-ratiometric probes Fura–2 and Indo–1 [10-14]. Wavelength-ratiometric measurements are strongly favored in fluorescence microscopy because it is difficult to measure and make quantitative use of me intensity data [13-17]. The difficulty arises because the fluorescence intensity does not accurately report the [Ca2+]. The fluorescence intensity reflects many factors including [Ca2+], the local probe concentration, probe (binding to macromolecules [18,19], and photobleaching during the experiments, all of which tender the intensity images subject to error.
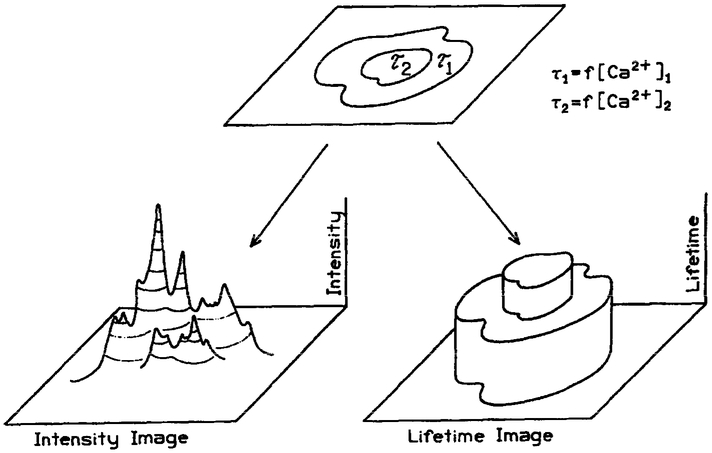
In the present report we describe a new imaging method which has the potential to circumvent many of the difficulties associated with quantitative fluorescence microscopy and imaging. Instead of creating an intensity-based image, we create images in which the contrast is based on the fluorescence lifetime in each region of the image. The concept of fluorescence lifetime imaging (FLIM) is illustrated in Scheme 1. Suppose a cell contains two regions in which the probe displays two decay times, τ2 > τ1. The intensity image (lower left will not reveal the distinct decay times, but rather displays structure which reflects the local probe concentration and/or quantum yield. In contrast, the lifetime image (lower right) will not sense the local intensity, but will instead reveal the two regions of interest. The advantage of FLIM is that the lifetime is typically independent of the local intensity and the extent of photobleaching, assuming the measurements are within the dynamic range of the apparatus and that any photoproducts do not contribute significantly to the signal. Hence, the lifetime or decay time can be an absolute self-calibrating measurement. If one knows the dependence of the lifetime on the analyte of interest, then the lifetime image can be mapped to a concentration image. We note that for probes such as Quin–2, where the Stokes’ shifts are large and the probes are highly charged, probe-probe interactions are not expected for any practical probe concentration, particularly those which may occur in the cells.
Scheme 1.
Comparison of intensity and lifetime imaging of cells.
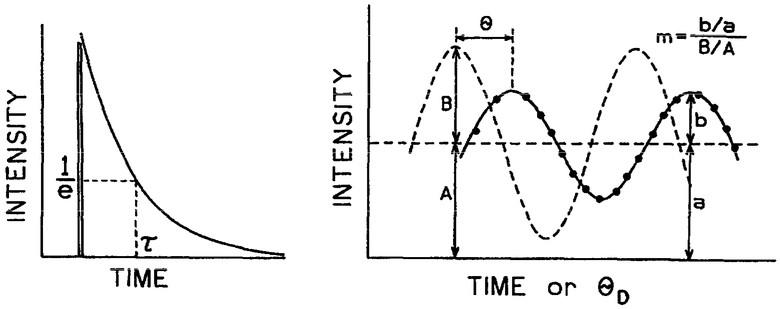
To illustrate the possibility and potential of FLIM, we describe imaging of the intracellular Ca2+ concentration of COS cells using the calcium indicator Quin–2. Quin–2 is less widely used than Fura–2 because wavelength-ratiometric measurements of Quinr–2 are not practical in cells [20,21], its intensity is about 30-fold lower than Fura–2, and it may photobleach more rapidly than Fura–2. Hence, our ability to obtain lifetime images using Quin–2 represents a worse-case situation. Superior results can be expected with more intense and/or photostable probes, or using visible wavelength Ca2+ probes, such as Calcium Green, which display changes in lifetime in the presence of Ca2+ [22]. Importantly for FLIM, the fluorescence decay time (lifetime) of Quin–2 increases 10-fold upon binding of Ca2+ [23,24], making it a valuable probe for fluorescence lifetime imaging. In FLIM, we measure the lifetime or decay time at each pixel in the microscopic image [24,25]. Our FLIM apparatus measures the mean lifetime by the phase-modulation method [26,27]. For a single exponential decay the lifetime is the time τ required for the intensity to decay to e−1 of the initial value following δ-function excitation (Scheme 2, left). The lifetime can also be measured from the phase (θ) and modulation (m) of the emission, relative to the intensity-modulated excitation [28]. The present measurements are distinct from the standard phase-modulation method [26,27] in that homodyne detection is used to measure the phase-sensitive intensities, as shown by the dots in Scheme 2, right. These phase-sensitive intensities are measured for a range of detector phase angles (θD, allowing determination of θ and m by subsequent least-squares analysis of the phase-sensitive intensities. This procedure is analogous to the use of phase-sensitive detection to suppress components in mixtures [29]. The use of phase-modulation methods is advantageous for imaging because it allows simultaneous data acquisition at all pixels [30], avoids the need for photon counting detection [31,32], and avoids the need for pixel by pixel scanning [33-38]. Resolution of any multi-exponential decays which may be present is not necessary. Calibration curves of phase or modulation versus Ca2+ concentration, at a single modulation frequency, allow calculation of the Ca2+ image from the phase and modulation images.
Scheme 2.
Pulse and phase-modulation lifetime measurements.
The FLIM method can be extended to imaging of oxygen, pH, glucose, and antigen-antibody binding based on the growing knowledge of the lifetimes of fluorescence sensors [22, 39-47]. An advantage of our method is the use of a slow-screen CCD detector, which has many desirable features for quantitative fluorescence microscopy [48-53]. Also our apparatus provides lifetime imaging on the nanosecond (ns) timescale, and is thus not limited to detection of delayed luminescence or phosphorescence [54,55]. We note that the detection of delayed luminescence is often an intensity measurement, and does not use the lifetime to generate contrast. Adaptation of our FLIM methodology to cellular imaging required the development of procedures to correct for photobleaching of the probe and for the position-dependent response of the image intensifier.
Materials and methods
Instrumentation
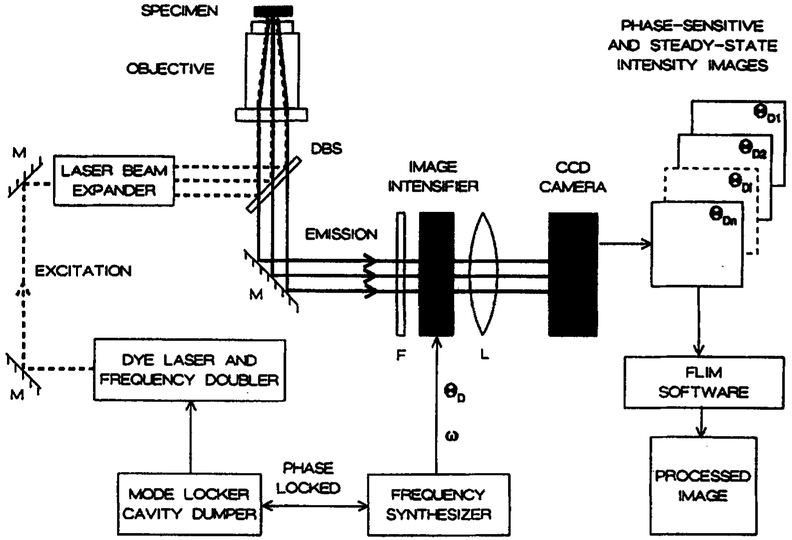
The electronic components and gain modulated image intensifier for FLIM was described previously [30]. This apparatus has now been installed on the side-port of a Nikon Diaphot-TMD inverted fluorescence microscope, and is illustrated schematically in Figure 1. Epi-illumination is accomplished using a Newport LC-075 (10x) laser beam expander and Nikon Fluor 40, 40-fold magnification, NA 1.3 (Ph4DL) objective. The emission is isolated using the side port with 2.5-fold magnification using a DM400 Nikon dichroic beam splitter. The incident and/or scattered light is further rejected using a Corning 3-75 filter.
Fig. 1.
Apparatus for cellular FLIM. M, Mirror, DBS, dichroic beam splitter; F, filter, L, lens; ω, modulation frequency; θD, phase angle of the frequency synthesizer output. See Materials and methods for additional details.
The microscopic sample is illuminated with an intensity-modulated light source, in this case the ps pulses from a cavity-dumped dye laser which are intrinsically modulated at integer multiples of the pulse rate [56]. The excitation is at 343 nm using the frequency-doubled output of a Pyridine–1 dye laser, which is synchronously pumped by a mode-locked Nd:YAG laser and cavity dumped at 3.81 MHz.
The emission image is quantified using an image intensifier (Varo 510-5772-310) and slow-scan CCD camera (CC200 from Photometries) with a PM 512, Prime Grade, CCD chip, with a Metachrome UV extended response. The camera head is cooled with a three-stage thermoelectric cooler LC200. The gain of the image intensifier is modulated at 49.53 MHz using the output of a PTS-300 frequency synthesizer. The output of the frequency synthesizer is phase-locked to the pulsed excitation by using the same 10 MHz master oscillator for the frequency synthesizer which drives the image intensifier and the Nd:YAG mode-locker (Fig. 1). The phase of the synthesizer output (θD) was varied using the digital phase shift option of the PTS 300 frequency synthesizer. This method is considerably more convenient and versatile than our earlier use of calibrated coaxial cables. Gain modulation of the image intensifier is at an exact integer multiple of the pulse repetition rate (i.e. homodyne detection), resulting in stationary phase-sensitive images on the phosphor of the intensifier.
Image acquisition
For these experiments we collected two sets of phase-sensitive images, the first for a spatially homogeneous standard (S) and the second for the labeled COS cells (obs). These phase-sensitive images are corrected by subtraction of the background (dark) image, corrected for a non-linear response in our CCD camera and for the time-dependent photobleaching, as described in the Results section, yielding:
| Eq. 1 |
| Eq. 2 |
In these expressions, k is a constant, Ci(r) are the concentration and/or intensity profiles of the sample and θD is the phase of the frequency synthesizer output. The apparent modulation at each point in the image (r) is given by:
| Eq. 3 |
| Eq. 4 |
and the apparent phase angle images are θs(r) and θobs(r). We note that these apparent phase and modulation images require correction for a variety of instrumental factors, as described in the Results section. The phase-sensitive images of the standard and cells are collected under identical experimental conditions, typically for 8–10 values of θD ranging over 360 degrees.
The time required for acquisition of a single phase-sensitive or steady-state image depends upon the excitation intensity, fluorescence properties of the probe, probe concentration, and the efficiency of the light collection optics. In the present initial studies of lifetime imaging of cells, most of these factors were not optimized. For instance, Quin–2 was excited at 343 nm, which was the practical lower wavelength limit of our dye laser and frequency doubler. The frequency-doubled UV output was about 1 mW, and this output was decreased 2-fold or more by the beam expander, and its poor transmittance below 400 nm. We estimate that the samples were illuminated with 0.5 mW or less of 343 nm light. Also, the microscope did not have quartz optics, and the collection efficiency of the fluorescence was poor. Because of all these factors, the acquisition time for a single image ranged from 1–4 min. Readout and storage time for a single image was about 20 s. The total data acquisition time for a lifetime image was thus about 30–55 min. We expect this time to be considerably shortened in the next generation FLIM instrument with improved optics, CCD and computer hardware.
In order to correct for photobleaching, we collect steady-state intensity images between every or every other phase-sensitive image. The RF output of the PTS-300 frequency synthesizer cannot be set to zero. To maintain phase coherence of the PTS-300 output it is necessary to keep all digits constant from 1 MHz to 1 Hz. Hence to collect the steady state images, we set the frequency to 10 MHz above or below the experimental frequency of 49.53 MHz. This results in a steady state image at the phosphor with a gain nearly equivalent to that of the phase-sensitive image.
Calculation of the apparent phase and modulation images
Calculation of the apparent (A) phase and modulation images for the standard sample and COS cells is performed in an identical manner, so only one case will be described (θA(r) and mA(r)). We obtain the apparent phase and modulation images by performing a linear least-squares fit for each of the 262 144 pixels in the images. These fits could be performed using Equation 1. However Equation 1 is a non-linear equation in the fitting parameters mA(r) and θA(r), which requires an iterative solution of a system of simultaneous equations [57]. These simultaneous equations must be reevaluated from the data images for each step of the iterative process, requiring a large amount of computer time and memory. Hence, we used an alternative form of Equation 1:
| Eq. 5 |
The advantage of Equation 5 is that it is a linear equation, and parameter estimation requires only a single iteration.
Once the values of a0(r), a1(r) and b1(r) are determined for a particular pixel, then the corresponding values of the phase (θA(r)) and modulation amplitude (mA(r)) can be determined using:
| Eq. 6 |
| Eq. 7 |
These apparent (A) phase angles and modulations are transformed to absolute values by use of the known phase and/or modulation of a standard image, as discussed in the Results section. The process of evaluating a0(r), a1(r) and b1(r) for each pixel involves the solution of a standard matrix equation Ax = B (Eqs 8-10) for x by Cramer’s rule.
| Eq. 8 |
| Eq. 9 |
| Eq. 10 |
The subscript i in Equations 8-10 refers to one of the N data images at a particular phase shift (θD,i).
The pixels of the data images are processed in parallel into the three elements of the B vector. These three images are then transformed into a0(r), a1(r), and b1(r) images by Cramer’s rule. These latter three images are then transformed into images of the fluorescence phase (Eq. 6) and modulation (Eq. 7).
Occasionally we found that there was flattening of the peaks and valleys of the cosine data used for the fits described in Equations 8-10 for individual pixels. When this occurred we removed those values from the fitting process. Typically these were values above 16 000 and below 400 CCD units. Phase angles and modulations were only calculated when the numbers of phase-sensitive intensities for that pixel was greater than 7 (N ≥ 7). We determined that this effect was the result of a non-linear response of our particular CCD camera head.
Cell cultures and labeling with Quin–2
We used COS cells to work out the technical requirements for FLIM imaging in a cellular system. COS cells are widely used in biology because they are an excellent host cell in which one can express cloned mammalian genes. These cells are an SV40-transformed cell line obtained from green monkey kidney epithelial cells. The COS cells were used in these experiments because the cells are relatively plain in terms of their biological architecture and are easy to grow. They have a low but measurable level of autofluorescence and a relatively low level of resting [Ca2+]i. These cells are available from the American Type Culture Collection (ATCC), Rockville, MD, USA (CRL 1650 and CRL 1651) and are being used in our laboratories routinely in unrelated experiments. The cells are relatively flat as they grow and adhere moderately well to the glass surface. The cells are grown in DMEM (Dulbecco’s Modified Eagle’s Medium) with 7% fetal calf serum at 35°C in 5% CO2 atmosphere.
The cells were grown in modified 50 mm culture dishes. The cells were plated onto 25 mm circular glass coverslips that had been fixed to the bottom of the dishes below a 15 mm circular cut-out. This permitted us to use a relatively high numerical aperture Nikon Fluor objective. The cells were loaded with Quin–2 by exposure to Quin–2/AM (25 μM) in DMEM/HEPES for 30–60 min at room temperature. A second incubation period at 30–60 min in Quin–2 free DMEM/HEPES was used to allow for further de-esterification of the ‘trapped’ Quin–2/AM. Following both incubation periods the cells were rinsed in a modified salt solution containing (in mM) 140 NaCl, 2.5 CaCl2, 10 glucose, 10 HEPES, pH = 7.2. This modified salt solution bathed the cells during all FLIM measurements which were conducted at room temperature.
For ratiometric measurements of the resting [Ca2+]i the COS cells were loaded with Indo–1 salt by electroporation. This was accomplished by placing rectangles of cell-coated coverslips in a 35 mm petri dish containing a solution of 135 mM KCl, 1 mM MgCl2, 10 mM HEPES, pH = 7.2, nominally calcium free and 1 mM Indo–1 salt (Molecular Probes). A brief (t1/2 = 1 ms) high voltage (about 500 V) pulse was applied across the coverslip with platinum wire electrodes placed 1 cm apart immersed in the solution [58]. Following the electroporation, the cells were then washed in a normal extracellular solution (see above) twice and placed in our standard superfusion bath on the stage of a Nikon Diaphot fluorescence microscope. Approximately 10% of the cells survived as judged by the retention of Indo–1, maintained normal cell morphology and continued healthy membrane potential. Indo–1, a dual emission ratiometric [Ca2+] indicator was excited at 350 nm. A xenon arc lamp (PTI, Princeton, NJ, USA) provided broad spectrum illumination that was filtered with a combination of dichroic mirrors and narrow band interference filters. The 350 nm light was focused onto a liquid guide [59,60]. The fluorescence signal from the imaged cell was measured at 400 nm and 500 nm. After background subtraction the fluorescence ratio of resting cells was 0.475 ± 0.017 (SEM, N = 10). Our calibration of the ratio [60] indicates that the resting calcium in these COS cells was 229 ±13 nM.
Results
Correction for non-linearity of the CCD camera
Slow-scan CCD cameras have been widely used in fluorescence microscopy. The CCD response is expected to be linear over a wide range of intensities, particularly when accumulating images at low-light levels. Most reports confirm the expected linearity of these detectors [48, 49, 61]. In our initial analysis of the FLIM images we noticed that the modulation images (discussed below) displayed structure which was correlated with the intensity images. This was surprising because we expected the FLIM images, whether observed by phase or modulation, to be independent of the fluorescence intensity. Further analysis and control experiments showed that this effect was the surprising result of a non-linear response of the CCD camera to an intensity and/or accumulated charge. Discussions with the manufacturer and their testing of the camera indicated that the response was indeed non-linear, particularly at low levels of accumulated charge. This effect is apparently due to aging-related problems with the output amplifiers and/or A/D convertor. According to the manufacturer, this problem is not uncommon. We therefore recommend to other researchers that they check the linearity of their CCD camera.
In our case, the non-linearity affected the modulation image in a manner that resulted in larger modulations at higher intensities. The phase images were not significantly sensitive to the non-linear CCD response. Due to changes in technology it was not practical to repair our CCD camera. Hence, all the steady-state and phase-sensitive images were corrected for this effect on a pixel-by-pixel-basis.
Correction for photobleaching
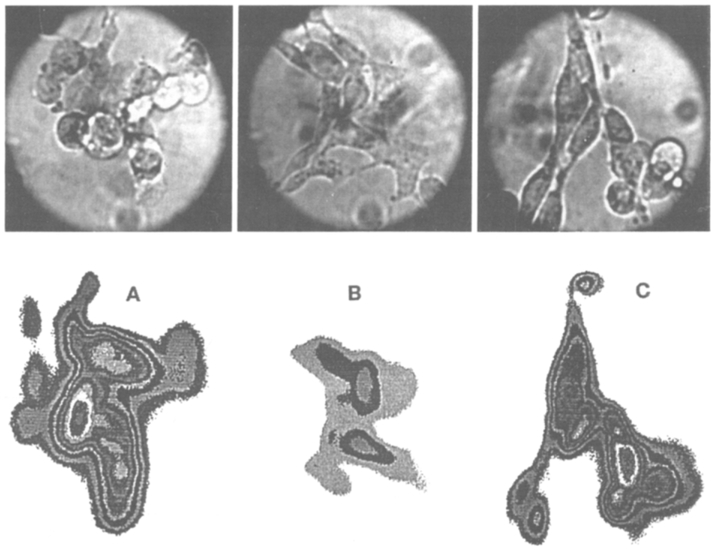
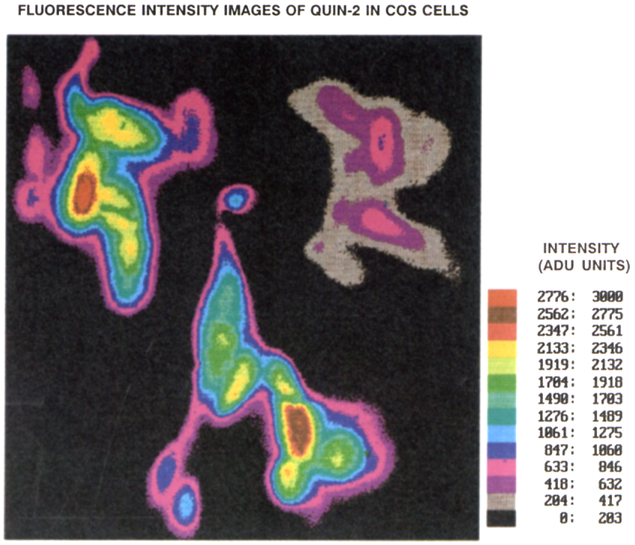
Fluorescence lifetime images were obtained for a number of COS cells or cell clusters. To illustrate these images we selected three cells, which are shown in Figure 2. The same cells in the same orientation are shown in the subsequent color images. The Quin–2 intensity images are shown in Figure 3. These three cells were from different COS cell preparations and were measured at different times. The images were combined onto a single image for concise presentation. Two of the cells (A and C) displayed moderately high intensities, whereas the fluorescence intensity of cell B was about 5-fold smaller, The fluorescence intensity images show wide variations in intensity (Fig. 3), as we have observed generally with the AM-loading method [Kirby M.S. and Lederer WJ., unpublished observations].
Fig. 2.
Light microscopy images of COS cells. The lower images indicate the area, shape, and orientation of the cells in the subsequent color images.
Fig. 3.
Quin–2 fluorescence intensity images of the three COS cells. According to the manufacturer’s specifications, a unit of intensity corresponds to approximately 18 photoelectrons.
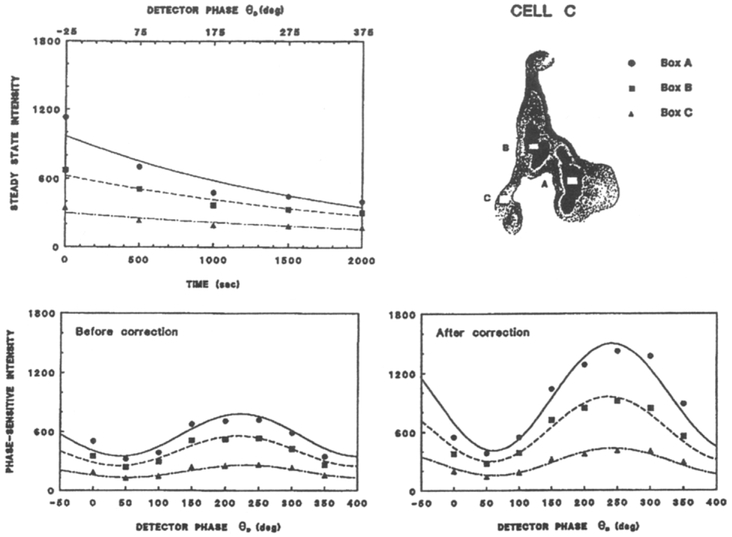
Acquisition of all the phase-sensitive and steady-state images is moderately time consuming, requiring 55 min of illumination for cells A and B, and 33 min of illumination for cell C. The shape of the cells remained unchanged during the data acquisition, as did the microscopic visual appearance, suggesting that the cells were not damaged by the illumination during data acquisition. The fluorescence intensity of Quin–2 decreased by 30–80% during the data acquisition. Such a decrease can alter the calculated phase and modulation images because the fitting procedure assumes the intensity variations between the images are due only to changes in θD. Hence, it is necessary to correct for the loss of intensity due to photobleaching. This correction is accomplished by collecting steady-state intensity images between the phase-sensitive images, as is illustrated for a selected region of cell C in Figure 4. The time axis represents the time for data acquisition, and assumes that the phase-sensitive images are collected sequentially with increasing value of θD. Depending on the rate of photobleaching, the steady-state intensity images were collected after each phase-sensitive images, or less frequently for slower photobleaching.
Fig. 4.
Correction of the phase-sensitive intensities at selected sites on COS cell C for the extent of photobleaching and/or illumination time.
Examination of the dependence of the steady-state images on the illumination time revealed a monotonic decrease in intensity in all regions of the cell (Fig. 4, top left). We assumed the intensity decrease was linear between each two phase-sensitive images. Hence, the phase-sensitive images, corrected for photobleaching, were obtained by:
| Eq. 11 |
where the prime indicates the uncorrected phase-sensitive image collected at time ti, F1(r) and F2(r) are the bracketing steady-state images collected at times t1 and t2, respectively, and F0(r) is the initial steady-state image collected at the beginning of the experiment The factor W is given by W = (t1 – ti)/(t2 – t1).
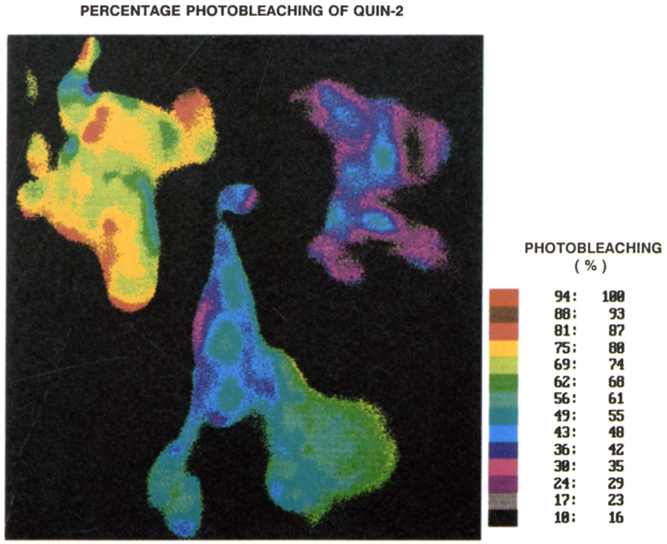
An example of this linear correction procedure is shown in Figure 4, for three different sites of cell C. The intensity at each site decreases in an approximately linear manner. The phase-sensitive intensities, before and after correction, are shown in the lower panels of Figure 4. It is essential that the photobleaching correction be performed on a pixel-by-pixel basis. This is illustrated in Figure 5, which shows the color-coded extent of decrease in fluorescence of all sites in the cells. These data indicate that photobleaching rates differ by about 25% from site-to-site in these cells. Position-dependent photobleaching has been observed previously by Benson et al. [61] for a number of fluorophores. In the present experiments, it appears that the photobleaching of Quin–2 is generally not correlated with the intensity. Prior to correcting for the non-linear CCD response, the extent of photobleaching appeared to be larger at regions of high intensity, an effect which we could not explain.
Fig. 5.
Decrease of the fluorescence intensity of Quin–2 due to photobleaching.
An important aspect of calculating the phase and modulation images is determination of the spatial range of the images. It makes no sense to compute and display the FLIM images in regions of low and/or insignificant intensity. We defined a spatial intensity mask to eliminate all regions of the image which are less than 10% of the maximum intensity from the FLIM calculations, one can easily conceive of more accurate and/or complex photobleaching corrections and masking procedures, but the methods described above are adequate for our purposes. We note that the future use of frame-shift CCDs may allow nearly simultaneous acquisition of the steady state and phase-sensitive images, and eliminate the need for extrapolating to times between successive phase-sensitive images.
Correction of position-dependent phase and modulation of the intensifier
In order to obtain correct phase and modulation images, it is necessary to correct for electronic shifts within the apparatus and for the non-ideal response of the image intensifier. To quantify these effects we used homogeneous solutions of fluorescence standards in PVA films. The phase, modulation and apparent lifetimes of the standards, measured with standard frequency-domain instrumentation [27,56] are given in Table 1. The intensity decays of DPO and DMSS in PVA are not pure single exponentials, resulting in minor differences between the apparent phase and modulation lifetimes. However, irrespective of this minor complexity, the standards display known phase and modulation values at 49.335 MHz, which can be used to obtain corrected phase and modulation images of the COS cells at 49.53 MHz. (This minor difference in frequency results from the use of two different mode-locked and cavity-dumped laser sources. For FLIM the pulse repetition rate was 3.81 MHz, and for the frequency-domain measurements the pulse repetition rate was 3.795 MHz.)
Table 1.
Lifetime standards for FLIM.
| Compound | Phase (deg)c | τp(ns) | Modulation (%)c | τm(ns) |
|---|---|---|---|---|
| DPOa | 18.9c | 1.10 | 0.93 | 1.27 |
| DMSSb | 20.0 | 1.17 | 0.90 | 1.56 |
DPO, 2,5-bis(4-diethylaminophenyl)-1,3,4-oxadiazole, in a poly-vinylalcohol film, used for cell B
DMSS, 4-diethylamino-ω-methylsulfonyl -trans-styrene [72] in s poly-vinylalcohol film, used for cells A and C
At 49.335 MHz. The pulse repetition rate was 3.795 MHz.
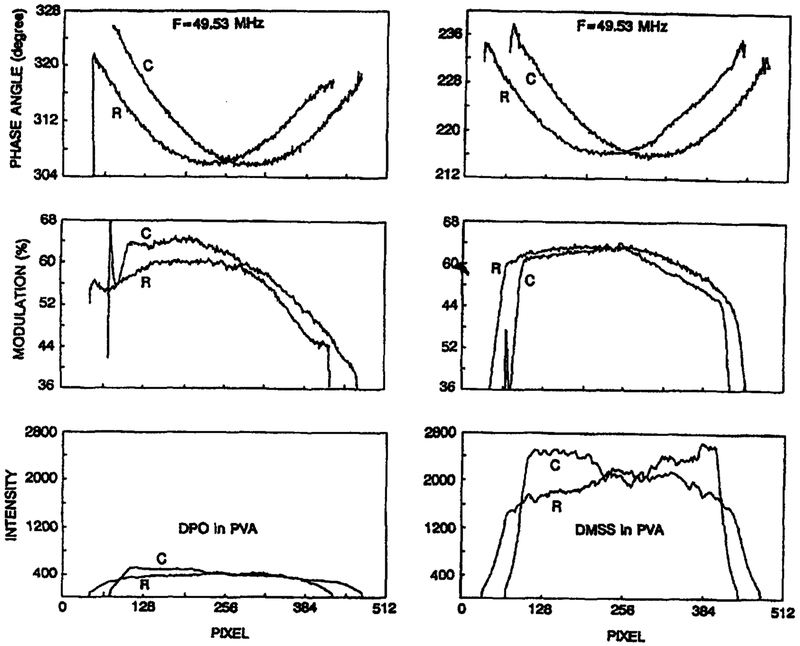
The apparent phase and modulation images of the standards reveal that the response of the image intensifier depends strongly on position. This is illustrated in Figure 6, which shows that the phase angles decrease from the periphery to the central region of the photocathode. The same effect is seen for either direction across the intensifier, and is seen for both standards. This effect is present because of the time delay for the voltage to migrate across the photocathode (an electronic shift within the photocathode), resulting in lower phase angles in the central region where the gain-modulation voltage is most delayed. Note that the phase angles in Figure 6 are apparent values which contain the electronic shift of the apparatus as well as that of the image intensifier. The observed modulation images of the homogeneous standards are also somewhat dependent on position. However, in this case the dependence is more complex and cannot be as easily explained in terms of transit-time effects. Apparently, less obvious electro-optical phenomena affect the depth of modulation of a gain-modulated image intensifier.
Fig. 6.
Position-dependent, phase (top), modulation (middle) and intensity (bottom) of the standard fluocophores as seen by the gain-modulated image intensifier at 49.53 MHz. The values shown are for an average of 10 pixels of a row (R) or column (C) of the CCD image. See Table 1.
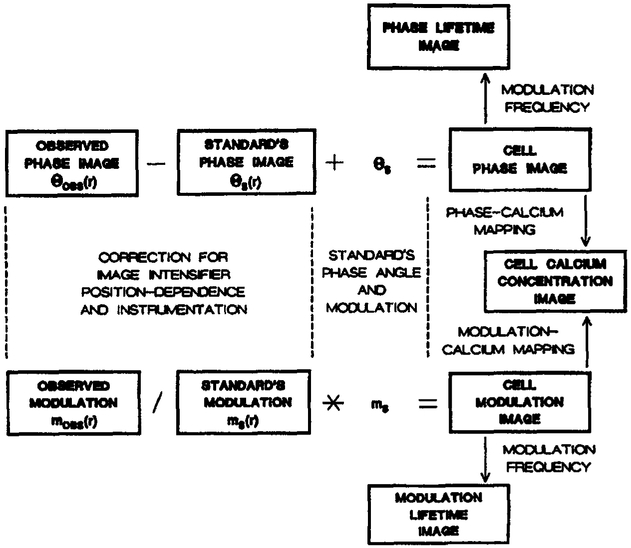
The phase and modulation images of the standards (Fig. 6) can be used to obtain corrected phase and modulation images of the COS cells. This procedure is illustrated schematically in Figure 7. The phase angle image of the standard (θs(r)) is related to the phase angle of the standard (θs) by:
| Eq. 12 |
where θE is the electronic shift of the apparatus and θI(r) is the position-dependent response of the image intensifier. The observed phase angle image of the cells is given by:
| Eq. 13 |
where θ(r) is the true phase angle image. Hence, the desired phase angle image of the cells is given by:
| Eq. 14 |
Fig. 7.
Procedure for correcting for the position-dependent phase and modulation of the image-intensifier and the lifetime of the standard fluorophore.
The corrected modulation image can be obtained similarly, but one must remember that the modulation appears as a product Hence, the modulation image of the standard is given by:
| Eq. 15 |
where k is the constant, mI(r) describes the position-dependent response of the intensifier, and ms is the modulation of the standard. The observed modulation of the cell is given by:
| Eq. 16 |
where m(r) is the true modulation image. Hence, the desired modulation image is given by:
| Eq. 17 |
The portion of these expressions (Eqs 14 & 17) for correcting for the phase (θs) and modulation (ms) of the standard are analogous to those described previously for frequency-domain lifetime standards [62]. Once the phase and modulation images are known, they are easily transformed into apparent phase (τp) and modulation (τm) lifetimes using:
| Eq. 18 |
| Eq. 19 |
where ω is the modulation frequency in radians/s. The phase and modulation images can also be mapped to the [Ca2+] using an appropriate calibration curve.
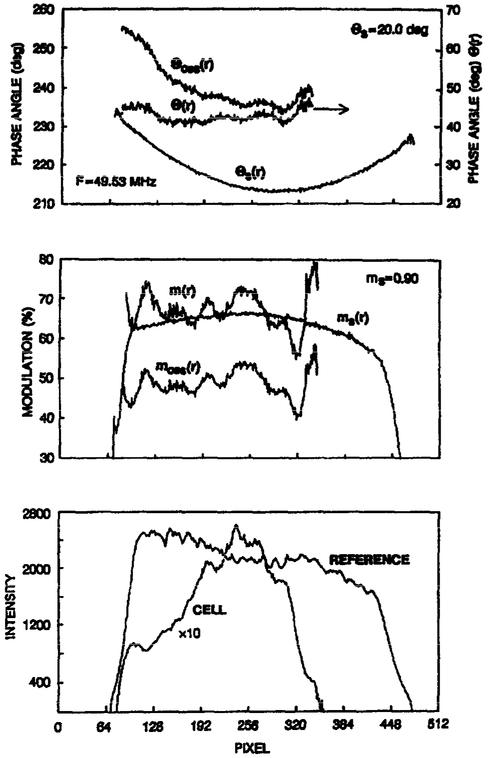
An example of this correction procedure, as applied to one of the COS cells, is shown in Figure 8. The observed phase angles are arbitrary due to the electronic shift, and also skewed towards larger phase angles on the left-hand side due to the position-dependent intensifier response. Application of Equation 14 results in phase angles corrected for both the instrumental shifts and for the radial position-dependent response of the image intensifier.
Fig. 8.
Calculation of the position dependent phase and modulation of a Quin–2 labeled COS cell. The data shown are the average of columns 235–240 of cell C (Fig. 5).
The corrected modulation image is calculated in a similar manner. The observed modulation of the standard (Fig. 8, middle), and the known value of ms, are used to calculate the corrected modulation using Equation 17. In this case the modulation image (m(r) in Fig. 8) retains some fine structure, which is apparently partly related to the intensity of the cell at each point in the image (Fig. 8, lower panel). We suspect that the measured modulation of the cell depends upon the light intensity, possibly because of an imperfect correction for CCD non-linearity. Further experimentation and analysis are required to provide a satisfactory correction for this effect.
Lifetime calcium imaging of COS cells
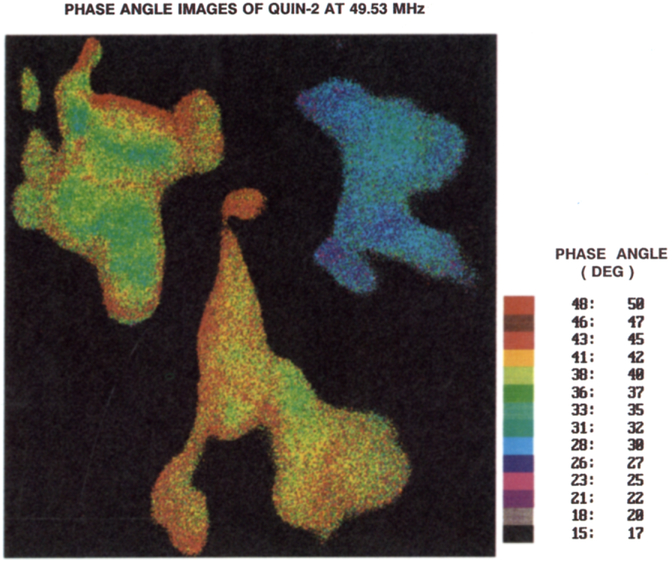
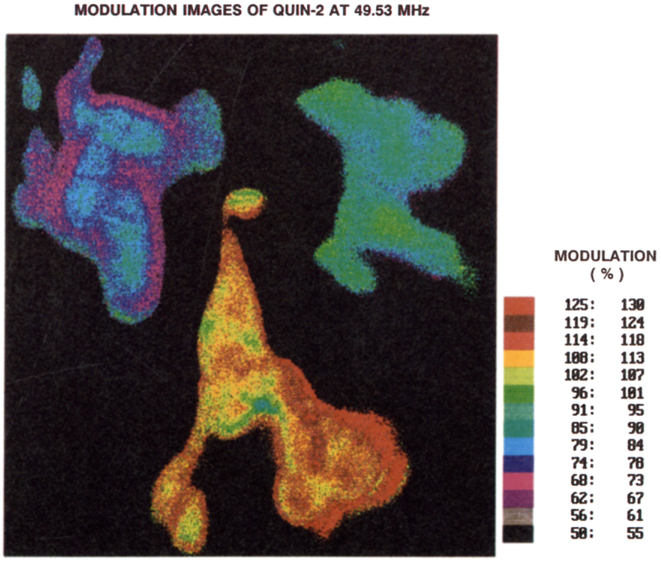
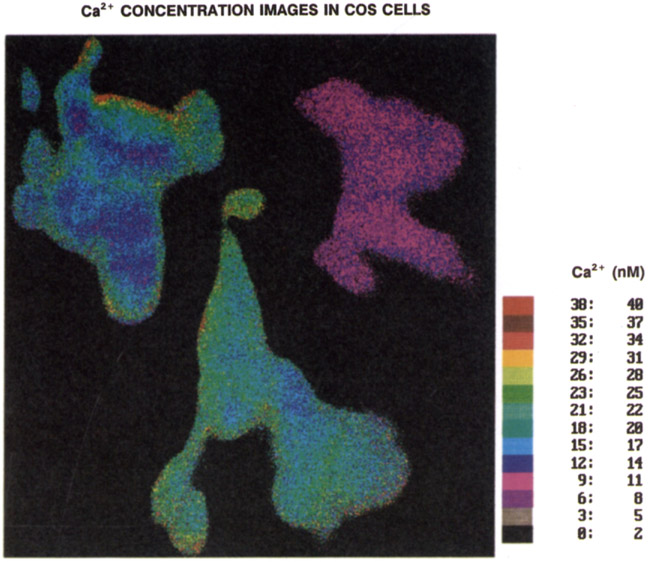
The procedures described above were used to create phase (Fig. 9) and modulation (Fig. 10) images of the Quin–2 loaded COS cells. While the cells displayed wide variations in intensity (Fig. 3), and moderate photobleaching (Fig. 5), the phase angles are relatively constant throughout the cells, suggesting that the Ca2+ concentration is uniform (see also Table 2). This constancy of phase angle and [Ca2+] is in agreement with the result of ratiometric imaging in diverse cells [63]. Non-uniformity of the [Ca2+] has also been observed [64]. Apparently, less favorable results were obtained using the modulation data (Fig. 10). The phase angle measurements appear to be reliable over a range of intensities, and the phase angle alone is adequate to determine the Ca2+ concentration.
Fig. 9.
Phase angle images of the emission from Quin–2 in COS cells, measured at 49.53 MHz.
Fig. 10.
Modulation images of the Quin–2 emission from COS cells, measured at 49.53 MHz.
Table 2.
Average intracellular values of photobleaching, phase, modulation and calcium concentration of three cells.a
| COS | Photobleachingb | Phase | Modulation | Phase-calcium mapping | |
|---|---|---|---|---|---|
| cell | (%) | (deg) | (%) | [Ca2+]c | [Ca2+]d |
| A | 74.2 ± 2.8 | 37.9 ± 1.8 | 79.0 ± 2.3 | 16.7 ± 2.4 | 155.0 ± 36 |
| B | 36.6 ± 4.9 | 29.8 ± 1.1 | 88.9 ± 2.4 | 9.7 ± 0.7 | 49.0 ± 7 |
| C | 52.9 ± 6.0 | 40.5 ± 1.1 | 111.7 ± 3.9 | 18.8 ± 1.0 | 261 ± 33 |
Average values are taken from about 80% of the cell area, excluding outer parts
(I1 – Ia)I1, where I1 and Ia are initial and final steady-state intensities, respectively
Using the calibration curve without photobleaching (Fig. 11)
Using the calibration curve after about 60–70% of photobleaching (Fig. 11).
In general, the modulation images agreed with the phase images, that is, the modulation is higher where the phase angles are lower. An example is seen by comparing the upper region of cell A in Figures 9 and 10. However, the modulation values typically indicate shorter lifetimes than the phase values, and the modulation images were after found to display regions larger than unity (Table 2). This impossible result must be due to some incorrect experimental error, which is not surprising given the sensitivity of the modulation data to absolute intensity values. We suspect this effect is the result of comparing the cellular images with images of standards collected at different times and possibly altered conditions. For future experiments, we intend to circumvent these difficulties using internal standards, such as fluorescence microsphere with known lifetimes. Our previous experiments [22, 24, 25] used a standard within the macroscopic image, which was in effect an internal standard. Consequently, such an effect was not noticed in our previous studies.
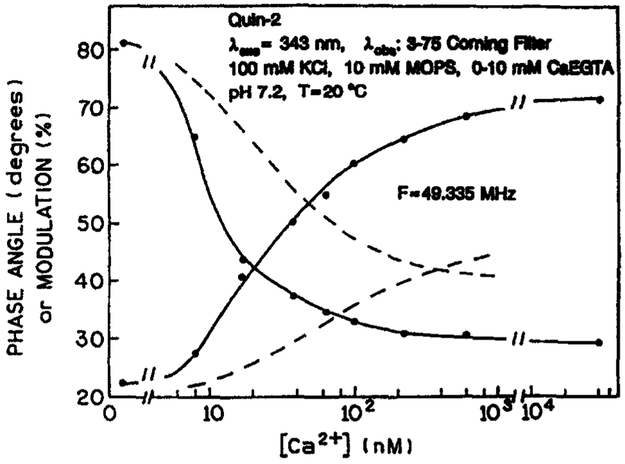
Transformation of a phase angle image into a [Ca2+] image requires a calibration curve, the calibration curves were determined from phase and modulation measurements of Quin–2 in cuvettes using different Ca2+ concentration buffers, at the same conditions as used from cellular imaging, that is, 343 nm excitation, a Coming 3-75 emission filter, at room temperature. Calcium dependent phase and modulation values of Quin–2 at 49.335 MHz are shown in Figure 11. Using these phase values (solid line), we computed the [Ca2+] images shown in Figure 12. The average values of the Ca2+ concentration, for the central 80% of the cells, are summarised in Table 2. The apparent [Ca2+] range from 10–20 nM, in agreement with other measurements using Quin–2 [65]. However, the expected concentration is 100 nM or higher. Hence we performed separate wavelength-ratiometric measurements using Indo–1 to determine the average Ca2+ concentration in these cells. Labelling with Indo–1 was accomplished by electroporation [58]. Using our ratio-calibration curve [60], these measurements revealed Ca2+ concentrations near 229 ±13 nM (SEM, n = 10). This value is quite similar to the resting calcium observed in diverse cultured and freshly dissociated cells measured with the potassium salts of Indo–1 or Fura–2. Hence, it appears possible that the low apparent Ca2+ concentration obtained from the FLIM measurements are the result of use of the AM-loading method [8, 63, 66, 67]. It should also be noted that the apparent Ca2+ dissociation constants of Quin–2 are near 29 and 10 nM as seen from the phase and modulation data respectively, (Fig. 11), whereas it is 70 nM or larger as seen by the intensity measurements [24]. Hence, the low apparent Ca2+ concentration could be a result of being above the useful range of Quin–2 when used as a lifetime probe. More probably, the low apparent Ca2+ concentration is the result of a Ca2+-dependent phototransformation of Quin–2 (below). We note that the combined use of FLIM and wavelength-ratiometric methods may provide insights into the origin of these discrepancies. For instance, the use of multi-frequency FLIM could allow the resolution of multi-exponential decays on a pixel-by-pixel basis. Such data, when combined with knowledge of the lifetime of various forms of Quin–2, should reveal if such species are present in the AM-loaded cells.
Fig. 11.
Phase and modulation calibration curves for Quin–2, 49.335 MHz. The dashed line shows the estimated phase and modulation calibration curves following phototransformation of Quin–2 by a focused laser beam. The rising and falling curves are the phase and modulation, respectively.
Fig. 12.
Calcium concentration image of the COS cells, as obtained from the pre-photobleaching Quin–2 calibration curve (Fig. 11).
Effects of Quin–2 photobleaching and phototransformation on Ca2+ images
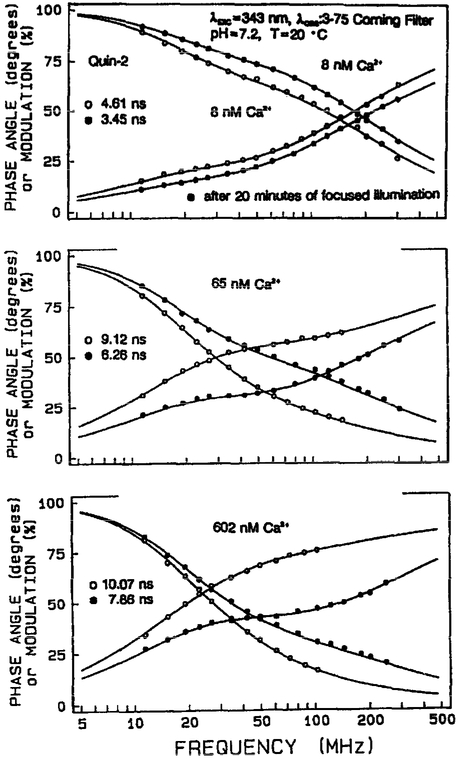
Our analysis of the data described above led us to question whether Quin–2 was forming fluorescent photoproducts during illumination of the labeled cells. Such products could potentially explain the low apparent Ca2+ concentrations revealed by the phase angle images. Formation of fluorescent photoproducts of Fura–2 has been reported by Becker and Fay [68]. Since it is difficult to perform lifetime measurements in the microscope, we used out standard frequency domain instrumentation [27, 56]. To mimic the intense illumination obtained with the microscope, we focused the 343 nm output of a Pyridine 2 dye laser into a small volume cuvette containing Quin–2 with varying amounts of Ca2+. These conditions resulted in a rapid decrease in the Quin–2 intensity, ami the Ca2+-containing samples appeared to bleach somewhat more rapidly than Ca2+-free Quin–2. More importantly, the phase and modulation of Quin–2 emission changed continually with the extent of illumination, which indicates the formation of fluorescent photoproducts with lifetimes distinct from those displayed by Quin–2.
Frequency-responses of the Quin–2 emission before (open circles) and after (filled circles) photobleaching are shown in Figure 13. These ‘after photobleaching’ measurements were performed where about 60–70% of the intensity was lost, a value comparable to that observed during cellular imaging. In all cases the frequency responses shift due to higher frequency following focused illumination, with the extent of the shifts being greater at higher Ca2+ concentrations. The multi-exponential analyses of these frequency-responses are shown in Table 3. The shift towards shorter mean decay times () is the result of an illumination-dependent loss of the 10.4 ns component associated with the Ca2+-bound form of Quin–2 [23, 24]. This effect can be seen by examining the amplitudes (αi) of the 10.4 ns form, which decrease several-fold following illumination (Table 3). The intensity decay also appears to become more heterogeneous following focused illumination. This is seen from the double exponential fit, which is more satisfactory prior to photobleaching (Table 3).
Fig. 13.
Frequency-domain intensity decay data for Quin–2, before (open circles) and after (filled circles) photobleaching. The multi-exponential decay parameters are given in Table 3.
Table 3.
Global multi-exponential analysis of the intensity decay of Quin–2.a
| τ1 = 0.62 ns | τ2 = 1.31 ns | τ3 = 10.40 ns | |||||
|---|---|---|---|---|---|---|---|
| < τ1 = 0.54 ns | τ2 = 1.32 ns | τ3 = 10.32 ns | b | ||||
| [Ca2+] nm | α1c | α2 | α3 | f1 | f2 | f3 | |
| 8 | 0.402 | 0.540 | 0.058 | 0.160 | 0.452 | 0.388 | 4.60 |
| < 0.579 | 0.391 | 0.030 | 0.276 | 0.455 | 0.269 | 3.45 > | |
| 38 | 0.328 | 0.381 | 0.290 | 0.055 | 0.136 | 0.811 | 8.47 |
| <0.481 | 0.419 | 0.089 | 0.153 | 0.318 | 0.529 | 5.82 > | |
| 100 | 0.129 | 0.365 | 0.505 | 0.014 | 0.082 | 0.904 | 9.45 |
| <0.608 | 0.270 | 0.122 | 0.170 | 0.184 | 0.646 | 7.02 > | |
| 602 | 0.010 | 0.192 | 0.798 | 0.001 | 0.029 | 0.970 | 10.07 |
| <0.544 | 0.276 | 0.180 | 0.117 | 0.145 | 0.738 | 0.786 > | |
In buffer at pH 7.2, 20°C, 343 nm excitation, emission observed through a Coming 3-75 filter
The numbers in angular brackets are after 20 min of focused illumination (60–70% photobleaching)
The intensity decays were fit to the multi-exponential model, . The fractional intensity of each component is give by ; The following values were obtained for a global double exponential fit: τ1 = 1.02 ns; τ2 = 10.31 ns; ; < τ1 = 0.83 ns; τ2 = 9.69 ns;
These light-dependent changes in Quin–2 could explain the low apparent Ca2+ concentrations observed in the COS cells from the FLIM data. This is illustrated by the dashed lines in Figure 11, which shows the Ca2+ calibration curve which we estimate would apply following photobleaching of Quin–2. Examination of Figure 11 reveals that photobleaching of Quin–2 results in decreased phase angles (dashed line), which will map to lower Ca2+ concentrations when using the original calibration curve (solid line). Similarly, the modulation increased on photobleaching (dashed line), and these values will also map to lower Ca2+ concentrations (solid line).
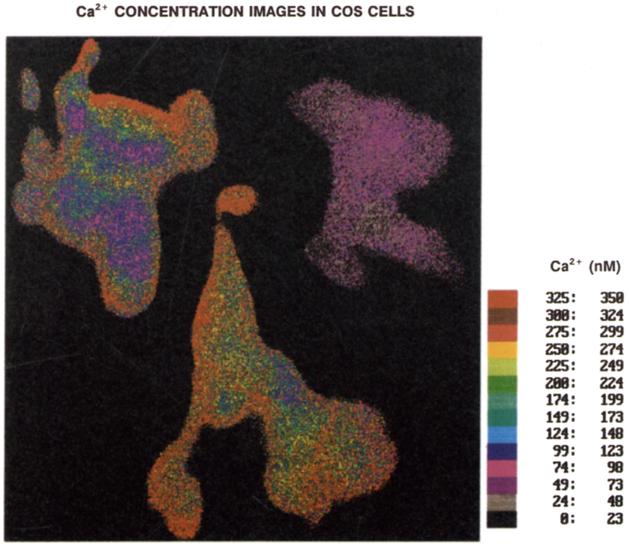
We used the calibration curve for Quin–2, obtained after photobleaching and/or phototransformation, to determine the Ca2+ concentration images (Fig. 14). In this case the [Ca2+] range from 49–261 nM, in agreement with the Indo–1 results, which we note were obtained for different COS cells than were used for FLIM. The average values of [Ca2+] are summarised in Table 2. Based on these results, it is essential that the Ca2+ probes be examined for phototransformation effects, whether the [Ca2+] are determined by FLIM or wavelength-ratiometric methods. Additionally, it seems clear that there is a need for a Ca2+ probe which displays higher photostability.
Fig. 14.
Calcium concentration images of the COS cells, as obtained from the after photobleaching Quin–2 calibration curve. (Fig. 11).
Discussion
We demonstrated the possibility of imaging intracellular Ca2+ using FLIM.. The ability to obtain these images using Quin–2 suggests that the method will be useful for many types of chemical imaging. The emission of Quin–2 is known to be weaker than Fura–2 or Indo–1, and Quin–2 is also thought to be more sensitive to photobleaching. Hence, it should be possible to readily use the FLIM method with more highly fluorescent probes or those which display less photobleaching or photodecomposition.
An unfortunate property of Quin–2 appears to be its formation of fluorescent photoproducts under the intense illumination present in a fluorescent microscope. These new emissions can distort the phase and modulation calibration curves, and thus the Ca2+ images. However, such product formation may not be a property of all Ca2+ probes. However, we note that even the most widely used probe Fura–2 has been reported to undergo phototransformation to species which are not sensitive to Ca2+, and thus alter the wavelength-ratiometric calibration curves [68]. Importantly, the FLIM measurements revealed the existence of these products, which may also account for the reported difficulties in using Quin–2 as a Ca2+ wavelength-ratiometric indicator. The lifetime measurements and multi-exponential analysis can reveal whether the probes photobleach, which will not cause a change in lifetime if the probe emission is the dominant signal, or undergoes transformation to fluorescent products with different emission and/or Ca2+ binding properties and thus alter the calibration curves. The combined use of FLIM, frequency-domain and wavelength-ratiometric measurements should help clarify which probes are most reliable for Ca2+ imaging of cells.
We now know that the lifetime of other probes are sensitive to analytes of interest For instance, the lifetimes of the non-ratiometric probes Calcium Green, Crimson, and Orange (Molecular Probes, Eugene, OR, USA) were recently shown to be dependent on Ca2+ [22]. Hence, it will be possible to image Ca2+ using visible wavelength sources such as an argon ion laser. Additionally, it will be possible to image pH using visible wavelengths and probes of the SNAFL and SNARF series which can be excited with a green He-Ne laser at 543 nm [47] and to image Cl− based on its collisional quenching of quinolines [69]. A borderline lifetime probe is available for K+ [70], and additional probes for K+ [71] and other analytes remain to be tested. Hence, FLIM offers many opportunities for chemical imaging of cells.
Acknowledgements
The authors acknowledge support from grants from the National Science Foundation (DIR-8710401 and DMB-8804931), The National Institute of Health RR-07510 and RR-08119, Center for Fluorescence Spectroscopy and Institutional grants and support from the Medical Biotechnology Center and Graduate School at the University of Maryland, without whom these experiments could not have been accomplished.
Abbreviations :
- AM
acetoxymethyl ester
- CCD
charged coupled device
- COS
transformed kidney epithelial cells from a green monkey, distributed by the American Type Culture Collection
- DPO
2,5-bis(4-diethylaminophenyl)-1,3,4-oxadiazole
- DMSS
4-diethylamino-ω-methyl-sulfonyl-trans-styrene
- FLIM
fluorescence lifetime imaging
- PVA
poly-vinylalcohol
- Quin–2
2-{[2-bis-(carboxymethyl)-aimino-5-methylphenoxy]-methyl}-6-methoxy-8-bis-(carbooxymethyl)-aminoquinoline
References
- 1.Ryan TA Millard PJ Webb WW (1990) Imaging [Ca2+]i dynamics during signal transduction. Cell Calcium, 11, 145–155. [DOI] [PubMed] [Google Scholar]
- 2.Sugimori M Llinás RR. (1990) Real-time imaging of calcium influx in mammalian cerebellar Purkinje cells in vitro. Proc. Natl. Acad. Sci. USA, 87, 5084–5088. [DOI] [PMC free article] [PubMed] [Google Scholar]
- 3.Tucker RW Fay FS (1990) Distribution of intracellular free calcium in quiescent BALB/c 3T3 cells stimulated by platelet-derived growth factor. Eur. J., Cell Biol, 51, 120–127. [PubMed] [Google Scholar]
- 4.Cornell Bell AH Finkbeiner SM Cooper MS Smith SJ. (1990) Glutamate induces calcium waves in cultured astrocytes: Long range glial signaling. Science, 247, 470–473. [DOI] [PubMed] [Google Scholar]
- 5.Llinás RR Sugimori M Silver RB (1992) Microdomains of high calcium concentration in a presynaptic terminal. Science, 256, 677–680. [DOI] [PubMed] [Google Scholar]
- 6.Williams DA Becker PL Fay FS. (1987) Regional changes in calcium underlying contraction of single smooth muscle cells. Science, 235, 1644–1648. [DOI] [PubMed] [Google Scholar]
- 7.Tsien RY Harootunian AT (1990) Practical design criteria for a dynamic ratio imaging system. Cell Calcium, 11, 93–109. [DOI] [PubMed] [Google Scholar]
- 8.Niggli E Lederer WJ (1990) Real-time confocal microscopy and calcium measurements in heart muscle cells: Towards the development of a fluorescence microscope with high temporal and spatial resolution. Cell Calcium, 11, 121–130. [DOI] [PubMed] [Google Scholar]
- 9.Takamatsu T Wier WG (1990) High temporal resolution video imaging of intracellular calcium. Cell Calcium, 11, 111–120. [DOI] [PubMed] [Google Scholar]
- 10.Grynkiewicz G Poenie M Tsien RY (1985) A new generation of Ca2+ indicators with greatly improved fluorescence properties. J. Biol. Chem, 260, 3440–3450. [PubMed] [Google Scholar]
- 11.Komada H Nakabayashi H Nakano H. et al. (1989) Measurement of the cytosolic free calcium ion concentration of individual lymphocytes by microfluorometry using Quin-2 or Fura-2. Cell Struct Funct., 14, 141–150. [DOI] [PubMed] [Google Scholar]
- 12.Cobbold PH Rink TJ (1987) Fluoresoence and bioluminescence measurement of cytoplasmic free calcium. Biochem. J 248, 313–328. [DOI] [PMC free article] [PubMed] [Google Scholar]
- 13.Moore ED Becker PL Fogarty KE Williams DA Fay FS (1990) Ca2+ imaging in single living cells: Theoretical and practical issues. Cell Calcium, 11, 63–73. [DOI] [PubMed] [Google Scholar]
- 14.Tsien RY (1989) Fluorescent indicators of ion concentrations. Methods Cell Biol., 30, 127–156. [DOI] [PubMed] [Google Scholar]
- 15.Bright GR Fisher GW Rogowska J Taylor DL (1989) Fluorescence ratio imaging microscopy. Methods Cell Biol., 30, 157–192. [DOI] [PubMed] [Google Scholar]
- 16.Gross D Loew LM. (1989) Fluorescent indicators of membrane potential: microspectrofluorometry and imaging. Methods Cell Biol., 30, 193–218. [DOI] [PubMed] [Google Scholar]
- 17.Montana V Farkas DL Loew LM (1989) Dual-wavelength ratiometric fluorescence measurements of membrane potential. Biochemistry, 28, 4536–4539. [DOI] [PubMed] [Google Scholar]
- 18.George EB Nyirjesy P Basson M. et al. (1988) Impermeant potential-sensitive oxonol dyes: I. Evidence for an "on-off" mechanism. J. Membr. Biol, 103, 245–253. [DOI] [PubMed] [Google Scholar]
- 19.Nakashima N Kunitake T (1982) Drastic fluorescence enhancement of cyanine dyes bound to synthetic bilayer membranes. Its high sensitivity to the chemical structure and the physical state of the membrane. J. Am. Chem. Soc, 104, 4261–4262. [Google Scholar]
- 20.Tsien RY (1980) New calcium indicators and buffers with high selectivity against magnesium and protons: Design synthesis and properties of prototype structures. Biochemistry, 19, 2396–2404. [DOI] [PubMed] [Google Scholar]
- 21.Tsien RY Pozzan T (1989) Measurement of cytosolic free Ca2+ with Quin-2. Methods Enzymol., 172, 230–262. [DOI] [PubMed] [Google Scholar]
- 22.Lakowicz JR Szmacinski H Johnson ML. (1992) Calcium imaging using fluorescence lifetimes and long-wavelength probes. J. Fluorescence, 2, 47–62. [DOI] [PMC free article] [PubMed] [Google Scholar]
- 23.Miyoshi N Hara K Kimura S Nakanishi K Fukuda M (1991) A new method of determining intracellular free Ca2+ concentration using Quin-2 fluorescence. Photochem. Photobiol, 53, 415–418. [DOI] [PubMed] [Google Scholar]
- 24.Lakowicz JR Szmacinski H Nowaczyk K Johnson ML (1992) Fluorescence lifetime imaging of calcium using Quin-2. Cell Calcium, 13, 131–147. [DOI] [PMC free article] [PubMed] [Google Scholar]
- 25.Lakowicz JR Szmacinski H Nowaczyk K Berndt K Johnson ML (1992) Fluorescence lifetime imaging. Anal. Biochem, 202, 316–330. [DOI] [PMC free article] [PubMed] [Google Scholar]
- 26.Gratton E Limkeman M (1983) A continuously variable frequency cross-correlation phase fluorometer with picosecond resolution. Biophys. J, 44, 315–324. [DOI] [PMC free article] [PubMed] [Google Scholar]
- 27.Lakowicz JR Maliwal BP (1985) Construction and performance of a variable-frequency phase-modulation fluorometer. Biophys. Chem, 21, 61–78. [DOI] [PubMed] [Google Scholar]
- 28.Lakowicz JR (1983) Principles of Fluorescence Spectroscopy. New York, Plenum Press. [Google Scholar]
- 29.Lakowicz JR Cherek H (1981) Phase-sensitive fluorescence spectroscopy: A new method to resolve fluorescence or emission spectra of components in a mixture of fluorophores. J. Biochem. Biophys. Methods, 5, 19–35. [DOI] [PubMed] [Google Scholar]
- 30.Lakowicz JR Berndt KW (1991) Lifetime-selective fluorescence imaging using an rf phase-sensitive camera. Rev. Sci. Instrum, 62, 1727–1734. [Google Scholar]
- 31.Morgan CG Mitchell AC Murray JG (1990) Nanosecond time-resolved fluorescence microscopy: principles and practice. Paper presented at MICRO 90, chapter 13. London, pp. 463–466. [Google Scholar]
- 32.Morgan CG Murray JG (1991) A phase/quadrature correlator for the measurement of fluorescence-decay times by single-photon counting. Chem. Phys. Lett, 179, 211–217. [Google Scholar]
- 33.Bugiel I König K Wabnitz H (1989) Investigation of cells by fluorescence laser scanning microscopy with subnanosecond time resolution. Lasers Life Sci., 3, 47–53. [Google Scholar]
- 34.Sasaki K Koshioka M Masuhara H (1991) Three-dimensional space- and time-resolved fluorescence spectroscopy. Appl. Spect, 45, 1041–1045. [Google Scholar]
- 35.Keating S Wensel TG. (1991) Nanosecond fluorescence microscopy. Emission kinetics of Fura-2 in single cells. Biophys. J, 59, 186–202. [DOI] [PMC free article] [PubMed] [Google Scholar]
- 36.Wang XF Uchida T Minami S (1989) A fluorescence lifetime distribution measurement system based on phase-resolved detection using an image dissector tube. Spectroscopy, 43, 840–845. [Google Scholar]
- 37.Wang XF Kitajima S Uchida T Coleman DM Minami S (1990) Time-resolved fluorescence microscopy using multichannel photon counting. Appl. Spect, 44, 25, 30. [Google Scholar]
- 38.Wang XF Uchida T Coleman DM Minami S (1991) A two-dimensional fluorescence lifetime imaging system using a gated image intensifier. Appl. Spect, 45, 360–366. [Google Scholar]
- 39.Lippitsch ME Pusterhofer J Leiner MJP Wolfbeis OS (1988) Fibre-optic oxygen sensor with the fluorescence decay time as the information carrier. Anal. Chim. Acta, 205, 106. [Google Scholar]
- 40.Chao AC Dix JA Sellers MC Verkman AS (1989) Fluorescence measurement of chloride transport in monolayer cultured cells. Biophys. J, 56, 1071–1081. [DOI] [PMC free article] [PubMed] [Google Scholar]
- 41.Verkman AS Takla R Sefton B Basbaum C Widdicombe JH (1989) Quantitative fluorescence measurement of chloride transport mechanisms in phospholipid vesicles. Biochemistry, 29, 4240–4244. [DOI] [PubMed] [Google Scholar]
- 42.Lakowicz JR Maliwal BP Ozinskas A Thompson RB (1993) Fluorescence lifetime energy transfer immunoassay quantified by phase-modulation fluorometry. Sensors Actuators, 12, 65–70. [Google Scholar]
- 43.Lakowicz JR Szmacinski H Karakelle M (1992) Optical sensing of pH and pCO2 using phase-modulation fluorometry and resonance energy transfer. Anal. Chim. Acta, 272, 179–186. [Google Scholar]
- 44.Lakowicz JR Maliwal B (1992) Optical sensing of glucose using phase-modulation fluorometry. Anal. Chim. Acta, 271, 155–164. [Google Scholar]
- 45.Ozinskas A Malak H Joshi J et al. (1993) Homogeneous immunoassay of thyroxine by phase-modulation fluorescence spectroscopy. Anal. Biochem, 213, 264–270. [DOI] [PubMed] [Google Scholar]
- 46.Berndt KW Lakowicz JR (1992) Electroluminescent lamp-based phase fluorometer and oxygen sensor. Anal. Biochem, 201, 319–325. [DOI] [PubMed] [Google Scholar]
- 47.Szmacinski H Lakowicz JR (1993) Optical measurements of pH using fluorescence lifetimes and phase-modulation fluorometry. Anal. Chem, 65, 1668–1674. [DOI] [PMC free article] [PubMed] [Google Scholar]
- 48.Hiraoka Y Sedat JW Agard DA (1987) The use of a charge-coupled device for quantitative optical microscopy of biological structures. Science, 238, 36–41. [DOI] [PubMed] [Google Scholar]
- 49.Tsay T-T Inman R Wary B Herman B Jacobson K (1990) Characterization of low-light-level cameras for digitized video microscopy. J. Microsc, 160, 141–159. [DOI] [PubMed] [Google Scholar]
- 50.Aikens RS Agard DA Sedat JW (1989) Solid state images for microscopy. Methods Cell Biol., 30, 291–313. [DOI] [PubMed] [Google Scholar]
- 51.Spring KR (1991) Illumination, wavelength selection, and detection in fluorescence microscopy. Kidney Int., 40, S18–S22. [PubMed] [Google Scholar]
- 52.Fay FS Carrington W Fogarty KE (1989) Three-dimensional molecular distribution in single cells analyzed using the digital imaging microscope. J. Microsc, 153, 133–149. [PubMed] [Google Scholar]
- 53.Agard DA Hiraoka Y, Shaw P Sedat JW (1989) Fluorescence microscopy in three dimensions. Methods Cell Biol., 30, 353–377. [DOI] [PubMed] [Google Scholar]
- 54.Jovin TM Marriott G Clegg RM Arndt-Jovin DJ (1989) Photophysical processes exploited in digital imaging microscopy: Fluorescence resonance energy transfer and delayed luminescence. Ber. Bunsenges. Phys. Chem, 93, 387–391. [Google Scholar]
- 55.Marriott G Clegg RM Arndt-Jovin DJ Jovin TM (1991) Time-resolved imaging microscopy. Phosphorescence and delayed fluorescence imaging. Biophys. J, 60, 1374–1387. [DOI] [PMC free article] [PubMed] [Google Scholar]
- 56.Laczko G Gryczynski I Gryczynski Z Wiczk W Malak H Lakowicz JR (1990) A 10-GHz frequency domain fluorometer. Rev. Sci. Instrum, 61, 2331–2337. [Google Scholar]
- 57.Bevington PR (1969) Data Reduction and Error Analysis for the Physical Sciences. New York, McGraw Hill. [Google Scholar]
- 58.Kieval RS Kirby MS Hadley RW Cheng H Kofuji P Lederer WJ (1992) Electroporation-loading of fluorescent indicators in cultured cells and acutely dissociated cells. In preparation. [Google Scholar]
- 59.Berlin JR Cannell MB Lederer WJ (1989) Cellular origins of the transient inward current, IT1, in cardiac myocytes: Role of fluctuations and waves of elevated intracellular calcium. Circ. Res, 65, 115–126. [DOI] [PubMed] [Google Scholar]
- 60.Bers DM Lederer WJ Berlin JR (1990) Intracellular Ca transients in rat cardiac myocytes: Role of Na–Ca exchange in excitation-contraction coupling. Am. J. Physiol, 258, C944–C954. [DOI] [PubMed] [Google Scholar]
- 61.Benson DM Bryan J Plant AL Gotto AM Jr Smith LC (1985) Digital imaging fluorescence microscopy: Spatial heterogeneity of photobleaching rate constants in individual cells. J. Cell Biol, 100, 1309–1323. [DOI] [PMC free article] [PubMed] [Google Scholar]
- 62.Lakowicz JR Cherek H Balter A (1981) Correction of timing errors in photomultiplier tubes used in phase-modulation fluorometry. J. Biochem. Biophys. Methods, 5, 131–146. [DOI] [PubMed] [Google Scholar]
- 63.Berlin JR Wozniak MA Cannell MB Bloch RJ Lederer WJ (1990) Measurement of intracellular Ca2+ in BC3H-1 muscle cells with Fura-2: Relationship to acetylcholine receptor synthesis. Cell Calcium, 11, 371–384. [DOI] [PubMed] [Google Scholar]
- 64.Lipscombe D Madison DV Poenie M Reuter H Tsien RW (1988) Spatial distribution of calcium channels and cytosolic calcium transients in growth cones and cell bodies of sympathetic neurons. Proc. Natl. Acad. Sci. USA, 85, 2398–2402. [DOI] [PMC free article] [PubMed] [Google Scholar]
- 65.Kruskal BA Keith CH Maxfield FR (1984) Thyrotropin-releasing hormone-induced changes in intracellular [Ca2+] measured by microspectrofluorometry on individual Quin-2 loaded cells. J. Cell Biol, 99, 1167–1172. [DOI] [PMC free article] [PubMed] [Google Scholar]
- 66.Almers W Neher E (1985) The Ca signal from Fura-2 loaded mast cells depends strongly on the method of dye loading. FEBS Lett., 192, 13–18. [DOI] [PubMed] [Google Scholar]
- 67.Scanlon M Williams DA Fay FS (1987) A Ca insensitive form of Fura-2 associated with polymorphonuclear leukocytes. J. Biol. Chem, 262, 6308–6312. [PubMed] [Google Scholar]
- 68.Becker PL Fay FS (1987) Photobleaching of fura-2 and its effect on determination of calcium concentrations. Am. J. Physiol, 253, C613–C618. [DOI] [PubMed] [Google Scholar]
- 69.Illsley NP Verkman AS (1987) Membrane chloride transport measured using a chloride-sensitive fluorescent probe. Biochemistry, 26, 1215–1219. [DOI] [PubMed] [Google Scholar]
- 70.Lakowicz JR Szmacinski H Berndt KW (1992) Fluorescence lifetime-based sensing of blood gases and cations. Proc. SPIE, 1648, 150–163. [Google Scholar]
- 71.Golchini K Mackovic-Basic M Gharib SA Masilamani D, Lucas ME Kurtz I (1990) Synthesis and characterization of a new fluorescent probe for measuring potassium. Am. J. Physiol, 258, 438–453. [DOI] [PubMed] [Google Scholar]
- 72.Kawski A Gryczynski Z Gryczynski I Kusba J (1992) Directions of the electronics absorption transition moments in ω-substituted 4-dimethylamino-trans-styrenes. Z. Naturforsch, 47a, 471–474. [Google Scholar]


