

Abstract
We used frequency-domain fluorescence spectroscopy to examine the intensity decays of a fluorescent donor attached to an acceptor via a flexible alkyl chain. The intensity decay of the indole donor becomes markedly heterogeneous due to energy transfer to the dansyl acceptor. The measured dispersion of fluorescence decay times was used to recover the donor-to-acceptor distance distribution. The distance distribution was found to be characteristic of the molecule, and not the model used for data analysis. The ability to recover distance distributions in solution should be valuable in studies of biological macromolecules.
1. Introduction
Fluorescence energy transfer is widely used in biochemical research to measure the distances between donors and acceptors on macromolecules [1,2]. The basic idea is that the presence of an acceptor (A) at a distance (r) results in an additional decay rate for the donor (D). Measurement of the yield or the decay time of the donor provides an estimate of the D-A distance. To date, most studies of energy transfer provided estimates of a single D-A distance, that is, the case where the molecule was expected to have a single conformation in solution. However, a few pioneering studies of distance distributions have been reported by Steinberg and co-workers [3,4] and Fung and Stryer [5].
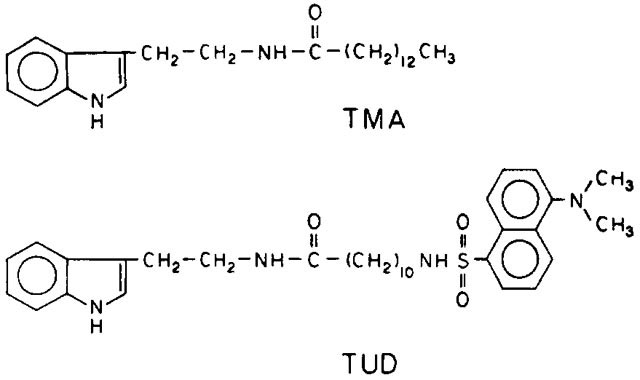
In this report we describe a generalization of the energy transfer measurements to recover the distribution of D-A distances which occur when a range of conformations is possible. In our particular case we examined the decays of the donor (indole) linked to an acceptor (dansyl) via an alkyl chain. The donor (TMA) and D-A pair (TUD) are shown below. Since the linker is flexible we expect a range of D-A distances. The dispersion of D-A distances results in a dispersion of transfer rates to the acceptor, and hence a dispersion in the frequency response of the acceptor. We used the acceptor-induced heterogeneity in the donor decay to recover the probability distribution of the D-A distances.
2. Theory
Assume the decay of the donor (ID(t)), in the absence of acceptor, is a single exponential
| (1) |
where τD is the decay time of the donor. If a single acceptor is present at a distance r then the donor decay is given by
| (2) |
where
| (3) |
with R0 being Förster distance [6]. It is important to notice that the decay of the donor remains a single exponential in the presence of a single acceptor at a distance r,
| (4) |
The widespread use of energy transfer for distance measurements is partially a result of the simple decay for a single D-A distance. The efficiency of energy transfer, given by
| (5) |
can be used to calculate the D-A distance using
| (6) |
R0 can be calculated from the spectral properties of the chromophores,
| (7) |
where K2 is the orientation factor, ∅D the quantum yield of the donor in the absence of the acceptor, n the refractive index, N is Avogadro’s number, FD(λ) is the emission spectra of the donor normalized to unity, ∊A,(λ) is the absorption spectrum of the accceptor in units of M−1 cm−1 and λ is the wavelength in nm. Calculation of distances also requires some knowledge of K2, which can be obtained from steady state and time-resolved anisotropy measurements [7] In our analysis we assume the value of k is equal to 2/3 due to the range of conformations, the possibility of rotational diffusion at the higher temperatures, and the mixed polarization of the species [8].
The theory of fluorescence energy transfer becomes more complex for a range of D-A distances. Consider a D-A pair covalently linked by a flexible chain, and that the solution is too dilute for transfer between non-bonded D-A pairs. Each molecule will be characterized by some specific distance r, resulting in a single-exponential decay for each molecule
| (8) |
For an ensemble of molecules with a distance distribution P(r) between donors and acceptors, the intensity decay of the donor is
| (9) |
In this initial report we assume that the probability distribution is a Gaussian
| (10) |
where is the average, σ the standard deviation of the distribution, and n=0, 1 or 2. The standard deviations is related to the full-width at half-maximum fwhm by fwhm = 2.354σ. The use of a Gaussian is clearly an approximation, which must ultimately be refmed by further expe~mentation. The choice of the exponent for r depends upon whether one assumes the D-A distance distribution is a Gaussian along a line, in a plane or in three dimensions. For most analyses in this report we used n = 0. However, we note that the recovered distributions were visually similar whether n was 0, 1 or 2 (see fig. 4 and the related discussion).
Fig. 4.

Top: Distance distributions recovered at – 5, 5 and 20°C for TUD in propylene glycol. Bottom: Distance distributions found using Gaussian distributions multiplied by r0,r1 and r2. The shaded region indicates the maximum range of P(r) values found at 20°C using the different models.
We used the frequency response of the donor to recover the distance distribution. One measures the phase (∅ω) and modulation (mω) of the emission over a range of modulation frequencies (ω). The expected values can be calculated for any distribution using
| (11) |
| (12) |
The order of the integration can be reversed, yielding
| (13) |
| (14) |
The calculated (c) phase and modulation values for the assumed distribution are given by
| (15) |
| (16) |
The parameter values are estimated by minimizing ,
| (17) |
where v is the number of degrees of freedom and δ∅ and δm are the experimental uncertainties in the measured phase and modulation values. We used numerical integration to calculate Nω and Dω. The uncertainties in and σ were estimated with consideration of correlation between the parameters [9, 10].
3. Materials and methods
The donor was N-myristoyl tryptamine (TMA). This compound was synthesized by coupling tryptamine to myristic anhydride in tetrahydrofuran. Myristic anhydride was formed by refluxing with acetic anhydride, followed by removal of the excess anhydride under vacuum. The donor-acceptor pair was the covalent amide formed between tryptamine and 11-((5-dimethylaminonaphthalene-1-sulfonyl)-amino) undecanoic acid (DUA, Molecular Probes, Oregon). The anhydride of DUA was formed by refluxing in acetic anhydride. The excess acetic anhydride was removed under vacuum, the residue dissolved in tetrahydrofuran, then reacted with tryptamine. The product (TUD) was isolated initially on a silica column eluted with CHCl3/methanol. Both TMA and TUD were purified by HPLC on a Cl8 column with methanol-water as the mobile phase. The TMA donor displayed the characteristic absorption and emission of indole, and TUD displayed the characteristics of indole and dansyl.
The results were confirmed by a second synthesis, followed by analysis of the new data. In this case the donor was N-palmitoyl tryptamine (TPA), which was formed in tetrahydrofuran using dicyclohexylcarbodimide. The D-A pair was the same, TUD, but it was formed using dicyclohexylcarbodimide in tetrahydrofuran. Once again, the substances (TPA and TUD) were purified in Cl8 HPLC, and displayed the expected absorption spectra.
Values of R0. were calculated using eq. (7). The quantum yields were obtained relative to tryptophan in water at 20°C using a value of 0.13 [11], with appropriate corrections for the refractive index of water and propylene glycol and the optical densities of the solutions. We used the uncorrected emission spectra of tryptophan and the donor, which should not cause significant errors because the efficiency of the photomultiplier and the emission monochromator are relatively constant from 300 to 400 nm and the spectra are similar. The quantum yields of TMA were found to be 0.483,0.466 and 0.445 at –5, 5 and 20°C respectively. For calculation of R0. we used an extinction coefficient of 4590 M−1 cm−1 at 340 nm, yielding R0 values of 25.9, 25.7 and 25.5 Å
Frequency-domain measurements were performed using the instrument described previously [12]. The modulated excitation is provided by the harmonic content of a train of 8 ps pulses from a cavity-dumped R6G dye laser, which was frequency doubled to 285 nm. The detector is a microchannel plate photomultiplier (Hamamatsu R 1564U). The emission was observed through a 360 nm interference filter, using magic angle polarizer conditions. The data are collected using a dedicated Mint 11/23 computer, then transferred to a Dee 11/73 for analysis. For all analyses the uncertainties in the phase (δ∅) and the modulation (δm) measurements were taken as 0.2° and 0.005, respectively. Analysis of the data in terms of a sum of exponentials was performed as described previously [13]. Anisotropy decays were determined from the phase angle difference and the relative modulation of the polarized components of the emission [14].
4. Results
The emission spectra of TMA (donor alone) and TUD (D-A pair) are shown in fig. 1. The emission spectrum of TMA is characteristic of indole and/or tryptophan. The emission of TUD shows emission from both the donor (340 nm) and from the acceptor (510 nm). The emission from the donor is quenched about ninefold due to energy transfer. Energy transfer is also evident from the enhanced emission of the acceptor relative to the acceptor alone, DUA in fig. 1. In principle, energy transfer can be qualified by measurements of either quenching of the donor or enhanced emission of the acceptor. In practice, it is preferable to use the donor emission because all the emission is the result of directly absorbed incident light. In contrast, the emission from the acceptor is due to both direct excitation and to energy transfer from the donor. This use of the donor emission is particularly valuable for time-resolved studies for which one cannot simply add and subtract the total intensities. We isolated the emission from the donor using an interference filter centered at 360 nm.
Fig. 1.

Emission spectra of TMA (donor), TUD (donoracceptor), and DUA (acceptor) in propylene glycol at 20°C. The dashed line near 360 nm is the donor emission as observed through a 360 nm interference filter. All spectra are for excitation at 285 nm.
The frequency response of the donor emission at 20°C is shown in fig. 2. In the absence of energy transfer (TMA) the emission is a single exponential, as is seen by the good match between the data (●, left) and the best single-exponential fit. The intensity decay of the D-A pair is considerably more complex, as is seen from our inability to tit the data (○) to a single-exponential decay, and by the elevated value of = 1494. The data for TUD could not be tit using a double-exponential model . A triple-exponential model did result in an adequate fit (, table 1). Similar results were obtained at – 5 and 5°C (table 1). It should be noted that the decay is expected to remain a single exponential if there were a unique conformation and a single D-A distance (eq. (2)). The heterogeneity of the decays is thus evidence for a range of D-A distances.
Fig. 2.

Frequency response of the donor (360 nm) emission without (●) and with (○) the covalently attached acceptor, 20°C. The solid lines show the best single-exponential fits to the data.
Table 1.
Multi-exponential analysis of the donor decay of TMA and TUD
| Compound | T (°C) | τi (ns) | αi | fi | |
|---|---|---|---|---|---|
| TMA | −5 | 7.509 | 1.0 | 1.0 | 2.0 |
| 5 | 7.266 | 1.0 | 1.0 | 2.2 | |
| 20 | 6.788 | 1.0 | 1.0 | 1.9 | |
| TPA | 5 | 7.512 | 1.0 | 1.0 | 1.8 |
| 20 | 6.892 | 1.0 | 1.0 | 1.0 | |
| TUD | −5 | 1.079 | 1.0 | 1.0 | 1434.3 |
| −5 | 0.316 | 0.700 | 0.244 | ||
| 2.275 | 0.300 | 0.576 | 36.1 | ||
| −5 | 0.232 | 0.600 | 0.158 | ||
| 1.381 | 0.342 | 0.536 | |||
| 4.632 | 0.058 | 0.306 | 2.2 | ||
| TUD | 5 | 1.044 | 1.0 | 1.0 | 1270.4 |
| 5 | 0.314 | 0.734 | 0.284 | ||
| 2.184 | 0.266 | 0.716 | 28.4 | ||
| 5 | 0.266 | 0.650 | 0.190 | ||
| 1.418 | 0.311 | 0.572 | |||
| 4.758 | 0.039 | 0.238 | 1.8 | ||
| TUD | 20 | 0.879 | 1.0 | 1.0 | 1494.4 |
| 20 | 0.245 | 0.711 | 0.245 | ||
| 1.862 | 0.289 | 0.755 | 37.3 | ||
| 20 | 0.196 | 0.64 | 0.179 | ||
| 1.316 | 0.332 | 0.621 | |||
| 5.293 | 0.027 | 0.200 | 1.1 |
The data were then analyzed using eqs. (9) and (10) which allow for a Gaussian distribution of D-A distances (fig. 3). This model results in a good fit to the data, with values near 5 (table 2). While these values are not as low as for the triple-exponential fits (table 1, to 2)) this model has only two floating parameters ( and σ), whereas the triple-exponential model contains five adjustable parameters (three τ1, and two α1). Also, it is unlikely that the D-A distribution is described precisely by any of these models because the linker is not infinitely long [15]. It is not possible to fit the data to a narrow range of distances. For instance, if the fwhm is held fixed at 2Å then the data cannot be lit using eqs. (9) and (10), resulting in (- - -, fig. 3). Similar elevations in were found at the other temperatures when the fwhm of the distribution were held fixed at 2 Å (table 2).
Fig. 3.

Distance distribution analysis of 360 nm emission from TUD, 5°C. The solid line shows the best fit to the data using the decay law of the TMA (table 1) and a Gaussian distance dtstribution with R= 11.8 Å and fwhm = 14.8 Å. Also shown is the best Iit when the fwhm is fixed at 2 Å (– – –).
Table 2.
Distance distribution analysis of the donor decay of TUD, versus TMA
| T (°C) | a) | fwhm (Å) | |
|---|---|---|---|
| −5 | 12.4 (± 0.6) | 15.5 (± 0.8) | 3.9 |
| 19.1 (± 0.6) | 〈2〉b) | 1263.4 | |
| 5 | 11.8 (± 0.6) | 14.8 (± 0.6) | 4.5 |
| 18.9 (± 0.5) | 〈2〉 | 1110.1 | |
| 20 | 11.8 (± 0.9) | 14.6 (± 0.9) | 8.9 |
| 18.4 (± 0.6) | 〈2〉 | 1308.5 |
n = 0 in eq. (10).
The angular brackets indicate the fwhm was held fixed at the indicated value.
The distance distribution were recovered at severa1 temperatures, and using multipliers of r0, r1 and r2 in eq. (10). At this time it is not clear which multiplier is correct, as r2 is appropriate for an infinite flexible chain [15], whereas lower powers of r are probably appropriate for shorter chains. The range of distance distributions recovered with these various models, for the three temperatures, are shown in fig. 4. The recovered D-A distributions were similar at each temperature, and for each model (r0, r1 or r2). These results indicate that the D-A distance distribution is broad, and only limited variations in the distribution are consistent with the data.
As a final conformation of the results the entire experiment was repeated, using the donor (TPA) and a D-A pair (TUD) from a second synthesis. The average distances and fwhm were found to be in precise agreement with that found for the first series of experiments (table 3).
Table 3.
Distance distribution analysis of the donor decay of TUD, versus TPA
| T (°C) | a) | fwhm (Å) | |
|---|---|---|---|
| 5 | 12.0 (± 0.3) | 14.9 (± 0.3) | 3.4 |
| 20 | 11.9 (± 0.2) | 14.9 (± 0.3) | 2.4 |
It is known that the rate and extent of energy transfer depends upon the orientation factor k2 (eq. (7)). We believe it is unlikely that k2 is very different from the random value of 2/3 for the flexible D-A pair described in this report. Nonetheless, one could postulate a dependence of k2 on the D-A distance, which in turn would distort the apparent P(r) values from the true values. It is known that the effects of orientation are decreased by angular motions between the D-A pair [16]. Hence, we examined the anisotropy decays of the donor at several temperatures. At these temperatures the mean correlation times vary from 9.7 to 1.7 ns (table 4). Nonetheless, the distance distributions are independent of temperatures (table 2). Hence, it appears that the orientation effects, if present, do not significantly alter the recovered distribution of D-A distances.
Table 4.
Anisotropy decays of the indole emission from TUD
Excitation at 295.5 nm.
Excitation at 295 nm.
5. Discussion
The ability to recover a distribution of distances has numerous potential applications in biochemical research. For example, small peptides and proteins can exist in several conformations, whose relative populations are determined by the peptide backbone, structures of the side chains, and the rotational potential function. Determination of the end-to-end distributions for such peptides can be used for comparison of the experimental distributions with calulations based on theoretical models for the conformational potential functions. This technique can also be used to determine whether two sites on a protein are indeed at a single distance, or whether there exist a range of distances due to either multiple conformations or structural fluctuations around a mean distance.
As currently formulated, our theory and algorithms are only appropriate for the situation in which there is a single acceptor for each donor. However, there are many conceivable systems where multiple acceptors are possible. These cases include lipids in cell membranes and ion distributions around polyelectrolytes. Following the development of additional software it should therefore be possible to detect the clustering of lipids or proteins in membranes and the ion clouds around DNA or RNA.
Acknowledgement
Supported by grant GM-35154 from the National Institutes of Health, with support for instrumentation from the National Science Foundation (DMB- 8511065 and DMB-8502835).
References
- [1].Stryer L, Ann. Rev. Biochem 47 (1978) 819. [DOI] [PubMed] [Google Scholar]
- [2].Steinberg IZ, Ann. Rev. Biochem 40 (1971) 83. [DOI] [PubMed] [Google Scholar]
- [3].Grinvald A, Haas E and Steinberg IZ, Proc. Natl. Acad. Sci. US 69 (1972) 2273. [DOI] [PMC free article] [PubMed] [Google Scholar]
- [4].Haas E, Wilchek M, Katchalski-Katzir E and Steinberg IZ, Proc. Natl. Acad. Sci. US 72 (1975) 1807. [DOI] [PMC free article] [PubMed] [Google Scholar]
- [5].Fung BKK and Stryer L, Biochemistry 17 (1978) 5241. [DOI] [PubMed] [Google Scholar]
- [6].Förster Th., Ann. Phys. (Leipzig) 2 (1948)55. [Google Scholar]
- [7].Dale RE, Eisinger J and Blumberg WE, Biophys. J 26 (1979) 161. [DOI] [PMC free article] [PubMed] [Google Scholar]
- [8].Haas E, Katchalski-Katzir E and Steinberg IZ, Biochemistry 17 (1978) 5064. [DOI] [PubMed] [Google Scholar]
- [9].Johnson ML, Biophys. J 44 (1983) 101. [DOI] [PMC free article] [PubMed] [Google Scholar]
- [10].Johnson ML and Frasier SG, Methods Enzymology 117 (1986) 301. [Google Scholar]
- [11].Chen RF, Anal. Letters 1 (1967) 35. [Google Scholar]
- [12].Lakowicz JR, Laczko G and Gryczynski I, Rev. Sci. Instr 57 (1986) 2429. [Google Scholar]
- [13].Lakowicz JR, Gratton E, Laczko G, Cherek H and Linkemann M, Biophys. J 46 (1984) 463. [DOI] [PMC free article] [PubMed] [Google Scholar]
- [14].Lakowicz JR, Laczko G and Gryczynski I, Biochemistry 26 (1987) 82. [DOI] [PMC free article] [PubMed] [Google Scholar]
- [15].Flory P, Stattstical mechanics of chain molecules (Interscience, New York, 1969). [Google Scholar]
- [16].Dale RE and Eisinger J, in: Biochemical fluorescence concepts, eds. Chen RF and Edelhoch H (Dekker, New York: ) ch. 4, pp. 115–284. [Google Scholar]