

Abstract
Protein synthesis and autophagy are regulated by cellular ATP content. We tested the hypothesis that mitochondrial dysfunction, including generation of reactive oxygen species (ROS), contributes to impaired protein synthesis and increased proteolysis resulting in tissue atrophy in a comprehensive array of models. In myotubes treated with ethanol, using unbiased approaches, we identified defects in mitochondrial electron transport chain components, endogenous antioxidants, and enzymes regulating the tricarboxylic acid (TCA) cycle. Using high sensitivity respirometry, we observed impaired cellular respiration, decreased function of complexes I, II, and IV, and a reduction in oxidative phosphorylation in ethanol-treated myotubes and muscle from ethanol-fed mice. These perturbations resulted in lower skeletal muscle ATP content and redox ratio (NAD+/NADH). Ethanol also caused a leak of electrons, primarily from complex III, with generation of mitochondrial ROS and reverse electron transport. Oxidant stress with lipid peroxidation (thiobarbituric acid reactive substances) and protein oxidation (carbonylated proteins) were increased in myotubes and skeletal muscle from mice and humans with alcoholic liver disease. Ethanol also impaired succinate oxidation in the TCA cycle with decreased metabolic intermediates. MitoTEMPO, a mitochondrial specific antioxidant, reversed ethanol-induced mitochondrial perturbations (including reduced oxygen consumption, generation of ROS and oxidative stress), increased TCA cycle intermediates, and reversed impaired protein synthesis and the sarcopenic phenotype. We show that ethanol causes skeletal muscle mitochondrial dysfunction, decreased protein synthesis, and increased autophagy, and that these perturbations are reversed by targeting mitochondrial ROS.
Keywords: Ethanol, mitochondria, skeletal muscle, oxidative stress, ATP
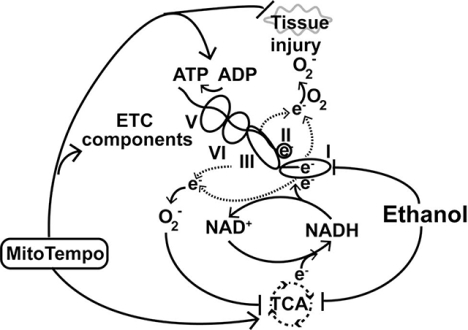
Graphical Abstract
Overall schema of ethanol-induced mitochondrial function in skeletal muscle. Ethanol impairs ETC function with leak of electrons to generate superoxide (O2−) that causes oxidative injury to tissue and decreases TCA cycle intermediates.
Introduction
Skeletal muscle mass is maintained by a balance between protein synthesis and proteolysis, both of which are regulated by cellular ATP content and perturbed by oxidative stress. Mitochondria play a central role in substrate oxidation and ATP generation for energy-requiring cellular functions. The tricarboxylic acid (TCA) cycle in the mitochondrial matrix is the primary pathway for generating reducing equivalents during substrate oxidation in aerobes. Electrons from substrate oxidation generate reduced pyridine nucleotides (NADH and FADH2) that transfer the electrons to an oxygen molecule via redox components in the electron transport chain (ETC) located in the inner mitochondrial membrane[1, 2]. Even though transfer of electrons through the ETC is generally efficient, there is some leakage of electrons into the mitochondrial matrix that react with oxygen to generate reactive oxygen species (ROS) that are physiologically removed by the mitochondrial manganese-dependent enzymes dismutase and catalase[3]. Mitochondrial dysfunction results in decreased oxygen consumption, impaired ATP synthesis, and increased electron leak with generation of ROS. If the antioxidant capacity of the mitochondria is exceeded, oxidative stress damages cellular components[4, 5]. Tissue specific mitochondrial responses to stresses have been identified and impact both ATP production and generation of ROS[6–8]. Due to the high ATP/GTP demand of mRNA translation, protein synthesis is decreased during states of ATP depletion[9–11]. Additionally, during conditions with low cellular ATP and/or increased ROS, autophagy is increased. The combination of decreased protein synthesis and increased autophagy results in tissue atrophy[12–14].
Ethanol causes loss of skeletal muscle mass or secondary sarcopenia, a term that is distinct from primary sarcopenia that refers to the aging related muscle loss[15]. Ethanol induced secondary sarcopenia is due to both decreased protein synthesis and increased autophagy in skeletal muscle [16–20]. Since cellular energy content (ATP, GTP levels) is critical for protein synthesis and regulates autophagy[21, 22], impaired ATP synthesis is a potential mechanism for perturbations in the balance between protein synthesis and proteolysis in response to ethanol exposure. In contrast to consistent reports of ethanol-induced hepatic mitochondrial dysfunction[23, 24], the data in skeletal muscle are inconsistent[23–26]. Mitochondria isolated from the gastrocnemius-plantaris muscle of rats fed ethanol showed a reduction in oxygen consumption and reduced cytochrome content[26]. In contrast, others have reported no perturbations in oxygen consumption, cytochrome content, and activity of respiratory chain complexes in isolated mitochondria from skeletal muscle of rats fed ethanol[27] The same investigators performed studies in isolated mitochondria from skeletal muscle of heavy drinking human subjects with alcoholic myopathy and reported no significant differences in oxidative phosphorylation and response to different substrates compared to controls[25]. Maximum oxygen consumption rate was lower in non-permeabilized myoblasts (mitochondria in situ) from macaque monkeys treated with a chronic ethanol binge compared with controls[28]. These data were consistent with studies on hindquarter muscle slices and isolated skeletal muscle mitochondria from rats fed ethanol compared to controls that showed decreased oxygen consumption with and without substrates[29]. There also are conflicting data on human skeletal muscle ATP synthesis and content in response to ethanol exposure. A lower rate of ATP synthesis was reported in human subjects with alcoholic cirrhosis compared to controls[30] while others reported similar muscle ATP content between humans drinking ethanol and controls[31]. Data on skeletal muscle oxidative stress and antioxidants in the tissue and circulation in response to ethanol also are not consistent[6, 32, 33]. An acute intragastric ethanol administration in mice caused skeletal muscle mitochondrial DNA depletion by oxidative degradation of the mitochondrial genome[24]. Inconsistent changes in muscle malondialdehyde concentration and protein carbonylation in response to ethanol feeding in rats have been reported[34–37]. Heterogeneity in responses of isolated mitochondria and mitochondria in situ in intact or permeabilized cells/tissue may potentially reconcile these conflicting reports. We therefore hypothesized that ethanol-induced mitochondrial dysfunction results in reduced cellular ATP content and consequent perturbations in protein synthesis, autophagy, and loss of muscle mass. We performed complementary studies in a comprehensive array of models to test this hypothesis and determine if previously reported differences in skeletal muscle response to ethanol were context dependent.
Recent approaches to comprehensively evaluate components of the ETC without isolating mitochondria allow for the determination of specific defects in mitochondrial function and components of the ETC in situ, thereby greatly enhancing the physiological relevance of such observations[38]. We dissected the effect of ethanol treatment on mitochondrial oxidative function in differentiated murine myotubes and muscle from ethanol-fed mice in response to different substrates and inhibitors of components of the ETC, as reported earlier[2, 39–41]. We show that ethanol impairs complex IV function, lowers mitochondrial oxygen consumption, reduces ATP content, increases electron leak from Complex III (generating ROS and consequent oxidative modifications), and lowers TCA cycle intermediates. Robust responses to MitoTEMPO, a mitochondrial targeted antioxidant, shows the mechanistic basis of ROS as a mediator of mitochondrial dysfunction and subsequent changes in protein synthesis and autophagy. These data lay the foundation for mitochondrial targeted antioxidants as a potential therapy for ethanol-induced tissue injury.
Results
Ethanol treatment causes mitochondrial and metabolic perturbations
To obtain insight into the mechanisms of ethanol-induced perturbations in mitochondrial function, we performed an unbiased analysis of mRNA transcripts that were most upregulated and those that were most downregulated in myotubes in response to ethanol treatment (Fig. 1, A,B, supplementary tables 1,2). Of the differentially expressed genes unique to either 6 h or 24 h ethanol treatment of myotubes, there were 627 genes regulating mitochondrial function including metabolic pathways (Fig. 1, C, supplementary table 3). Focused evaluation of the transcriptome analysis on mitochondrial metabolic pathways showed that glycolysis and oxidative degradation of ethanol were decreased while those responsible for superoxide degradation were increased (Fig. 1, D, supplementary table 4). Altered expression of genes regulating mitochondrial function were noted with 6 h and 24 h of ethanol treatment compared with untreated controls (Fig. 1, E, supplementary table 5). A heat map and Venn diagram of the proteome in myotubes treated with ethanol for different time points showed significant differences from untreated controls (Fig. 1, F,G, supplementary tables 6,7). In the proteome, of the top canonical metabolic pathways altered by ethanol treatment, components of oxidative phosphorylation and TCA cycle components were decreased while those in the glycolytic pathway were modestly increased (Fig. 1, H,I supplementary tables 8,9). A comparison analysis (overall summary) of the top canonical pathways expressed in the transcriptome and the proteome from myotubes showed that EIF2 signaling and the TCA cycle pathways are activated in the transcriptome and inhibited in the proteome (Fig.1, J, supplementary table 10A). A correlation analysis between RNA sequencing and proteomics of the mitochondrial oxidative phosphorylation genes (Supplementary Table 10B) showed that the RNA expression at 6h correlated highly with the RNA expression at 24h (r=0.986;p<0.000). The 6 h RNA expression correlated with the proteomics data at 6h but the correlation was less (r=0.440; p<0.05). The 6 h RNA sequencing log ratios did not correlate with the 24 h proteomics expression log ratios (r-value −0.19 and p=0.37). The 24 h RNA sequencing expression log ratio also did not correlate with any of the proteomics expression log ratios (Supplementary Table 10B).
Figure 1. Perturbations in transcriptomics and proteomics in ethanol-treated differentiated C2C12 myotubes.

A. Heat map of transcriptome from untreated (UnT) differentiated myotubes with those treated with 100 mM ethanol (E) for 6 h and 24 h. B. Venn diagram showing differentially expressed genes (DEG) in the transcriptome at 6 h and 24 h of 100mM E treatment compared to UnT myotubes. C. Heat map of transcripts of genes regulating mitochondrial function in UnT and 100 mM E for 6 h and 24 h treated myotubes based on Mouse MitoCarta 2.0 (Broad Institute). D. Ingenuity Pathway Knowledge base® analysis of the transcriptome for the selected pathways in UnT myotubes and those treated with 100mM E for 6 and 24 h. E. Ingenuity Pathway Knowledge base® analysis of differentially expressed genes on the transcriptome that are involved in mitochondrial function in UnT myotubes compared with those treated with 100 mM E for 6 h and 24 h. F. Heat map of the proteome in UnT differentiated C2C12 myotubes compared with those treated with 100 mM E for 3 h, 6 h and 24 h. Two separate maps are shown to avoid batch effects. G. Venn diagram showing unique and overlapping differentially expressed genes (DEG) in the proteome at 3 h, 6 h, and 24 h of 100 mM E treatment compared to untreated myotubes. H. Ingenuity Pathway Knowledge base® analysis of the proteome for the most enriched canonical metabolic and signaling pathways in UnT myotubes compared with those treated with 100 mM E for 3, 6 and 24 h. I. Differentially expressed proteins in select metabolic pathways in the Ingenuity Pathway Knowledge base® from myotubes treated with 100 mM E for 6 h. J. Ingenuity Pathway Knowledge base® analysis comparing the most enriched canonical metabolic and signaling pathways in the translatome and proteome and the activation state of the pathway in UnT and ethanol-treated myotubes for the time points shown. K. Perturbations in components of oxidative phosphorylation in the proteome from UnT myotubes compared to those treated with 100 mM E for 6 h. All data from at least 3 biological replicates from differentiated C2C12 myotubes.
Analysis of the mitochondrial oxidation pathway in the proteome showed significant reduction in the expression of ETC components (Fig. 1, K, supplementary table 11). These data provide evidence that ethanol causes transcriptional perturbations in mitochondrial gene expression with changes in the proteome of the oxidative and metabolic pathways. We then dissected the functional consequences of these alterations in mitochondrial function pathways on the transcriptome and proteome in ethanol-treated myotubes and in skeletal muscle from ethanol-fed mice.
Ethanol impairs intact cell respiration in myotubes
Oxygen consumption in non-permeabilized, differentiated myotubes treated with 100 mM ethanol for 6 h was lower than that of untreated myotubes (Fig 2, A,B). Inhibiting ATP synthase (complex V) with oligomycin showed lower ATP-linked respiration (oxidative phosphorylation) in ethanol-treated compared to untreated intact myotubes (Fig 2, A,B). Response to FCCP, a protonophore that uncouples oxidation from phosphorylation and leads to maximum respiration, was lower with ethanol treatment (Fig 2, A,B). Reserve respiratory capacity, a critical component of mitochondrial oxidation that can be utilized during states of increased ATP demand also was reduced by ethanol in intact myotubes (Fig 2, A,B). An increasing proton gradient across the inner mitochondrial membrane with continued transfer of electrons down the electronegative gradient across complexes I,III, and IV contributes to the proton leak back into the matrix. Proton leak, measured as the oxygen consumption when phosphorylation is inhibited using oligomycin, was unaltered by ethanol in non-permeabilized myotubes (Fig 2, A,B). That there is a reduction in maximum and ATP-linked respiration shows that ethanol perturbs oxidative phosphorylation and impairs the ability to increase oxidation during states of ATP demand (Fig 2, B). These data show that skeletal muscle mitochondrial function with endogenous substrates was decreased by ethanol.
Figure 2. Ethanol impairs mitochondrial respiration in differentiated C2C12 myotubes and mouse skeletal muscle tissue.

A. Representative tracings of high-resolution respirometry to quantify intact cell respiration of differentiated C2C12 myotubes. After initial stabilization, ATP synthetase inhibitor, oligomycin (O) was added at 1 μg/ml final concentration, and oxygen consumption quantified to determine the oligomycin-sensitive and -insensitive respiration. Protonophore (H+ ionophore) and uncoupler of oxidative phosphorylation, FCCP (U) at 0.5 μM increments to achieve maximum respiration was then added to quantify maximum respiratory capacity. This was followed by rotenone (R) 375 nM final concentration, to inhibit complex I of the ETC, and then 2.5 μM antimycin A (Aa), which inhibits complex III, was added to determine the non-mitochondrial respiration. B. In intact, non-permeabilized myotubes in basal DMEM medium, 100 mM E exposure for 6 h impairs basal cell respiration, ATP-linked respiration, maximum respiratory capacity (Max. R) from the response to FCCP, reserve respiratory (RR) capacity and oligomycin-sensitive oxygen consumption that reflects oxidative phosphorylation. N=6; *P <0.05; **P <0.01; ***P <0.01. S−1*Mill−1: Seconds−1.million cells for oxygen flow rate−1. C. Representative tracings of high-resolution respirometry to quantify respiration of permeabilized differentiated C2C12 myotubes. After initial stabilization, 2 mM malate (M) and 2.5 mM pyruvate (P) were added. This was followed by 4.1 μM digitonin (D) to permeabilize the cell membrane without losing the integrity of cells or mitochondria for permitting entry of mitochondrial substrates inside the cells; 2.5 mM ADP (D); 10 mM glutamate (G); 10 mM succinate (S); 2 μM increments of FCCP (U) for measuring maximum respiration; 375 nM rotenone (R); 125 nM antimycin A (Aa); 2 mM ascorbate and 2 mM TMPD (tetamethyl p-phenylene diamine) (AT) to test complex IV activity; 50 mM sodium azide (Az) to inhibit complex IV activity. D. Mitochondrial membrane integrity in permeabilized myotubes expressed by quantification of cytochrome c oxidase in the medium expressed at percentage of control, non-permeabilized cells. E. Oxygen consumption measured in intact non-permeabilized myotubes in mitochondrial respiration buffer followed by digitonin permeabilization and ETC complex specific substrates and inhibitors sequentially in the concentrations as stated above. Proton leak, oxidative phosphorylation (OXPHOS) in response to M, P, D, G and S, and Max. R and RR capacity (response to U) were quantified. Rotenone-sensitive and -insensitive respiration followed by complex IV function were measured. F. Mitochondrial oxygen consumption in permeabilized gastrocnemius muscle white fibers from ethanol fed (EF) and pair-fed (PF) mice in response to substrates and inhibitors of components of the ETC in the concentrations stated above. Saponin 50 μg/ml. was used for permeabilization of fibers. G. Fatty acid oxidation (FAO) was measured using palmitoylcarnitine as substrate was unaffected by ethanol exposure in myotubes. Histograms showing the rate of respiration in UnT and 100 mM ethanol-treated C2C12 myotubes for 6 h in the presence of 10 μM palmitoyl carnitine followed by digitonin permeabilization and addition of 2.5 mM ADP. All data expressed as mean±SD from at least 5 biological replicates for experiments in UnT and 6 h 100mM ethanol-treated myotubes and gastrocnemius muscle from at least 4 mice in EF and PF mice each group *P <0.05; **P <0.01; ***P <0.001 compared to respective controls. A ADP; Glutamate; M malate; P pyruvate; S succinate. C complexes in the ETC; E ethanol-treated myotubes; Max R maximum respiration; RR capacity reserve respiratory capacity; Rot. Rotenone; UnT untreated myotubes.
Ethanol impairs responses to substrates, uncoupler and inhibitors in muscle mitochondria in situ
To dissect the mechanism of impaired mitochondrial oxygen consumption and to identify the specific step(s) at which mitochondrial respiration is impaired, we performed the standard substrate, uncoupler, inhibitor titration protocol [41] in permeabilized myotubes treated with and without ethanol (Fig. 2, C,E) and in permeabilized gastrocnemius muscle fibers from EF and PF mice (Fig 2, F). To ensure that permeabilization did not alter mitochondrial integrity, we quantified cytochrome c oxidase in the medium in response to digitonin (for myotubes) and compared them to the medium from non-permeabilized cells and found that the mitochondria were intact (Fig 2, D). Consistent with cellular respiration in myotubes maintained in differentiation medium, intact cell respiration was significantly lower in ethanol-treated myotubes than in untreated controls cells. Oxygen consumption in response to complex I substrates (malate, pyruvate, and glutamate) was significantly lower in ethanol-treated myotubes. Response to succinate, a substrate for complex II, also was lower in permeabilized ethanol-treated myotubes (Fig. 2, E) and muscle (Fig. 2, F). Similar to the observations in intact myotubes, maximum respiratory capacity measured in response to titration of the uncoupler, FCCP, was reduced in permeabilized ethanol-treated myotubes (Fig. 2, E). Response to complex I inhibitor, rotenone, and complex III inhibitor, antimycin A, showed that rotenone-sensitive oxygen consumption and rotenone-insensitive oxygen consumption were lower in ethanol-treated myotubes (Fig 2, G). Ethanol also impaired complex IV function measured as azide-sensitive oxidation of TMPD (an electron donor to cytochrome c) that in turn transfers the electron to oxygen to form water (Fig 2, C,E). Consistent with our observations in the myotubes, we observed that gastrocnemius muscle from EF mice had significantly impaired responses to substrates and uncoupler (FCCP) compared to those from PF mice (Fig. 2, F). Thus, our data show that complexes I, II and IV are inhibited by ethanol.
When permeabilized myotubes were provided fatty acid, palmitic acid (as palmitoylcarnitine) as a substrate, there was no difference in oxygen consumption in myotubes treated with and without ethanol (Fig. 2, E). These data show that the ethanol-induced impaired respiration was not compensated for by an increase in fatty acid oxidation. More importantly, because during fatty acid oxidation by acyl-CoA dehydrogenase, electrons are transferred via the electron transferring flavoprotein complex to ubiquinol (Coenzyme Q), bypassing complexes I and II, our observation that fatty acid oxidation during ethanol exposure is unaltered shows that complex IV function is limiting during ethanol treatment. Using duroquinol (DHQ), which transfers electrons directly to complex III, we noted that ethanol did not impair complex III function (108.5±18.1 % of control; p=0.4). This was further corroborated by our observations that DHQ, a reduced analog of coenzyme Q and complex III substrate under oxidative phosphorylation (malate, palmitoylcarnitine and ADP) also showed no difference in untreated and ethanol-treated myotubes (273.8±78.4 vs. 273.0±78.6 pmol.s-1.106 cells; NS). Thus, our data in skeletal muscle mitochondria in situ show that ethanol impairs the function of complexes I,II and IV.
Ethanol impairs ATP generation and alters redox ratio in myotubes and skeletal muscle tissue
Impaired electron transport in the face of continued oxidation of substrates results in an accumulation of reduced pyridine (NADH) thereby altering the cellular redox (NAD+/NADH) ratio, as seen in ethanol-treated myotubes (Fig. 3, A). Consistent with the ethanol-induced defects in ETC complexes, total ATP content in the muscle from EF mice and ethanol-treated myotubes was significantly lower than that in PF mice (Fig 3, B) and in untreated myotubes (Fig. 3, C). These data were consistent with our previous report that ATP content in skeletal muscle from human patients with alcoholic cirrhosis was significantly lower compared with controls[39]. These decreases in mitochondrial function were not accompanied by changes in mitochondrial content (as reflected by the expression of matrix enzyme, citrate synthase, and outer membrane protein, VDAC, in myotubes (Fig. 3, D) or murine skeletal muscle (Fig 3, E) or in citrate synthase activity in ethanol-treated or control myotubes (Fig 3, F) or muscle from mice (Fig. 3, G).
Figure 3. Ethanol reduced muscle redox ratio and ATP content in myotubes and muscle tissue.

A. Ratio of NAD+/NADH in myotubes during ethanol exposure at different time points. B. Total ATP content in murine C2C12 myotubes treated with 100mM ethanol for 6 hours. C. ATP content in gastrocnemius muscle from EF mice compared to that from PF mice. D. Representative immunoblots and densitometry of citrate synthase (CS) and voltage dependent anion channel (VDAC) in UnT and ethanol-treated myotubes. E. Representative immunoblots and densitometry of CS and VDAC in gastrocnemius muscle of PF and EF mice. F. CS activity in UnT and myotubes treated with 6 h 100 mM E. G. CS activity in gastrocnemius muscle from EF and PF mice. All data expressed as mean±SD from at least 3 biological replicates for experiments in UnT and 6 h 100 mM E myotubes and at least 4 mice in EF and PF mice in each group *P <0.05; **P <0.01; ***P <0.001 compared to respective controls.
Ethanol causes electron leak and ROS in myotubes
To determine if the defect in electron transport resulted in leak of electrons, and the specific location of the electron leak in the transport chain, we quantified the generation of hydrogen peroxide as a measure of ROS production in response to substrates and inhibitors (Fig. 4, A,B). Generation of ROS was significantly higher (p<0.001) in ethanol-treated compared to untreated, control myotubes (Fig. 4, A). Blocking complex I with rotenone resulted in an increase in electron leak and ROS generation in untreated myotubes (p=0.05) but caused a reduction in ROS generation in ethanol-treated myotubes (p<0.001) suggesting that ethanol promotes reverse electron transport (RET) flow from complex II to complex I. Dimethyl malonate, a complex II inhibitor, did not alter ROS generation in untreated myotubes, but blocking complex II resulted in a significant reduction in ROS in ethanol-treated myotubes (p<0.01). Consistent with forward electron transport in untreated myotubes, simultaneous blocking of complexes I and II did not result in a greater reduction in the ROS generation compared to that achieved by blocking complex I alone (Fig. 4, B). In ethanol-treated myotubes, however, blocking complexes I and II resulted in significant reduction (p<0.001) in ROS, consistent with RET (Fig. 4, B). Blocking complex III with antimycin A significantly increased ROS generation (p<0.001) in both untreated and ethanol-treated myotubes (Fig. 4, A) and is consistent with previous data published by us[1, 39]. The robust increase in hydrogen peroxide with antimycin A and its reversal with rotenone showed that the major site of the electron leak that generates ROS is complex III (Fig. 4, A,B). Using a combination of inhibitors, we noted that blocking complex III (with antimycin A) and complex II (dimethyl malonate), ethanol induced a significant increase in ROS generation supporting our interpretation of RET during ethanol exposure (Fig. 4, B).
Figure 4. Impaired electron flow through complex I and increases electron leak from complex III in ethanol-treated differentiated C2C12 myotubes.

A. Ethanol-induced generation of hydrogen peroxide measured using the amplex red fluorescence assay in differentiated C2C12 myotubes. Blocking complex III with Antimycin A (AMA) had the greatest effect on hydrogen peroxide production. Blocking complex I with rotenone (Rot.), nearly completely reversed ethanol-induced electron flow down the electrochemical gradient. B. Hydrogen peroxide generated in myotubes in the presence of blockers of a combination of complexes of the ETC (to determine the specific source of the superoxide generated in the ETC in the mitochondria) also showed that the principal source of electron leak occurs at complex III. The electron flow was mainly through complex I, because inhibition of either complex II or III increased the electron leak whereas inhibition of complex I reduces the leak. C. Representative immunofluorescence images of C2C12 myotubes stained with tetramethylrhodamine ethyl ester (TMRE, Molecular Probes). D. Flow cytometry gated TMRE fluorescence of untreated and 1 h and 6 h 100mM ethanol-treated C2C12 myotubes showed progressive reduction in inner membrane potential. UnT untreated; 100mM ethanol-treated for stated times. All data expressed as mean±SD. *P < 0.05; **P < 0.01; ***P < 0.001 compared to UnT. aP < 0.05, bP < 0.01, and cP < 0.001 compared to ethanol-treated (E) group. AMA antimycin A; DM dimethyl malonate; Rot-rotenone.
Maintenance of the proton gradient across the inner mitochondrial membrane requires electron flow down the complexes coupled to proton pumping. Importantly, the generation of a proton gradient is necessary for ATP synthesis[42]. Therefore, it would be expected that inhibiting electron flow or the leak of electrons would reduce the proton pumping and gradient. Consistently, ethanol treatment caused a reduction in mitochondrial membrane potential across the inner membrane (Fig. 4. C,D) because complex I, the major site of electron entry, is inhibited by ethanol thereby limiting the proton efflux across the complexes.
Leak of electrons and consequent perturbation in redox status and ROS generation was evaluated by flow cytometry. DCFDA was used to measure the redox status of the cell (oxidized state) and mitochondrial ROS was determined using MitoSox in myotubes. Ethanol exposure resulted in significantly higher ROS generation in ethanol exposed myotubes (Fig. 5, A,B). MitoTEMPO, which specifically targets mitochondrial ROS, reduced ethanol-induced ROS generation in myotubes as quantified by MitoSox (Fig. 5, B) suggesting that mitochondria were a dominant source of ethanol-induced ROS in myotubes. Reduction in mitochondrial ROS with MitoTEMPO resulted in restoration of ATP synthesis measured by respirometry (Fig. 5, C) and cellular ATP content (Fig. 5, D).
Figure 5. Ethanol alters redox status and generates mitochondrial ROS in C2C12 myotubes that is reversed by MitoTEMPO.

A. Flow cytometry gated DCFDA fluorescence and percentage of DCFDA fluorescent cells in differentiated C2C12 myotubes UnT or with 100 mM E for 6 h, with and without 25 nM MitoTEMPO (MT), a mitochondrial antioxidant. B. Flow cytometry derived fluorescence and percentage of cells stained by MitoSOX in response to 100 mM E for 6 h with and without 25 nM MT. C. Oxygen consumption in intact non-permeabilized myotubes in response to 100 mM E with and without MT. D. Whole cell ATP content in myotubes treated with 100 mM E for 6 h with and without 25nM MT. All experiments were done in at least 3 biological triplicates. UnT untreated myotubes, E 100mM ethanol; MT MitoTEMPO; Mean±SD. *P <0.05; **P <0.01; ***P <0.001.
Impaired muscle adaptive responses to ethanol-induced ROS
Mitochondrial dysfunction, electron leak and consequent generation of ROS induce an adaptive increase in expression of antioxidants. Our data on transcriptomics and proteomics showed a modest increase in superoxide detoxification components including glutathione redox reactions and biosynthesis (Fig. 1, D,E,H,I,J, supplementary tables 4,5,8,9,10). Of these antioxidants, we quantified the expression of a mitochondrial specific antioxidant, manganese-dependent superoxide dismutase (MnSOD). As expected, MnSOD expression was increased in response to ethanol (Fig. 6, A). Nonetheless, in ethanol-treated myotubes and skeletal muscle from ethanol-fed mice and human patients with alcoholic cirrhosis, oxidative modifications were increased, as noted by the greater expression of carbonylated protein. (Fig. 6, B–D). Consistently, thiobarbituric acid reactive substances (TBARS), a measure of lipid peroxidation, was increased in ethanol-treated myotubes and muscle from EF mice (Fig. 6, E,F) and decreased in response to MitoTEMPO in ethanol-treated myotubes (Fig. 6, E). These data show that the adaptive antioxidant response was not adequate to overcome the ethanol-induced mitochondrial ROS in skeletal muscle.
Figure 6. Oxidative modification of protein and lipids during ethanol exposure in myotubes and skeletal muscle tissue.

A. Representative immunoblots and densitometry of manganese dependent superoxide dismutase (MnSOD), a mitochondrial specific antioxidant, in myotubes UnT and with 100 mM E for 6 h and gastrocnemius muscles of EF and PF mice. B-D. Representative immunoblots and densitometry for carbonylated (Carbo) proteins in UnT and E treated myotubes (B), Gastrocnemius muscle from PF and EF mice (C) and human patients with alcoholic cirrhosis and controls (D). E,F. Quantification of lipid peroxidation product, thiobarbituric acid reactive substances (TBARS) in 100 mM E or UnT differentiated C2C12 myotubes with and without mitochondrial antioxidant, MT (25 nM) (E) and in gastrocnemius muscle from PF and EF mice (F). All cellular experiments in at least 3 biological replicates, all mouse experiments in at least 4 mice in each group. All data expressed at mean±SD. *P <0.05; **P <0.01; ***P <0.001.
Alteration in TCA cycle intermediates in myotubes and in muscle tissue with ethanol exposure
Our proteomics data showed perturbations in expression of pyruvate dehydrogenase, α-ketoglutarate dehydrogenase and succinate dehydrogenase in response to ethanol treatment in myotubes (Fig, 1, I,K, supplementary Tables 9,11). To experimentally confirm these data that were consistent with our observations of decreased oxygen consumption and ATP generation (Fig. 2), we quantified the cellular and tissue concentrations of pyruvate, an oxidative substrate for the TCA cycle as well as the intermediates in the pathway. Cellular concentrations of pyruvate as well as all TCA cycle intermediates except succinate were significantly lower in ethanol-treated compared to untreated myotubes and these perturbations were reversed by MitoTEMPO (Fig. 7, A). Similar to the observations in ethanol-treated myotubes, skeletal muscle from ethanol-fed mice had lower concentrations of pyruvate, α-ketoglutarate (αKG) and succinate compared to those in pair-fed mice (Fig. 7, B). We also noted that ethanol-induced changes in metabolite concentrations in myotubes were reversed by mitochondrial antioxidant, MitoTEMPO (Fig. 7, A).
Figure 7. Ethanol exposure decreased metabolites in myotubes and skeletal muscle.

A. Pyruvate and TCA cycle intermediates in differentiated myotubes that were either UnT or treated with 100 mM E, with or without 25 nM MT for 6 hours compared to controls. B. Pyruvate and TCA cycle intermediates in gastrocnemius muscle from PF and EF mice. All data expressed as mean±SD from at least 6 biological replicates for experiments in myotubes and at least 4 mice in each group. *P <0.05; **P <0.01; ***P <0.001 compared to respective controls.
Ethanol-induced sarcopenic phenotype was reversed by MitoTEMPO
We then determined the mechanistic link between ethanol treatment and a sarcopenic phenotype in myotubes, that consisted of myotube diameter, protein synthesis and autophagy markers, as described by us[20]. Ethanol treatment resulted in a decrease in myotube diameter that was partially reversed by MitoTEMPO (Fig. 8, A,B). Treatment of our cellular system with cytosine arabinoside to deplete myoblasts followed by measurement of protein synthesis showed that ethanol-induced reduction in protein synthesis reported previously[14, 20] and in the current studies were due to the effects on myotubes (Fig. 8, C). Consistent with our observations on myotube diameter, myotube protein synthesis was restored by MitoTEMPO (Fig. 8, D). We also noted that autophagy flux was increased in ethanol treated myotubes compared to untreated controls (Fig. 8, E). MitoTEMPO also reversed the ethanol-induced increase in autophagy markers.
Figure 8. Reversal of ethanol-induced sarcopenic phenotype with restoration of mitochondrial ATP synthesis in differentiated C2C12 myotubes.

A, B. Representative photomicrographs (A) and diameter (B) of C2C12 myotubes that were UnT or treated with 100 mM E with and without 25 nM MT. C. Representative immunoblots and densitometry of puromycin incorporation in C2C12 myotubes that were UnT or E with or without 20μM cytosine arabinoside (AraC) for 24h. D. Representative immunoblots and densitometry of puromycin incorporation in C2C12 myotubes that were UnT or E with or without 25 nM MT. E. Representative immunoblots and densitometry of autophagy markers, LC3 lipidation and Beclin1 in murine C2C12 myotubes either UnT or with 100 mM E and 100 μM chloroquine (CQ) to quantify autophagy flux. F. Representative immunoblots and densitometry of LC3 lipidation and Beclin 1 expression in murine C2C12 myotubes treated with 100 mM E for 6 h with and without 25 nM MT. All experiments in at least 3 biological replicates. Diameter of at least 100 myotubes for each group were quantified. All data expressed as mean±SD. *P <0.05; **P <0.01; ***P <0.001.
Discussion
Using a combination of untargeted approaches including transcriptomics and proteomics, we show that ethanol causes skeletal muscle mitochondrial dysfunction with altered expression of components of oxidative phosphorylation and mitochondrial substrate metabolic pathways. Our observation that the expression log ratios determined on RNA sequencing for the genes that were differentially expressed at 6 h correlated significantly with those at 24 h suggests that the effects of ethanol on genes involved in oxidative phosphorylation occur early and persist over time. These observations can explain the mitochondrial functional defects in oxidative phosphorylation in response to ethanol both in vitro in myotubes as well as in vivo in skeletal muscle from ethanol-treated mice compared to controls. Interestingly, the proteomics data correlated with the RNA sequencing data for oxidative phosphorylation genes only at 6 h but not at 24 h. The proteomics data for oxidative phosphorylation genes expressed at 6 h and 24 h also did not show a significant correlation. These data could be due to differences in transcriptional responses, RNA stability, translational differences, or protein half-lives. The mechanistic basis of these observations that show a discord between the transcriptome and proteome needs to be evaluated as part of future studies.
In our targeted experiments we noted that ethanol impairs the function of components of the ETC, decreases oxidative phosphorylation, and reduces the maximum respiratory capacity in skeletal muscle. Ethanol caused RET from complex II to I and a leak of electrons primarily from complex III with generation of ROS. Despite an increase in mitochondrial antioxidant, manganese superoxide dismutase, oxidative stress, with post-translational modification of both proteins and lipids, was increased in response to ethanol. In addition to these functional perturbations, cellular concentrations of pyruvate and that of critical tricarboxylic acid intermediate a-ketoglutarate were decreased, protein synthesis was impaired, and autophagy and consequent sarcopenic phenotype were increased in response to ethanol. Generation of ethanol-induced ROS and oxidative stress were mitigated by the mitochondrial specific scavenger, MitoTEMPO. Ethanol-induced perturbations in metabolites, protein synthesis, and autophagy markers also were partially reversed by MitoTEMPO.
Ethanol oxidation occurs in mitochondria and non-mitochondrial compartments to generate NADH and FADH2 which transfer electrons down the ETC to regenerate NAD+ and drive ATP synthesis[43]. The rate of substrate oxidation can be limited by either the transfer of reducing equivalents into the mitochondria (since mitochondria are not permeable to NADH) or the capacity of the ETC to oxidize these reducing equivalents[43]. Consistent with our proteomics data, we observed that ethanol impaired complex IV and upstream complex I. Since inhibition of complex IV will result in impaired electron transport in upstream complexes, the relative contributions of inhibition of each of these complexes on the dysregulated oxidative phosphorylation and electron leak and whether ethanol inhibits the assembly of super complexes (using blue native electrophoresis) need to be determined in future.
Despite the defects in mitochondrial substrate oxidation, our proteomics data show that the expression of genes regulating fatty acid oxidation are decreased in the initial 6 h of ethanol exposure and increase subsequently. In contrast, our functional oxygen consumption studies show that fatty acid oxidation was unaltered in 6 h ethanol-treated myotubes. These data are consistent with previous reports that proteomics and transcriptome data do not necessarily translate into immediate functional consequences[38]. Despite impaired oxidation of glucose derived substrates, there was no adaptive increase in fatty acid oxidation. These data also show that ethanol induces an impairment in complex I upstream of complex IV, because during the initial step of β-oxidation of fatty acids, an FADH2 is generated and electrons are transferred to the electron transfer flavoprotein (ETFP) on the inner mitochondrial membrane[44]. Electrons are transferred to ubiquinone on the ETC via the electron transfer flavoprotein: ubiquinone oxidoreductase (ETF:QO). This step bypasses complex I, accounting for the unimpaired oxygen consumption for fatty acid oxidation during ethanol exposure. Since a functioning ETC is required for ATP synthesis, ethanol induced impairment in ATP-linked respiration and components of the ETC resulted in decreased ATP content in myotubes treated with ethanol. Consistently, ATP content in skeletal muscle from ethanol-fed mice also was decreased.
An intact ETC is required for sequential transfer of electrons down the electrochemical gradient for coupling oxidation with phosphorylation with ATP synthesis[42, 45]. Transport of electrons results in a small physiological leak of electrons and consequent generation of ROS[4]. However, during pathological states, excessive leak of electrons can result in generation of large quantities of ROS with oxidative modification of cellular components. ROS in response to ethanol are generated in both mitochondria and non-mitochondrial sites in hepatocytes, but whether ethanol exposure generates ROS in skeletal muscle and, if so, the site of the generation are not well known[46]. We show that in response to ethanol exposure, skeletal muscle mitochondria are the major source of generation of electron leak. These data are similar to those reported in glial cells in response to ethanol treatment where mitochondria are the major source of ROS generation[47].
To determine the sites of electron leak in the ETC, we used individual (and combinations of) inhibitors for specific components and identified that complex III was the primary site of electron leak and that ethanol promoted RET from complex II to complex I. We did not use substrates for different complexes because such an approach would need permeabilization of the myotubes which would limit the ability to precisely identify the site of ROS generation. Using rotenone, a complex I inhibitor, we showed that electron transfer occurred principally via complex I in both untreated and ethanol-treated myotubes. These data are consistent with previous reports that mitochondrial electron leak occurs primarily at complex III while the electron transfer occurs principally via complex I[1, 2, 39]. The combination of rotenone, dimethyl malonate, and antimycin A showed that in the control, untreated myotubes, there was forward electron flow while ethanol treatment resulted in RET with leak occurring at both complexes III and I. The exact mechanism(s) of impairment in these complexes needs to be determined because it is possible that ethanol, either directly or upon oxidization in the muscle [20], may cause modifications of specific subcomponents of these complexes. To determine if ROS generated during ethanol metabolism are mechanistically linked to the mitochondrial respiration and functional disturbances, we used MitoTEMPO that scavenges mitochondria derived ROS and consequent oxidative stress[48]. Our data that MitoTEMPO can reverse ethanol-induced functional perturbations in protein synthesis and autophagy are consistent with reports by others that increased ROS can impair muscle protein synthesis and increase autophagy and muscle loss[49–51]. Only partial restoration of reduced myotube diameter and the sarcopenic phenotype by MitoTEMPO suggest that mechanisms other than mitochondrial ROS may contribute to ethanol-induced skeletal muscle responses and are consistent with reports by others and us[20, 52, 53]. Antioxidants have been reported to have limited benefit in ethanol-induced muscle loss[16, 54]. Our observations suggest that mitochondrial targeted therapies may be effective in restoring ethanol-induced signaling perturbations by partially reducing mitochondrial ROS and allowing for maintenance of physiological functions[55, 56]. Beneficial responses to targeting mitochondrial ROS lay the foundation for therapeutic use of mitochondrial ROS scavengers to reverse ethanol-induced skeletal muscle mitochondrial dysfunction and skeletal muscle loss.
In addition to the perturbations in the ETC, we also observed reductions in all the TCA cycle intermediates except succinate, whose concentrations were unaltered. In contrast, in the muscle from ethanol-fed mice, only pyruvate and αKG were reduced in response to ethanol. The lack of reduction in succinate can be explained by ethanol-induced impairment in succinate dehydrogenase as noted in the proteomics data, a greater flux from αKG. The observed differences between our studies in vitro in myotubes and in skeletal muscle from ethanol-fed mice could be explained by differences in responses between mitochondria in situ in myotubes and those in muscle tissue as well as the diversity of fiber type and their metabolic function. Whether the reduction in the metabolic intermediates is an adaptive response to decreased electron transport and oxidative function or due to accelerated cataplerosis without compensatory anaplerosis needs to be explored. Our studies provide a rationale for the use of anaplerotic substrates aimed to restore mitochondrial function in response to ethanol. However, it is not known if supplementation with anaplerotic substrates including cell permeable esters of αKG will aggravate the redox changes and electron leak with resultant worsened mitochondrial function.
We recognize potential limitations of our studies including the known constraints of current approaches to measure protein synthesis and that of static autophagy markers[57–59]. Even though the puromycin-incorporation method to quantify protein synthesis has been used extensively[20, 60, 61], recognized limitations include capturing proteins that are most abundant, have the fastest synthesis rate, and measure only proteins that are within the range of the gel[58, 59]. Our strategy of using the same approach in all the treatment groups, and previous publications validating the use of puromycin-incorporation to quantify protein synthesis in myotubes[60, 61] as well as our previous report of using radiolabeled amino acid incorporation that also showed reduced protein synthesis in ethanol treated skeletal muscle[14], we believe that this method is a reproducible method for measuring protein synthesis. Also, blocking myoblast fusion with cytosine arabinoside as suggested by others to remove proliferating myoblasts[62, 63] did not alter our observations and supports our interpretation that ethanol decreases protein synthesis in myotubes. We have previously reported that ethanol increases skeletal muscle autophagy flux in myotubes and skeletal muscle in mice[14]. In the present studies, we did not quantify autophagy flux in vivo in ethanol-fed mouse muscle but noted that autophagy flux in myotubes was increased in response to ethanol treatment. The proteasome is another major proteolytic pathway in skeletal muscle, we did not study proteasomal degradation pathways in the present studies because we and others have previously reported that proteasome activity is either unaltered or decreased in response to ethanol in skeletal muscle[14, 64].
We conclude that ethanol causes skeletal muscle mitochondrial dysfunction with reduced ATP content by direct effects on components of the ETC and impaired oxidative phosphorylation (graphical abstract). Oxidative stress with modification of proteins and lipids contribute to dysregulated protein homeostasis with a sarcopenic phenotype. Therapeutic strategies targeting electron leak in mitochondria, therefore, have the potential for clinical translation and restoring muscle loss from alcohol abuse and alcoholic liver disease.
Experimental Procedures
Materials
All chemicals were obtained from Sigma Aldrich (St. Louis, MO) unless specified.
In vitro culture studies
C2C12 murine myoblasts (ATCC; CRL 1772) were grown to confluence in proliferation medium, Dulbecco’s modified Eagle’s medium (DMEM), containing 10% fetal bovine serum followed by differentiation in DMEM with 2% horse serum for 48 h as previously described[13]. Myotubes were then exposed to 100 mM of ethanol for different time points for the unbiased approaches and 6 h for metabolic and functional studies. We and others have used this concentration in a number of cell types including skeletal myotubes to elicit the metabolic and functional perturbations in response to ethanol ingestion in vivo[14, 65–69]. Ethanol-treated and control cells were harvested at the same time points. Cell lysates and protein extraction were carried out using protocols standard in our laboratory[13]. For mitochondrial antioxidant response, myotubes were treated with 25 nM MitoTEMPO 30 min prior to ethanol exposure. All cellular experiments were performed in at least 3 biological replicates.
Animal studies
All procedures using mice were approved by the Cleveland Clinic Institutional Animal Care and Use Committee. Female C57BL/6 mice (Jackson Laboratory) at 8–10 wk. age were allowed free access to a Lieber DeCarli liquid diet (Dyets Inc, 710260) containing ethanol (n=6) or isocalorically substituted maltodextrins (n=4). Animals were housed in the biological resource unit with a 12 h light/day cycle. After adjusting to the control liquid diet for 2d, the ethanol-fed group was given a liquid diet with 1% ethanol (5.5% total calories) for 2 d, 6% ethanol (32% total calories) for 2 d as described earlier[70]. At the time of euthanasia, mice were anesthetized and gastrocnemius muscle harvested, weighed and part of the tissue was flash frozen in liquid nitrogen and stored at −80°C for subsequent assays. Fresh gastrocnemius muscle (6–8 mg each) was used for mitochondrial respiration assays.
Human studies
Human studies were done in the vastus lateralis muscle from patients with alcoholic cirrhosis and control subjects after obtaining a written informed consent in accordance with the Helsinki protocol. The institutional review board at the Cleveland Clinic approved these studies (IRB #10–840). The clinical details of these subjects have been previously published and the reduction in ATP content in skeletal muscle from alcoholic cirrhosis have been reported previously[39, 71].
RNA sequencing
Total RNA was extracted as previously and quality evaluated using an Agilent 2100 bioanalyzer, RNA seq libraries generated, sequenced and bioinformatics analyses done by Novogene Inc. (Chula Vista, CA) using their standard pipeline for mouse transcriptome studies using theTopHat2 as a mapping tool as previously described by us[61]. Gene expression was quantified by HTseq v0.6.1 to count the number of reads mapped to each gene, and the number of read counts normalized by conversion to FPKB (Fragments per kilobase of transcript per million mapped reads). Differential expression analysis of gene expression of the groups (3 biological replicates per group) was done using the DESeq 2 R package (1.18.0) using a model based on binomial distribution. Statistical tests were done with the Wald chi square test and the resulting p values were adjusted using the Benjamini and Hochberg approach for false discovery rate. The reference genome for mouse, GRCm38, was released by the Genome Reference Consortium in 2012 based on the Mus musculus strain C57BL/6J. All sequencing files have been uploaded to SRA (SUB5885941).
The readouts from the RNA sequencing analyses were uploaded into Qiagen’s IPA system® for core analysis to classify differentially expressed genes in the signaling and metabolic pathways as previously described. Heatmaps and canonical pathway overlays were generated to demonstrate the expression patterns of the differentially expressed genes as previously described by us[61].
Proteomics studies
Untreated and 100 mM ethanol-treated myotubes were processed for unbiased proteomics on a Thermo Scientific Fusion Lumos mass spectrometry system (Thermo Scientific, San Jose, CA) as previously described. Quantifications were performed with the label-free quantitation method available in the MaxQuant program. The data were uploaded on the Qiagen IPA system for core analysis for signaling and metabolic pathways knowledge database and heatmap and canonical pathway overlays were generated as previously described[61]. To determine the relation between transcriptomics and proteomics, a Pearson’s correlation analysis of the expression data was performed for each time point. The RNA expression data were generated from the log ratios calculated using FPKM normalized data.
Mitochondrial respiration using high resolution respirometry
We determined cellular respiration using high resolution as previously described by us using the substrate, uncoupler, inhibitor, titration (SUIT) protocols[2, 39–41]. Respiration in intact cells to quantify oxygen consumption in response to ethanol treatment was then followed by permeabilization using digitonin at concentrations that allow for evaluation of respiration in response to substrates.
Intact cell respiration
C2C12 myotubes differentiated for 48 h as described above in 10 cm2 plates were treated with 100 mM ethanol for 6 h, trypsinized, washed in phosphate buffered saline, centrifuged at 800 g for 2 min, and resuspended (750,000 cells/ml) in DMEM with 2% horse serum. Cell viability determined by trypan blue exclusion was consistently over 90% in all experiments. Intact cell respiration was measured in cells suspended in differentiation medium as previously described[2, 39–41]. ATP synthesis was quantified by decrease in oxygen consumption in response to oligomycin (1 μg/ml) from baseline, and residual oxygen consumption during oligomycin inhibition was a measure of proton leak[72, 73]. Maximum respiratory capacity (uncoupled respiration) was measured in response to the protonophore, carbonyl cyanide-4-(trifluoromethoxy) phenylhydrazone (FCCP), used in 0.5 μM increments to maximum oxygen consumption. Respiration was inhibited with 0.5 μM rotenone and 2.5 μM Antimycin A, an inhibitor of cytochrome C reductase to quantify non-mitochondrial/residual oxygen consumption. Non-mitochondrial oxygen consumption is due to autooxidation and cellular oxygen consuming enzymes like oxidases and peroxidases. Since intact cell respiration provides limited information on the specific defects in the ETC, we then quantified responses to substrates and inhibitors of the different ETC complexes in permeabilized myotubes. All data were expressed as oxygen consumption in pmol.sec−1.106 cells−1 to allow for comparisons across experiments in myotubes as described by us earlier[39].
Mitochondrial OXPHOS in permeabilized myotubes
Standard substrate, uncoupler, inhibitor titration (SUIT) protocols as described earlier were used to quantify mitochondrial function in permeabilized myotubes[2, 40, 41]. Differentiated C2C12 myotubes were permeabilized by digitonin, maintained in mitochondrial respiration medium, MiR05 followed by addition of mitochondrial substrates malate and pyruvate that generate NADH, a substrate for complex I. To maintain continued oxidation of pyruvate to acetyl CoA via pyruvate dehydrogenase, malate was added simultaneously as a source of oxaloacetate to metabolize acetyl CoA to citrate. If malate dependent oxaloacetate is not generated, acetyl CoA accumulation will inhibit pyruvate dehydrogenation and limited response to ADP supplementation that determines if oxidation is coupled to phosphorylation. Malate, pyruvate and glutamate were provided as complex I substrates followed by succinate as a complex II substrate to quantity oxidative phosphorylation capacity that reflects the capacity of oxidation (electron transport down the gradient along the ETC) and ATP synthesis[74, 75]. Leak respiration was measured in the presence of pyruvate and malate without the adenine nucleotides and oxidative phosphorylation was quantified in response to ADP administration.
Oxidative phosphorylation maintains the proton gradient across the inner mitochondrial membrane by coupling of electron transport (oxidation) to phosphorylation. Electron input from both complexes I and II provides greater oxygen consumption than either alone in the presence of saturating concentrations of ADP. Respiration in response to saturating concentrations of complex I and complex II substrates and ADP is due to convergence of electrons on coenzyme Q and a measure of a complete and intact electron transport system[41].
To quantify phosphorylation restriction of the ETC, oxidation and phosphorylation were uncoupled using a protonophore, FCCP, to measure the maximum oxidation capacity or maximum respiration. The uninhibited flow of electrons across the ETC is a measure of maximum mitochondrial membrane potential. The uncoupled complex I rate of oxygen consumption (the rotenone-sensitive rate) is determined by the absolute decrease from the maximum uncoupling rate of all substrates. The rotenone-insensitive rate is the uncoupled complex II rate of oxygen consumption. The antimycin A-insensitive rate is non-mitochondrial residual oxygen consumption rate. The uncoupled complex IV oxidation rate is calculated by subtracting the azide-insensitive rate from the tetramethyl phenylene diamine (TMPD) + ascorbate rate. Since cytochrome C oxidase (complex IV) was inhibited by ethanol treatment, exogenous cytochrome was not added in these protocols because this would mask the endogenous defect. Fatty acid oxidation was measured by quantifying oxygen consumption in response to 10 sM palmitoyl carnitine and 2 mM malate supplementation in ethanol-treated and untreated control cells. To assess the complex III function, 10 μM palmitoyl carnitine and 2 mM malate were added followed by digitonin to permeabilize the myotubes and then 2.5 mM ADP was added. Subsequently, 75 μM rotenone was added to block complex I function and a reduced analogue of co-enzyme Q, 0.5 mM duroquinol, a complex III substrate was added and oxygen consumption measured to determine complex III function under conditions of oxidative-phosphorylation as described earlier[2].
Oxygen consumption rates were calculated by recording oxygen concentration and flow rates recorded at 2 sec intervals using the software DatLab2 software, Oroboros (Innsbruck, Austria) as previously described by us [2, 39] and others[40, 41]. To compare mitochondrial respiration under in response to different substrates and inhibitors, oxygen consumption was corrected for residual oxygen consumption. All experiments were performed in at least 4 biological replicates after calibration of the oxygen sensors and instrument background corrections. All data were expressed as oxygen consumption in pmol.sec−1.106 cells−1 to allow for comparisons across experiments in myotubes.
Mitochondrial respiration in permeabilized muscle tissue
The gastrocnemius muscle was rapidly placed in ice cold biopsy buffer solution (CaK2EGTA 2.77 mM, K2EGTA 7.23 mM, dithiothreitol 0.5 mM, 20 mM imidazole, taurine 20 mM, 2-N-morpholino ethane sulfonic acid hydrate 50 mM, MgCl2.6H2O 6.56 mM, sodium ATP 5.77 mM, and sodium phosphocreatine 15 mM, free calcium 0.1 μM, free magnesium 1 mM, and Mg ATP 5 mM) at pH 7.1[40, 41]. Muscle samples were gently dissected with fine tipped forceps and fiber separation confirmed on a microscope. Chemical permeabilization was performed by incubation in 2ml. biopsy buffer with 10μg.ml−1 saponin for 20 min. at 4°C followed by washing in miRO5 buffer (EGTA 0.5 mM, MgCl2.6H2O 3 mM, potassium lactobionate 60 mM, taurine 20 mM, KH2PO4 10 mM, HEPES 20 mM, sucrose 110 mM, bovine serum albumin 1g/L, pH 7.1) for 10 min at 4°C[40, 41]. Respiration was measured at 37°C on a high sensitivity fluororespirometer (Oroboros, Innsbruck, Austria) using a substrate, inhibitor titration protocol. Respiration rates (oxygen flux) were expressed per milligram of dry weight of muscle tissue.
Mitochondrial integrity
Mitochondrial membrane integrity after permeabilization of myotubes with digitonin and muscle fibers from mice with saponin was determined using the cytochrome c oxidase assay kit (Sigma Aldrich, St Louis, MO) to quantify the cytochrome c oxidase in the medium in which the cells are grown as described by us earlier[76].
Quantification of metabolites
Metabolic intermediates in the TCA cycle were quantified in ethanol-treated and untreated myotubes and gastrocnemius muscle from PF and EF mice as previously described by us[39]. In brief, cells were lysed using ice cold lysis buffer, and the metabolites were extracted using cold ethyl acetate, labeled internal standard was added, dried under nitrogen stream, derivatized using TBDMS and run on an Agilent gas chromatography-mass spectrometry under electron ionization. Standards for each metabolite-citrate, α-ketoglutarate, succinate, fumarate, and malate were quantified[39]. Metabolites were quantified in frozen muscle tissue from PF and EF mice using a similar extraction and derivatization protocol.
Immunoblot analysis
Cellular protein was extracted using methods previously described by us[13]. In brief, protein was extracted from 48 h differentiated C2C12 myotubes either untreated or treated with 100 mM ethanol for 6 h using RIPA buffer. After quantifying the concentration, protein samples were denatured and run on a 4–12% gradient gel. Following electrophoresis, the proteins were electro transferred onto PVDF membranes (Bio-Rad, Hercules, CA, USA) and incubated with 1:1000MnSOD antibody (Cell Signaling Technologies, Danvers, MA, USA) and mitochondrial content was quantified by immunoblots for citrate synthase (matrix enzyme) and voltage dependent anion channel (VDAC) in myotubes and skeletal muscle using the protocol described above with citrate synthase antibody (Protein tech Inc., Rosemont, IL, USA) at 1:2000 dilution and VDAC antibody (Cell Signaling, at 1:2000 dilution) and appropriate secondary antibody (1:10,000 dilution). Membranes were then washed in Tris-buffered saline with Tween 20 (TBST) followed by incubation with appropriate secondary antibodies. Immunoreactivity was detected using a chemiluminescent HRP substrate (Millipore, Billerica, MA, USA) and densitometry performed using the Image J program.
Thiobarbituric acid reactive substances (TBARS)
Lipid peroxidation was quantified by measuring thiobarbituric acid reactive substances (TBARS) that were quantified by a fluorometric assay as previously described[39]. In brief, 50 μg of protein was added to 10 μl of 10% sodium dodecyl sulfate and 100 μl of a color reagent (0.53% thiobarbituric acid in acetic acid in sodium hydroxide), boiled for 30 min followed by incubation at room temperature for 10 min. Fluorescence was measured with an excitation wavelength of 530 nM and an emission wavelength of 550 nM. The concentrations of TBARS were determined from standard curves.
Carbonylated proteins
Protein carbonylation is an oxidative stress induced post translational modification that can be detected by derivatization of the carbonyl group to 2,4 dinitrophenyl (DNP). Carbonylated proteins were detected by immunoblot assay using a primary antibody specific to the DNP as previously described[39].
Citrate synthase activity
The rate of citrate synthase activity was quantified as previously described[77, 78]. In brief, 5 μg of cell lysate or tissue protein was incubated with 120 μl of 100 mM Tris Buffer, 20 μl of 2mM acetyl CoA and 20 μl of 2.5 mM 5,5’ dithio-bis-2-nitrobenzoic acid (DTNB). Background readings were obtained at 37°C for 5 min at 412 nm. Following this, 20 μl of 2mM oxaloacetic acid was added to each well and OD measured at 412 nm for 30 min. Activity in ethanol-treated cells or muscle from EF mice was expressed relative to that in untreated cells /muscle tissue from PF controls.
ROS and inner mitochondrial membrane potential
Cellular redox status (oxidized state) was determined using the cell permeable fluorescent dye, chloromethyl, 2,7, dichlorodihydrofluorescein diacetate (CM-H2DCFDA) as described by us earlier[39]. In brief, differentiated C2C12 myotubes were treated with 100 mM ethanol or equal volume of medium for 6 h and 10 μM CM-H2DCFDA (Invitrogen, Carlsbad, CA, USA) for 30 min at 37°C prior to trypsinization and flow cytometry analysis (LSRII from BD Biosciences). Analysis was done using the FlowJo software (FlowJo, LLC, Ashland, OR, USA). Mitochondrial ROS was quantified using mitochondrial targeted fluorescent dye, MitoSOX and flow cytometry as previously described[39]. Inner membrane potential was determined by mitochondria specific dye tetramethylrhodamine methyl ester (Molecular Probes). Briefly, C2C12 myotubes or primary myoblasts were harvested and incubated with TMRM (25 nM) for 30 min at 37 °C and analyzed by flow cytometry as above. Immunofluorescence staining was also done for TMRM with a confocal microscope (Leica systems).
Hydrogen peroxide production
The rate of hydrogen peroxide (H2O2) production was quantified using the oxidation of the fluorogenic indicator amplex red in the presence of horseradish peroxidase (HRP) using an Amplex Red Hydrogen Peroxide/Peroxidase assay kit (Life Technologies) as previously described by us[1, 39]. In brief, differentiated C2C12 myotubes that were not treated or treated with 100 mM ethanol for 6 h, washed with Krebs-Ringer phosphate (KRP) buffer, 50 μM of amplex red reagent and 0.1 U ml−1 HRP in KRP buffer added to the cells, incubated for 30 min at 37°C and fluorescence was measured (emission 590 nm; excitation 485 nm) using a Perkin Elmer VICTOR3 (Perkin Elmer, Waltham, MA, USA) multi label reader.
ATP contents and NAD+/NADH ratio measurement
Total cellular ATP content in the gastrocnemius muscle from PF or EF mouse skeletal muscle and either untreated or ethanol-treated C2C12 myotubes was quantified using a bioluminescence assay with a commercial kit (Molecular Probes, Eugene, OR, USA) as previously described[39].
Cellular NAD+, NADH and their ratio were measured using NAD+/NADH luciferase assay kit (Promega, Madison, WI, USA) in differentiated C2C12 myotubes untreated or treated with 100 mM ethanol as previously described by us[39].
Sarcopenic phenotype
Even though the term sarcopenia has been traditionally used to refer to muscle loss of aging, increasingly the term is now used to refer to skeletal muscle atrophy/loss in chronic diseases[15]. We have previously described a sarcopenic phenotype in an in vitro myotube culture model[20, 79]. Myotube diameter was quantified as previously described as a measure of myotube size in response to interventions[79, 80]. Puromycin incorporation was used a readout for protein synthesis, using methods previously described by us[80]. In brief, ethanol-treated or untreated control myotubes were incubated with 1 μM puromycin for 30 min. followed by immunoblotting with antipuromycin antibody (1:10,000 dilution). Densitometry of all the bands in each lane across the entire molecular weight range of puromycin-incorporated proteins (20–250 Kd) were quantified and normalized to total protein loading by Ponceau stain. For these studies, after differentiation for 48h, myotubes were treated with 20μM cytosine arabinoside (Sigma-Aldrich, St Louis, MO) for 24 h with 6 h ethanol treatment showed that ethanol-induced decreased protein synthesis was not the result of its effect on proliferating cells (Fig. 8, C) and was consistent with our previous report that our protocol results in complete differentiation of myoblasts to myotubes measured by creatine kinase activity and fusion index[39]. Autophagy was measured by methods previously described[14]. Lipidation of LC3 and expression of Beclin1 were determined by immunoblots in myotubes treated with and without 100 mM ethanol for 6 h. 100 μM chloroquin was added to block lysosomal function to quantify autophagy flux in myotubes. Subsequently, response of autophagy markers to 25 nM MitoTEMPO treatment in myotubes treated with and without 100 mM ethanol was also quantified. Densitometries of the blots were performed as described earlier. All experiments were done in at least 3 biological replicates.
Statistical Analyses
All cellular experimental data were generated from at least three biologically independent experiments. Animal data were obtained from 4 animals in each group. Data were expressed as mean ±standard error of the mean, and means were compared using analysis of variance with Bonferroni post hoc analyses for quantitative data that were normally distributed and the Kruskal-Wallis test for skewed data. Differences were considered statistically significant at a p value <0.05.
Supplementary Material
Highlights.
Unbiased approaches showed that ethanol altered muscle mitochondrial regulatory proteins.
Mitochondrial functional studies in situ showed defects in electron transport chain components.
Ethanol increased mitochondrial ROS and oxidative stress in myotubes, human and mouse muscle.
Tricarboxylic acid cycle intermediates were reduced by ethanol in muscle and myotubes.
MitoTempo reversed ethanol induced perturbations in myotubes.
Acknowledgments
NIH RO1 GM119174 (Dasarathy); P50 AA024333 (Nagy, Dasarathy); R21 AR 71046 (Davuluri, Dasarathy); UO1 AA0026976 (Dasarathy); UO1 DK 061732 (Dasarathy); RO1 DK113196 (Dasarathy). Mikati foundation grant (Dasarathy, Davuluri)
Supported in part by: NIH R21 AA022742; RO1 DK 113196; RO1 GM119174; P50 AA024333; UO1 AA021890, UO1 AA026975; UO1 DK061732 and the Mikati Foundation Grant support to SD and GD.
The abbreviations used are
- EF
ethanol-fed
- PF
pair-fed
- TCA
tricarboxylic acid
- ROS
reactive oxygen species
- FCCP
carbonyl cyanide-4-(tri fluoromethoxy) phenylhydrazone
- VDAC
voltage dependent anion channel
- TBST
Tris-buffered saline with Tween 20
- TMPD
tetramethyl phenylene diamine
- DTNB
5,5’ dithio-bis-2-nitrobenzoic acid
- KRP
Krebs-Ringer phosphate
Footnotes
Conflict of interest: The authors declare that they have no conflicts of interest with the contents of this article except for the grant support from the National Institutes of Health.
Publisher's Disclaimer: This is a PDF file of an unedited manuscript that has been accepted for publication. As a service to our customers we are providing this early version of the manuscript. The manuscript will undergo copyediting, typesetting, and review of the resulting proof before it is published in its final form. Please note that during the production process errors may be discovered which could affect the content, and all legal disclaimers that apply to the journal pertain.
REFERENCES
- [1].Chen Q, Vazquez EJ, Moghaddas S, Hoppel CL, Lesnefsky EJ, Production of reactive oxygen species by mitochondria: central role of complex III, J Biol Chem 278(38) (2003) 36027–31. [DOI] [PubMed] [Google Scholar]
- [2].Ye F, Hoppel CL, Measuring oxidative phosphorylation in human skin fibroblasts, Anal Biochem 437(1) (2013) 52–8. [DOI] [PubMed] [Google Scholar]
- [3].Murphy MP, How mitochondria produce reactive oxygen species, Biochem J 417(1) (2009) 1–13. [DOI] [PMC free article] [PubMed] [Google Scholar]
- [4].Turrens JF, Mitochondrial formation of reactive oxygen species, J Physiol 552(Pt 2) (2003) 335–44. [DOI] [PMC free article] [PubMed] [Google Scholar]
- [5].Zorov DB, Juhaszova M, Sollott SJ, Mitochondrial reactive oxygen species (ROS) and ROS-induced ROS release, Physiol Rev 94(3) (2014) 909–50. [DOI] [PMC free article] [PubMed] [Google Scholar]
- [6].Fernandez-Vizarra E, Enriquez JA, Perez-Martos A, Montoya J, Fernandez-Silva P, Tissue-specific differences in mitochondrial activity and biogenesis, Mitochondrion 11(1) (2011) 207–13. [DOI] [PubMed] [Google Scholar]
- [7].Forner F, Foster LJ, Campanaro S, Valle G, Mann M, Quantitative proteomic comparison of rat mitochondria from muscle, heart, and liver, Mol Cell Proteomics 5(4) (2006) 608–19. [DOI] [PubMed] [Google Scholar]
- [8].Boirie Y, Short KR, Ahlman B, Charlton M, Nair KS, Tissue-specific regulation of mitochondrial and cytoplasmic protein synthesis rates by insulin, Diabetes 50(12) (2001) 26528. [DOI] [PubMed] [Google Scholar]
- [9].Aoyagi Y, Tasaki I, Okumura J, Muramatsu T, Energy cost of whole-body protein synthesis measured in vivo in chicks, Comp Biochem Physiol A Comp Physiol 91(4) (1988) 7658. [DOI] [PubMed] [Google Scholar]
- [10].Jewett MC, Miller ML, Chen Y, Swartz JR, Continued protein synthesis at low [ATP] and [GTP] enables cell adaptation during energy limitation, J Bacteriol 191(3) (2009) 1083–91. [DOI] [PMC free article] [PubMed] [Google Scholar]
- [11].McLeod LE, Proud CG, ATP depletion increases phosphorylation of elongation factor eEF2 in adult cardiomyocytes independently of inhibition of mTOR signalling, FEBS Lett 531(3) (2002) 448–52. [DOI] [PubMed] [Google Scholar]
- [12].Azad MB, Chen Y, Gibson SB, Regulation of autophagy by reactive oxygen species (ROS): implications for cancer progression and treatment, Antioxid Redox Signal 11 (4) (2009) 777–90. [DOI] [PubMed] [Google Scholar]
- [13].Qiu J, Tsien C, Thapalaya S, Narayanan A, Weihl CC, Ching JK, Eghtesad B, Singh K, Fu X, Dubyak G, McDonald C, Almasan A, Hazen SL, Naga Prasad SV, Dasarathy S, Hyperammonemia-mediated autophagy in skeletal muscle contributes to sarcopenia of cirrhosis, Am J Physiol Endocrinol Metab 303(8) (2012) E983–93. [DOI] [PMC free article] [PubMed] [Google Scholar]
- [14].Thapaliya S, Runkana A, McMullen MR, Nagy LE, McDonald C, Naga Prasad SV, Dasarathy S, Alcohol-induced autophagy contributes to loss in skeletal muscle mass, Autophagy 10(4) (2014) 677–90. [DOI] [PMC free article] [PubMed] [Google Scholar]
- [15].Cruz-Jentoft AJ, Bahat G, Bauer J, Boirie Y, Bruyere O, Cederholm T, Cooper C, Landi F, Rolland Y, Sayer AA, Schneider SM, Sieber CC, Topinkova E, Vandewoude M, Visser M, Zamboni M, Writing P Group for the European Working Group on Sarcopenia in Older, E. the Extended Group for, Sarcopenia: revised European consensus on definition and diagnosis, Age Ageing (2019). [DOI] [PMC free article] [PubMed] [Google Scholar]
- [16].Steiner JL, Lang CH, Dysregulation of skeletal muscle protein metabolism by alcohol, Am J Physiol Endocrinol Metab 308(9) (2015) E699–712. [DOI] [PMC free article] [PubMed] [Google Scholar]
- [17].Fernandez-Sola J, Preedy VR, Lang CH, Gonzalez-Reimers E, Arno M, Lin JC, Wiseman H, Zhou S, Emery PW, Nakahara T, Hashimoto K, Hirano M, Santolaria-Fernandez F, Gonzalez-Hernandez T, Fatjo F, Sacanella E, Estruch R, Nicolas JM, Urbano-Marquez A, Molecular and cellular events in alcohol-induced muscle disease, Alcohol Clin Exp Res 31(12) (2007) 1953–62. [DOI] [PubMed] [Google Scholar]
- [18].Pacy PJ, Preedy VR, Peters TJ, Read M, Halliday D, The effect of chronic alcohol ingestion on whole body and muscle protein synthesis--a stable isotope study, Alcohol Alcohol 26(5–6) (1991) 505–13. [DOI] [PubMed] [Google Scholar]
- [19].Dasarathy S, Brown JM, Alcoholic Liver Disease on the Rise: Interorgan Cross Talk Driving Liver Injury, Alcohol Clin Exp Res 41(5) (2017) 880–882. [DOI] [PMC free article] [PubMed] [Google Scholar]
- [20].Kant S, Davuluri G, Alchirazi KA, Welch N, Heit C, Kumar A, Gangadhariah M, Kim A, McMullen MR, Willard B, Luse DS, Nagy LE, Vasiliou V, Marini AM, Weiner ID, Dasarathy S, Ethanol sensitizes skeletal muscle to ammonia-induced molecular perturbations, J Biol Chem 294(18) (2019) 7231–7244. [DOI] [PMC free article] [PubMed] [Google Scholar]
- [21].Singh R, Cuervo AM, Autophagy in the cellular energetic balance, Cell Metab 13(5) (2011) 495–504. [DOI] [PMC free article] [PubMed] [Google Scholar]
- [22].Kafri M, Metzl-Raz E, Jona G, Barkai N, The Cost of Protein Production, Cell Rep 14(1) (2016) 22–31. [DOI] [PMC free article] [PubMed] [Google Scholar]
- [23].Krahenbuhl S, Alcohol-induced myopathy: what is the role of mitochondria?, Hepatology 34(1) (2001) 210–1. [DOI] [PubMed] [Google Scholar]
- [24].Mansouri A, Demeilliers C, Amsellem S, Pessayre D, Fromenty B, Acute ethanol administration oxidatively damages and depletes mitochondrial dna in mouse liver, brain, heart, and skeletal muscles: protective effects of antioxidants, J Pharmacol Exp Ther 298(2) (2001) 737–43. [PubMed] [Google Scholar]
- [25].Cardellach F, Galofre J, Grau JM, Casademont J, Hoek JB, Rubin E, Urbano-Marquez A, Oxidative metabolism in muscle mitochondria from patients with chronic alcoholism, Ann Neurol 31(5) (1992) 515–8. [DOI] [PubMed] [Google Scholar]
- [26].Farrar RP, Martin TP, Abraham LD, Erickson CK, The interaction of endurance running and ethanol on skeletal muscle mitochondria, Life Sci 30(1) (1982) 67–75. [DOI] [PubMed] [Google Scholar]
- [27].Cardellach F, Taraschi TF, Ellingson JS, Stubbs CD, Rubin E, Hoek JB, Maintenance of structural and functional characteristics of skeletal-muscle mitochondria and sarcoplasmic-reticular membranes after chronic ethanol treatment, Biochem J 274 ( Pt 2) (1991) 565–73. [DOI] [PMC free article] [PubMed] [Google Scholar]
- [28].Duplanty AA, Siggins RW, Allerton T, Simon L, Molina PE, Myoblast mitochondrial respiration is decreased in chronic binge alcohol administered simian immunodeficiency virus-infected antiretroviral-treated rhesus macaques, Physiol Rep 6(5) (2018). [DOI] [PMC free article] [PubMed] [Google Scholar]
- [29].Shaw S, Leo MA, Jayatilleke E, Lieber CS, Depressed oxidative metabolism in skeletal muscle after chronic alcohol consumption, Biochem Med 28(2) (1982) 210–23. [DOI] [PubMed] [Google Scholar]
- [30].Jacobsen EB, Hamberg O, Quistorff B, Ott P, Reduced mitochondrial adenosine triphosphate synthesis in skeletal muscle in patients with Child-Pugh class B and C cirrhosis, Hepatology 34(1) (2001) 7–12. [DOI] [PubMed] [Google Scholar]
- [31].Kiessling KH, Pilstrom L, Bylund AC, Piehl K, Saltin B, Effects of chronic ethanol abuse on structure and enzyme activities of skeletal muscle in man, Scand J Clin Lab Invest 35(6) (1975) 601–7. [DOI] [PubMed] [Google Scholar]
- [32].Adachi J, Fujita T, Kudo R, Asano M, Nurhantari Y, Ueno Y, 7-hydroperoxycholesterol and oxysterols as indices of oxidative stress: chronic ethanol feeding and rat skeletal muscle, Leg Med (Tokyo) 5 Suppl 1 (2003) S105–9. [DOI] [PubMed] [Google Scholar]
- [33].Ward RJ, Peters TJ, The antioxidant status of patients with either alcohol-induced liver damage or myopathy, Alcohol Alcohol 27(4) (1992) 359–65. [PubMed] [Google Scholar]
- [34].Preedy VR, Patel VB, Reilly ME, Richardson PJ, Falkous G, Mantle D, Oxidants, antioxidants and alcohol: implications for skeletal and cardiac muscle, Front Biosci 4 (1999) e58–66. [DOI] [PubMed] [Google Scholar]
- [35].Koo-Ng R, Falkous G, Reilly M, Peters TJ, Mantle D, Preedy VR, Carbonyl levels in type I and II fiber-rich muscles and their response to chronic ethanol feeding in vivo and hydroxyl and superoxide radicals in vitro, Alcohol Clin Exp Res 24(12) (2000) 1862–8. [PubMed] [Google Scholar]
- [36].Worrall S, Niemela O, Parkkila S, Peters TJ, Preedy VR, Protein adducts in type I and type II fibre predominant muscles of the ethanol-fed rat: preferential localisation in the sarcolemmal and subsarcolemmal region, Eur J Clin Invest 31(8) (2001) 723–30. [DOI] [PubMed] [Google Scholar]
- [37].Wang J, Chu H, Zhao H, Cheng X, Liu Y, Jin W, Zhao J, Liu B, Ding Y, Ma H, Nitricoxide synthase-induced oxidative stress in prolonged alcoholic myopathies of rats, Mol Cell Biochem 304(1–2) (2007) 135–42. [DOI] [PubMed] [Google Scholar]
- [38].Brand MD, Nicholls DG, Assessing mitochondrial dysfunction in cells, Biochem J 435(2) (2011) 297–312. [DOI] [PMC free article] [PubMed] [Google Scholar]
- [39].Davuluri G, Allawy A, Thapaliya S, Rennison JH, Singh D, Kumar A, Sandlers Y, Van Wagoner DR, Flask CA, Hoppel C, Kasumov T, Dasarathy S, Hyperammonaemia-induced skeletal muscle mitochondrial dysfunction results in cataplerosis and oxidative stress, J Physiol 594(24) (2016) 7341–7360. [DOI] [PMC free article] [PubMed] [Google Scholar]
- [40].Pesta D GE., High-Resolution Respirometry: OXPHOS Protocols for Human Cells and Permeabilized Fibers from Small Biopsies of Human Muscle, Humana Press; 2012. [DOI] [PubMed] [Google Scholar]
- [41].Gnaiger E, Mitochondrial pathways and respiratory control, OROBOROS MiPNet Publications, Innsbruck, 2008. [Google Scholar]
- [42].Mourier A, Larsson NG, Tracing the trail of protons through complex I of the mitochondrial respiratory chain, PLoS Biol 9(8) (2011) e1001129. [DOI] [PMC free article] [PubMed] [Google Scholar]
- [43].Cederbaum AI, Alcohol metabolism, Clin Liver Dis 16(4) (2012) 667–85. [DOI] [PMC free article] [PubMed] [Google Scholar]
- [44].Watmough NJ, Frerman FE, The electron transfer flavoprotein: ubiquinone oxidoreductases, Biochim Biophys Acta 1797(12) (2010) 1910–6. [DOI] [PubMed] [Google Scholar]
- [45].Quinlan CL, Goncalves RL, Hey-Mogensen M, Yadava N, Bunik VI, Brand MD, The 2-oxoacid dehydrogenase complexes in mitochondria can produce superoxide/hydrogen peroxide at much higher rates than complex I, J Biol Chem 289(12) (2014) 8312–25. [DOI] [PMC free article] [PubMed] [Google Scholar]
- [46].Bailey SM, A review of the role of reactive oxygen and nitrogen species in alcohol-induced mitochondrial dysfunction, Free Radic Res 37(6) (2003) 585–96. [DOI] [PubMed] [Google Scholar]
- [47].Alfonso-Loeches S, Urena-Peralta JR, Morillo-Bargues MJ, Oliver-De La Cruz J, Guerri C, Role of mitochondria ROS generation in ethanol-induced NLRP3 inflammasome activation and cell death in astroglial cells, Front Cell Neurosci 8 (2014) 216. [DOI] [PMC free article] [PubMed] [Google Scholar]
- [48].Dikalova AE, Bikineyeva AT, Budzyn K, Nazarewicz RR, McCann L, Lewis W, Harrison DG, Dikalov SI, Therapeutic targeting of mitochondrial superoxide in hypertension, Circ Res 107(1) (2010) 106–16. [DOI] [PMC free article] [PubMed] [Google Scholar]
- [49].Powers SK, Ji LL, Kavazis AN, Jackson MJ, Reactive oxygen species: impact on skeletal muscle, Compr Physiol 1(2) (2011) 941–69. [DOI] [PMC free article] [PubMed] [Google Scholar]
- [50].Otis JS, Guidot DM, Procysteine stimulates expression of key anabolic factors and reduces plantaris atrophy in alcohol-fed rats, Alcohol Clin Exp Res 33(8) (2009) 1450–9. [DOI] [PMC free article] [PubMed] [Google Scholar]
- [51].Scherz-Shouval R, Shvets E, Fass E, Shorer H, Gil L, Elazar Z, Reactive oxygen species are essential for autophagy and specifically regulate the activity of Atg4, EMBO J 26(7) (2007) 1749–60. [DOI] [PMC free article] [PubMed] [Google Scholar]
- [52].Frost RA, Nystrom G, Burrows PV, Lang CH, Temporal differences in the ability of ethanol to modulate endotoxin-induced increases in inflammatory cytokines in muscle under in vivo conditions, Alcohol Clin Exp Res 29(7) (2005) 1247–56. [DOI] [PubMed] [Google Scholar]
- [53].Lang CH, Pruznak AM, Deshpande N, Palopoli MM, Frost RA, Vary TC, Alcohol intoxication impairs phosphorylation of S6K1 and S6 in skeletal muscle independently of ethanol metabolism, Alcohol Clin Exp Res 28(11) (2004) 1758–67. [DOI] [PubMed] [Google Scholar]
- [54].Steiner JL, Lang CH, Alcohol impairs skeletal muscle protein synthesis and mTOR signaling in a time-dependent manner following electrically stimulated muscle contraction, J Appl Physiol (1985) 117(10) (2014) 1170–9. [DOI] [PMC free article] [PubMed] [Google Scholar]
- [55].Abrigo J, Elorza AA, Riedel CA, Vilos C, Simon F, Cabrera D, Estrada L, Cabello-Verrugio C, Role of Oxidative Stress as Key Regulator of Muscle Wasting during Cachexia, Oxid Med Cell Longev 2018 (2018) 2063179. [DOI] [PMC free article] [PubMed] [Google Scholar]
- [56].Barbieri E, Sestili P, Reactive oxygen species in skeletal muscle signaling, J Signal Transduct 2012 (2012) 982794. [DOI] [PMC free article] [PubMed] [Google Scholar]
- [57].Klionsky DJ, Abdelmohsen K, Abe A, Abedin MJ, Abeliovich H, Acevedo Arozena A, Adachi H, Adams CM, Adams PD, Adeli K, Adhihetty PJ, Adler SG, Agam G, Agarwal R, Aghi MK, Agnello M, Agostinis P, Aguilar PV, Aguirre-Ghiso J, Airoldi EM, Ait-Si-Ali S, Akematsu T, Akporiaye ET, Al-Rubeai M, Albaiceta GM, Albanese C, Albani D, Albert ML, Aldudo J, Algul H, Alirezaei M, Alloza I, Almasan A, Almonte-Beceril M, Alnemri ES, Alonso C, Altan-Bonnet N, Altieri DC, Alvarez S, Alvarez-Erviti L, Alves S, Amadoro G, Amano A, Amantini C, Ambrosio S, Amelio I, Amer AO, Amessou M, Amon A, An Z, Anania FA, Andersen SU, Andley UP, Andreadi CK, Andrieu-Abadie N, Anel A, Ann DK, Anoopkumar-Dukie S, Antonioli M, Aoki H, Apostolova N, Aquila S, Aquilano K, Araki K, Arama E, Aranda A, Araya J, Arcaro A, Arias E, Arimoto H, Ariosa AR, Armstrong JL, Arnould T, Arsov I, Asanuma K, Askanas V, Asselin E, Atarashi R, Atherton SS, Atkin JD, Attardi LD, Auberger P, Auburger G, Aurelian L, Autelli R, Avagliano L, Avantaggiati ML, Avrahami L, Awale S, Azad N, Bachetti T, Backer JM, Bae DH, Bae JS, Bae ON, Bae SH, Baehrecke EH, Baek SH, Baghdiguian S, Bagniewska-Zadworna A, Bai H, Bai J, Bai XY, Bailly Y, Balaji KN, Balduini W, Ballabio A, Balzan R, Banerjee R, Banhegyi G, Bao H, Barbeau B, Barrachina MD, Barreiro E, Bartel B, Bartolome A, Bassham DC, Bassi MT, Bast RC Jr., Basu A, Batista MT, Batoko H, Battino M, Bauckman K, Baumgarner BL, Bayer KU, Beale R, Beaulieu JF, Beck GR Jr., Becker C, Beckham JD, Bedard PA, Bednarski PJ, Begley TJ, Behl C, Behrends C, Behrens GM, Behrns KE, Bejarano E, Belaid A, Belleudi F, Benard G, Berchem G, Bergamaschi D, Bergami M, Berkhout B, Berliocchi L, Bernard A, Bernard M, Bernassola F, Bertolotti A, Bess AS, Besteiro S, Bettuzzi S, Bhalla S, Bhattacharyya S, Bhutia SK, Biagosch C, Bianchi MW, Biard-Piechaczyk M, Billes V, Bincoletto C, Bingol B, Bird SW, Bitoun M, Bjedov I, Blackstone C, Blanc L, Blanco GA, Blomhoff HK, Boada-Romero E, Bockler S, Boes M, Boesze-Battaglia K, Boise LH, Bolino A, Boman A, Bonaldo P, Bordi M, Bosch J, Botana LM, Botti J, Bou G, Bouche M, Bouchecareilh M, Boucher MJ, Boulton ME, Bouret SG, Boya P, Boyer-Guittaut M, Bozhkov PV, Brady N, Braga VM, Brancolini C, Braus GH, Bravo-San Pedro JM, Brennan LA, Bresnick EH, Brest P, Bridges D, Bringer MA, Brini M, Brito GC, Brodin B, Brookes PS, Brown EJ, Brown K, Broxmeyer HE, Bruhat A, Brum PC, Brumell JH, Brunetti-Pierri N, Bryson-Richardson RJ, Buch S, Buchan AM, Budak H, Bulavin DV, Bultman SJ, Bultynck G, Bumbasirevic V, Burelle Y, Burke RE, Burmeister M, Butikofer P, Caberlotto L, Cadwell K, Cahova M, Cai D, Cai J, Cai Q, Calatayud S, Camougrand N, Campanella M, Campbell GR, Campbell M, Campello S, Candau R, Caniggia I, Cantoni L, Cao L, Caplan AB, Caraglia M, Cardinali C, Cardoso SM, Carew JS, Carleton LA, Carlin CR, Carloni S, Carlsson SR, Carmona-Gutierrez D, Carneiro LA, Carnevali O, Carra S, Carrier A, Carroll B, Casas C, Casas J, Cassinelli G, Castets P, Castro-Obregon S, Cavallini G, Ceccherini I, Cecconi F, Cederbaum AI, Cena V, Cenci S, Cerella C, Cervia D, Cetrullo S, Chaachouay H, Chae HJ, Chagin AS, Chai CY, Chakrabarti G, Chamilos G, Chan EY, Chan MT, Chandra D, Chandra P, Chang CP, Chang RC, Chang TY, Chatham JC, Chatterjee S, Chauhan S, Che Y, Cheetham ME, Cheluvappa R, Chen CJ, Chen G, Chen GC, Chen G, Chen H, Chen JW, Chen JK, Chen M, Chen M, Chen P, Chen Q, Chen Q, Chen SD, Chen S, Chen SS, Chen W, Chen WJ, Chen WQ, Chen W, Chen X, Chen YH, Chen YG, Chen Y, Chen Y, Chen Y, Chen YJ, Chen YQ, Chen Y, Chen Z, Chen Z, Cheng A, Cheng CH, Cheng H, Cheong H, Cherry S, Chesney J, Cheung CH, Chevet E, Chi HC, Chi SG, Chiacchiera F, Chiang HL, Chiarelli R, Chiariello M, Chieppa M, Chin LS, Chiong M, Chiu GN, Cho DH, Cho SG, Cho WC, Cho YY, Cho YS, Choi AM, Choi EJ, Choi EK, Choi J, Choi ME, Choi SI, Chou TF, Chouaib S, Choubey D, Choubey V, Chow KC, Chowdhury K, Chu CT, Chuang TH, Chun T, Chung H, Chung T, Chung YL, Chwae YJ, Cianfanelli V, Ciarcia R, Ciechomska IA, Ciriolo MR, Cirone M, Claerhout S, Clague MJ, Claria J, Clarke PG, Clarke R, Clementi E, Cleyrat C, Cnop M, Coccia EM, Cocco T, Codogno P, Coers J, Cohen EE, Colecchia D, Coletto L, Coll NS, Colucci-Guyon E, Comincini S, Condello M, Cook KL, Coombs GH, Cooper CD, Cooper JM, Coppens I, Corasaniti MT, Corazzari M, Corbalan R, Corcelle-Termeau E, Cordero MD, Corral-Ramos C, Corti O, Cossarizza A, Costelli P, Costes S, Cotman SL, Coto-Montes A, Cottet S, Couve E, Covey LR, Cowart LA, Cox JS, Coxon FP, Coyne CB, Cragg MS, Craven RJ, Crepaldi T, Crespo JL, Criollo A, Crippa V, Cruz MT, Cuervo AM, Cuezva JM, Cui T, Cutillas PR, Czaja MJ, Czyzyk-Krzeska MF, Dagda RK, Dahmen U, Dai C, Dai W, Dai Y, Dalby KN, Dalla Valle L, Dalmasso G, D’Amelio M, Damme M, Darfeuille-Michaud A, Dargemont C, Darley-Usmar VM, Dasarathy S, Dasgupta B, Dash S, Dass CR, Davey HM, Davids LM, Davila D, Davis RJ, Dawson TM, Dawson VL, Daza P, de Belleroche J, de Figueiredo P, de Figueiredo RC, de la Fuente J, De Martino L, De Matteis A, De Meyer GR, De Milito A, De Santi M, de Souza W, De Tata V, De Zio D, Debnath J, Dechant R, Decuypere JP, Deegan S, Dehay B, Del Bello B, Del Re DP, Delage-Mourroux R, Delbridge LM, Deldicque L, Delorme-Axford E, Deng Y, Dengjel J, Denizot M, Dent P, Der CJ, Deretic V, Derrien B, Deutsch E, Devarenne TP, Devenish RJ, Di Bartolomeo S, Di Daniele N, Di Domenico F, Di Nardo A, Di Paola S, Di Pietro A, Di Renzo L, DiAntonio A, Diaz-Araya G, Diaz-Laviada I, Diaz-Meco MT, Diaz-Nido J, Dickey CA, Dickson RC, Diederich M, Digard P, Dikic I, Dinesh-Kumar SP, Ding C, Ding WX, Ding Z, Dini L, Distler JH, Diwan A, Djavaheri-Mergny M, Dmytruk K, Dobson RC, Doetsch V, Dokladny K, Dokudovskaya S, Donadelli M, Dong XC, Dong X, Dong Z, Donohue TM Jr., Doran KS, D’Orazi G, Dorn GW 2nd, Dosenko V, Dridi S, Drucker L, Du J, Du LL, Du L, du Toit A, Dua P, Duan L, Duann P, Dubey VK, Duchen MR, Duchosal MA, Duez H, Dugail I, Dumit VI, Duncan MC, Dunlop EA, Dunn WA Jr., Dupont N, Dupuis L, Duran RV, Durcan TM, Duvezin-Caubet S, Duvvuri U, Eapen V, Ebrahimi-Fakhari D, Echard A, Eckhart L, Edelstein CL, Edinger AL, Eichinger L, Eisenberg T, Eisenberg-Lerner A, Eissa NT, El-Deiry WS, El-Khoury V, Elazar Z, Eldar-Finkelman H, Elliott CJ, Emanuele E, Emmenegger U, Engedal N, Engelbrecht AM, Engelender S, Enserink JM, Erdmann R, Erenpreisa J, Eri R, Eriksen JL, Erman A, Escalante R, Eskelinen EL, Espert L, Esteban-Martinez L, Evans TJ, Fabri M, Fabrias G, Fabrizi C, Facchiano A, Faergeman NJ, Faggioni A, Fairlie WD, Fan C, Fan D, Fan J, Fang S, Fanto M, Fanzani A, Farkas T, Faure M, Favier FB, Fearnhead H, Federici M, Fei E, Felizardo TC, Feng H, Feng Y, Feng Y, Ferguson TA, Fernandez AF, Fernandez-Barrena MG, Fernandez-Checa JC, Fernandez-Lopez A, Fernandez-Zapico ME, Feron O, Ferraro E, Ferreira-Halder CV, Fesus L, Feuer R, Fiesel FC, Filippi-Chiela EC, Filomeni G, Fimia GM, Fingert JH, Finkbeiner S, Finkel T, Fiorito F, Fisher PB, Flajolet M, Flamigni F, Florey O, Florio S, Floto RA, Folini M, Follo C, Fon EA, Fornai F, Fortunato F, Fraldi A, Franco R, Francois A, Francois A, Frankel LB, Fraser ID, Frey N, Freyssenet DG, Frezza C, Friedman SL, Frigo DE, Fu D, Fuentes JM, Fueyo J, Fujitani Y, Fujiwara Y, Fujiya M, Fukuda M, Fulda S, Fusco C, Gabryel B, Gaestel M, Gailly P, Gajewska M, Galadari S, Galili G, Galindo I, Galindo MF, Galliciotti G, Galluzzi L, Galluzzi L, Galy V, Gammoh N, Gandy S, Ganesan AK, Ganesan S, Ganley IG, Gannage M, Gao FB, Gao F, Gao JX, Garcia Nannig L, Garcia Vescovi E, Garcia-Macia M, Garcia-Ruiz C, Garg AD, Garg PK, Gargini R, Gassen NC, Gatica D, Gatti E, Gavard J, Gavathiotis E, Ge L, Ge P, Ge S, Gean PW, Gelmetti V, Genazzani AA, Geng J, Genschik P, Gerner L, Gestwicki JE, Gewirtz DA, Ghavami S, Ghigo E, Ghosh D, Giammarioli AM, Giampieri F, Giampietri C, Giatromanolaki A, Gibbings DJ, Gibellini L, Gibson SB, Ginet V, Giordano A, Giorgini F, Giovannetti E, Girardin SE, Gispert S, Giuliano S, Gladson CL, Glavic A, Gleave M, Godefroy N, Gogal RM Jr., Gokulan K, Goldman GH, Goletti D, Goligorsky MS, Gomes AV, Gomes LC, Gomez H, Gomez-Manzano C, Gomez-Sanchez R, Goncalves DA, Goncu E, Gong Q, Gongora C, Gonzalez CB, Gonzalez-Alegre P, Gonzalez-Cabo P, Gonzalez-Polo RA, Goping IS, Gorbea C, Gorbunov NV, Goring DR, Gorman AM, Gorski SM, Goruppi S, Goto-Yamada S, Gotor C, Gottlieb RA, Gozes I, Gozuacik D, Graba Y, Graef M, Granato GE, Grant GD, Grant S, Gravina GL, Green DR, Greenhough A, Greenwood MT, Grimaldi B, Gros F, Grose C, Groulx JF, Gruber F, Grumati P, Grune T, Guan JL, Guan KL, Guerra B, Guillen C, Gulshan K, Gunst J, Guo C, Guo L, Guo M, Guo W, Guo XG, Gust AA, Gustafsson AB, Gutierrez E, Gutierrez MG, Gwak HS, Haas A, Haber JE, Hadano S, Hagedorn M, Hahn DR, Halayko AJ, Hamacher-Brady A, Hamada K, Hamai A, Hamann A, Hamasaki M, Hamer I, Hamid Q, Hammond EM, Han F, Han W, Handa JT, Hanover JA, Hansen M, Harada M, Harhaji-Trajkovic L, Harper JW, Harrath AH, Harris AL, Harris J, Hasler U, Hasselblatt P, Hasui K, Hawley RG, Hawley TS, He C, He CY, He F, He G, He RR, He XH, He YW, He YY, Heath JK, Hebert MJ, Heinzen RA, Helgason GV, Hensel M, Henske EP, Her C, Herman PK, Hernandez A, Hernandez C, Hernandez-Tiedra S, Hetz C, Hiesinger PR, Higaki K, Hilfiker S, Hill BG, Hill JA, Hill WD, Hino K, Hofius D, Hofman P, Hoglinger GU, Hohfeld J, Holz MK, Hong Y, Hood DA, Hoozemans JJ, Hoppe T, Hsu C, Hsu CY, Hsu LC, Hu D, Hu G, Hu HM, Hu H, Hu MC, Hu YC, Hu ZW, Hua F, Hua Y, Huang C, Huang HL, Huang KH, Huang KY, Huang S, Huang S, Huang WP, Huang YR, Huang Y, Huang Y, Huber TB, Huebbe P, Huh WK, Hulmi JJ, Hur GM, Hurley JH, Husak Z, Hussain SN, Hussain S, Hwang JJ, Hwang S, Hwang TI, Ichihara A, Imai Y, Imbriano C, Inomata M, Into T, Iovane V, Iovanna JL, Iozzo RV, Ip NY, Irazoqui JE, Iribarren P, Isaka Y, Isakovic AJ, Ischiropoulos H, Isenberg JS, Ishaq M, Ishida H, Ishii I, Ishmael JE, Isidoro C, Isobe K, Isono E, Issazadeh-Navikas S, Itahana K, Itakura E, Ivanov AI, Iyer AK, Izquierdo JM, Izumi Y, Izzo V, Jaattela M, Jaber N, Jackson DJ, Jackson WT, Jacob TG, Jacques TS, Jagannath C, Jain A, Jana NR, Jang BK, Jani A, Janji B, Jannig PR, Jansson PJ, Jean S, Jendrach M, Jeon JH, Jessen N, Jeung EB, Jia K, Jia L, Jiang H, Jiang H, Jiang L, Jiang T, Jiang X, Jiang X, Jiang X, Jiang Y, Jiang Y, Jimenez A, Jin C, Jin H, Jin L, Jin M, Jin S, Jinwal UK, Jo EK, Johansen T, Johnson DE, Johnson GV, Johnson JD, Jonasch E, Jones C, Joosten LA, Jordan J, Joseph AM, Joseph B, Joubert AM, Ju D, Ju J, Juan HF, Juenemann K, Juhasz G, Jung HS, Jung JU, Jung YK, Jungbluth H, Justice MJ, Jutten B, Kaakoush NO, Kaarniranta K, Kaasik A, Kabuta T, Kaeffer B, Kagedal K, Kahana A, Kajimura S, Kakhlon O, Kalia M, Kalvakolanu DV, Kamada Y, Kambas K, Kaminskyy VO, Kampinga HH, Kandouz M, Kang C, Kang R, Kang TC, Kanki T, Kanneganti TD, Kanno H, Kanthasamy AG, Kantorow M, Kaparakis-Liaskos M, Kapuy O, Karantza V, Karim MR, Karmakar P, Kaser A, Kaushik S, Kawula T, Kaynar AM, Ke PY, Ke ZJ, Kehrl JH, Keller KE, Kemper JK, Kenworthy AK, Kepp O, Kern A, Kesari S, Kessel D, Ketteler R, Kettelhut Ido C, Khambu B, Khan MM, Khandelwal VK, Khare S, Kiang JG, Kiger AA, Kihara A, Kim AL, Kim CH, Kim DR, Kim DH, Kim EK, Kim HY, Kim HR, Kim JS, Kim JH, Kim JC, Kim JH, Kim KW, Kim MD, Kim MM, Kim PK, Kim SW, Kim SY, Kim YS, Kim Y, Kimchi A, Kimmelman AC, Kimura T, King JS, Kirkegaard K, Kirkin V, Kirshenbaum LA, Kishi S, Kitajima Y, Kitamoto K, Kitaoka Y, Kitazato K, Kley RA, Klimecki WT, Klinkenberg M, Klucken J, Knaevelsrud H, Knecht E, Knuppertz L, Ko JL, Kobayashi S, Koch JC, Koechlin-Ramonatxo C, Koenig U, Koh YH, Kohler K, Kohlwein SD, Koike M, Komatsu M, Kominami E, Kong D, Kong HJ, Konstantakou EG, Kopp BT, Korcsmaros T, Korhonen L, Korolchuk VI, Koshkina NV, Kou Y, Koukourakis MI, Koumenis C, Kovacs AL, Kovacs T, Kovacs WJ, Koya D, Kraft C, Krainc D, Kramer H, Kravic-Stevovic T, Krek W, Kretz-Remy C, Krick R, Krishnamurthy M, Kriston-Vizi J, Kroemer G, Kruer MC, Kruger R, Ktistakis NT, Kuchitsu K, Kuhn C, Kumar AP, Kumar A, Kumar A, Kumar D, Kumar D, Kumar R, Kumar S, Kundu M, Kung HJ, Kuno A, Kuo SH, Kuret J, Kurz T, Kwok T, Kwon TK, Kwon YT, Kyrmizi I, La Spada AR, Lafont F, Lahm T, Lakkaraju A, Lam T, Lamark T, Lancel S, Landowski TH, Lane DJ, Lane JD, Lanzi C, Lapaquette P, Lapierre LR, Laporte J, Laukkarinen J, Laurie GW, Lavandero S, Lavie L, LaVoie MJ, Law BY, Law HK, Law KB, Layfield R, Lazo PA, Le Cam L, Le Roch KG, Le Stunff H, Leardkamolkarn V, Lecuit M, Lee BH, Lee CH, Lee EF, Lee GM, Lee HJ, Lee H, Lee JK, Lee J, Lee JH, Lee JH, Lee M, Lee MS, Lee PJ, Lee SW, Lee SJ, Lee SJ, Lee SY, Lee SH, Lee SS, Lee SJ, Lee S, Lee YR, Lee YJ, Lee YH, Leeuwenburgh C, Lefort S, Legouis R, Lei J, Lei QY, Leib DA, Leibowitz G, Lekli I, Lemaire SD, Lemasters JJ, Lemberg MK, Lemoine A, Leng S, Lenz G, Lenzi P, Lerman LO, Lettieri Barbato D, Leu JI, Leung HY, Levine B, Lewis PA, Lezoualc’h F, Li C, Li F, Li FJ, Li J, Li K, Li L, Li M, Li M, Li Q, Li R, Li S, Li W, Li W, Li X, Li Y, Lian J, Liang C, Liang Q, Liao Y, Liberal J, Liberski PP, Lie P, Lieberman AP, Lim HJ, Lim KL, Lim K, Lima RT, Lin CS, Lin CF, Lin F, Lin F, Lin FC, Lin K, Lin KH, Lin PH, Lin T, Lin WW, Lin YS, Lin Y, Linden R, Lindholm D, Lindqvist LM, Lingor P, Linkermann A, Liotta LA, Lipinski MM, Lira VA, Lisanti MP, Liton PB, Liu B, Liu C, Liu CF, Liu F, Liu HJ, Liu J, Liu JJ, Liu JL, Liu K, Liu L, Liu L, Liu Q, Liu RY, Liu S, Liu S, Liu W, Liu XD, Liu X, Liu XH, Liu X, Liu X, Liu X, Liu Y, Liu Y, Liu Z, Liu Z, Liuzzi JP, Lizard G, Ljujic M, Lodhi IJ, Logue SE, Lokeshwar BL, Long YC, Lonial S, Loos B, Lopez-Otin C, Lopez-Vicario C, Lorente M, Lorenzi PL, Lorincz P, Los M, Lotze MT, Lovat PE, Lu B, Lu B, Lu J, Lu Q, Lu SM, Lu S, Lu Y, Luciano F, Luckhart S, Lucocq JM, Ludovico P, Lugea A, Lukacs NW, Lum JJ, Lund AH, Luo H, Luo J, Luo S, Luparello C, Lyons T, Ma J, Ma Y, Ma Y, Ma Z, Machado J, Machado-Santelli GM, Macian F, MacIntosh GC, MacKeigan JP, Macleod KF, MacMicking JD, MacMillan-Crow LA, Madeo F, Madesh M, Madrigal-Matute J, Maeda A, Maeda T, Maegawa G, Maellaro E, Maes H, Magarinos M, Maiese K, Maiti TK, Maiuri L, Maiuri MC, Maki CG, Malli R, Malorni W, Maloyan A, Mami-Chouaib F, Man N, Mancias JD, Mandelkow EM, Mandell MA, Manfredi AA, Manie SN, Manzoni C, Mao K, Mao Z, Mao ZW, Marambaud P, Marconi AM, Marelja Z, Marfe G, Margeta M, Margittai E, Mari M, Mariani FV, Marin C, Marinelli S, Marino G, Markovic I, Marquez R, Martelli AM, Martens S, Martin KR, Martin SJ, Martin S, Martin-Acebes MA, Martin-Sanz P, Martinand-Mari C, Martinet W, Martinez J, Martinez-Lopez N, Martinez-Outschoorn U, Martinez-Velazquez M, Martinez-Vicente M, Martins WK, Mashima H, Mastrianni JA, Matarese G, Matarrese P, Mateo R, Matoba S, Matsumoto N, Matsushita T, Matsuura A, Matsuzawa T, Mattson MP, Matus S, Maugeri N, Mauvezin C, Mayer A, Maysinger D, Mazzolini GD, McBrayer MK, McCall K, McCormick C, McInerney GM, McIver SC, McKenna S, McMahon JJ, McNeish IA, Mechta-Grigoriou F, Medema JP, Medina DL, Megyeri K, Mehrpour M, Mehta JL, Mei Y, Meier UC, Meijer AJ, Melendez A, Melino G, Melino S, de Melo EJ, Mena MA, Meneghini MD, Menendez JA, Menezes R, Meng L, Meng LH, Meng S, Menghini R, Menko AS, Menna-Barreto RF, Menon MB, Meraz-Rios MA, Merla G, Merlini L, Merlot AM, Meryk A, Meschini S, Meyer JN, Mi MT, Miao CY, Micale L, Michaeli S, Michiels C, Migliaccio AR, Mihailidou AS, Mijaljica D, Mikoshiba K, Milan E, Miller-Fleming L, Mills GB, Mills IG, Minakaki G, Minassian BA, Ming XF, Minibayeva F, Minina EA, Mintern JD, Minucci S, Miranda-Vizuete A, Mitchell CH, Miyamoto S, Miyazawa K, Mizushima N, Mnich K, Mograbi B, Mohseni S, Moita LF, Molinari M, Molinari M, Moller AB, Mollereau B, Mollinedo F, Mongillo M, Monick MM, Montagnaro S, Montell C, Moore DJ, Moore MN, Mora-Rodriguez R, Moreira PI, Morel E, Morelli MB, Moreno S, Morgan MJ, Moris A, Moriyasu Y, Morrison JL, Morrison LA, Morselli E, Moscat J, Moseley PL, Mostowy S, Motori E, Mottet D, Mottram JC, Moussa CE, Mpakou VE, Mukhtar H, Mulcahy Levy JM, Muller S, Munoz-Moreno R, Munoz-Pinedo C, Munz C, Murphy ME, Murray JT, Murthy A, Mysorekar IU, Nabi IR, Nabissi M, Nader GA, Nagahara Y, Nagai Y, Nagata K, Nagelkerke A, Nagy P, Naidu SR, Nair S, Nakano H, Nakatogawa H, Nanjundan M, Napolitano G, Naqvi NI, Nardacci R, Narendra DP, Narita M, Nascimbeni AC, Natarajan R, Navegantes LC, Nawrocki ST, Nazarko TY, Nazarko VY, Neill T, Neri LM, Netea MG, Netea-Maier RT, Neves BM, Ney PA, Nezis IP, Nguyen HT, Nguyen HP, Nicot AS, Nilsen H, Nilsson P, Nishimura M, Nishino I, Niso-Santano M, Niu H, Nixon RA, Njar VC, Noda T, Noegel AA, Nolte EM, Norberg E, Norga KK, Noureini SK, Notomi S, Notterpek L, Nowikovsky K, Nukina N, Nurnberger T, O’Donnell VB, O’Donovan T, O’Dwyer PJ, Oehme I, Oeste CL, Ogawa M, Ogretmen B, Ogura Y, Oh YJ, Ohmuraya M, Ohshima T, Ojha R, Okamoto K, Okazaki T, Oliver FJ, Ollinger K, Olsson S, Orban DP, Ordonez P, Orhon I, Orosz L, O’Rourke EJ, Orozco H, Ortega AL, Ortona E, Osellame LD, Oshima J, Oshima S, Osiewacz HD, Otomo T, Otsu K, Ou JH, Outeiro TF, Ouyang DY, Ouyang H, Overholtzer M, Ozbun MA, Ozdinler PH, Ozpolat B, Pacelli C, Paganetti P, Page G, Pages G, Pagnini U, Pajak B, Pak SC, Pakos-Zebrucka K, Pakpour N, Palkova Z, Palladino F, Pallauf K, Pallet N, Palmieri M, Paludan SR, Palumbo C, Palumbo S, Pampliega O, Pan H, Pan W, Panaretakis T, Pandey A, Pantazopoulou A, Papackova Z, Papademetrio DL, Papassideri I, Papini A, Parajuli N, Pardo J, Parekh VV, Parenti G, Park JI, Park J, Park OK, Parker R, Parlato R, Parys JB, Parzych KR, Pasquet JM, Pasquier B, Pasumarthi KB, Patschan D, Patterson C, Pattingre S, Pattison S, Pause A, Pavenstadt H, Pavone F, Pedrozo Z, Pena FJ, Penalva MA, Pende M, Peng J, Penna F, Penninger JM, Pensalfini A, Pepe S, Pereira GJ, Pereira PC, Perez-de la Cruz V, Perez-Perez ME, Perez-Rodriguez D, Perez-Sala D, Perier C, Perl A, Perlmutter DH, Perrotta I, Pervaiz S, Pesonen M, Pessin JE, Peters GJ, Petersen M, Petrache I, Petrof BJ, Petrovski G, Phang JM, Piacentini M, Pierdominici M, Pierre P, Pierrefite-Carle V, Pietrocola F, Pimentel-Muinos FX, Pinar M, Pineda B, Pinkas-Kramarski R, Pinti M, Pinton P, Piperdi B, Piret JM, Platanias LC, Platta HW, Plowey ED, Poggeler S, Poirot M, Polcic P, Poletti A, Poon AH, Popelka H, Popova B, Poprawa I, Poulose SM, Poulton J, Powers SK, Powers T, Pozuelo-Rubio M, Prak K, Prange R, Prescott M, Priault M, Prince S, Proia RL, Proikas-Cezanne T, Prokisch H, Promponas VJ, Przyklenk K, Puertollano R, Pugazhenthi S, Puglielli L, Pujol A, Puyal J, Pyeon D, Qi X, Qian WB, Qin ZH, Qiu Y, Qu Z, Quadrilatero J, Quinn F, Raben N, Rabinowich H, Radogna F, Ragusa MJ, Rahmani M, Raina K, Ramanadham S, Ramesh R, Rami A, Randall-Demllo S, Randow F, Rao H, Rao VA, Rasmussen BB, Rasse TM, Ratovitski EA, Rautou PE, Ray SK, Razani B, Reed BH, Reggiori F, Rehm M, Reichert AS, Rein T, Reiner DJ, Reits E, Ren J, Ren X, Renna M, Reusch JE, Revuelta JL, Reyes L, Rezaie AR, Richards RI, Richardson DR, Richetta C, Riehle MA, Rihn BH, Rikihisa Y, Riley BE, Rimbach G, Rippo MR, Ritis K, Rizzi F, Rizzo E, Roach PJ, Robbins J, Roberge M, Roca G, Roccheri MC, Rocha S, Rodrigues CM, Rodriguez CI, de Cordoba SR, Rodriguez-Muela N, Roelofs J, Rogov VV, Rohn TT, Rohrer B, Romanelli D, Romani L, Romano PS, Roncero MI, Rosa JL, Rosello A, Rosen KV, Rosenstiel P, Rost-Roszkowska M, Roth KA, Roue G, Rouis M, Rouschop KM, Ruan DT, Ruano D, Rubinsztein DC, Rucker EB 3rd, Rudich A, Rudolf E, Rudolf R, Ruegg MA, Ruiz-Roldan C, Ruparelia AA, Rusmini P, Russ DW, Russo GL, Russo G, Russo R, Rusten TE, Ryabovol V, Ryan KM, Ryter SW, Sabatini DM, Sacher M, Sachse C, Sack MN, Sadoshima J, Saftig P, Sagi-Eisenberg R, Sahni S, Saikumar P, Saito T, Saitoh T, Sakakura K, Sakoh-Nakatogawa M, Sakuraba Y, Salazar-Roa M, Salomoni P, Saluja AK, Salvaterra PM, Salvioli R, Samali A, Sanchez AM, Sanchez-Alcazar JA, Sanchez-Prieto R, Sandri M, Sanjuan MA, Santaguida S, Santambrogio L, Santoni G, Dos Santos CN, Saran S, Sardiello M, Sargent G, Sarkar P, Sarkar S, Sarrias MR, Sarwal MM, Sasakawa C, Sasaki M, Sass M, Sato K, Sato M, Satriano J, Savaraj N, Saveljeva S, Schaefer L, Schaible UE, Scharl M, Schatzl HM, Schekman R, Scheper W, Schiavi A, Schipper HM, Schmeisser H, Schmidt J, Schmitz I, Schneider BE, Schneider EM, Schneider JL, Schon EA, Schonenberger MJ, Schonthal AH, Schorderet DF, Schroder B, Schuck S, Schulze RJ, Schwarten M, Schwarz TL, Sciarretta S, Scotto K, Scovassi AI, Screaton RA, Screen M, Seca H, Sedej S, Segatori L, Segev N, Seglen PO, Segui-Simarro JM, Segura-Aguilar J, Seki E, Sell C, Seiliez I, Semenkovich CF, Semenza GL, Sen U, Serra AL, Serrano-Puebla A, Sesaki H, Setoguchi T, Settembre C, Shacka JJ, Shajahan-Haq AN, Shapiro IM, Sharma S, She H, Shen CK, Shen CC, Shen HM, Shen S, Shen W, Sheng R, Sheng X, Sheng ZH, Shepherd TG, Shi J, Shi Q, Shi Q, Shi Y, Shibutani S, Shibuya K, Shidoji Y, Shieh JJ, Shih CM, Shimada Y, Shimizu S, Shin DW, Shinohara ML, Shintani M, Shintani T, Shioi T, Shirabe K, Shiri-Sverdlov R, Shirihai O, Shore GC, Shu CW, Shukla D, Sibirny AA, Sica V, Sigurdson CJ, Sigurdsson EM, Sijwali PS, Sikorska B, Silveira WA, Silvente-Poirot S, Silverman GA, Simak J, Simmet T, Simon AK, Simon HU, Simone C, Simons M, Simonsen A, Singh R, Singh SV, Singh SK, Sinha D, Sinha S, Sinicrope FA, Sirko A, Sirohi K, Sishi BJ, Sittler A, Siu PM, Sivridis E, Skwarska A, Slack R, Slaninova I, Slavov N, Smaili SS, Smalley KS, Smith DR, Soenen SJ, Soleimanpour SA, Solhaug A, Somasundaram K, Son JH, Sonawane A, Song C, Song F, Song HK, Song JX, Song W, Soo KY, Sood AK, Soong TW, Soontornniyomkij V, Sorice M, Sotgia F, Soto-Pantoja DR, Sotthibundhu A, Sousa MJ, Spaink HP, Span PN, Spang A, Sparks JD, Speck PG, Spector SA, Spies CD, Springer W, Clair DS, Stacchiotti A, Staels B, Stang MT, Starczynowski DT, Starokadomskyy P, Steegborn C, Steele JW, Stefanis L, Steffan J, Stellrecht CM, Stenmark H, Stepkowski TM, Stern ST, Stevens C, Stockwell BR, Stoka V, Storchova Z, Stork B, Stratoulias V, Stravopodis DJ, Strnad P, Strohecker AM, Strom AL, Stromhaug P, Stulik J, Su YX, Su Z, Subauste CS, Subramaniam S, Sue CM, Suh SW, Sui X, Sukseree S, Sulzer D, Sun FL, Sun J, Sun J, Sun SY, Sun Y, Sun Y, Sun Y, Sundaramoorthy V, Sung J, Suzuki H, Suzuki K, Suzuki N, Suzuki T, Suzuki YJ, Swanson MS, Swanton C, Sward K, Swarup G, Sweeney ST, Sylvester PW, Szatmari Z, Szegezdi E, Szlosarek PW, Taegtmeyer H, Tafani M, Taillebourg E, Tait SW, Takacs-Vellai K, Takahashi Y, Takats S, Takemura G, Takigawa N, Talbot NJ, Tamagno E, Tamburini J, Tan CP, Tan L, Tan ML, Tan M, Tan YJ, Tanaka K, Tanaka M, Tang D, Tang D, Tang G, Tanida I, Tanji K, Tannous BA, Tapia JA, Tasset-Cuevas I, Tatar M, Tavassoly I, Tavernarakis N, Taylor A, Taylor GS, Taylor GA, Taylor JP, Taylor MJ, Tchetina EV, Tee AR, Teixeira-Clerc F, Telang S, Tencomnao T, Teng BB, Teng RJ, Terro F, Tettamanti G, Theiss AL, Theron AE, Thomas KJ, Thome MP, Thomes PG, Thorburn A, Thorner J, Thum T, Thumm M, Thurston TL, Tian L, Till A, Ting JP, Titorenko VI, Toker L, Toldo S, Tooze SA, Topisirovic I, Torgersen ML, Torosantucci L, Torriglia A, Torrisi MR, Tournier C, Towns R, Trajkovic V, Travassos LH, Triola G, Tripathi DN, Trisciuoglio D, Troncoso R, Trougakos IP, Truttmann AC, Tsai KJ, Tschan MP, Tseng YH, Tsukuba T, Tsung A, Tsvetkov AS, Tu S, Tuan HY, Tucci M, Tumbarello DA, Turk B, Turk V, Turner RF, Tveita AA, Tyagi SC, Ubukata M, Uchiyama Y, Udelnow A, Ueno T, Umekawa M, Umemiya-Shirafuji R, Underwood BR, Ungermann C, Ureshino RP, Ushioda R, Uversky VN, Uzcategui NL, Vaccari T, Vaccaro MI, Vachova L, Vakifahmetoglu-Norberg H, Valdor R, Valente EM, Vallette F, Valverde AM, Van den Berghe G, Van Den Bosch L, van den Brink GR, van der Goot FG, van der Klei IJ, van der Laan LJ, van Doorn WG, van Egmond M, van Golen KL, Van Kaer L, van Lookeren Campagne M, Vandenabeele P, Vandenberghe W, Vanhorebeek I, Varela-Nieto I, Vasconcelos MH, Vasko R, Vavvas DG, Vega-Naredo I, Velasco G, Velentzas AD, Velentzas PD, Vellai T, Vellenga E, Vendelbo MH, Venkatachalam K, Ventura N, Ventura S, Veras PS, Verdier M, Vertessy BG, Viale A, Vidal M, Vieira HL, Vierstra RD, Vigneswaran N, Vij N, Vila M, Villar M, Villar VH, Villarroya J, Vindis C, Viola G, Viscomi MT, Vitale G, Vogl DT, Voitsekhovskaja OV, von Haefen C, von Schwarzenberg K, Voth DE, Vouret-Craviari V, Vuori K, Vyas JM, Waeber C, Walker CL, Walker MJ, Walter J, Wan L, Wan X, Wang B, Wang C, Wang CY, Wang C, Wang C, Wang C, Wang D, Wang F, Wang F, Wang G, Wang HJ, Wang H, Wang HG, Wang H, Wang HD, Wang J, Wang J, Wang M, Wang MQ, Wang PY, Wang P, Wang RC, Wang S, Wang TF, Wang X, Wang XJ, Wang XW, Wang X, Wang X, Wang Y, Wang Y, Wang Y, Wang YJ, Wang Y, Wang Y, Wang YT, Wang Y, Wang ZN, Wappner P, Ward C, Ward DM, Warnes G, Watada H, Watanabe Y, Watase K, Weaver TE, Weekes CD, Wei J, Weide T, Weihl CC, Weindl G, Weis SN, Wen L, Wen X, Wen Y, Westermann B, Weyand CM, White AR, White E, Whitton JL, Whitworth AJ, Wiels J, Wild F, Wildenberg ME, Wileman T, Wilkinson DS, Wilkinson S, Willbold D, Williams C, Williams K, Williamson PR, Winklhofer KF, Witkin SS, Wohlgemuth SE, Wollert T, Wolvetang EJ, Wong E, Wong GW, Wong RW, Wong VK, Woodcock EA, Wright KL, Wu C, Wu D, Wu GS, Wu J, Wu J, Wu M, Wu M, Wu S, Wu WK, Wu Y, Wu Z, Xavier CP, Xavier RJ, Xia GX, Xia T, Xia W, Xia Y, Xiao H, Xiao J, Xiao S, Xiao W, Xie CM, Xie Z, Xie Z, Xilouri M, Xiong Y, Xu C, Xu C, Xu F, Xu H, Xu H, Xu J, Xu J, Xu J, Xu L, Xu X, Xu Y, Xu Y, Xu ZX, Xu Z, Xue Y, Yamada T, Yamamoto A, Yamanaka K, Yamashina S, Yamashiro S, Yan B, Yan B, Yan X, Yan Z, Yanagi Y, Yang DS, Yang JM, Yang L, Yang M, Yang PM, Yang P, Yang Q, Yang W, Yang WY, Yang X, Yang Y, Yang Y, Yang Z, Yang Z, Yao MC, Yao PJ, Yao X, Yao Z, Yao Z, Yasui LS, Ye M, Yedvobnick B, Yeganeh B, Yeh ES, Yeyati PL, Yi F, Yi L, Yin XM, Yip CK, Yoo YM, Yoo YH, Yoon SY, Yoshida K, Yoshimori T, Young KH, Yu H, Yu JJ, Yu JT, Yu J, Yu L, Yu WH, Yu XF, Yu Z, Yuan J, Yuan ZM, Yue BY, Yue J, Yue Z, Zacks DN, Zacksenhaus E, Zaffaroni N, Zaglia T, Zakeri Z, Zecchini V, Zeng J, Zeng M, Zeng Q, Zervos AS, Zhang DD, Zhang F, Zhang G, Zhang GC, Zhang H, Zhang H, Zhang H, Zhang H, Zhang J, Zhang J, Zhang J, Zhang J, Zhang JP, Zhang L, Zhang L, Zhang L, Zhang L, Zhang MY, Zhang X, Zhang XD, Zhang Y, Zhang Y, Zhang Y, Zhang Y, Zhang Y, Zhao M, Zhao WL, Zhao X, Zhao YG, Zhao Y, Zhao Y, Zhao YX, Zhao Z, Zhao ZJ, Zheng D, Zheng XL, Zheng X, Zhivotovsky B, Zhong Q, Zhou GZ, Zhou G, Zhou H, Zhou SF, Zhou XJ, Zhu H, Zhu H, Zhu WG, Zhu W, Zhu XF, Zhu Y, Zhuang SM, Zhuang X, Ziparo E, Zois CE, Zoladek T, Zong WX, Zorzano A, Zughaier SM, Guidelines for the use and interpretation of assays for monitoring autophagy (3rd edition), Autophagy; 12(1) (2016) 1–222. [DOI] [PMC free article] [PubMed] [Google Scholar]
- [58].Marciano R, Leprivier G, Rotblat B, Puromycin labeling does not allow protein synthesis to be measured in energy-starved cells, Cell Death Dis 9(2) (2018) 39. [DOI] [PMC free article] [PubMed] [Google Scholar]
- [59].Miller BF, Wolff CA, Peelor FF 3rd, Shipman PD, Hamilton KL, Modeling the contribution of individual proteins to mixed skeletal muscle protein synthetic rates over increasing periods of label incorporation, J Appl Physiol (1985) 118(6) (2015) 655–61. [DOI] [PMC free article] [PubMed] [Google Scholar]
- [60].Goodman CA, Mabrey DM, Frey JW, Miu MH, Schmidt EK, Pierre P, Hornberger TA, Novel insights into the regulation of skeletal muscle protein synthesis as revealed by a new nonradioactive in vivo technique, FASEB J 25(3) (2011) 1028–39. [DOI] [PMC free article] [PubMed] [Google Scholar]
- [61].Davuluri G, Giusto M, Chandel R, Welch N, Alsabbagh K, Kant S, Kumar A, Kim A, Gangadhariah M, Ghosh PK, Tran U, Krajcik DM, Vasu K, DiDonato AJ, DiDonato J, Willard B, Monga SP, Wang Y, Fox PL, Stark GR, Wessely O, Esser KA, Dasarathy S, Impaired Ribosomal Biogenesis by Non-Canonical Degradation of beta-catenin during Hyperammonemia, Mol Cell Biol (2019). [DOI] [PMC free article] [PubMed] [Google Scholar]
- [62].Bevington A, Poulter C, Brown J, Walls J, Inhibition of protein synthesis by acid in L6 skeletal muscle cells: analogies with the acute starvation response, Miner Electrolyte Metab 24(4) (1998) 261–6. [DOI] [PubMed] [Google Scholar]
- [63].von Walden F, Liu C, Aurigemma N, Nader GA, mTOR signaling regulates myotube hypertrophy by modulating protein synthesis, rDNA transcription, and chromatin remodeling, Am J Physiol Cell Physiol 311(4) (2016) C663–C672. [DOI] [PubMed] [Google Scholar]
- [64].Koll M, Ahmed S, Mantle D, Donohue TM, Palmer TN, Simanowski UA, Seltz HK, Peters TJ, Preedy VR, Effect of acute and chronic alcohol treatment and their superimposition on lysosomal, cytoplasmic, and proteosomal protease activities in rat skeletal muscle in vivo, Metabolism 51(1) (2002) 97–104. [DOI] [PubMed] [Google Scholar]
- [65].Wang H, Zhou H, Chervenak R, Moscatello KM, Brunson LE, Chervenak DC, Wolcott RM, Ethanol exhibits specificity in its effects on differentiation of hematopoietic progenitors, Cell Immunol 255(1–2) (2009) 1–7. [DOI] [PMC free article] [PubMed] [Google Scholar]
- [66].Henzel K, Thorborg C, Hofmann M, Zimmer G, Leuschner U, Toxicity of ethanol and acetaldehyde in hepatocytes treated with ursodeoxycholic or tauroursodeoxycholic acid, Biochim Biophys Acta 1644(1) (2004) 37–45. [DOI] [PubMed] [Google Scholar]
- [67].Vallejo Y, Hortsch M, Dubreuil RR, Ethanol does not inhibit the adhesive activity of Drosophila neuroglian or human L1 in Drosophila S2 tissue culture cells, J Biol Chem 272(18) (1997) 12244–7. [DOI] [PubMed] [Google Scholar]
- [68].Yang JW, Shin JS, Lee JJ, Chang HI, Kim CW, In vitro model using mouse hepatocytes for study of alcohol stress, Biosci Biotechnol Biochem 65(7) (2001) 1528–33. [DOI] [PubMed] [Google Scholar]
- [69].Blevins T, Mirshahi T, Chandler LJ, Woodward JJ, Effects of acute and chronic ethanol exposure on heteromeric N-methyl-D-aspartate receptors expressed in HEK 293 cells, J Neurochem 69(6) (1997) 2345–54. [DOI] [PubMed] [Google Scholar]
- [70].Saikia P, Bellos D, McMullen MR, Pollard KA, de la Motte C, Nagy LE, MicroRNA 181b-3p and its target importin alpha5 regulate toll-like receptor 4 signaling in Kupffer cells and liver injury in mice in response to ethanol, Hepatology 66(2) (2017) 602–615. [DOI] [PMC free article] [PubMed] [Google Scholar]
- [71].Tsien C, Davuluri G, Singh D, Allawy A, Ten Have GA, Thapaliya S, Schulze JM, Barnes D, McCullough AJ, Engelen MP, Deutz NE, Dasarathy S, Metabolic and molecular responses to leucine-enriched branched chain amino acid supplementation in the skeletal muscle of alcoholic cirrhosis, Hepatology 61(6) (2015) 2018–29. [DOI] [PMC free article] [PubMed] [Google Scholar]
- [72].Jastroch M, Divakaruni AS, Mookerjee S, Treberg JR, Brand MD, Mitochondrial proton and electron leaks, Essays Biochem 47 (2010) 53–67. [DOI] [PMC free article] [PubMed] [Google Scholar]
- [73].Rolfe DF, Brand MD, Contribution of mitochondrial proton leak to skeletal muscle respiration and to standard metabolic rate, Am J Physiol 271(4 Pt 1) (1996) C1380–9. [DOI] [PubMed] [Google Scholar]
- [74].Kuznetsov AV, Mayboroda O, Kunz D, Winkler K, Schubert W, Kunz WS, Functional imaging of mitochondria in saponin-permeabilized mice muscle fibers, J Cell Biol 140(5) (1998) 1091–9. [DOI] [PMC free article] [PubMed] [Google Scholar]
- [75].Jacobs RA, Diaz V, Meinild AK, Gassmann M, Lundby C, The C57Bl/6 mouse serves as a suitable model of human skeletal muscle mitochondrial function, Exp Physiol 98(4) (2013) 908–21. [DOI] [PubMed] [Google Scholar]
- [76].Lee K, Haddad A, Osme A, Kim C, Borzou A, Ilchenko S, Allende D, Dasarathy S, McCullough A, Sadygov RG, Kasumov T, Hepatic Mitochondrial Defects in a Nonalcoholic Fatty Liver Disease Mouse Model Are Associated with Increased Degradation of Oxidative Phosphorylation Subunits, Mol Cell Proteomics 17(12) (2018) 2371–2386. [DOI] [PMC free article] [PubMed] [Google Scholar]
- [77].Su YC, Qi X, Inhibition of excessive mitochondrial fission reduced aberrant autophagy and neuronal damage caused by LRRK2 G2019S mutation, Hum Mol Genet 22(22) (2013) 4545–61. [DOI] [PubMed] [Google Scholar]
- [78].Matlib MA, Boesman-Finkelstein M, Srere PA, The kinetics of rat liver citrate synthase in situ, Arch Biochem Biophys 191(2) (1978) 426–30. [DOI] [PubMed] [Google Scholar]
- [79].Davuluri G, Krokowski D, Guan BJ, Kumar A, Thapaliya S, Singh D, Hatzoglou M, Dasarathy S, Metabolic adaptation of skeletal muscle to hyperammonemia drives the beneficial effects of l-leucine in cirrhosis, J Hepatol 65(5) (2016) 929–937. [DOI] [PMC free article] [PubMed] [Google Scholar]
- [80].Kumar A, Davuluri G, Silva RNE, Engelen M, Ten Have GAM, Prayson R, Deutz NEP, Dasarathy S, Ammonia lowering reverses sarcopenia of cirrhosis by restoring skeletal muscle proteostasis, Hepatology 65(6) (2017) 2045–2058. [DOI] [PMC free article] [PubMed] [Google Scholar]
Associated Data
This section collects any data citations, data availability statements, or supplementary materials included in this article.