Abstract
Purpose:
To evaluate the role of magnetization transfer (MT) magnetic resonance imaging (MRI) for the characterization of intestinal fibrosis compared with contrast-enhanced (CE) and diffusion-weighted MRI (DWI) and its capability for differentiating fibrotic from inflammatory strictures in humans with Crohn’s disease (CD), using surgical histopathology as the reference standard.
Materials and Methods:
Institutional review board approval and informed consent were obtained for this prospective study. Abdominal MT imaging, CE imaging and DWI of 31 consecutive CD patients were analyzed before elective surgery. The bowel wall MT ratio normalized to skeletal muscle, the apparent diffusion coefficient (ADC) and the percentage of enhancement gain were calculated; region-by-region correlations with the surgical specimen were performed to determine the histologic degree of fibrosis and inflammation. The performance of MT imaging was validated on five new patients. One-way ANOVA test, Spearman rank correlation and receiver operating characteristic (ROC) curve were used for statistical analysis.
Results:
Normalized MT ratios strongly correlated with fibrosis scores (r=0.769, P=0.000) but did not correlate with inflammation scores (r=−0.034, P=0.740). Significant differences (F=49.002, P=0.000) in normalized MT ratios were found among non-fibrotic, mildly, moderately and severely fibrotic walls. The normalized MT ratios of mixed fibrotic and inflammatory bowel walls were significantly higher than that of bowel walls with only inflammation present (t=−8.52, P=0.000). A high accuracy of normalized MT ratios was shown with an area under the ROC curve (AUC) of 0.919 (P=0.000) for differentiating moderately-severely fibrotic from non-fibrotic and mildly fibrotic bowel walls, followed by ADC (AUC=0.747, P=0.001) and the percentage of enhancement gain (AUC=0.592, P=0.209). The sensitivity, specificity and AUC of MT imaging for diagnosing moderate-severe fibrosis in the validation dataset were 80% (12/15), 100% (3/3) and 0.9 (P=0.033), respectively.
Conclusion:
MT imaging outperforms ADC and CE imaging in detecting and distinguishing varying degrees of bowel fibrosis with or without coexisting inflammation. MT imaging could potentially be used as a method to differentiate fibrotic from inflammatory intestinal strictures in CD patients.
Introduction
Crohn’s disease (CD) is a chronic inflammatory bowel disease characterized by transmural bowel wall inflammation that may progress to fibrosis with intestinal strictures and obstruction. Histopathology shows that inflammation and fibrosis coexist in CD strictures to varying degrees (1). Intestinal fibrosis is a consequence of chronic inflammation that is characterized by excessive extracellular matrix protein deposition (2). Clinically, inflammation-predominant strictures may be relieved by anti-inflammatory treatment, whereas fibrosis predominant strictures require endoscopic or surgical treatment (3). Hence, precisely defining the type of CD strictures and quantitatively detecting intestinal fibrosis are crucial for appropriate treatment.
Conventional imaging is still insufficient for differentiating the fibrostenotic from the inflammatory component of strictures (4–6). Although the percentage of enhancement gain between 70 s and 7 min in bowel magnetic resonance imaging (MRI) was reported to be able to differentiate severe from mild-moderate fibrosis, the poor performance in differentiating among none, mild and moderate fibrosis might limit its use (5). Recently, positron emission tomography (PET) combined with diffusion-weighted MRI (DWI) was reported to be useful for distinguishing fibrotic from inflammatory strictures (7). However, radiation exposure from PET imaging is not suitable for serial examinations. Moreover, the clinical value of DWI alone in assessing bowel fibrosis has not been clarified (7, 8). Ultrasound elastography has been used to detect bowel fibrosis in CD (9). This real-time technique is promising, although it is operator- and observer-dependent. While several novel imaging approaches have been studied, no single current modality can accurately differentiate fibrosis from inflammation.
Recently, magnetization transfer (MT) MRI has been evaluated for the detection of bowel fibrosis in animal models of CD (10–12). The image contrast in MT imaging is mainly determined by the fraction of macromolecules, such as collagens, in the intestinal tissue (13). The MT effect can be quantitated by the MT ratio and indirectly reflects the concentrations of macromolecules in an aqueous physiological environment (14, 15). Only one study (14) has hitherto reported that MT imaging could help identify bowel fibrotic scarring in CD patients. However, the reference standard used in that study was conventional MRI and clinical data rather than surgical histopathology. To date, the correlation among bowel MT imaging, histological fibrosis and inflammation in CD patients has not been studied. The purpose of this study was to evaluate the role of MT imaging for the characterization of intestinal fibrosis compared with contrast-enhanced (CE) imaging and DWI and its capability in differentiating fibrotic from inflammatory strictures in patients with CD using surgical histopathology as the reference standard.
Materials and Methods:
Patients
This prospective study was approved by the institutional ethics review board, and written informed consent was obtained from CD patients who underwent magnetic resonance (MR) enterography and subsequent surgery.
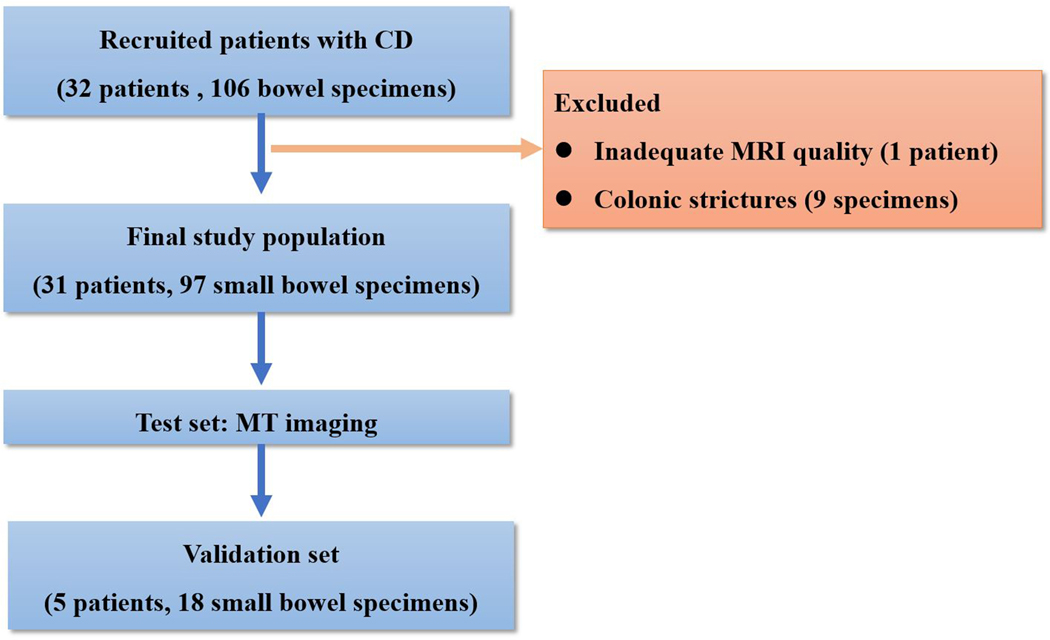
This study was divided into a test set and a validation set. From July 2014 through April 2017, 32 consecutive patients with CD who were scheduled for elective surgery were recruited from the Inflammatory Bowel Disease Center in The First Affiliated Hospital of Sun Yat-Sen University. The inclusion criteria were as follows: (a) adult patients (≥18 years) with a diagnosis of CD based on standard clinical, imaging, endoscopic and histological criteria who were non-responsive to medical treatment; (b) preoperative MRI within 15 days of elective surgery for symptomatic small bowel stricture; and (c) affected bowel segments identified on MRI with availability of a histopathologic specimen of the resected segment in the matching location. The exclusion criteria were as follows: (a) inadequate MRI quality of MT, DWI or CE imaging or (b) stricture location in the colon (with the purpose of creating a more homogeneous and focused patient population to test MT imaging) (Fig. 1).
Fig. 1.
Flow diagram of the study population. (CD, Crohn’s disease; MT, magnetization transfer)
From May 2017 through July 2017, the diagnostic performance of MT imaging was validated in another prospectively collected dataset from five additional patients with CD.
MRI protocol
After bowel preparation, as described in previous studies (16, 17), 1600–2000 mL of 2.5% mannitol solution was administered 1 hour before the procedure. Ten milligrams of raceanisodamine hydrochloride was intramuscularly injected into the buttocks 10 minutes before MR enterography.
MRI was performed using a 3.0 T MR system (Magnetom Trio, Siemens Medical Solutions, Erlangen, Germany) with multi-channel phased-array body coils. MT imaging was acquired using two gradient-echo data sets with and without the application of an off-resonant prepulse (frequency offset: 1.2 kHz, duration: 9984 μs, effective flip angle: 500°, bandwidth:192 Hz). T2-weighted imaging (T2WI) and DWI were routinely performed (Table 1). Pre-/post-enhancement T1-weighted imaging were acquired before and at 15 s, 70 s and 7 min after the intravenous injection of 0.2 mL/kg Gd-DTPA (gadopentetate dimeglumine, Beilu Pharmaceuticals, Beijing, China) at a rate of 2 mL/s.
Table 1.
MRI sequences and parameters
| Parameter | T2WI HASTE | MT GRE | DWI SE-EPI | VIBE |
|---|---|---|---|---|
| Orientation | 2D axial | 2D axial | 2D axial | 3D coronal |
| Acquisition Matrix | 320×224 | 256×205 | 190×190 | 320×240 |
| Flip angle (°) | 160 | 30 | 90 | 13 |
| Slice thickness (mm) | 4 | 4 | 4 | 2 |
| Echo time (msec) | 86 | 2.81 | 71.2 | 1.34 |
| Repetition time (msec) | 800 | 230 | 5300 | 4.37 |
| Averages | 1 | 1 | 3 | 1 |
| Number of slices | 28 | 10 | 28 | 80 |
| Respiratory control | BH | BH | Free-Breathing | BH |
| b factors (sec/mm2) | 50, 400, 800 | |||
| Acquisition time (sec) | 24 | 30 | 159 | 28 |
T2WI: T2-weighted imaging; HASTE, half-Fourier acquisition single-shot turbo spin echo; MT, magnetization transfer; GRE, gradient-echo; DWI, diffusion-weighted MRI; SE-EPI, spin-echo echo-planar imaging; VIBE, volumetric interpolated breath-hold examination; 2D, two-dimension; 3D, three-dimension; BH, breath hold
MR imaging analysis
To avoid bias in the measurement, the target segments on MT ratio maps, ADC maps and CE images were pre-marked for location-by-location evaluation by a radiologist (C.S.) with 15 years of experience in bowel MRI who was not blinded to the clinical, imaging or surgical information. Subsequently, one of three different radiologists with five to seven years of experience in bowel MRI, who were blinded to the clinical, laboratory and pathological information, measured the MT ratio, ADC or CE parameter by drawing regions of interest (ROIs) on the designated segments. The ROIs were drawn in the bowel walls with a maximum length of one-third the circumference of the bowel segments in cross-section.
MTR analysis
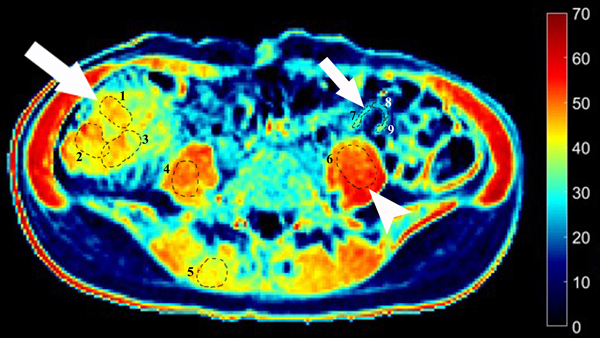
MT ratios were calculated using the following equation: MT ratio (%)=[1- (Msat/M0)]×100, where Msat and M0 are the signal intensities acquired with and without the off-resonance pre-pulse saturation, respectively (10, 14). All MT ratio maps were generated using an in-house Matlab script (Math Works Inc., Natick, MA). In the MT ratio pseudo-color map (Fig. 2E), tissues with high MT ratios (e.g., skeletal muscle) appear as yellow-red, while tissues with low MT ratios (e.g., subcutaneous fat) are dark blue. Bowel walls with intermediate MT ratios appear yellow according to the degree of intestinal fibrosis. Three ROIs with various sizes were drawn randomly to include the full thickness of bowel walls in the selected areas on the MT ratio maps by a radiologist (X. L.) with seven years of experience in bowel MRI who was blinded to the clinical, laboratory and pathological information. Among them, at least one ROI was drawn to capture the highest MT ratio. The average MT ratio of three ROIs was recorded. The mean area of the ROIs in the affected bowel walls was 111.48±82.88 mm2. The mean MT ratios of the psoas or gluteus muscle were also measured on the same MT ratios maps. The MT ratio of the bowel wall was divided by the MT ratio of skeletal muscle on the same image to yield a normalized MT ratio to minimize individual variation (11).
Fig. 2.
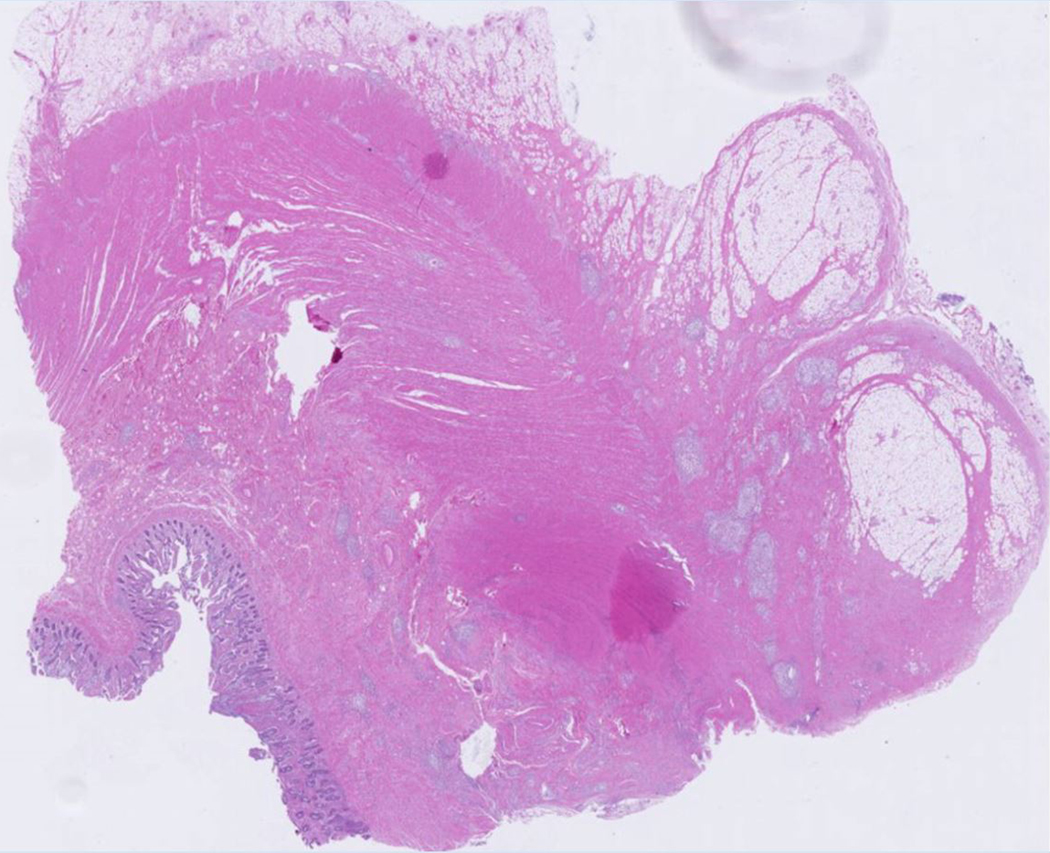
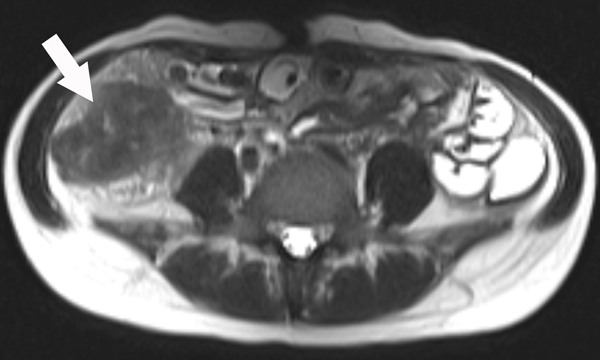
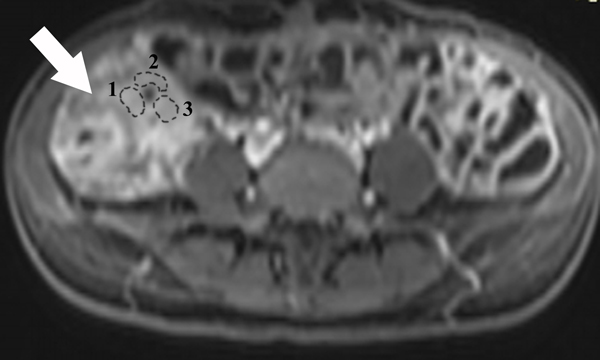
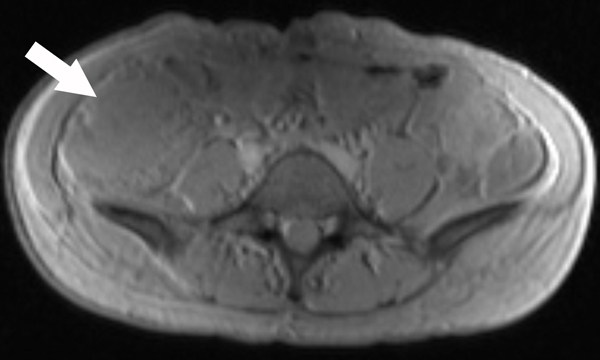
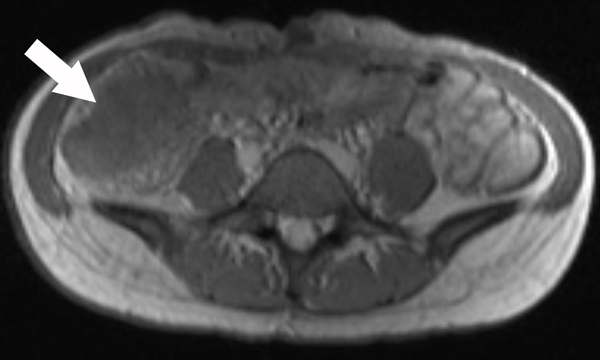
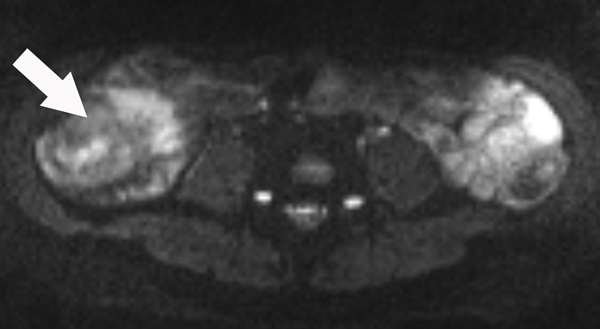
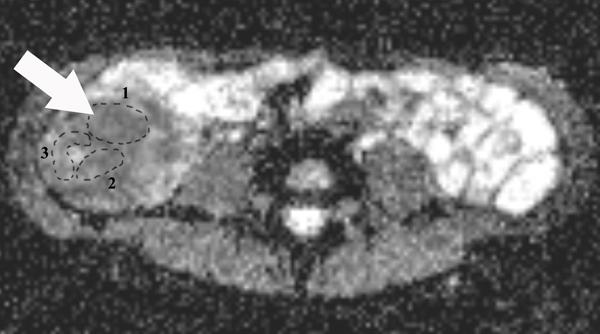
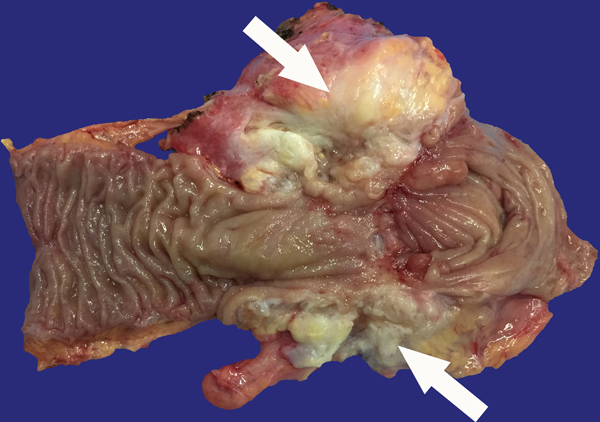
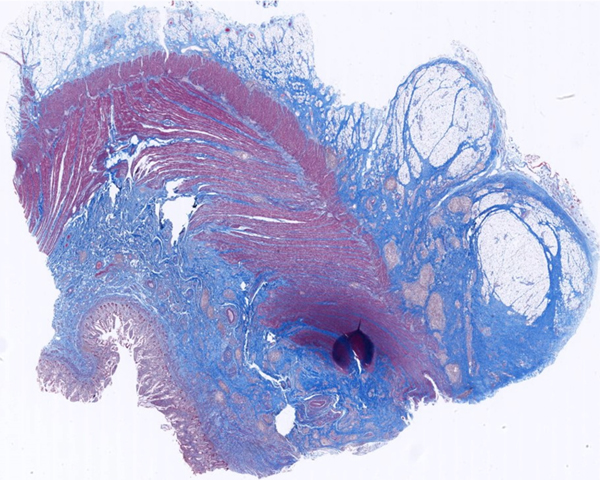
A 23-year-old female patient with CD. (a) Axial T2- and (b) axial postcontrast enhanced T1-weighted images at 7 min reconstructed from the coronal image show marked bowel wall thickening and luminal narrowing with hyperenhancement (ROIs 1–3, the percentage of enhancement gain between 70 s and 7 min=67%) in the ileocecum (arrows). Axial MT imaging without (c) and with (d) MT pulse and color MT ratio map (e) demonstrate the MT effect of terminal ileum (long arrows; ROIs 1–3, MT ratio=44%, yellow-red) to be similar to that of skeletal muscle (arrow head; ROIs 4–6, MT ratio=49%; yellow-red) and higher than that of the normal small bowel wall (short arrow; ROIs 7–9, MT ratio=23%; blue-yellow). The normalized MT ratio of the affected bowel wall in the ileocecum is 0.90. Hyperintensity on the axial DWI with b=800 s/mm2 (f) and hypointensity on the corresponding ADC map (g) (ROIs 1–3, ADC=0.78×10⁻³ mm2/s) are shown in the same segment (arrows). The macroscopic specimen (h) shows a thickened bowel wall with a gray-white cut surface in the area of stenosis (arrows). H & E (i) and Masson’s trichrome (j) staining depict moderate inflammation (score=2) and marked transmural fibrosis (blue area; score=3), respectively. (×2 magnification). (ROI, region of interest; MT, magnetization transfer; DWI, diffusion-weighted imaging; ADC, apparent diffusion coefficient; H & E, hematoxylin and eosin)
Apparent diffusion coefficient (ADC) measurement
On ADC maps (Fig. 2G), the mean ADCs were calculated by placing three ROIs to include the full thickness of bowel walls by a radiologist (S. H.) with five years of experience in bowel MRI without knowledge of the clinical, laboratory and pathological information. The mean area of the ROIs was 122.76±82.91 mm2.
The percentage of enhancement gain between 70 s and 7 min
The postcontrast wall signal intensities (WSIs) at 70 s and 7 min were measured on CE images in the same location within the pathological segment by a radiologist (Z. F.) with five years of experience in bowel MRI without knowledge of the clinical, laboratory and pathological information. Three ROIs were drawn to include the full thickness of bowel walls in the case of homogeneously transmural enhancement or the submucosa–muscularis layer in the case of stratified enhancement (5). The average WSI of three ROIs was recorded. The mean area of the ROIs was 56.22±34.00 mm2. As described in a previous study (5), the percentage of enhancement gain between 70 s and 7 min was calculated according to the following formula: % Gain=[(WSI 7 min – WSI 70 s)/ (WSI 70 s)] * 100.
Bowel segments selection for matched histologic assessment and MRI evaluation
A matched evaluation between MRI and specimens was performed by a radiologist (C. S.) with 15 years of experience in bowel MRI who was not blinded to the clinical, imaging and surgical information. As detailed in supplementary Fig. 1, specimens were obtained for a matched histologic assessment and MRI evaluation (5, 7). Some specimens with normal surgical findings near the surgical resection margin were chosen as control group.
Histopathologic evaluation
After tissue fixation in formalin, a full-thickness sample of the specimen was embedded in paraffin and sliced into several 4-μm-thick sections. One section was stained using hematoxylin and eosin (H & E) for the histologic inflammation score, and another section was stained with Masson’s trichrome for the histologic fibrosis score. A pathologist (Q. C.) with nine years of experience in bowel pathology without clinical and MRI information graded the histologic sections from the most severe areas for inflammation or fibrosis (Table 2) using a previously described semi-quantitative scoring system (4).
Table 2.
Histologic scores for inflammatory and fibrotic CD
| Score | Inflammation | Fibrosis |
|---|---|---|
| 0 (none) | No inflammation or distortion | No fibrosis |
| 1 (mild) | Lamina propria inflammation only | Minimal fibrosis in submucosa or subserosa |
| 2 (moderate) | Submucosal foci of inflammation and/or foci of transmural inflammation | Increased submucosal fibrosis, septa into muscularis propria and/or septa through muscularis propria, increase in subserosal collage |
| 3 (severe) | Significant, dissecting, confluent transmural inflammation | Significant transmural scar, marked subserosal collagen |
CD, Crohn’s disease
Statistical analysis
The statistical analysis was performed via two-sided comparisons, with significance defined as a P value <0.05 using SPSS version 20.0 software (SPSS Inc., Chicago, USA). Quantitative data were expressed as the means ± standard deviation, and qualitative data were presented as percentages and/or absolute values. Differences in normalized MT ratios, ADCs and CE parameters among different histologic grades were tested using one-way ANOVA. The Bonferroni test was further used for pairwise comparisons. For bivariate comparisons of normally distributed data, the two-tailed Student’s t test was used. The bivariate correlations between MRI parameters and histologic scores were analyzed using Spearman’s rank correlation. A partial correlation analysis was used to test the relationship between normalized MT ratios and inflammation scores after adjusting for fibrosis scores. Area under the receiver operating characteristics (ROC) curve (AUC) values were calculated to determine the diagnostic accuracy of MRI parameters for bowel fibrosis. In the validation study, the AUC, sensitivity and specificity of normalized MT ratios for diagnosing bowel fibrosis were calculated.
Results
Demographic and clinical data
Of the 32 patients recruited for the initial derivation study, 31 patients (19 men, 12 women; mean age: 32.39±8.47 years) were included in our study. For each patient, histologic findings were available for two to four separate bowel locations. Our final population comprised 31 patients and 97 bowel segments. Of the 97 bowel segments, 85 were from the most stenosed areas or prominently thickened bowel walls in the terminal ileum (n=63) and proximal ileum and jejunum (n=22) with a mean wall thickness of 8.68±3.99 mm; 12 were from macroscopically normal segments near the surgical resection margin in the terminal ileum (n=9) and proximal ileum and jejunum (n=3) with a mean wall thickness of 3.88±2.49 mm. The demographic and clinical characteristics are summarized in Table 3.
Table 3.
Baseline demographic and clinical characteristics of the patients
| n=31 | |
|---|---|
| Gender: female / male | 19 /12 |
| Age, mean ± SD, years | 32.39 ± 8.47 |
| Disease duration, mean ± SD, months | 66.45 ± 63.77 |
| Interval between MRI and surgery, mean ± SD, days | 7.65 ± 5.02 |
| < 7 days | 14 |
| 7–15 days | 17 |
| Surgery type, n (%) | |
| Ileocolon resection | 23/31 (74.19%) |
| Partial small bowel resection | 8/31 (25.81%) |
| Stricture location, n (%) | |
| Ileocecum | 11/31 (35.48%) |
| Terminal ileum | 12/31 (38.71%) |
| Proximal ileum + jejunum | 8/31 (25.81%) |
| Number of bowel specimens, n (%) | |
| Terminal ileum | 72/97 (74.23%) |
| Proximal ileum+ jejunum | 25/97 (25.77%) |
| CDAI, mean ± SD | 265.03 ± 89. 81 |
| CRP, mean ± SD, mg/L | 40.04 ± 24.01 |
| ESR, mean ± SD, mm/h | 40.61 ± 22.11 |
CDAI, Crohn’s disease activity index; CRP, C-reactive protein; ESR, erythrocyte sedimentation rate.
Histologic evaluation
Histologic inflammation was graded as none (n=0), mild (n=22), moderate (n=56), or severe (n=19). Fibrosis was graded as none (n=12), mild (n=8), moderate (n=47), or severe (n=30). A positive correlation was shown between fibrosis and inflammation scores (r=0.454, P=0.000). Among the 97 segments, 87.63% (85/97) of inflamed bowel walls were also shown to be intimately intertwined with various degrees of fibrosis and were defined as mixed fibrotic and inflammatory bowel walls, whereas 12.37% (12/97) of inflamed bowel walls were found to have an absence of fibrosis and were defined as purely inflammatory bowel walls (Fig. 3).
Fig. 3.
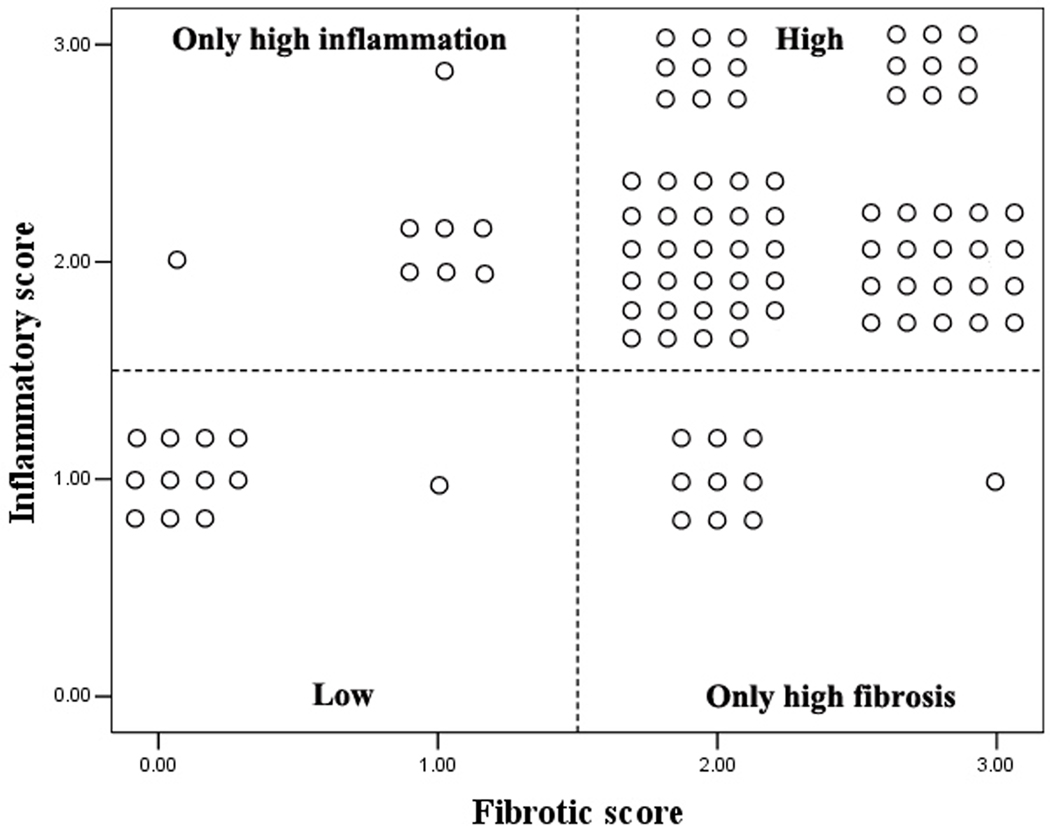
Fourfold graph showing that most of the moderately-severely inflamed segments are also moderately-severely fibrotic, whereas the mildly inflamed segments are non- or mildly fibrotic.
Normalized MT ratios, ADC and CE parameter in characterization of intestinal fibrosis
Normalized MT ratios
Significant differences in normalized MT ratios were found among non-fibrotic (0.51±0.07), mildly (0.67±0.13), moderately (0.77±0.11) and severely (0.88±0.14) (Fig. 2) fibrotic walls (F=49.002, P=0.000). The normalized MT ratios increased with the severity of bowel fibrosis (Fig. 4). There was a good correlation between normalized MT ratios and fibrosis scores (r=0.769, P=0.000). The normalized MT ratios of mixed fibrotic and inflammatory bowel walls (0.80±0.11) were higher than those of purely inflammatory bowel walls (0.51±0.07) (t=−8.52, P=0.000).
Fig. 4.
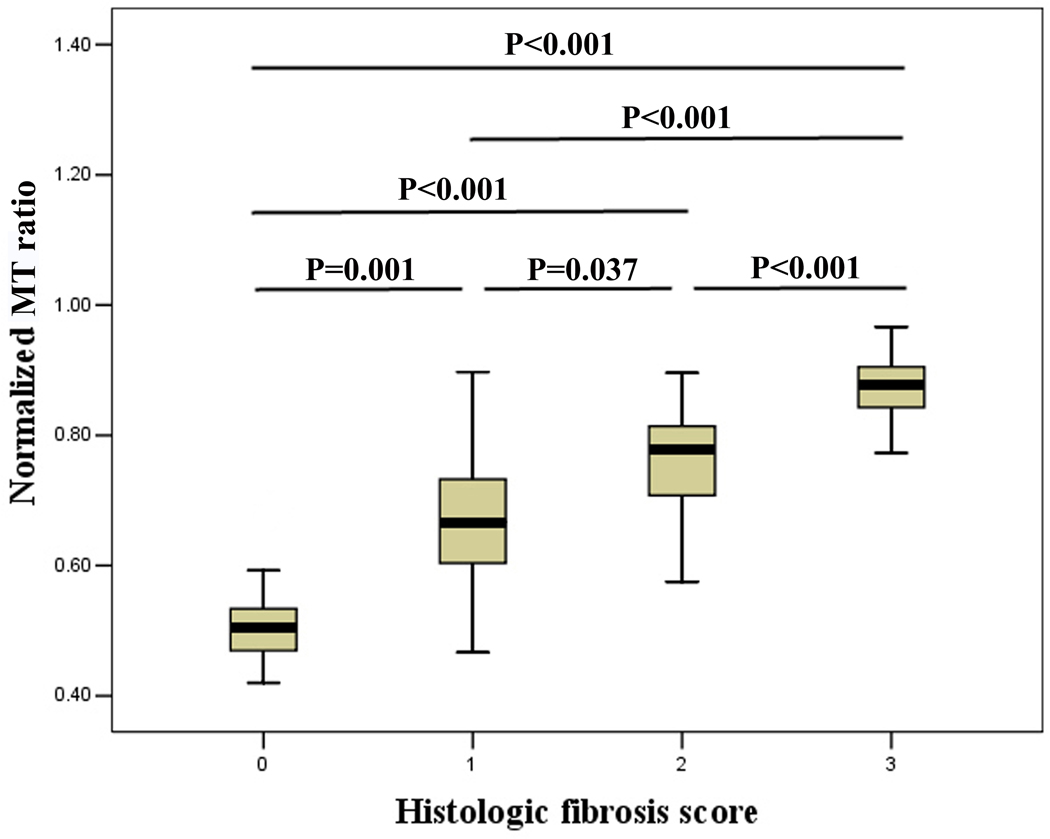
Normalized MT ratios increase with increasing bowel fibrosis. The differences in normalized MT ratios among non-fibrotic, mildly, moderately and severely fibrotic bowel walls were significant. (MT, magnetization transfer)
ADC and the percentage of enhancement gain between 70 s and 7 min
There was a moderate correlation between ADCs and fibrosis scores (r=−0.449, P=0.000). The ADCs of fibrotic bowel walls ([1.14±0.24]×10−3 mm2/s) were lower than those of non-fibrotic bowel walls ([1.53±0.27]×10−3 mm2/s) (t=5.108, P=0.000). However, no significant differences were found among mildly ([1.19±0.30]×10−3 mm2/s), moderately ([1.19±0.23]×10−3 mm2/s) and severely ([1.06±0.22]×10−3 mm2/s) fibrotic bowel walls (F=3.009, P=0.052).
The correlation between the percentage of enhancement gain and fibrosis score was not significant (r=−0.057, P=0.576). No significant differences were observed in the percentage of enhancement gain among non-fibrotic (0.14±0.13), mildly (0.23±0.21), moderately (0.31±0.29) and severely (0.24±0.22) fibrotic bowel walls (F=1.268, P=0.290).
Normalized MT ratios versus ADC and CE parameter in diagnosing intestinal fibrosis
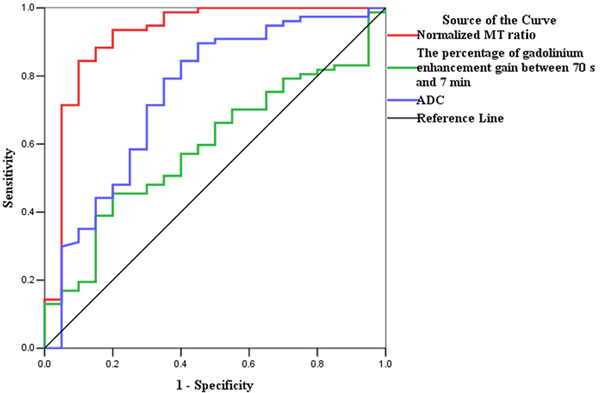
Normalized MT ratios had the highest accuracy (AUC=0.919; 95% confidence interval [CI], 0.832–1.000; P=0.000) for distinguishing moderately-severely fibrotic from non-fibrotic and mildly fibrotic bowel walls, followed by ADC (AUC=0.747; 95% CI, 0.615–0.879; P=0.001) and the percentage of enhancement gain (AUC=0.592; 95% CI, 0.464–0.719; P=0.209) (Fig. 5A). Using a normalized MT ratio of 0.71 as a cutoff value, the sensitivity and specificity were 84.42% (65/77) and 90% (18/20), respectively.
Fig. 5.
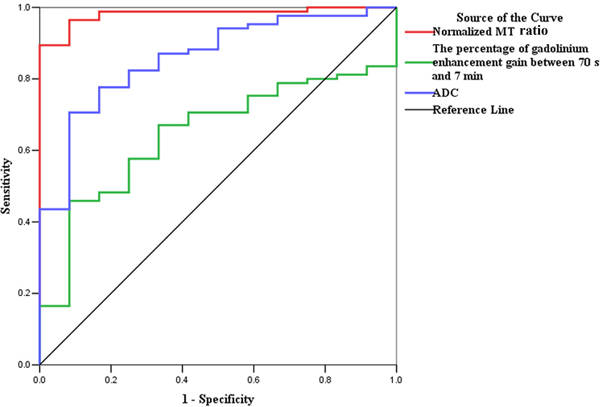
ROC analysis for the data from derivation set. (a) The normalized MT ratio is highly accurate on ROC analysis with an AUC of 0.919 (95% CI, 0.832–1.000; P=0.000) for distinguishing moderately-severely fibrotic from non-fibrotic and mildly fibrotic bowel walls, followed by ADC (AUC=0.747; 95% CI, 0.615–0.879; P=0.001) and the percentage of enhancement gain (AUC=0.592; 95% CI, 0.464–0.719; P=0.209). (b) The ROC curve also demonstrates the highest accuracy of normalized MT ratios with an AUC of 0.981 (95% CI, 0.956–1.000; P=0.000) for differentiating fibrotic and non-fibrotic bowel walls, followed by ADC (AUC=0.860; 95% CI, 0.761–0.959; P=0.000) and the percentage of enhancement gain (AUC=0.646; 95% CI, 0.514–0.778; P=0.103). (CI, confidence interval; ROC, receiver operating characteristics; MT, magnetization transfer; AUC, the area under the ROC curve; ADC, apparent diffusion coefficient)
High accuracy of normalized MT ratios was also shown with an AUC of 0.981 (95% CI, 0.956–1.000; P=0.000) for differentiating fibrotic and non-fibrotic bowel walls, followed by ADC (AUC=0.860; 95% CI, 0.761–0.959; P=0.000) and the percentage of enhancement gain (AUC=0.646; 95% CI, 0.514–0.778; P=0.103) (Fig. 5B). Using a normalized MT ratio of 0.59 as a cutoff value, the sensitivity and specificity were 96.47% (82/85) and 91.67% (11/12), respectively.
Normalized MT ratios in characterization of bowel inflammation
Because of the significant correlations between fibrosis scores and both inflammation scores and normalized MT ratios, a partial correlation analysis was used to test the relationship between normalized MT ratios and inflammation scores. No significant correlation (r=−0.034, P=0.740) was found between normalized MT ratios and inflammation scores after adjusting for fibrosis scores.
Diagnostic performance of MT imaging for bowel fibrosis in the validation set
The efficacy of the normalized MT ratio for bowel fibrosis was validated from five new patients with 18 bowel specimens. Bowel fibrosis was graded as none (n=0), mild (n=3), moderate (n=12), or severe (n=3). The mean normalized MT ratio was 0.71±0.12. Using a normalized MT ratio ≥0.71 derived from the derivation study as the cutoff level for distinguishing moderate-severe fibrosis from non-fibrosis and mild fibrosis, 12 specimens were categorized as moderate-severe fibrosis and six were non-fibrosis and mild fibrosis. The AUC, sensitivity and specificity of the normalized MT ratio were 0.900 (95% CI, 0.754–1.000; P=0.033), 80% (12/15) and 100% (3/3), respectively.
Discussion
Since MT imaging was first reported as a non-invasive method allowing the quantitative assessment of bowel fibrosis in an animal CD study (10), only a few studies using MT imaging in CD have been performed (11, 12, 14). An increase in MT ratios of fibrotic segments compared to control subjects was found in an animal study (10). Higher normalized MT ratios were also reported in mixed bowel fibrosis and inflammation compared with bowel inflammation in rats (11). Similar to these studies, we found that increasing normalized MT ratios of bowel walls with the severity of fibrosis allowed the distinction of fibrotic and non-fibrotic bowel walls in human CD. The high accuracy of normalized MT ratios for differentiating fibrotic from non-fibrotic bowel walls in our study was comparable to that (AUC=0.67–0.98) reported in the literature (10, 11, 14). The normalized MT ratios also showed high accuracy for distinguishing moderate-severe fibrosis from non-fibrosis and mild fibrosis. The ability of MT imaging to detect and further stratify bowel fibrosis regarding disease severity could help clinicians monitor the natural history of CD.
Our study confirmed that histologic inflammation and fibrosis often coexist in the bowel wall. This histological observation partly explains why it is often difficult to determine the degree of fibrosis within an inflamed bowel segment on conventional imaging. Similar to the report (10), a good correlation of normalized MT ratios with fibrosis scores and no correlation with inflammation scores were obtained in our study. MT imaging was sensitive to the changes in bowel fibrosis but not to the changes in inflammation. In addition, our study demonstrated an interesting finding: the relationship between bowel fibrosis and normalized MT ratio was not affected by the severity of bowel inflammation. These results demonstrated the stability and reliability of MT imaging for detecting the presence and severity of bowel fibrosis, and they disclosed the limitation of MT imaging to simultaneously assess inflammation and fibrosis in the same segment. When using MT imaging to evaluate strictured CD, the severity of bowel fibrosis could be accurately detected, while the assessment of the inflammatory component in the stricture was low. MT imaging had high efficacy for differentiating mixed fibrotic and inflammatory strictures from purely inflammatory strictures according to our results. The high performance of MT imaging in determining the presence and the degrees of bowel fibrosis may potentially provide sufficient clinical utility to help clinicians decide on individualized treatment strategies.
It is noteworthy that, compared to ADC and the percentage of enhancement gain, the normalized MT ratios showed not only a stronger correlation with bowel fibrosis but also higher accuracy for differentiating varying grades of bowel fibrosis. Although ADC has been widely reported for its usefulness in CD inflammatory activity (17–19), the efficacy of ADC for evaluating bowel fibrosis has been investigated in only a few studies (7, 8). In our study, ADC was able to differentiate fibrotic from non-fibrotic bowel walls; however, it could not further distinguish different grades of bowel fibrosis. In addition, the percentage of enhancement gain failed to correlate with bowel fibrosis in our study; this result was inconsistent with the result of a previous study reporting high efficacy for discriminating between mild–moderate and severe fibrosis (5). However, another study showed no association between the presence of fibrostenosis and the degree of mural enhancement (20). Normalized MT ratios outperformed ADC and the percentage of enhancement gain in assessing bowel fibrosis and might be better suited for monitoring bowel fibrosis of CD as a non-invasive biomarker in clinical practice.
There are several limitations in our study. First, this study included a smaller subset of bowel segments with absent or mild fibrosis. No normal bowel walls were found in our study because inflammation and fibrosis always coexisted in the resected specimens from the surgical patients. Second, the differences in normalized MT ratios between purely fibrotic and both purely inflammatory and mixed fibrotic and inflammatory strictures could not be compared due to the lack of purely fibrotic specimens. Third, a precise point-by-point comparison of peristaltic intestines on MRI with surgical specimens was difficult. This problem was partially addressed by decreased peristalsis of the affected bowel and a short interval between MRI and surgery in our study. Fourth, we included only small bowel lesions after excluding the colonic strictures in this preliminary study to create a more homogeneous and focused patient population to test MT imaging. Fifth, the inter-slice MT effect with multi-slice acquisition and B1 field inhomogeneity affected the MTR measurements in our study. Ideally, a single slice with B1 mapping correction is the best method to measure MTR. However, to make data acquisition as efficient as possible, we instead used a 30° (<1 rad) GRE-based MT sequence with interleave acquisition to mitigate such an effect. Sixth, no comparison between MT and fat-suppressed T2WI for bowel fibrosis was performed due to the lack of quantitative evaluation of T2WI signal intensity. Finally, the lack of assessment of inter-/intra-observer variability in ROI placement using the average of three ROIs instead of the entire area of stenosis could result in bias, considering that fibrosis and inflammation are not homogeneously distributed within a stenotic area.
In conclusion, MT imaging could accurately detect and distinguish varying degrees of bowel fibrosis with or without coexisting inflammation. MT imaging could potentially be used as a method to differentiate fibrotic from inflammatory intestinal strictures in patients with CD.
Supplementary Material
1. For matched analysis between MRI and resected specimens, the anatomic location of the sectioned areas was documented with respect to defined anatomic landmarks (e.g., ileocecal valve, appendix, or surgical resection margin). Subsequently, specimens were sectioned at 4–5 cm intervals to obtain bowel segments. Two to four bowel segments were obtained in every patient according to the disease extent. Some specimens with normal surgical findings (e.g., no mucosal lesions and no thickened bowel wall) near the surgical resection margin were chosen as the control group. As shown in the following case of a 30-year-old male patient with CD who underwent surgery, a specimen from the same area of the most stenosed segment in the ileum (line a) and the other two specimens (line b and c) from the prominently thickened bowel wall with an interval of 4 cm distal to the most stenosed area are located on both the coronal contrast-enhanced T1-weighted image (a) and surgically resected intestine (b). Proximal bowel dilatation (long arrow) and distal bowel collapse (arrow head) are also shown in the MRI (a) and resected intestine (b).
Advances in Knowledge
Significant differences in normalized magnetization transfer (MT) ratios were found among non-fibrotic (0.51±0.07), mildly (0.67±0.13), moderately (0.77±0.11) and severely (0.88±0.14) fibrotic intestinal walls (all P<0.05). However, there were overlaps in the ranges of normalized MT ratios among different degrees of bowel fibrosis that should be considered when applying this method in clinical practice.
Normalized MT ratios had the highest accuracy (AUC=0.919; 95% CI, 0.832–1.000; P=0.000) for distinguishing moderately-severely fibrotic from non-fibrotic and mildly fibrotic bowel walls, followed by apparent diffusion coefficient (AUC=0.747; 95% CI, 0.615–0.879; P=0.001) and the percentage of enhancement gain between 70 s and 7 min (AUC=0.592; 95% CI, 0.464–0.719; P=0.209). MT imaging outperformed contrast-enhanced and diffusion-weighted MRI in detecting and distinguishing varying degrees of bowel fibrosis with or without coexisting inflammation in human Crohn’s disease (CD).
The normalized MT ratios of mixed fibrotic and inflammatory bowel walls (0.80±0.11) were significantly higher than that of purely inflammatory bowel walls (0.51±0.07) (P<0.001). MT imaging could differentiate mixed fibrotic and inflammatory strictures from purely inflammatory strictures.
Implications for Patient Care
The ability of MT imaging to detect and stratify bowel fibrosis could help clinicians monitor the natural history of human CD and make decisions regarding medical treatments for non-fibrotic or mildly fibrotic strictures and surgical interventions for moderately-severely fibrotic strictures.
Summary statement
MT imaging could accurately detect and distinguish varying degrees of bowel fibrosis with or without coexisting inflammation. MT imaging could potentially be used as a method to differentiate fibrotic from inflammatory intestinal strictures in patients with CD.
Acknowledgments
Grant Support: This study was financially supported by National Natural Science Foundation of China (81600508, 81500501 and 81601514).
This original research has not been presented at an RSNA meeting or accepted for presentation at any future meeting.
Abbreviations:
- ADC
Apparent diffusion coefficient
- AUC
area under the ROC curve
- CD
Crohn’s disease
- CDAI
Crohn’s Disease Activity Index
- CE
Contrast enhanced
- CI
confidence interval
- CRP
C-reactive protein
- DWI
Diffusion-weighted MRI
- ESR
erythrocyte sedimentation rate
- H&E
hematoxylin and eosin
- MRE
magnetic resonance enterography
- MRI
magnetic resonance imaging
- MT
magnetization transfer
- MTI
magnetization transfer MRI
- MTR
magnetization transfer ratio
- PET
positron emission tomography
- ROC
receiver operating characteristics
- ROI
regions of interest
- WSI
Wall signal intensity
Footnotes
Disclosures: F.R. is a consultant to UCB, Samsung, Celgene and Roche and on the Advisory Board of AbbVie, UCB and Roche.
Writing Assistance: None
References:
- 1.Rieder F, Zimmermann EM, Remzi FH, Sandborn WJ. Crohn’s disease complicated by strictures: a systematic review. Gut 2013;62(7):1072–1084. [DOI] [PMC free article] [PubMed] [Google Scholar]
- 2.Rieder F, Fiocchi C. Mechanisms of tissue remodeling in inflammatory bowel disease. Dig Dis 2013;31(2):186–193. [DOI] [PubMed] [Google Scholar]
- 3.Latella G, Di Gregorio J, Flati V, Rieder F, Lawrance IC. Mechanisms of initiation and progression of intestinal fibrosis in IBD. Scand J Gastroenterol 2015;50(1):53–65. [DOI] [PubMed] [Google Scholar]
- 4.Adler J, Punglia DR, Dillman JR, et al. Computed tomography enterography findings correlate with tissue inflammation, not fibrosis in resected small bowel Crohn’s disease. Inflamm Bowel Dis 2012;18(5):849–856. [DOI] [PubMed] [Google Scholar]
- 5.Rimola J, Planell N, Rodriguez S, et al. Characterization of inflammation and fibrosis in Crohn’s disease lesions by magnetic resonance imaging. Am J Gastroenterol 2015;110(3):432–440. [DOI] [PubMed] [Google Scholar]
- 6.Barkmeier DT, Dillman JR, Al-Hawary M, et al. MR enterography-histology comparison in resected pediatric small bowel Crohn disease strictures: can imaging predict fibrosis? Pediatr Radiol 2016;46(4):498–507. [DOI] [PubMed] [Google Scholar]
- 7.Catalano OA, Gee MS, Nicolai E, et al. Evaluation of Quantitative PET/MR Enterography Biomarkers for Discrimination of Inflammatory Strictures from Fibrotic Strictures in Crohn Disease. Radiology 2016;278(3):792–800. [DOI] [PubMed] [Google Scholar]
- 8.Tielbeek JA, Ziech ML, Li Z, et al. Evaluation of conventional, dynamic contrast enhanced and diffusion weighted MRI for quantitative Crohn’s disease assessment with histopathology of surgical specimens. Eur Radiol 2014;24(3):619–629. [DOI] [PubMed] [Google Scholar]
- 9.Baumgart DC, Muller HP, Grittner U, et al. US-based Real-time Elastography for the Detection of Fibrotic Gut Tissue in Patients with Stricturing Crohn Disease. Radiology 2015;275(3):889–899. [DOI] [PubMed] [Google Scholar]
- 10.Adler J, Swanson SD, Schmiedlin-Ren P, et al. Magnetization transfer helps detect intestinal fibrosis in an animal model of Crohn disease. Radiology 2011;259(1):127–135. [DOI] [PMC free article] [PubMed] [Google Scholar]
- 11.Dillman JR, Swanson SD, Johnson LA, et al. Comparison of noncontrast MRI magnetization transfer and T2 -Weighted signal intensity ratios for detection of bowel wall fibrosis in a Crohn’s disease animal model. J Magn Reson Imaging 2015;42(3):801–810. [DOI] [PubMed] [Google Scholar]
- 12.Adler J, Rahal K, Swanson SD, et al. Anti-tumor necrosis factor alpha prevents bowel fibrosis assessed by messenger RNA, histology, and magnetization transfer MRI in rats with Crohn’s disease. Inflamm Bowel Dis 2013;19(4):683–690. [DOI] [PubMed] [Google Scholar]
- 13.Henkelman RM, Stanisz GJ, Graham SJ. Magnetization transfer in MRI: a review. NMR Biomed 2001;14(2):57–64. [DOI] [PubMed] [Google Scholar]
- 14.Pazahr S, Blume I, Frei P, et al. Magnetization transfer for the assessment of bowel fibrosis in patients with Crohn’s disease: initial experience. MAGMA 2013;26(3):291–301. [DOI] [PubMed] [Google Scholar]
- 15.Aisen AM. Science to practice: can the diagnosis of fibrosis with magnetization contrast MR aid in the evaluation of patients with Crohn disease? Radiology 2011;259(1):1–3. [DOI] [PubMed] [Google Scholar]
- 16.Li XH, Sun CH, Mao R, et al. Assessment of Activity of Crohn Disease by Diffusion-Weighted Magnetic Resonance Imaging. Medicine (Baltimore) 2015;94(43):e1819. [DOI] [PMC free article] [PubMed] [Google Scholar]
- 17.Li XH, Sun CH, Mao R, et al. Diffusion-weighted MRI Enables to Accurately Grade Inflammatory Activity in Patients of Ileocolonic Crohn’s Disease: Results from an Observational Study. Inflamm Bowel Dis 2017;23(2):244–253. [DOI] [PubMed] [Google Scholar]
- 18.Seo N, Park SH, Kim KJ, et al. MR Enterography for the Evaluation of Small-Bowel Inflammation in Crohn Disease by Using Diffusion-weighted Imaging without Intravenous Contrast Material: A Prospective Noninferiority Study. Radiology 2016(3):762–772. [DOI] [PubMed] [Google Scholar]
- 19.Hordonneau C, Buisson A, Scanzi J, et al. Diffusion-weighted magnetic resonance imaging in ileocolonic Crohn’s disease: validation of quantitative index of activity. Am J Gastroenterol 2014;109(1):89–98. [DOI] [PubMed] [Google Scholar]
- 20.Punwani S, Rodriguez-Justo M, Bainbridge A, et al. Mural inflammation in Crohn disease: location-matched histologic validation of MR imaging features. Radiology 2009;252(3):712–720. [DOI] [PubMed] [Google Scholar]
Associated Data
This section collects any data citations, data availability statements, or supplementary materials included in this article.
Supplementary Materials
1. For matched analysis between MRI and resected specimens, the anatomic location of the sectioned areas was documented with respect to defined anatomic landmarks (e.g., ileocecal valve, appendix, or surgical resection margin). Subsequently, specimens were sectioned at 4–5 cm intervals to obtain bowel segments. Two to four bowel segments were obtained in every patient according to the disease extent. Some specimens with normal surgical findings (e.g., no mucosal lesions and no thickened bowel wall) near the surgical resection margin were chosen as the control group. As shown in the following case of a 30-year-old male patient with CD who underwent surgery, a specimen from the same area of the most stenosed segment in the ileum (line a) and the other two specimens (line b and c) from the prominently thickened bowel wall with an interval of 4 cm distal to the most stenosed area are located on both the coronal contrast-enhanced T1-weighted image (a) and surgically resected intestine (b). Proximal bowel dilatation (long arrow) and distal bowel collapse (arrow head) are also shown in the MRI (a) and resected intestine (b).


