

Summary
Friedreich’s ataxia (FRDA) is a devastating, multisystemic disorder caused by recessive mutations in the mitochondrial protein frataxin (FXN). FXN participates in the biosynthesis of Fe-S clusters and is considered to be essential for viability. Here we report that when grown in 1% ambient O2, FXN null yeast, human cells, and nematodes are fully viable. In human cells, hypoxia restores steady state levels of Fe-S clusters and normalizes ATF4, NRF2, and IRP2 signaling events associated with FRDA. Cellular studies and in vitro reconstitution indicate that hypoxia acts through HIF-independent mechanisms that increase bioavailable iron as well as directly activate Fe-S synthesis. In a mouse model of FRDA, breathing 11% O2 attenuates the progression of ataxia, whereas breathing 55% O2 hastens it. Our work identifies oxygen as a key environmental variable in the pathogenesis associated with FXN depletion, with important mechanistic and therapeutic implications.
Introduction
Fe-S clusters are ancient cofactors that are essential for redox reactions, enzyme catalysis, protein stability, and regulation of gene expression (Lill, 2009; Rouault and Tong, 2008). An estimated 60 human proteins bind Fe-S clusters, including key enzymes in DNA replication and repair, protein translation, and energy metabolism (Andreini et al., 2016). Phylogenetic analyses reveal that Fe-S binding folds are among the most ancient and widely distributed (David and Alm, 2011; Dupont et al., 2010). Indeed, Fe-S clusters can form spontaneously from iron and inorganic sulfide under anaerobic conditions (Venkateswara Rao and Holm, 2004), the conditions that were present over 2.5 billion years ago in the ocean basins where life may have evolved (Canfield, 2005; Rouxel et al., 2005). As Fe-S clusters are oxygen-labile, the rise of oxygen in our planet’s oceans following the emergence of photosynthesis created a problem for Fe-S based catalysis (Canfield et al., 2000; Imlay, 2006). Life forms have evolved various strategies for coping with increased oxygen, such as employing protein scaffolds to shield Fe-S clusters from oxygen, expressing oxygen scavenging enzymes to keep oxygen levels low, using alternate oxygen-stable co-factors, or generating altogether new pathways that are free of Fe-S clusters (Andreini et al., 2017; Imlay, 2006).
All living organisms use enzyme-mediated pathways to synthesize Fe-S clusters. Virtually all eukaryotes depend on the mitochondrial-localized iron-sulfur cluster (ISC) pathway to generate Fe-S clusters, which are subsequently inserted into mitochondrial enzymes or exported to the cytosol (Beilschmidt and Puccio, 2014; Lill et al., 2014; Rouault, 2012). All of the ISC genes are encoded in the nuclear genome; the protein products are localized to the mitochondria where they mediate Fe-S cluster assembly. Eukaryotic ISC biosynthesis is initiated with the de novo synthesis of an Fe-S cluster on the scaffold protein ISCU. This reaction involves the cysteine desulfurase NFS1 that provides sulfur from cysteine, LYRM4 and NDUFAB1 (i.e. ISD11 and ACP, respectively) which contribute to the stability of NFS1, and FXN (Beilschmidt and Puccio, 2014; Rouault, 2012; Van Vranken et al., 2016). The exact molecular function of FXN is unclear, but it has been proposed to be an iron chaperone (Foury et al., 2007; Park et al., 2003) or an allosteric activator of cysteine binding to NFS1 and subsequent sulfur transfer to ISCU (Bridwell-Rabb et al., 2014; Parent et al., 2015; Tsai and Barondeau, 2010). Complete reconstitution of Fe-S cluster biosynthesis has been achieved in vitro using these core proteins together with an electron source, iron, and cysteine (Fox et al., 2015a; Webert et al., 2014). It is notable that in vitro reconstitution is typically performed under anaerobic conditions (Fox et al., 2015a; Muhlenhoff et al., 2002; Webert et al., 2014).
The Fe-S cluster biosynthetic pathway is traditionally viewed as a core essential pathway, and hypomorphic alleles in the pathway underlie various human diseases. The most common disorder of Fe-S biosynthesis is Friedreich’s ataxia (FRDA) (Campuzano et al., 1996; Koeppen, 2011). This devastating disorder affects 1 in 50,000 people, making it the most common inherited ataxia. FRDA presents with ataxia, gait disturbances, cardiomyopathy, vision loss and increased incidence of diabetes (Delatycki and Corben, 2012; Harding, 1981; Parkinson et al., 2013). Although there is heterogeneity in the presentation of FRDA, ataxia is fully penetrant and tends to be the most debilitating feature of this disease. In the overwhelming majority of cases, FRDA is caused by an expansion of the GAA repeat tract found in the first intron of the FXN gene, linked to a recessive phenotype (Campuzano et al., 1996; Reetz et al., 2015). This repeat expansion leads to both epigenetic silencing and abnormal DNA structures (Herman et al., 2006; Potaman et al., 2004), which together result in the reduced expression of FXN, leaving approximately 5–30% residual protein levels (Campuzano et al., 1997). Complete loss of FXN has never been observed in human disease, and is embryonically lethal in mice (Cossee et al., 2000). Unfortunately, the disease causes a rapid clinical decline, with an average age of death of 37.5 years (Harding, 1981). To date, there are no therapies to stop the progression of FRDA, and patient care is focused on symptomatic management.
Given the strong evolutionary link between environmental oxygen levels and Fe-S cluster formation, we sought to test whether reducing the oxygen tension can attenuate the defects associated with loss of FXN and the development of FRDA. We were further motivated by our lab’s previous work demonstrating that hypoxia benefits cells and mice with an impaired respiratory chain complex I (Jain et al., 2016). Here, we report the remarkable observation that yeast, human cells, and Caenorhabditis elegans completely lacking FXN can all be continuously grown under 1% O2. Under these low oxygen tensions, the steady state levels of Fe-S clusters are restored and stress signaling pathways that are activated in FRDA are reversed in human cells. We demonstrate that this rescue cannot be mimicked by simple activation of the HIF response, and by using in vitro reconstitution studies, demonstrate that O2 directly hinders mitochondrial ISC biosynthesis rates. Hypoxia is capable of bypassing the genetic requirement for FXN by normalizing Fe-S cluster levels and the cellular stress responses associated with this disease. Finally, we show that varying the ambient oxygen can have a dramatic impact on the progression of ataxia in a mouse model of FRDA.
Results
Growth of FXN KO human and yeast cells is restored under hypoxia
We sought to determine whether reducing the ambient oxygen tension influenced the growth defect of cells completely lacking FXN (FXN KO). We used CRISPR/Cas9 with two independent sgRNAs targeting FXN to eliminate FXN expression in human K562 cells (Figure 1A). At 21% O2, FXN KO cells grew poorly, as has been previously demonstrated (Calmels et al., 2009; Poburski et al., 2016). When grown at 1% O2, however, cells were able to tolerate the loss of FXN and did not exhibit any growth defects compared to a control guide. FXN protein levels were markedly depleted in FXN KO cells grown in both 21% and 1% O2, as seen by immunoblot analysis (Figure 1B). We note that cells grown under hypoxic conditions (i.e. 1% O2) proliferate more slowly than their normoxic counterparts, likely due to a myriad of factors. When FXN KO cells were cultured in an intermediate oxygen tension (5% O2), they still exhibited a significant growth delay relative to control cells (Figure S1A), pointing to a dose-dependent effect of oxygen tension on FXN essentiality. We obtained similar results in 293T cells (Figure 1C, Figure S1B), indicating that hypoxic growth rescue is not restricted to only a single cell lineage. We observed that in our cell culture conditions FXN loss does not lead to cell death but instead inhibits cellular proliferation (Figure S1C, D). We then tested the effect of low O2 on the growth of Saccharomyces cerevisiae deleted for FXN, as Fe-S biogenesis is highly conserved and FXN is essential under standard yeast culturing conditions (Wilson and Roof, 1997). Indeed, this growth rescue by hypoxia extends to yeast (Figure 1D, Figure S1E), indicating that the ability of FXN KO cells to grow under low O2 is a conserved feature of the ISC system. We next assessed whether an altered oxygen regimen would also affect lymphoblastoid cell lines (LCLs) derived from FRDA patients, which typically do not have a growth defect when compared to healthy control derived LCLs (Sturm et al., 2005). Notably, these FRDA-derived LCLs exhibited significant growth retardation when cultured in 30% O2 (Figure S1F) indicating that FRDA-derived cells are sensitive to elevated O2. Several studies have postulated that ROS formation is driving the cellular defects associated with FRDA (reviewed in (Gomes and Santos, 2013)). To test whether hypoxia was indirectly rescuing the growth of FXN null cells by reducing ROS-burden, we cultured these cells with several cell-permeable antioxidants (Fig 1E). However, none of the antioxidants boosted the growth rates of FXN-null cells, indicating that antioxidant buffering itself may not be sufficient to generate the proliferation rescue that we observe at 1% O2.
Figure 1-. Growth of cells lacking FXN can be complemented by hypoxia.

(A) Three-day proliferation assay of control or FXN KO K562 cells. Cells were grown in 21% O2, 1% O2 or 21% O2 with 75 μM FG-4592, which stabilizes HIF1a regardless of oxygen tensions. (B) Immunoblot of control or FXN KO cells grown in 21% O2, 1% O2 or 21% O2 with 75μM FG-4592, blotted for FXN, ISCU, NFS1, LYRM4, HIF1a and TIMM23. Asterisk indicates a non-specific band. (C) Three-day proliferation assay of control or FXN KO 293T cells. Cells were grown in 21% O2, 1% O2 or 21% O2 with 75μM FG-4592. (D) Growth of WT or Δyfh1 yeast in 21% O2 or 1% O2. (E) Three-day proliferation assay of control or FXN KO K562 cells in 21% O2 supplemented with DMSO or the antioxidants Mito-TEMPO (5nM,50nM,500nM), NAC (5μM,50μM,500μM) or Mn(III)TBAP (1μM,10μM,100μM). All bar plots show mean ± SD. *=p < 0.05, ***=p < 0.001, ****=p < 0.0001. One-way ANOVA with Bonferroni’s post-test. See also Figure S1.
An important question is whether hypoxia is rescuing the growth defect of FXN KO cells via activation of the canonical HIF-mediated hypoxia response (Majmundar et al., 2010; Schofield and Ratcliffe, 2004; Semenza, 2003). The HIF transcription factor activates a number of gene expression programs required under low O2 tensions. Under normoxic conditions, HIF is hydroxylated by the PHD1–3 prolyl hydroxylase enzymes, allowing it to be recognized by vHL, which ubiquitinates and targets HIF for proteasomal degradation. Human cells lacking mitochondrial complex I exhibit proliferative defects that can be rescued by forced activation of the HIF response (Jain et al., 2016). While the PHD inhibitor FG-4592 restores growth of complex I deficient cells (Figure S1G), it fails to restore growth of FXN KO cells (Figure 1A–C), suggesting that hypoxia is rescuing growth of FXN null cells via a HIF-independent mechanism. This result is supported by the fact that we are also able to rescue FXN null yeast with hypoxia, organisms lacking the HIF pathway (Grahl and Cramer, 2010; Rytkonen and Storz, 2011). Collectively, these studies demonstrate that the effects of hypoxia on FXN deficient cells is mechanistically distinct from its impact on complex I deficient cells.
Hypoxia rescue of FXN deficiency does not extend to other core members of the ISC machinery
Fe-S cluster biosynthesis relies on an entire network of proteins that catalyze cluster assembly and relay the assembled Fe-S cluster to target proteins (Figure 2A). We next sought to determine whether the O2 sensitivity of FXN loss extends to other core components of the Fe-S cluster biosynthesis pathway. Analysis of the 342 cell lines in the cancer dependency map (Meyers et al., 2017) revealed that other components of the ISC assembly machinery - namely, ISCU, NFS1, and LYRM4 - are highly essential in all cell lines (Figure 2B and Figure S2A). In line with the importance of Fe-S cluster biogenesis, the cytosolic Fe-S biogenesis machinery is also highly essential (Figure S2B), most likely due to the essential roles of Fe-S containing proteins in DNA replication, repair and ribosome recycling (Figure S2A). However, FXN is differentially essential, i.e. its absence led to a growth defect in some cell lines, but not in others (Figure 2B). Hence, FXN appears to be unique amongst the core ISC machinery in its selective essentiality across different cell types.
Figure 2-. FXN is unique among the ISC assembly machinery in its ability to be rescued by hypoxia.
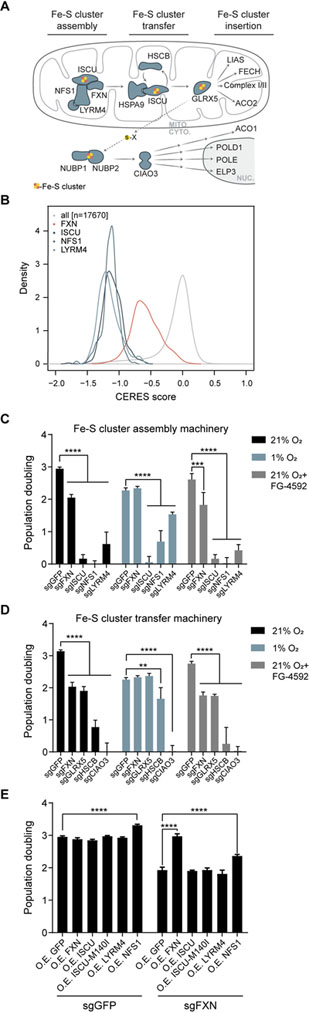
(A) Model of Fe-S cluster biosynthesis in eukaryotic cells. (B) Growth defects of gene CRISPR knock-outs are shown across 342 cancer cell lines from the Cancer Dependency Map, demonstrating that the Fe-S machinery is more essential (lower CERES score) than most genes and that ISCU, NFS1 and LYRM4 are more essential than FXN. Histograms are normalized via the kernel density function to equalize the area under each curve. (C) Three-day proliferation assay of K562 cells KO for the Fe-S assembly machinery- FXN, ISCU, NFS1 or LYRM4- vs. control cells. Cells were grown in 21% O2, 1% O2 or 21% O2 with 75μM FG-4592 (D) Three-day proliferation assay of K562 cells KO for FXN or the Fe-S cluster transfer machinery- GLRX5, HSCB or CIAO3- vs. control cells. Cells were grown in 21% O2, 1% O2 or 21% O2 with 75μM FG-4592 (E) Three-day proliferation assay of control or FXN KO K562 cells in 21% O2, overexpressing different subunits of the Fe-S assembly machinery, including the previously described ISCUM140I bypass mutant. All bar plots show mean ± SD. **=p < 0.01, ***=p < 0.001, ****=p < 0.0001. One-way ANOVA with Bonferroni’s post-test. See also Figure S2.
To further explore this idea, we used CRISPR-directed mutations to test whether hypoxia can rescue loss of any other component of the auxiliary or core ISC machinery. To this end, we tested the effects of hypoxia on the growth of cells knocked out for ISCU, NFS1 and LYRM4, all core components of Fe-S cluster assembly machinery (Figure 2C and Figure S2C), as well as GLRX5, HSCB, and CIAO3, which take part in the Fe-S cluster transfer to proteins in the mitochondria or cytosol (Figure 2D and Figure S2C). Of the auxiliary proteins, GLRX5 exhibited O2-dependent essentiality, while HSCB was partially rescued by 1% O2. Amongst the core machinery, however, only FXN exhibited O2-dependent essentiality. This result implies that enzymatically mediated Fe-S cluster biosynthesis is still essential under hypoxia, and that FXN is uniquely dispensable among the mitochondrial quaternary complex required for Fe-S cluster assembly under hypoxia.
FXN has been demonstrated to act as an allosteric activator of NFS1, accelerating a rate limiting sulfur transfer step (Bridwell-Rabb et al., 2014; Parent et al., 2015). In yeast, loss the FXN homolog can be complemented by a mutant of the yeast homolog of ISCU- ISU1M140I -that has been proposed to enhance NFS1 persulfide formation (Yoon et al., 2012; Yoon et al., 2014). However, we find that in human cells, overexpression of either ISCU or the ISCUM140I mutant failed to rescue the growth defect of FXN KO cells (Figure 2E and Figure S2D). Overexpression of NFS1 or LYRM4 also failed to complement loss of FXN (Figure 2E). Of note, overexpression of NFS1 results in a growth increase that is evident in both WT and FXN KO cells, in line with a recent report demonstrating that NFS1 amplification is prevalent in lung tumors, aiding in the survival of the tumor in this high O2 environment (Alvarez et al., 2017). Finally, overexpression of a CRISPR resistant form of FXN fully restored the growth of FXN KO cells, demonstrating that expression of FXN is directly responsible for the observed growth defect and excluding the possibility of off-target effects.
Hypoxia restores steady state levels and activity of Fe-S cluster containing proteins in FXN KO cells
A key question is whether the steady state levels of Fe-S clusters in FXN null cells are rescued by hypoxia. To address this point, we assayed for Fe-S cluster-dependent proteins and processes in FXN null cells under hypoxic conditions. We find that in 21% O2, FXN KO cells exhibit reduced steady state levels of Fe-S cluster-dependent proteins and reactions both in the mitochondria and the cytosol, based on assays of five different Fe-S-dependent pathways: (i) aconitase activity, in which the [4Fe-4S] cluster functions in both substrate binding and catalysis (Figure 3A); (ii) stabilization of complexes I and II of the respiratory chain (Figure 3B and Figure S3A), which contain both [2Fe-2S] and [4Fe-4S] clusters; (iii) mitochondrial oxidative phosphorylation which is dependent on functionally active complexes I and II (Figure S3B–C); (iv) synthesis and conjugation of lipoic acid by LIAS to its target proteins (PDH E2, KGDH E2, GCSH), in which the [4Fe-4S] cluster is utilized as a sulfur donor (Figure 3C); (v) the final enzyme of the heme biosynthesis pathway (FECH) and nuclear DNA polymerase delta (POLD1), which are structurally stabilized by a [2Fe-2S] and a [4Fe-4S] cluster, respectively (Figure 3D–E and Figure S3D–E). Deficiencies in all five measures, which reflect different types of Fe-S clusters and subcellular localizations, are restored when FXN null cells are grown in low O2, but not upon forced stabilization of the HIF pathway in 21% O2 with FG-4592 (Figure 3A–E). The most parsimonious explanation for the rescue of viability is that hypoxia directly restores the steady state levels and activity of Fe-S clusters in cells lacking FXN.
Figure 3-. Steady state levels of Fe-S containing proteins are restored when FXN null cells are grown in hypoxia.

(A) Aconitase activity assay from control or FXN KO K562 cells grown in 21% O2, 1% O2 or 21% O2 with 75μM FG-4592. Bar plots show mean ± SD. ****=p < 0.0001. One-way ANOVA with Bonferroni’s post-test. (B) Immunoblot of control or FXN KO cells grown in 21% O2, 1% O2 or 21% O2 with 75μM FG-4592, blotted for OXPHOS subunits or Tubulin. (C) Immunoblot of control or FXN KO cells grown in 21% O2, 1% O2 or 21% O2 with 75μM FG-4592, blotted for Lipoic acid, which is conjugated to PDH-E2, KGDH-E2 and GCSH. Additional blots against OGDH (i.e. KGDH-E1) and Actin. (D) Immunoblot of control or FXN KO cells grown in 21% O2, 1% O2 or 21% O2 with 75μM FG-4592, blotted against enzymes in the heme biosynthesis pathway- FECH and ALAD- or TOMM20. (E) Immunoblot of control or FXN KO cells grown in 21% O2, 1% O2 or 21% O2 with 75μM FG-4592, blotted against POLD1, MMS19 or Actin. See also Figure S3.
In-vitro reconstitution reveals FXN and hypoxia independently activate ISC biogenesis
While the above studies demonstrate that hypoxia restores steady state levels of Fe-S cluster proteins in FXN null cells, it is unclear whether hypoxia acts by boosting Fe-S cluster biosynthesis or suppressing Fe-cluster degradation. To directly test these two options, we turned to an in-vitro reconstitution assay. This system utilizes purified human ISCU, NFS1, LRYM4 and FXN, together with E. coli ACP (the homolog of NDUFAB1), to analyze the formation and stability of Fe-S clusters under aerobic or anaerobic conditions. First, to monitor the stability of Fe-S clusters formed on the ISCU scaffold, clusters were synthesized under anaerobic conditions and then aerobic buffer was added to the reaction mixture containing [2Fe-2S] loaded ISCU for one hour. Subsequently, the [2Fe-2S] loaded ISCU was exposed to air and cluster integrity was monitored for half an hour using circular dichroism (CD) spectroscopy. Interestingly, the [2Fe-2S] clusters bound to ISCU remain stable under aerobic conditions, and the presence or absence of FXN did not affect this stability (Figure 4A). Similarly, ISCU bound [2Fe-2S] clusters were stable under anaerobic conditions over the course of 60 mins (Figure S4). By comparison, the well-studied degradation of the [4Fe-4S] cluster on the transcription factor FNR occurs within 1–5 mins of ambient oxygen exposure (Achebach et al., 2005; Crack et al., 2004; Sutton et al., 2004). It should be noted that multiple factors affect cluster degradation, including the solvent accessibility of the cluster, as well as the nature of the cluster itself. Namely, [4Fe-4S] clusters, which are formed downstream of ISCU, are considered to be more O2 labile than the [2Fe-2S] clusters that are formed on ISCU (Andreini et al., 2017).
Figure 4-. In vitro Fe-S synthesis is activated by FXN and anoxia.

(A) CD intensity at 330 nm vs time of reaction for [2Fe-2S] cluster stability on ISCU-NFS1-LYRM4-ACPec complex without (left) and with (right) FXN. Clusters were generated under anaerobic conditions, and then exposed to aerobic buffer and ambient air. (B) CD intensity at 330 nm vs time of reaction for [2Fe-2S] cluster formation on ISCU-NFS1-LYRM4-ACPec complex without (left) and with (right) FXN. Clusters were formed under anaerobic or aerobic conditions. (C) Synthesis rate constants for [2Fe-2S] cluster formation on ISCU-NFS1-LYRM4-ACPec complex without (left) and with (right) FXN, under aerobic on anaerobic conditions. Data are represented as mean ± SD. **=p < 0.01, ***=p < 0.001, ****=p < 0.0001. One-way ANOVA with Bonferroni’s post-test. See also Figure S4.
Next, we sought to investigate the effects of O2 on the biosynthesis of the Fe-S cluster. Cluster synthesis rates were monitored in the presence or absence of FXN and O2 using CD spectroscopy (Figure 4B–C). As shown previously (Fox et al., 2015b), FXN accelerates but is not required for [2Fe-2S] cluster synthesis under anaerobic conditions. The presence of O2 inhibits cluster formation, both in the presence and absence of FXN (Figure 4C). This finding indicates that hypoxia increases the rate of human [2Fe-2S] cluster formation, in a manner that is independent of FXN, explaining why either FXN or hypoxia result in similar steady state Fe-S levels in cells.
Signaling events associated with FXN loss are normalized in hypoxia
We next sought to determine whether hypoxia alleviates the cellular signaling events associated with FXN deficiency that are believed to contribute, in part, to its pathogenesis. Biopsy material from FRDA patients and from model systems have identified a number of signaling pathways that are altered upon depletion of FXN, including activation of both the ATF4-dependent integrated stress response (Huang et al., 2013; Lu and Cortopassi, 2007), and loss of anti-oxidant NRF2 signaling (Anzovino et al., 2017; Shan et al., 2013). Furthermore, loss of FXN expression leads to activation of the iron response (Huang et al., 2009; Michael et al., 2006), which stabilizes the iron response protein 2 (IRP2) and leads to dramatic iron accumulation (Whitnall et al., 2012). We observe that FXN KO cells recapitulate all of these stress responses, and the respective silencing and activation of NRF2 and ATF4 are fully rescued by hypoxia (Figure 5A–B and Figure S5A). The mechanism by which NRF2 protein expression is lost in FXN KO cells cultured in normoxia remains unclear, as NRF2 mRNA and KEAP1 protein levels are similar to control cells cultured in normoxia (Figure S5B,C). In contrast, the iron response is activated upon loss of FXN in both hypoxia and normoxia, and is also activated in control cells under hypoxia, although to a lesser extent (Figure 5B and Figure S5D). It should be noted cytosolic aconitase can also function as an additional iron response protein, IRP1, when its Fe-S cluster is damaged. However, as shown above, aconitase activity, which is dependent on the presence of an Fe-S cluster, is restored in 1% O2 (Figure 3A). To begin to understand the Fe-S associated defects that trigger these signaling pathways, we examined them in the absence of additional components of the mitochondrial and cytosolic Fe-S cluster synthesis pathway (Figure S5E). These KO lines indicate that ATF4 signaling is activated by loss of a mitochondrial Fe-S containing protein, NRF2 loss is the result of a cytosolic Fe-S cluster protein, while the nature of the trigger that activates IRP2 signaling remains unclear. Together, these studies demonstrate that hypoxia is capable of restoring some of the signaling events associated with loss of FXN, most likely due to the restoration of the underlying defect, i.e. Fe-S cluster synthesis.
Figure 5-. Signaling pathways activated in FXN KO cells are restored in hypoxia.

(A) Immunoblot of control or FXN KO cells grown in 21% O2 or 1% O2, blotted for the integrated stress response transcription factor ATF4 or Actin. Asterisk indicates a non-specific band. (B) Immunoblot of control or FXN KO cells grown in 21% O2 or 1% O2, blotted for iron response protein IRP2, antioxidant response regulator NRF2, or Actin. (C) Schematic for IRP2 degradation, which is mediated by FBXL5 and is regulated by iron and oxygen. When IRP2 is stabilized, it activates iron uptake pathways and represses iron storage pathways. (D) Immunoblot of control or FXN KO cells grown in 21% O2 or 1% O2, blotted for Ferritin-H, a target of IRP2. Additional blot against Actin. (E) Three-day proliferation assay of control, FXN KO or FBXL5 KO cells in 21% O2 or 1% O2. (F) Three-day proliferation assay of control, FXN KO, IRP2 KO or double IRP2 FXN KO cells in 21% O2 or 1% O2. (G) Immunoblot of control, FXN KO, IRP2 KO or double IRP2 FXN KO cells in 21% O2 or 1% O2, blotted for Lipoic acid. Additional blot against TIMM23. All bar plots show mean ± SD. ***=p < 0.001, ****=p < 0.0001. One-way ANOVA with Bonferroni’s post-test. See also Figure S5.
Hypoxia places the iron response in its appropriate environmental context and provides bioavailable iron for Fe-S cluster synthesis
While ATF4 activation and NRF2 inactivation in FXN null cells are fully reversed by hypoxia, the situation is more nuanced for IRP2 signaling, and reveals an additional mechanism by which hypoxia may be bypassing the genetic requirement for FXN. In vivo, IRP2 signaling has been shown to be the dominant pathway governing iron homeostasis (Meyron-Holtz et al., 2004a). IRP2 has been shown to be activated by FXN deficiency (Li et al., 2008; Whitnall et al., 2012), but it is also known to be physiologically activated by hypoxia (Hanson et al., 1999; Meyron-Holtz et al., 2004b). IRP2 is the primary and direct target of the ubiquitin ligase FBXL5, which is a direct sensor for both iron and O2 (Figure 5C) (Salahudeen et al., 2009; Thompson et al., 2012; Vashisht et al., 2009). In iron depleted or hypoxic conditions, the iron response suppresses iron storage mechanisms while at the same time upregulating iron uptake systems. Indeed, FXN KO cells contain lower levels of the ferritin-H iron storage protein (Figure 5D and Figure S5F), consistent with the iron response being activated in these cells. Additionally, the quenchable mitochondrial fluorescent Fe2+ sensor, RPA, shows that mitochondrial Fe2+ concentrations are elevated in control cells grown in hypoxia, as well as FXN KO cells grown in both normoxia and hypoxia (Figure S5G). RPA is membrane potential-dependent, but loss of mitochondrial membrane potential cannot account for these differences, as the membrane potential is elevated upon FXN loss (Figure S5H). Collectively, these results indicate that the iron response is activated upon FXN loss, and that in wild type cells, hypoxia activates this response as well.
We hypothesized that while hypoxia is a physiological trigger for the iron response, its activation by FXN deficiency in normoxic environment may actually be harmful. Fe2+ can catalyze the Fenton reaction, generating hydroxyl radicals as well as Fe3+, which is not bio-available. Indeed, FBXL5 KO cells, in which IRP2 and the iron response would be stabilized independently of O2 levels, grew poorly in 21% O2 but grew comparably to control cells under 1% O2 (Figure 5E and Figure S5I). Therefore, forced IRP2 stabilization and iron loading is toxic under normoxia. Next, we assayed the effects of iron signaling in FXN KO cells in the context of high or low O2 (Figure 5F and Figure S5J). In line with our previous result (Figure 5E), we found that the double knockout (DKO) of IRP2-FXN grew significantly better at 21% O2 than the single FXN KO (Figure 5F). In stark contrast, under 1% O2, IRP2 KO cells grow poorly, and the DKO IRP2-FXN grew significantly worse (i.e. synthetic lethal) (Figure 5F). To further bolster this link between iron uptake and the growth of FXN null cells, we also examined the genetic interactions between FXN and the ferroreductase STEAP3, which is essential for iron uptake (Ohgami et al., 2005; Ohgami et al., 2006) (Figure S5K and L). This STEAP3-FXN DKO phenocopied the IRP2-FXN DKO. Collectively, these studies indicate that iron-loading is detrimental under normoxic conditions, but beneficial for all cells, and FXN-null cells in particular, under hypoxia.
It remained unclear whether the interaction between iron uptake and FXN was due to a direct effect on Fe-S synthesis, as iron is a substrate of that reaction, or whether it was caused by an indirect mechanism. To gain additional clarity, we analyzed LIAS activity in the IRP2 and FXN single or DKO, as a proxy for Fe-S cluster biogenesis (Figure 5G). Under normoxia, the DKO IRP2-FXN does not have more LIAS activity than the FXN KO, while under hypoxia the DKO shows lower amounts of conjugated lipoic acid. These results indicate that the partial growth rescue of the DKO at 21% O2 is not caused by a boost in Fe-S biosynthesis. Rather, under normoxia, iron uptake most likely triggers a secondary cellular complication, such as the Fenton reaction. In contrast, the deficiency in LIAS activity in the DKO grown at 1% O2 indicates that Fe-S clusters biogenesis in the absence of FXN depends in part on the elevated levels of bioavailable iron. Collectively, these findings indicate that the activation of the iron response in FXN KO cells is Janus faced: it appears to be adaptive under hypoxic conditions by providing more bioavailable iron for Fe-S synthesis, while under normoxic conditions it appears maladaptive.
Frataxin null C. elegans are viable and complete their entire life cycle under hypoxia
Our cellular and in vitro studies support the hypothesis that low O2 may alleviate the biochemical defects that underlie FRDA. To explore the therapeutic potential of hypoxia in a whole animal, we turned to the nematode C. elegans. Although partial knockdown of FXN is compatible with animal life (Miranda et al., 2002), whole body knockout has never been achieved in 21% O2 (Cossee et al., 2000). Consistent with this, C. elegans mutants homozygous for a null allele of frataxin (frh-1 in C. elegans) are sterile, and can only be propagated as a balanced heterozygote in 21% O2 (Figure 6A). However, when animals were incubated at 1% O2, the frh-1(tm5913) mutant produced viable progeny and could be grown as a homozygote indefinitely (Figure 6B and C), demonstrating that hypoxia can bypass the need for FXN in a multicellular animal. The frh-1(tm5913) animals grown at 1% O2 were developmentally delayed and produced fewer progeny than wild type animals, but were otherwise grossly normal. In contrast, C. elegans strains carrying null alleles of NFS-1 or ISCU-1 arrested development and were sterile at both 21% and 1% O2 (Figure 6C). Thus, among the core components of iron sulfur cluster assembly in C. elegans, FRH-1 is uniquely dispensable for growth in hypoxia.
Figure 6-. FXN is dispensable for viability and Fe-S cluster biogenesis in C. elegans in hypoxia.

(A) The C. elegans frataxin null mutant, frh-1(tm5913), carries a 353 bp deletion and must be propagated as a balanced heterozygote at room air. (B) When incubated at 1% O2 frh-1(tm5913) mutants develop to adulthood and are fertile. Pictured are wild type animals grown for 2 days and frh-1(tm5913) mutants grown for 4 days. Scale bar = 3 mm. (C) Total progeny produced from animals incubated at 21% O2 or 1% O2. Mothers were balanced heterozygotes (mutant/+). (D) Immunoblot for lipoic acid in animals grown at 1% O2 or animals shifted as adults to normoxia for the indicated time. (E) hsp-6::gfp fluorescence in animals grown in 1% O2 or shifted to normoxia as adults for 4 days. Exposure time = 50 ms, scale bar = 500 μm. (F) Animal length after 4 days growth at 21% or 50% O2. Mothers were balanced heterozygotes frh-1(tm5913)/+. (G) Animal length after 3 days growth in hyperoxia. Mothers were balanced heterozygotes frh-1(tm5913)/+. All error bars represent standard deviation. *=p < 0.05, **=p < 0.01, ***=p < 0.001, ****=p < 0.0001. One-way ANOVA with Bonferroni’s post-test. See also Figure S6.
To better understand the nature of the frh-1 rescue by hypoxia in C. elegans, we shifted adult frh-1(tm5913) mutants that had been growing at 1% O2 for many generations to 21% O2. After both 4 days and 6 days under this higher O2 regimen, these animals showed a marked decrease in Fe-S cluster synthesis, as assayed by lipoic-acid conjugated proteins (Figure 6D), as well as a dramatic induction of the mitochondrial stress response, as indicated by a hsp-6::gfp transcriptional reporter (Figure 6E). These results indicate both that FRH-1 null C. elegans are competent for Fe-S cluster biosynthesis in hypoxia, and that this ability is lost in normoxia. C. elegans prefer oxygen concentrations close to 8% (Gray et al., 2004) in line with oxygen tensions associated with their bacterial food. We tested whether frataxin null mutants would survive at the more physiological 5% O2, and found that they did not develop to adulthood and did not produce viable progeny (Figure S6A). We therefore conclude that frataxin null C. elegans would not survive in their physiological oxygen environment (5–8%), and require 1% oxygen to bypass the need for frataxin, concordant with our findings in human cells (Figure S1A). The rescue by hypoxia is not the result of activation of the HIF pathway, as animals double mutant for frh-1 and vhl-1 failed to grow at 21% oxygen, and in fact grew slightly worse at 1% O2 compared to the frh-1 mutant alone (Figure S6B).
Interestingly, when young frh-1(tm5913) larvae were shifted from 1% to 21% O2, they arrested development immediately (Figure S6B) in contrast to frh-1(tm5913) mutants propagated at 21% O2 with the use of balancer chromosome, which as mentioned above develop to sterile adults at normoxia. We hypothesize that the disparity arises from maternal rescue: the frh-1(tm5913) larvae grown at normoxia are born from frh-1(tm5913)/+ mothers, and may be provided with wild-type frh-1 mRNA or protein that permits development to sterile adulthood. As the maternally contributed protein is depleted throughout development, animals likely become deficient in ISC biogenesis. When such maternally rescued mutants of FRH-1, NFS-1, or ISCU-1, or the mitochondrial ISC handoff proteins GLRX-5 and LPD-8 (homolog of NFU1), are incubated in 1% O2 from hatching, all are improved, progressing further in development than they do in normoxia (Figures S6C–D). Additionally, when maternally rescued mutants of FRH-1 are incubated in 50% oxygen – a concentration that does not affect growth of wild type animals – their growth defect is severely exacerbated (Figure 6F). Taken together, these results show that oxygen levels can suppress or enhance the effects of impaired ISC biogenesis in many genetic contexts, possibly due to modulating the rate of ISC degradation. This supports our in vitro findings that the effects of hypoxia and the core ISC biogenesis machinery may be independent.
Finally, we sought to determine whether the growth arrest associated with loss of FRH-1 in C. elegans is attributable to loss of ISC biogenesis in any specific tissue. To this end, we expressed frh-1 cDNA under the control of heterologous promoters that drive expression in defined tissues in the frh-1(tm5913) mutant (Figure 6G). cDNA expressed in all somatic tissues completely rescued the FRH-1 mutant, allowing it to reproduce at normoxia, confirming frh-1(tm5913) as the mutation causing the O2-sensitivity phenotype. FRH-1 expression exclusively in either the neurons, intestine, muscle, or hypodermis were all unable to produce a viable strain at normoxia, indicating that no single tissue is sufficient for complete rescue. However, FRH-1 expression in many single tissues improved development of frh-1(tm5913) mutants when shifted to high oxygen, demonstrating that multiple somatic tissues may contribute additively to the pathology of frataxin loss.
Environmental oxygen modifies the progression of ataxia in a mouse model of FRDA
Given that cellular and C. elegans models indicated that hypoxia can alleviate the outcomes of FXN deficiency, we next sought to test whether environmental oxygen influences the disease course of a murine model of FRDA. We utilized a recently generated inducible mouse model of FRDA that faithfully recapitulates many of the features of this disease (Chandran et al., 2017), notably ataxia. By employing a doxycycline-inducible shRNA targeting frataxin (shFXN), a whole-body knock-down of FXN is achieved, thereby circumventing the embryonic lethality that is associated with a congenital FXN knockout (Cossee et al., 2000) while at the same time not restricting the analysis to a single tissue.
We sought to test whether chronic exposure to hypoxia could alleviate FRDA pathology, with a particularly keen interest in ataxia. Ataxia is the defining clinical feature of FRDA, is 100% penetrant, and most patients will lose their ability to walk unsupported within 10–15 years of disease onset (Parkinson et al., 2013). Using doxycycline treatment, we achieved efficient depletion of FXN in disease-relevant tissues (Figure 7A). Upon the initiation of doxycycline treatment, mice were housed in either 11% oxygen (equivalent to 5000 meter elevation) or at 21% oxygen (equivalent to sea level). Wild type and shFXN mice could mount an effective hypoxic response as evidenced by an elevated hematocrit (Figure 7B), although shFXN mice show mild anemia at baseline. Control or shFXN mice were assessed by motor behavioral tests that can reveal deficiencies in grip strength, balance, motor coordination, and gait. At 12 weeks following doxycycline treatment, the earliest time point at which shFXN mice have previously been reported to display motor-behavioral deficiencies (Chandran et al., 2017), shFXN mice housed in 21% O2 exhibited significant motor impairment compared to WT counterparts as measured by inverted screen test, accelerating rotarod and gait footprint analysis (Figure 7C–D and Figure S7B). Strikingly, shFXN mice housed in chronic 11% hypoxia performed significantly better than their normoxic shFXN counterparts. This attenuation of ataxia was also observed in mice at a later time point (Figure S7C–E). These improvements cannot be attributed to differences in body weight, as shFXN mice housed in normoxia or hypoxia bore similar weights (Figure S7A).
Fig 7-. Hypoxia attenuates and hyperoxia hastens ataxia in a FRDA mouse model.

(A) Immunoblot from brain and heart of WT and shFXN mice housed in 21% O2 or 11% O2 at week 12, blotted for FXN and Actin. (B) Hematocrit measurements from WT and shFXN mice housed in 21% O2 or 11% O2 at week 8 (n≥ 3 per group). (C) Inverted screen test analysis for WT or shFXN mice housed in 21% O2 or 11% O2 at 12 weeks. Time to fall is represented (n≥ 7 per group). (D) Accelerating rotarod analysis for WT or shFXN KD mice housed in 21% O2 or 11% O2 at 12 weeks. Latency to fall measured as mean value of triplicate trials per mouse (n≥ 7 per group). (E) Representative images of Purkinje cell layer stained with parvalbumin, PCP-2 and Hoechst 33342 from WT or shFXN mice housed in 21% O2 or 11% O2. Scale bar = 30μm. (F) Inverted screen test analysis for WT or shFXN mice housed in 21% O2 or 55% O2 at 6 weeks. Time to fall is represented (n≥ 5 per group). (G) Accelerating rotarod analysis for WT or shFXN mice housed in 21% O2 or 55% O2 at 6 weeks. Latency to fall measured as mean value of triplicate trials per mouse (n≥ 5 per group). (H) Survival of WT or FXN knockdown (shFXN) mice housed in 21% O2 or 11% O2 (n=10 per group). (I) Quantification of corrected QT interval, as observed by ECG, of WT or shFXN mice housed in 21% O2 or 11% O2 at 12 weeks (n≥ 3 per group). All bar plots show mean ± SD. *=p < 0.05, **=p < 0.01, ***=p < 0.001, ****=p < 0.0001. One-way ANOVA with Bonferroni’s post-test. See also Figure S7.
We complemented these neurobehavioral studies with histopathology studies, with a focus on cerebellar Purkinje cells, which are enriched for FXN protein expression (Lin et al., 2017). Purkinje cells have previously been shown to undergo notable injury and axonal remodeling in post-mortem samples from FRDA patients (Kemp et al., 2016; Koeppen, 1991) as well as in mouse models of FRDA (Lin et al., 2017). Consistent with previous studies (Chandran et al., 2017; Kemp et al., 2016), Purkinje cell number was unchanged in this model both at normoxia and at hypoxia. Moreover, the expression of a general marker of Purkinje cells, PCP-2, was not altered between control and shFXN animals (Figure 7E). We examined Purkinje cells for alterations in the expression of parvalbumin, a calcium binding protein which regulates neuronal firing properties (Vreugdenhil et al., 2003) that has recently been reported to be reduced in cerebellar Purkinje cells of a different mouse model of FRDA (Lin et al., 2017). Indeed, parvalbumin expression was reduced in shFXN mice housed in normoxia (Figure 7E and Figure S7F), and the reduction in parvalbumin was blunted in mice breathing 11% oxygen. No differences in parvalbumin staining were observed in the primary visual cortex among the various groups (Figure S7G). These histopathological findings, together with our motor-behavioral results, indicate that hypoxia is capable of blunting neurological disease in this FRDA mouse model.
Given that chronic hypoxia is able to attenuate the progression of ataxia, we asked whether breathing chronic hyperoxia accelerates neurological disease. To this end, we housed the shFXN mice (or WT controls) in chronic normoxia or hyperoxia (i.e. 55% O2) from the onset of doxycycline treatment. Indeed, when we tested these shFXN mice that had been housed in 55% O2 for 6 weeks – a time point at which these models typically do not yet show motor-behavioral phenotypes – ataxia symptoms were evident based on the inverted screen test and accelerating rotarod performance (Figure 7F–G). However, shFXN mice housed in normoxia score similarly to WT animals at this early 6 week time point during motor-behavioral tests (Figure 7F–G), as has been reported previously (Chandran et al., 2017). Thus, it appears that breathing hyperoxia accelerates ataxia in this murine model.
While hypoxia has a striking effect on the ataxia phenotype, it did not impact overall survival, which is likely driven by cardiac pathology. shFXN mice housed in normoxia or hypoxia had similarly reduced survival rates (Figure 7H), either fulfilling criteria for humane euthanasia or dying at a median time point of ~15 weeks post-doxycycline initiation. It was previously shown that this mouse model develops cardiac pathology, as evidenced by QT interval prolongation and cardiomyopathy (Chandran et al., 2017). Neither of these features, based on electrocardiogram analysis or echocardiography, were improved by breathing 11% O2 (Figure 7I and Figure S7H–J). Hence, while hypoxia was beneficial for improving ataxia in this shFXN mouse model, it did not affect the progression of cardiac pathology. It is notable that we recently reported that while hypoxia is capable of preventing neurological disease in a mouse model of Leigh syndrome, it was not sufficient to prevent the cardiomyopathy that subsequently arose in these mice (Ferrari et al., 2017). In both syndromes, however, it is the neurological disease that underlies most of the morbidity.
Discussion
FXN is a highly conserved protein that is classically described as an essential protein in eukaryotes, as the deletion of FXN is lethal in yeast, mammalian cells, and mice (Calmels et al., 2009; Cossee et al., 2000; Poburski et al., 2016; Wilson and Roof, 1997). Here we report the generation of continuously growing yeast, human cells and nematodes fully lacking FXN by incubating them in hypoxia. FXN is the only component of the core ISC biogenesis machinery that is rescued by hypoxia, both in cell culture and in C. elegans. This finding indicates that enzymatic ISC biogenesis is essential for life even under hypoxic conditions, and demonstrates that this pathway continues to function even in the absence of FXN. There have been conflicting findings as to whether the presence of FXN is a prerequisite for the formation of Fe-S clusters through the ISC pathway (2018; Fox et al., 2015a; Freibert et al., 2017; Webert et al., 2014). Our work provides compelling support for the notion that the mitochondrial ISC pathway is indeed capable of operating without FXN, helping to resolve this controversy.
Reactive oxygen species such as H2O2 and superoxide have been invoked as a potential drivers of FRDA (reviewed in (Gomes and Santos, 2013)). Elevated levels of reactive oxygen species can stem from both higher intracellular iron concentrations, which can catalyze the Fenton reaction, as well as the paradoxical loss of the antioxidative stress response pathway in FXN null cells (Anzovino et al., 2017; Shan et al., 2013). Although multiple clinical studies have evaluated the therapeutic potential of antioxidants for FRDA, none have demonstrated proven benefit for the neurological symptoms (Kearney et al., 2016). Moreover, cell-culture studies have also called into question whether antioxidant treatment is beneficial for cells depleted of FXN (Lu et al., 2009). The current work proposes dioxygen itself as a toxin in the context of FXN deficiency. To our knowledge, no previous study has established that oxygen itself can be an important environmental modifier in animal models of FRDA.
The ability of hypoxia to rescue FXN deficiency is reminiscent of our previous study demonstrating that hypoxia is capable of alleviating proliferative defects and pathology in cellular models and a mouse model of complex I deficiency (Jain et al., 2016). On its face these two results sound similar – both are mitochondrial defects, both rescued by hypoxia. However, there are important differences between these two phenomena. While the proliferative defects in ETC deficient cells can be rescued by forced activation of the HIF response pathway, FXN deficiency cannot. Moreover, it is important to note that ETC defects typically do not exhibit generalized defects in Fe-S biosynthesis. Our findings suggest that hypoxia may be rescuing these two types of mitochondrial defects by distinct mechanisms.
Our current work identifies multiple HIF-independent mechanisms by which hypoxia is able to rescue FXN deficiency in cultured cells (Figure S7K). First, hypoxia directly stimulates ISC biogenesis on ISCU, mirroring the allosteric activation by FXN. Why is ISC biogenesis sensitive to oxygen? Oxidation of cysteine, either the substrate, the NFS1 sulfur-transfer loop residue, or an ISCU cluster binding ligand, could inhibit cluster synthesis. Moreover, oxygen-dependent oxidation of Fe2+ or the electron donation system (Webert et al., 2014), which each provide electrons for sulfur reduction, could explain the decreased rate of [2Fe-2S] cluster biosynthesis. A second mechanism of hypoxic rescue seems to involve the interplay between oxygen and iron availability. Hypoxia physiologically activates the iron response and increases bioavailable iron to boost Fe-S cluster biosynthesis. While this signaling cascade is activated upon FXN loss, we find that oxygen partial pressure dictates whether this response will be beneficial (as in hypoxia) or damaging (as in normoxia). In addition to these two new mechanisms identified in the current paper, we note that Fe-S clusters, especially [4Fe-4S] clusters, are naturally O2 labile (Andreini et al., 2017), and hypoxia likely delays their degradation, hence decreasing the demand for de novo ISC biogenesis.
Gene:environment interactions are widely appreciated in the etiology of common diseases, such as diabetes, obesity, and cancer, but receive far less attention in the consideration of Mendelian diseases. Our observations that low oxygen levels can attenuate, and high oxygen levels can hasten, neurological disease in a mouse model of FRDA have important clinical implications. First, from a therapeutic perspective it predicts that agents that reduce oxygen delivery or ambient oxygen may have therapeutic potential for FRDA, similar to our observations for complex I deficiency and Leigh syndrome. While hypoxia attenuates ataxia in this FRDA mouse model, it does not appear to impact cardiac pathology. It is notable that in humans, the majority of the morbidity is due to neurological degeneration, which tends to be highly penetrant in this disease. Given that hypoxia itself can be extremely dangerous, future challenges lie in identifying safe and practical strategies by which oxygen delivery can be reduced. Second, and perhaps of more immediate relevance, our work predicts that high oxygen exposure may in fact be detrimental to patients with FRDA. Supplemental oxygen is often considered to cause no harm, though recent large-scale meta analyses and randomized control trials are suggesting that excess supplemental oxygen may be detrimental in the intensive care unit (Chu et al., 2018; Girardis et al., 2016). It will be important to perform retrospective analyses to determine whether oxygen exposure correlates with disease progression in FRDA patients. At present, why FRDA presents with such tissue-specific pathology and variability between patients in the timing of disease progression is not clear. Oxygen may represent a key parameter that can help to explain the tissue specificity and variable penetrance of this disease.
Experimental procedures
Contact for Reagent and Resource Sharing
Further information and requests for resources and reagents should be directed to and will be fulfilled by the Lead Contact, Vamsi K. Mootha (vamsi@hms.harvard.edu).
Experimental Model and Subject Details
Cell Lines
K562 (female) and HEK293T (female) cells were obtained from the ATCC and maintained in DMEM (GIBCO) with 25 mM glucose, 10% fetal bovine serum (FBS, Invitrogen), 4mM Glutamine, 1 mM sodium pyruvate, 50 mg/mL uridine, and 100 U/mL penicillin/ streptomycin under 5% CO2 at 37°C. When necessary, K562 cells were selected with 2 μg/ml puromycin (GIBCO) or 500ug/ml Geneticin (GIBCO), and HEK293T cells were selected with 1 μg/ml puromycin (GIBCO). Cell lines were authenticated by STR profiling (ATCC). Cells were tested to ensure absence of mycoplasma by PCR-based assay once every 3 months. Lymphoblast cell lines (LCLs) were obtained from the Coriell Institute for Medical Research and were cultured in RPMI1640 (GIBCO), supplemented with 15% FBS, 2mM Glutamine and 100 U/mL penicillin/ streptomycin under 5% CO2 at 37C. The following age and sex matched LCLs were used for healthy controls: GM14512, GM14529, GM14530, GM14581, GM14582; and for FRDA Patients: GM15850, GM16203, GM16214, GM16228, GM16798. For hypoxic growth, air tanks corresponding to 1% O2, 5% CO2 (balanced nitrogen) were purchased from Airgas. Cell culture plates were placed in hypoxic chambers (Billups-Rothenberg), sealed and flushed with 1% O2 for 5mins. Hypoxic chambers were then placed in 37°C incubators. For experiments involving 5% oxygen, cells were placed in incubators 37°C, attached to a liquid nitrogen tank which pulsed N2, and maintained in 5% O2 and 5% CO2.
Cells were treated with the following drugs: 75μM FG-4592 (Cayman Chemical Co Inc), 5nM,50nM and 500nM of Mito-TEMPO (Cayman Chemical Co Inc), 5μM, 50μM and500μM NAC (Cayman Chemical Co Inc), 1μM,10μM and 100μM Mn(III)TBAP (Cayman Chemical Co Inc).
Yeast strains and strain construction
All yeast strains in this study are based on the BY4741a laboratory strain (Brachmann et al., 1998). Cultures were grown at 30°C rich medium - 1% Yeast Extract, 2% Tryptone (Casein Peptone) and 2% glucose (Sunrise Science). For hypoxic growth, the media were supplemented with 2 μg/ml ergosterol (Sigma) in 1:1 Tween 80:ethanol as a source of unsaturated fatty acids. When needed as a selection marker, Nourseothricin (Nat) (200μg/ml WERNER BioAgents) were added to the media. The Δyfh1 strain was generated using the pfa6a-NATMX6 cassette (Goldstein and McCusker, 1999) using a standard PEG/LiAC protocol (Gietz and Woods, 2002), and was immediately placed under hypoxic conditions following recovery.
For genomic PCR, cells were incubated in 20mM NaOH + 0.1 mg/mg RNAse A at 95°C for 20 minutes. Samples were then centrifuged at 5000rpm and 1μl of extract was used for a 10μl verification PCR (KAPA 2G Robust, KAPA Biosystems). The following primers were used- YFH1: 5’ATGATTAAGCGGTCTCTCGC and 5’CCAATGTCATTACGCCATGG ACT: 5’GAAATGCAAACCGCTGCTCA and 5’GAGCCAAAGCGGTGATTTCC.
C. elegans strains and assays
C. elegans strains were maintained on E. coli OP50 grown on NGM plates (Brenner Genetics 1974). Strains were generously provided by the Caenorhabditis Genetics Center (which is supported by the NIH, Office of Research Infrastructure Programs P40 OD010440) and the Mitani Lab through the National Bio-Resource Project of the MEXT, Japan. Growth in hypoxia was achieved by incubating animals in a Hypoxic In Vitro Cabinet (Coy Laboratory Products Inc.) at 1% oxygen at room temperature. For assays in which a synchronized population of animals was required, strains were egg-prepped in bleach and arrested overnight in M9 buffer at the L1 larval stage. For a complete list of strains used in this study see below. For generation of transgenic animals, the frh-1 cDNA was cloned from cDNA generated with Invitrogen Superscript III and subsequently fused to the promoters of dpy-30 (all somatic tissues), vha-6 (intestine), col-10 (hypodermis), myo-3 (muscle), and sng-1 (neurons) in the Bluescript vector. Plasmids were then injected into animals at a concentration of 2 ng/μl along with the co-injection marker ofm-1::gfp (50 ng/μl) and NEB 1kb ladder (50 ng/μl). Three independent transgenic lines were analyzed for each construct. To measure animal length, images were acquired using a ZEISS Axio Zoom V16 microscope with ZEN PRO software and the midline of individual animals was quantified in FIJI software. To measure hsp-6::gfp fluorescence, animals were mounted on agar pads, immobilized in sodium azide, and imaged at 70x magnification.
List of C. elegans strains used in this study
| N2 | wild type |
|---|---|
| GR3073 | frh-1(tm5913) II |
| FX16013 | frh-1(tm5913)/mIn1 II |
| FX19065 | iscu-1(tm4696)/nT1 IV |
| FX19074 | iscu-1(tm4941)/nT1 IV |
| VC2238 | nfs-1(ok2890) I/hT2 I |
| FX18183 | nfs-1(tm3516)/hT2 I |
| FX31177 | glrx-5(tm3867)/tmC29 III |
| FX14712 | lpd-8(tm2983)/nT1 |
| GR3074 | frh-1(tm5913); vhl-1(ok161) |
| GR3075 | frh-1(tm5913)/mIn1; mgEx809[Psng-1::mCherry::SL2 frh-1 cDNA + ofm-1::GFP] |
| GR3076 | frh-1(tm5913)/mIn1; mgEx810[Pmyo-3::mCherry::SL2 frh-1 cDNA + ofm-1::GFP] |
| GR3077 | frh-1(tm5913)/mIn1; mgEx811[Pcol-10::mCherry::SL2 frh-1 cDNA + ofm-1::GFP] |
| GR3078 | frh-1(tm5913)/mIn1; mgEx812[Pvha-6::mCherry::SL2 frh-1 cDNA + ofm-1::GFP] |
| GR3079 | frh-1(tm5913); mgEx808[Pdpy-30::mCherry::SL2 frh-1 cDNA + ofm-1::GFP] |
| SJ4100 | zcIs13[hsp-6::GFP] V |
| GR3080 | frh-1(tm5913); zcIs13[hsp-6::GFP] V |
Mice
shFXN mice were generously provided by the Geshwind laboratory at the University of California, Los Angeles. Pups were weaned and genotyped at ~25 d after birth. All cages were provided with food and water ad-libitum. Food and water were monitored daily and replenished as needed, and cages were changed weekly. A standard light-dark cycle of ~12h light exposure was used. Animals were housed 2–5 per cage. Body weights were recorded regularly, and mice were humanely euthanized when they had lost 20% of peak body weight, in accordance with the American Veterinary Medical Association guidelines. For all experiments, animals were randomized on a 1:1 basis, balanced by age and sex. All animal studies were approved by the Subcommittee on Research Animal Care and the Institutional Animal Care and Use Committee of Massachusetts General Hospital.
Method Details
Cell growth assays
Cell counting was performed using a Cellometer Auto T4 bright field cell counter (Nexcelom Bioscience LLC). Cell growth assays were performed 7–10 days following lentiviral infection, where applicable. Unless stated otherwise, K562 and 293T cells were seeded at an initial density of 1×10⁵ cells/ml and 2.5×10⁵ cells/ml, respectively. Counts were performed 3 days after initial seeding at different oxygen tensions. LCLs were seeded at an initial density of 1×10⁵ cells/ml, and cell counts were performed 2 days after initial seeding at different oxygen tension.
Plasmids
Individual sgRNAs were cloned into pLentiCRISPRv2 (Addgene 52961) (Sanjana et al., 2014). For genetic interaction assays, Staphylococcus aureus Cas9 and sgRNAs were used to edit FXN, using the pXPR_BRD206 plasmid, a gift from John Doench (Broad Institute). cDNAs were cloned in pLYS6, bearing a Neomycin selection cassette, using the NheI and EcoRI sites. No tag was added to the cDNAs. All plasmids were verified by sequencing. pMD2.G (Addgene 12259) and psPAX2 (Addgene 12260) were used for lentiviral packaging.
Lentivirus production
2.5 ×10⁶ HEK293T cells were seeded in a T25cm2 flask (one flask per lentivirus) in 5 ml of DMEM [High glucose DMEM (Life Technologies, 11995), 10% FBS (Sigma, F2442)]. The following day the cells were transfected with 1ml of transfection mixture per well. The transfection mixture contained 25 μl Lipofectamine 2000 (Thermo Fisher Scientific), 3.75μg psPAX2, 2.5μg pMD2.G, 5μg of the lentiviral vector of interest and Opti-MEM medium (GIBCO) up to 1ml. The mixture was incubated at room temperature for 20 min before adding it to cells. 6h following transfection, the media was replaced with fresh DMEM. Two days after transfection, media was collected, filtered through a 0.45um filter and stored at –80C.
Essentiality in cancer cell lines
Cancer Dependency Map version 17Q4 data were downloaded, including CERES scores for 17670 genes across 342 cancer cell lines, where CERES score quantifies the effect of gene knockout on growth within genome-wide CRISPR screens after correcting for aneuploidy effects (Meyers et al., 2017). For each selected gene (Figure 2B), density plots were generated for CERES scores across the 342 cell lines.
Polyacrylamide gel electrophoresis and protein immunoblotting
2–5 ×10⁶ cells were harvested, washed in cold PBS and lysed for 10min on ice in RIPA lysis buffer (50 mM Tris-HCl pH 7.5, 150 mM NaCl, 1.0% NP-40, 0.5% sodium deoxycholate, 0.1% SDS, 1x protease and phosphatase inhibitor (Cell Signaling), and 250 units/ml benzonase nuclease (Sigma). Lysates were further clarified by centrifugation for 5min at 16000 × g at 4C. Protein concentration was measured using Pierce 660nm Protein Assay (Thermo Fisher Scientific). 35ug was loaded per well. Electrophoresis was carried out on Novex Tris-Glycine 4–20% gels (Life Technologies) before transfer on a Nitrocellulose Membrane, 0.45 μm (BioRad). Membranes were blocked for 30mins with SEA BLOCK Blocking Buffer (Thermo Fisher Scientific) at RT. Membranes were then incubated with primary antibody, diluted in 3%BSA, for 1h at RT or overnight at 4C. Membranes were then washed at RT 3 times in TBST for 5 mins. The membrane was incubated with goat α-rabbit or α-mouse conjugated to IRDye800 or to IRDye680 (LI-COR Biosciences), diluted in 5% milk, for 1h at RT. Membranes were washed 3 times in TBST for 5mins and were scanned for infrared signal using the Odyssey Imaging System (LI-COR Biosciences). Band intensities were analyzed with Image Studio Lite (LI-COR Biosciences).
Antibodies
Antibodies used here were:
| Antigen | Cat. Number | Vendor |
|---|---|---|
| Actin | A3853 | Sigma |
| ALAD | GTX81701 | Genetex |
| ATF4 | 10835 | Proteintech |
| FBXL5 | ab102692 | Abcam |
| Ferritin-H | sc-376594 | Santa Cruz |
| Ferrochetelase (FECH) | GTX113435 | Genetex |
| Frataxin | GTX54036 | Genetex |
| GLRX5 | HPA063716 | Atlas Antibodies |
| HIF1a | A300–286A | Bethyl Laboratories |
| HSCB | GTX116372 | Genetex |
| IRP2 | sc-33682 | Santa Cruz |
| ISCU | sc-373694 | Santa Cruz |
| KEAP1 | 10503 | Proteintech |
| Lipoic acid | 437695 | Calbiochem |
| LYRM4 | ARP57407_P050 | Aviva Systems Biology |
| MMS19 | 16015 | Proteintech |
| CIAO3 | GTX116764 | Genetex |
| NFS1 | sc-365308 | Santa Cruz |
| NRF2 | GTX103322 | Genetex |
| OGDH | HPA020347 | Sigma |
| OXPHOS | ab110411 | Abcam |
| Parvalbumin | ab11427 | Abcam |
| PCP-2 | sc-137064 | Santa Cruz |
| STEAP3 | ab151566 | Abcam |
Cell Death Analysis
Cell death was measured in cells treated with 2μg/μl puromycin or gene-specific sgRNAs. Cell death was measured with Dead Cell Apoptosis Kit (Invitrogen), which was used according to the manufacturer’s protocol. Briefly, cells were washed in ice-cold PBS, incubated with Annexin V FITC and PI for 15 min at room temperature, and then analyzed by flow cytometry on a CytoFLEX S Cytometer, using the TRITC channel for PI (ex:532, em:576) and the FITC channel for Annexin V (ex:488nM, em:525nm). Analysis of data was performed using FlowJo v.8 software.
Aconitase Activity
Aconitase activity from whole K562 cell extracts, obtained from 5×10⁶ cells, was assayed with the Aconitase Assay Kit (Cayman Chemicals), per manufacturer’s instructions.
Oxygen Consumption
1.25×10⁵ K562 cells were plated on a Seahorse plate coated with Cell-Tak Cell and Tissue Adhesive (Corning Life Sciences) in DMEM containing 1 g/L glucose and 50 mg/mL uridine, and oxygen consumption was recorded using a Seahorse XF96 Analyzer (Seahorse Biosciences). Each measurement was performed over 6 min after a 3 min mix and a 3 min wait period. Basal measurements were collected 6 times, followed by 6 measurements after addition of oligomycin (final concentration 3 μM), followed by 6 measurements after addition of 1μM CCCP (final concentration 1 μM), followed by 6 measurements after addition of antimycin A (final concentration 1 μM).
qPCR
2.5×10⁶ K562 cells were collected per sample. RNA was extracted from total cells with an RNeasy kit (QIAGEN) and DNase-I digested before murine leukemia virus (MLV) reverse transcription using random primers (Promega). qPCR was performed using the TaqMan technology (Life Technologies), using probes Hs04187282_g1 (NDUFA2), Hs00975961_g1 (NRF2) and Hs00427620_m1 (TBP). All data were normalized to TBP.
In-vitro Fe-S cluster synthesis and degradation
Protein purification:
The SDAec complex (Cory et al., 2017), ISCU2 (Tsai and Barondeau, 2010) and FXN (Tsai and Barondeau, 2010) were recombinantly expressed in E. coli and purified. The SDAec concentration was determined using an extinction coefficient for the PLP cofactor of 6.6 mM−1cm−1 at 388 nm in 0.1 M NaOH (Peterson and Sober, 1954). The concentrations of ISCU2 and FXN were determined using extinction coefficients at 280 nm of 8490 M−1cm−1 and 26030 M−1cm−1, respectively (Tsai and Barondeau, 2010).
CD spectroscopy:
CD spectra were recorded using a 1 cm path length cuvette on a Chirascan CD spectrometer (Applied Photophysics). For anaerobic measurements the cuvette was sealed with a rubber septa and electrical tape in an anaerobic glove box (O2 < 0.5 ppm, Teledyne Analytical Instruments, Model # 311). Protein samples were prepared in Buffer A (50 mM HEPES, 250 mM NaCl, pH 7.5) and assays were conducted at 22 °C.
Stability of [2Fe-2S] clusters on ISCU2 in the presence of O2. First, [2Fe-2S] clusters were built on ISCU2 in the presence and absence of FXN under anaerobic conditions in a sealed cuvette. The reaction mixtures contained 10 μM SDAec, 30 μM ISCU2, and 400 μM Fe(NH4)2(SO4)2 (for SDAecU) or 5 μM SDAec, 30 μM ISCU2 and 30 μM FXN, and 400 μM Fe(NH4)2(SO4)2 (for SDAecUF). Injecting 50 μM L-cysteine and 10 mM GSH together using a gas-tight syringe initiated cluster synthesis reactions. The reactions reached saturation, which was determined by tracking changes in the visible CD spectrum from 300 nm to 700 nm, after ~4.5 h for SDAecU and ~2.5 h for SDAecUF. 50 μL of air-saturated Buffer A was then injected and the [2Fe-2S] cluster content was monitored at 330 nm. After 1 h, the cuvette was exposed to atmospheric air and the [2Fe-2S] cluster content was further tracked by changes at 330 nm. The rate of cluster degradation was determined by fitting the absorbance changes with time to a linear equation using Origin software (OriginLab).
Effect of O2 on 2Fe-2S cluster biosynthesis reactions. Fe-S assembly reactions on ISCU2 contained 10 μM SDAec, 30 μM ISCU2, 30 μM FXN (when added), and 400 μM Fe(NH4)2(SO4)2 in air-saturated Buffer A. The reactions were carried out in open cuvette (aerobic condition) and were initiated by injecting 50 μM L-cysteine and 10 mM GSH together (prepared anaerobically) using a gas-tight syringe. The formation of [2Fe-2S] clusters was monitored by the change in ellipticity at 330 nm. The initial increase in ellipticity was plotted with time and fitted to a linear equation using Origin software (OriginLab).
RPA and TMRE measurements
1×10⁶ K562 cells were collected per sample. Cells were washed in HBSS (GIBCO) and then incubated with either 100nM RPA (Axxora) or 5nM TMRE (Life Technologies) diluted in HBSS for 10 min in an incubator at 37 °C and 21% O2. Cells were then washed in HBSS. For RPA staining, cells were then incubated for an additional 15mins in fresh HBSS. Flow cytometry data were collected on a CytoFLEX S Cytometer, using the mCherry channel for RPA (ex:561, em:602) and the dsRed channel for TMRE (ex:561 nM em:574 nm). Analysis of data was performed using FlowJo v.8 software.
Protein extraction from C. elegans
Animals were washed in PBS, and then resuspended in 2 volumes of RIPA buffer (50 mM Tris-HCl pH 7.5, 150 mM NaCl, 1.0% NP-40, 0.5% sodium deoxycholate, 0.1% SDS, 1x protease and phosphatase inhibitor (Cell Signaling), and 250 units/ml Benzonase Nuclease (Sigma). Animals were then lysed using a 1min pulse in a sonicator, followed by 1 min on ice, repeated 5 times. Protein measurement, polyacrylamide gel electrophoresis and protein immunoblotting were then carried out as outlined above.
Doxycycline knockdown in shFXN mice
The average age of the animals at the start of experiments was 2–3 months. Doxycycline treatment followed the established optimal dosing protocol (Chandran et al., 2017); 2 mg/mL Doxycycline (Sigma) was added to the drinking water of all animals which was changed weekly. In addition, animals were injected intraperitoneally (IP) with doxycycline twice a week, starting with 5 mg/kg body weight for 10 weeks followed by 10 mg Dox/kg body at later time points.
Chronic hypoxic, normoxic and hyperoxic exposures of shFXN mice
Wild type and shFXN mice were exposed to chronic hypoxia (11% O2), normoxia (21% O2) or hyperoxia (55% O2) at ambient sea-level pressure. For hypoxia and hyperoxia treatments, mice were placed in 80-L plexiglass chambers that were given either a gas mixture of N2 and O2 supplied by a membrane technology nitrogen generator (MAG-20, Higher Peak, Winchester MA) or a mixture of compressed air and 100% O2 (Airgas Inc.). The gas flow rates were measured and controlled with rotameters and valves. Oxygen concentrations were measured several times each day at the outlet of the chambers using an oxygen analyzer (MiniOx I Oxygen Analyzer, Ohio Medical Corporation) and the flow rates of air, nitrogen and oxygen were modified if necessary in order to obtain a stable oxygen concentration of 11% in the hypoxic chamber and 55% in the hyperoxia chamber. Soda lime (Sodasorb, Smiths Medical) (approximately 250g), was placed on the floor of each chamber to scavenge carbon dioxide (CO2) exhaled by the animals and replaced every 3 days. The CO2 concentration in each chamber as well as the temperature and the humidity were monitored continuously using a dedicated infrared CO2 analyzer, thermometer and humidity meter (Extech CO200 Monitor, Extech Instruments). Temperature and humidity were maintained at 23–25°C and 30–70%, respectively. Mice were exposed to gas treatment continuously for 24 hours per day, 7 days a week. The chambers were briefly opened three times a week to weigh the mice, evaluate their neurological status, clean the cages and add water and food.
Inverted screen test
Mice were acclimated to the experimental room for at least 30mins before the start of the measurements. Each mouse was placed in the center of a wire mesh screen, consisting of 15mm squares of 2mm diameter wire, held ~50cm above padded bedding. The screen was rotated to an inverted position slowly over 3 sec, with the mouse’s head declining first. When the screen was stable, the timer was started. The time when the mouse fell off was noted, or the mouse was removed when the criterion time of 10min maximum was reached.
Accelerating rotarod measurements
A rotarod machine (Ugo Basile) was used to measure the ability of mice to stay on an accelerating, rotating rod. Mice were acclimated to the experimental room for at least 30mins before the start of the measurements. Rotarod parameters were as follows: acceleration of 5rpm/m and a maximum speed of 40rpm. On each measurement day, three trials were performed, with individual trials at least 10m apart to allow mice to recuperate. The median time on rotarod is reported. If mice used their body to grasp the rod (rather than walking on it) for more than 10s, this time was recorded as time of fall.
Gait analyses
Mice were acclimated to the experimental room for at least 30mins before the start of the measurements. Hind and fore paws was coated with nontoxic red and blue paint, respectively, and the animals were allowed to walk through a 60-cm-long, 15-cm-wide runway that was lined with blank paper. Footprints were captured for each animal on the blank paper, and the length between the left hindprint strides was measured. For each mouse, the average of at least 3 strides was recorded.
Brain Histology
Mice were placed and maintained under deep anesthesia with 5% isoflurane in oxygen for the extent of the perfusion. The chest cavity was opened and a catheter was placed in the left ventricle, after which the right atrium was cut. Mice were perfused with 15mL modified Ames Media (Sigma) in 1xPBS, followed by 20–30 mL of 4% paraformaldehyde (PFA) in 1X PBS at room temperature. Brains were dissected from perfused mice, and post-fixed in 4% PFA at 4°C for 12–16 hr. Tissue was cryoprotected in 30% sucrose in 1X PBS overnight at 4°C, then embedded in OCT and rapidly frozen in a dry ice/ethanol bath. 30μm sagittal cryostat sections of the brains were mounted on slides and processed for immunohistochemistry.
Sections on slides were dried at RT for 1 hour, then washed 3×5 minutes in 1X PBS. Tissue was then blocked for 1h in 1X PBS containing 0.1% Triton-X 100 and 5% normal donkey serum (Sigma). Sections were incubated with primary antibodies diluted in blocking solution (5% normal donkey serum, no detergent) at 4°C overnight. Sections were then washed with 1X PBS containing 0.02% Tween 20 (PBST) 4×5 minutes and incubated with secondary antibodies diluted 1:500 in blocking solution, at room temperature for 1 hour. Secondary antibodies employed were Alexa 546 conjugated donkey anti-rabbit antibody and Alexa 647 conjugated donkey anti-mouse antibody (Life Technologies). Following secondary antibody incubation, the tissue was washed 4×5 minutes with PBST. One wash of PBST contained a 1:5,000 dilution of Hoechst 33342 solution (ThermoFisher). Sections were washed one more time with PBST, then mounted with fluoromount-G (Southern Biotech) for imaging.
Cerebellar imaging and analysis
Imaging was conducted on a spinning disk confocal system (Yokogawa CSU-22 spinning disk confocal scan head with Andor Borealis modification) using a 63X objective (1.4 N.A.), with MetaMorph acquisition software and a Hamamatsu Orca-ER cooled CCD camera. At least three cerebellar sections were imaged for each animal.
Following image acquisition, Purkinje cell staining was analyzed from parvalbumin mean intensity per cell (normalized for cell size). Experimenter was blind to genotype during analysis. Images were analyzed using the CellProfiler software 3.1.8, and single Purkinje cells were recognized on the basis of PCP-2 staining. Measures of cell size, shape and fluorescence signals were extracted. At least 100 Purkinje cells were analyzed per animal.
Electrocardiogram (ECG) analysis
ECG was performed in mice anesthetized with 2% isoflurane and by an operator blinded to the experimental conditions. Mice were placed supine on a heating plate (TCAT-TLV, Physitemp, Clifton, NJ) to keep core body temperature at 37 ±0.5 °C. Using subcutaneous three-lead ECG needle electrodes (Bio Amp, ADInstruments, Dunedin, New Zealand), ECG signal was recorded at 4 kHz and filtered using a high- and low- pass settings of 0.3 Hz and 1 kHz respectively (PowerLab, Dunedin, New Zealand). Continuous ECG recording of 10 min was analyzed manually by aligning R waves of >100 complexes to determine heart rate and QT interval using LabChart 7 (ADInstruments, Dunedin, New Zealand). The QT interval was calculated as the time between the first deviation of the QRT complex from the isoelectric line and the end of the T wave, where the curve of the T wave returns to the isoelectric line (Speerschneider and Thomsen, 2013). The QT interval was corrected to HR using Bazett’s formula (QTc).
Echocardiography analysis
Cardiac function was evaluated by transthoracic echocardiography (Irie et al., 2015). Mice were anesthetized with 3% isoflurane, which was reduced to 1.5% isoflurane during echocardiography. Images were collected using a 14.0-MHz linear probe (Vivid 7; GE Medical System, Milwaukee, WI). Body temperature was maintained at 37°C during echocardiography. M-mode images were obtained from a parasternal shortaxis view at the midventricular level with a clear view of the papillary muscle. Left ventricular (LV) internal diameters at end-diastole and end-systole were measured. LV fractional shortening was calculated on an EchoPAC workstation (GE Healthcare, Wauwatosa, WI).
Quantification and statistical analysis
Data are reported as mean ± SD. Analyses were performed using GraphPad Prism 8.0.1 software. One-way ANOVA with Bonferroni’s correction was used for multiple comparisons. Both the log-rank (Mantel-Cox) test and Cox proportional hazards model were utilized to compare survival rates. For parvalbumin intensity analysis, a nested one-way ANOVA with Bonferroni’s correction was used. P value < 0.05 was considered to indicate statistical significance.
Supplementary Material
Figure S1- Proliferation, not cell death, is affected in FXN depleted cells. Related to Figure 1. (A) Three-day proliferation assay of control or FXN KO K562 cells. Cells were grown in 21% O2, 5% O2 or 1% O2 (B) Immunoblot of FXN KO 293T cells grown in 21% O2, 1% O2 or 21% O2 with 75 μM FG-4592, blotted for FXN and ACTIN. (C) Growth curve of WT and FXN KO 293T cells, generated under 1% O2, and transitioned to 21% O2 or 1% O2 on day 1. (D) Annexin V staining of FXN KO K562 cells grown in 21% O2 or 1% O2. As a positive control, K562 cells were treated for 24h with 2μg/ml puromycin. (E) Yeast genomic PCR for YFH1 or ACT1 from WT or Δyfh1 strains. (F) Top: Two-day proliferation assay of lymphoblastoid cells derived from FRDA patients or sex and age matched controls in 21% O2 or 30% O2. Bottom: Immunoblot of lymphoblastoid cells derived from FRDA patients or sex and age matched controls, blotted for FXN and TIMM23. (G) Top: Three-day proliferation assay of K562 cells KO for FXN or mitochondrial complex I subunits- NDUFS1 or NDUFA2- vs. control cells in 21% O2, 1% O2 or 21% O2 with 75 μM FG-4592. Bottom: Immunoblot and qPCR control of NDUFS1 or NDUFA2 depletion. All bar plots show mean ± SD. *=p < 0.05, **=p < 0.001, ***=p < 0.001, ****=p < 0.0001. One-way ANOVA with Bonferroni’s post-test.
Figure S2- Cytosolic and mitochondrial Fe-S biosynthesis machineries are highly essential in numerous cell lines. Related to Figure 2. (A) Essentiality of mitochondrial and cytosolic Fe-S assembly machinery (ISC and CIA, respectively) as well as Fe-S containing proteins, across 342 cancer cell lines. CERES score quantifies the growth defect of each gene knockout in genome-wide CRISPR screens. (B) Distribution of CERES score of ISC, CIA and Fe-S containing proteins across 342 cancer cell lines. (C) Immunoblot validation of Fe-S assembly and chaperone machinery depletion lines, blotting for ISCU, NFS1, LYRM4, GLRX5, HSCB, CIAO3, ACTIN and TIMM23. (D) Immunoblot of Fe-S assembly machinery overexpression lines, blotting for FXN, ISCU, LYRM4, NFS1 and TUBULIN.
Figure S3- Quantification of the steady state levels of Fe-S containing processes in FXN null cells grown in hypoxia. Related to Figure 3. (A) Quantification of NDUFB8 and SDHB immunoblots, normalized to TUBULIN levels. (B) Oxygen consumption rates for WT or FXN KO K562 cells grown at 21% O2 (top) or 1% O2 (bottom), following addition of oligomycin, CCCP and antimycin. (C) Basal and uncoupled maximal respiration of for WT or FXN KO K562 cells grown at 21% O2 or 1% O2. (D) Quantification of FECH immunoblots, normalized to TOMM20 levels. (E) Quantification of POLD1 immunoblots, normalized to ACTIN levels. All bar plots show mean ± SD. *=p < 0.05, **=p < 0.001. One-way ANOVA with Bonferroni’s post-test.
Figure S4- The nascent Fe-S cluster on ISCU is stable under anaerobic conditions. Related to Figure 4. CD intensity at 330 nm vs time of reaction for [2Fe-2S] cluster stability on ISCU-NFS1-LYRM4-ACPec complex without (left) and with (right) FXN under anaerobic conditions.
Figure S5- Multiple signaling pathways are remodeled in FXN null cells. Related to Figure 5. (A) Quantification of ATF4 activation immunoblots, normalized to ACTIN levels. (B) Immunoblot of FXN KO cells grown in 21% O2 or 1% O2, blotted for KEAP1 and ACTIN. (C) mRNA levels of NRF2 in FXN KO cells grown in 21% O2 or 1% O2. (D) Quantification of IRP2 activation immunoblots, normalized to ACTIN levels. (E) Immunoblot of control or ISC machinery KO cells grown in 21% O2 or 1% O2, blotted for ATF4, NRF2, IRP2, ACTIN. (F) Quantification of FER-H immunoblots, normalized to ACTIN levels. (G) Mitochondrial Fe2+ measurements with the quenchable fluorescent dye RPA in FXN KO cells grown in 21% O2 or 1% O2. (H) Mitochondrial membrane potential measurements with TMRE FXN KO cells grown in 21% O2 or 1% O2. As a control, the mitochondrial membrane potential was dissipated with Oligomycin and Antimycin (A+O). (I) Immunoblot validation of sgFBXL5 cells, blotted for FBXL5 and TUBULIN. (J) Immunoblot validation of sgIRP2, sgFXN and double sgIRP2+sgFXN cells, blotted for IRP2, FXN and ACTIN. (K) Three-day proliferation assay of control, FXN KO, STEAP3 KO or double STEAP3 FXN KO cells in 21% O2 or 1% O2. (L) Immunoblot validation of sgSTEAP3, sgFXN and double sgSTEAP3+sgFXN cells, blotted for STEAP3, FXN and ACTIN. All bar plots show mean ± SD. *=p < 0.05, **=p < 0.001, ***=p < 0.001, ****=p < 0.0001. One-way ANOVA with Bonferroni’s post-test.
Figure S6- Hypoxia improves the growth of many ISC mutants in C. elegans but only frataxin mutants are fully rescued. Related to Figure 6. (A) Total progeny produced from animals incubated at 21% O2, 5% O2 or 1% O2. Mothers were balanced heterozygotes (mutant/+). (B) Animal length after 4 days of growth at 21% or 1% O2. Mothers were frh-1(tm5913) homozygotes. (C) Animal length after 2 days growth at 21% or 1% O2. Mothers were balanced heterozygotes (mutant/+). (D) Animal length after 3 days growth at 21% or 1% O2. Mothers were balanced heterozygotes (mutant/+). All error bars represent standard deviation. *=p < 0.05, **=p < 0.01, ***=p < 0.001, ****=p < 0.0001. One-way ANOVA with Bonferroni’s post-test.
Figure S7- Hypoxia attenuates ataxia-associated phenotypes, but not cardiomyopathy, in murine model of FRDA. Related to Figure 7. (A) Weekly body weight measurements from WT and shFXN mice housed in hypoxia and normoxia (n=10 per group). (B) Stride length analysis for WT or shFXN mice housed in normoxia or hypoxia at 12 weeks. Stride length was calculated as the average of at least 3 strides per mouse (n≥ 6 per group). (C) Inverted screen test analysis for WT or shFXN mice housed in normoxia or hypoxia at 15 weeks. Time to fall is represented (n≥ 4 per group) (D) Accelerating rotarod analysis for WT or shFXN mice housed in normoxia or hypoxia at 15 weeks. Latency to fall measured as mean value of triplicate trials per mouse (n≥ 4 per group). (E) Stride length analysis for WT or shFXN mice housed in normoxia or hypoxia at 15 weeks. Stride length was calculated as the average of at least 3 strides per mouse (n≥ 4 per group). (F) Quantification of mean parvalbumin staining intensity in Purkinje cells from WT or shFXN mice housed in 21% O2 or 11% O2. Each plot represents one animal. (G) Quantification of mean parvalbumin staining intensity in the primary visual cortex WT or shFXN mice housed in normoxia or hypoxia. Each plot represents one animal. (H) Representative electrocardiogram traces of for WT or shFXN mice housed in normoxia or hypoxia. (I) Echocardiogram measurement of left ventricular (LV) internal diameter at end-systole from WT and shFXN mice housed in hypoxia and normoxia (n≥ 5 per group). (J) Echocardiogram measurement of LV fractional shortening from WT and shFXN mice housed in hypoxia and normoxia (n≥ 5 per group). (K) Summary model. Fe-S clusters are made from ferrous iron, cysteine (a sulfur donor), and electrons. Once made, this cluster can subsequently degrade. FXN can promote Fe-S biosynthesis, likely as an allosteric regulator of the ISC assembly machinery. Hypoxia can complement for loss of FXN through several mechanisms: (1) boosting Fe-S biosynthesis, (2) providing the appropriate environmental context for the activation of the iron response, which elevates the levels of bioavailable iron in hypoxic environments, (3) inhibiting Fe-S cluster degradation. All bar plots show mean ± SD. *=p < 0.05, **=p < 0.01, ***=p < 0.001, ****=p < 0.0001. One-way ANOVA with Bonferroni’s post-test for bar plots and nested one-way ANOVA with Bonferroni’s post-test for parvalbumin intensity.
Acknowledgments:
We thank Dr. Daniel H. Geschwind (UCLA) for generously providing the shFXN mice. We thank O. Goldberger, V. Sundaresan and P. Breen for technical assistance, I. Jain for advice, and all members of the Mootha lab for fruitful discussions and feedback. This work was supported by funds from the CureFA Foundation, Marriott Foundation, and National Institutes of Health (R35-GM122455) awarded to VKM. This work was also supported by funds from the National Institute of Health (R01-GM096100) awarded to DPB. TA is supported by EMBO (ALTF 975–2015) and HHMI-HHWF fellowships. JDM is supported by a Jane Coffin Childs fellowship. VKM is an Investigator of the Howard Hughes Medical Institute.
Footnotes
Declaration of Interests:
VKM is on the scientific advisory boards of Raze Therapeutics, Janssen Pharmaceuticals, and 5AM Ventures. WMZ is on the scientific advisory board of Third Pole Therapeutics. GR is on the scientific advisory boards of Calico Life Sciences and the Glenn Medical Foundation and is cofounder of Marvelbiome. GR has filed for patents on the interaction of mitochondrial mutants with bacterial siderophore mutations and acetobacteria. VKM and WMZ are listed as an inventors on a patent application filed by Massachusetts General Hospital on the use of hypoxia as a therapy for mitochondrial and degenerative diseases.
References
- Achebach S, Selmer T, and Unden G (2005). Properties and significance of apoFNR as a second form of air-inactivated [4Fe-4S].FNR of Escherichia coli. FEBS J 272, 4260–4269. [DOI] [PubMed] [Google Scholar]
- Alvarez SW, Sviderskiy VO, Terzi EM, Papagiannakopoulos T, Moreira AL, Adams S, Sabatini DM, Birsoy K, and Possemato R (2017). NFS1 undergoes positive selection in lung tumours and protects cells from ferroptosis. Nature 551, 639–643. [DOI] [PMC free article] [PubMed] [Google Scholar]
- Andreini C, Banci L, and Rosato A (2016). Exploiting Bacterial Operons To Illuminate Human Iron-Sulfur Proteins. J Proteome Res 15, 1308–1322. [DOI] [PubMed] [Google Scholar]
- Andreini C, Rosato A, and Banci L (2017). The Relationship between Environmental Dioxygen and Iron-Sulfur Proteins Explored at the Genome Level. PLoS One 12, e0171279. [DOI] [PMC free article] [PubMed] [Google Scholar]
- Anzovino A, Chiang S, Brown BE, Hawkins CL, Richardson DR, and Huang ML (2017). Molecular Alterations in a Mouse Cardiac Model of Friedreich Ataxia: An Impaired Nrf2 Response Mediated via Upregulation of Keap1 and Activation of the Gsk3beta Axis. Am J Pathol 187, 2858–2875. [DOI] [PubMed] [Google Scholar]
- Beilschmidt LK, and Puccio HM (2014). Mammalian Fe-S cluster biogenesis and its implication in disease. Biochimie 100, 48–60. [DOI] [PubMed] [Google Scholar]
- Brachmann CB, Davies A, Cost GJ, Caputo E, Li J, Hieter P, and Boeke JD (1998). Designer deletion strains derived from Saccharomyces cerevisiae S288C: a useful set of strains and plasmids for PCR-mediated gene disruption and other applications. Yeast 14, 115–132. [DOI] [PubMed] [Google Scholar]
- Bridwell-Rabb J, Fox NG, Tsai CL, Winn AM, and Barondeau DP (2014). Human frataxin activates Fe-S cluster biosynthesis by facilitating sulfur transfer chemistry. Biochemistry 53, 4904–4913. [DOI] [PMC free article] [PubMed] [Google Scholar]
- Cai K, Frederick RO, Tonelli M, and Markley JL (2018). ISCU(M108I) and ISCU(D39V) Differ from Wild-Type ISCU in Their Failure To Form Cysteine Desulfurase Complexes Containing Both Frataxin and Ferredoxin. Biochemistry 57, 1491–1500. [DOI] [PMC free article] [PubMed] [Google Scholar]
- Calmels N, Schmucker S, Wattenhofer-Donze M, Martelli A, Vaucamps N, Reutenauer L, Messaddeq N, Bouton C, Koenig M, and Puccio H (2009). The first cellular models based on frataxin missense mutations that reproduce spontaneously the defects associated with Friedreich ataxia. PLoS One 4, e6379. [DOI] [PMC free article] [PubMed] [Google Scholar]
- Campuzano V, Montermini L, Lutz Y, Cova L, Hindelang C, Jiralerspong S, Trottier Y, Kish SJ, Faucheux B, Trouillas P, et al. (1997). Frataxin is reduced in Friedreich ataxia patients and is associated with mitochondrial membranes. Hum Mol Genet 6, 1771–1780. [DOI] [PubMed] [Google Scholar]
- Campuzano V, Montermini L, Molto MD, Pianese L, Cossee M, Cavalcanti F, Monros E, Rodius F, Duclos F, Monticelli A, et al. (1996). Friedreich’s ataxia: autosomal recessive disease caused by an intronic GAA triplet repeat expansion. Science 271, 1423–1427. [DOI] [PubMed] [Google Scholar]
- Canfield DE (2005). THE EARLY HISTORY OF ATMOSPHERIC OXYGEN: Homage to Robert M. Garrels. Annual Review of Earth and Planetary Sciences 33, 1–36. [Google Scholar]
- Canfield DE, Habicht KS, and Thamdrup B (2000). The Archean sulfur cycle and the early history of atmospheric oxygen. Science 288, 658–661. [DOI] [PubMed] [Google Scholar]
- Chandran V, Gao K, Swarup V, Versano R, Dong H, Jordan MC, and Geschwind DH (2017). Inducible and reversible phenotypes in a novel mouse model of Friedreich’s Ataxia. Elife 6. [DOI] [PMC free article] [PubMed] [Google Scholar]
- Chu DK, Kim LH, Young PJ, Zamiri N, Almenawer SA, Jaeschke R, Szczeklik W, Schunemann HJ, Neary JD, and Alhazzani W (2018). Mortality and morbidity in acutely ill adults treated with liberal versus conservative oxygen therapy (IOTA): a systematic review and meta-analysis. Lancet 391, 1693–1705. [DOI] [PubMed] [Google Scholar]
- Cory SA, Van Vranken JG, Brignole EJ, Patra S, Winge DR, Drennan CL, Rutter J, and Barondeau DP (2017). Structure of human Fe-S assembly subcomplex reveals unexpected cysteine desulfurase architecture and acyl-ACP-ISD11 interactions. Proc Natl Acad Sci U S A 114, E5325–E5334. [DOI] [PMC free article] [PubMed] [Google Scholar]
- Cossee M, Puccio H, Gansmuller A, Koutnikova H, Dierich A, LeMeur M, Fischbeck K, Dolle P, and Koenig M (2000). Inactivation of the Friedreich ataxia mouse gene leads to early embryonic lethality without iron accumulation. Hum Mol Genet 9, 1219–1226. [DOI] [PubMed] [Google Scholar]
- Crack J, Green J, and Thomson AJ (2004). Mechanism of oxygen sensing by the bacterial transcription factor fumarate-nitrate reduction (FNR). J Biol Chem 279, 9278–9286. [DOI] [PubMed] [Google Scholar]
- David LA, and Alm EJ (2011). Rapid evolutionary innovation during an Archaean genetic expansion. Nature 469, 93–96. [DOI] [PubMed] [Google Scholar]
- Delatycki MB, and Corben LA (2012). Clinical features of Friedreich ataxia. J Child Neurol 27, 1133–1137. [DOI] [PMC free article] [PubMed] [Google Scholar]
- Dupont CL, Butcher A, Valas RE, Bourne PE, and Caetano-Anolles G (2010). History of biological metal utilization inferred through phylogenomic analysis of protein structures. Proc Natl Acad Sci U S A 107, 10567–10572. [DOI] [PMC free article] [PubMed] [Google Scholar]
- Ferrari M, Jain IH, Goldberger O, Rezoagli E, Thoonen R, Cheng KH, Sosnovik DE, Scherrer-Crosbie M, Mootha VK, and Zapol WM (2017). Hypoxia treatment reverses neurodegenerative disease in a mouse model of Leigh syndrome. Proc Natl Acad Sci U S A 114, E4241–E4250. [DOI] [PMC free article] [PubMed] [Google Scholar]
- Foury F, Pastore A, and Trincal M (2007). Acidic residues of yeast frataxin have an essential role in Fe-S cluster assembly. EMBO Rep 8, 194–199. [DOI] [PMC free article] [PubMed] [Google Scholar]
- Fox NG, Chakrabarti M, McCormick SP, Lindahl PA, and Barondeau DP (2015a). The Human Iron-Sulfur Assembly Complex Catalyzes the Synthesis of [2Fe-2S] Clusters on ISCU2 That Can Be Transferred to Acceptor Molecules. Biochemistry 54, 3871–3879. [DOI] [PMC free article] [PubMed] [Google Scholar]
- Fox NG, Das D, Chakrabarti M, Lindahl PA, and Barondeau DP (2015b). Frataxin Accelerates [2Fe-2S] Cluster Formation on the Human Fe-S Assembly Complex. Biochemistry 54, 3880–3889. [DOI] [PMC free article] [PubMed] [Google Scholar]
- Freibert SA, Goldberg AV, Hacker C, Molik S, Dean P, Williams TA, Nakjang S, Long S, Sendra K, Bill E, et al. (2017). Evolutionary conservation and in vitro reconstitution of microsporidian iron-sulfur cluster biosynthesis. Nat Commun 8, 13932. [DOI] [PMC free article] [PubMed] [Google Scholar]
- Gietz RD, and Woods RA (2002). Transformation of yeast by lithium acetate/single-stranded carrier DNA/polyethylene glycol method. Methods Enzymol 350, 87–96. [DOI] [PubMed] [Google Scholar]
- Girardis M, Busani S, Damiani E, Donati A, Rinaldi L, Marudi A, Morelli A, Antonelli M, and Singer M (2016). Effect of Conservative vs Conventional Oxygen Therapy on Mortality Among Patients in an Intensive Care Unit: The Oxygen-ICU Randomized Clinical Trial. JAMA 316, 1583–1589. [DOI] [PubMed] [Google Scholar]
- Goldstein AL, and McCusker JH (1999). Three new dominant drug resistance cassettes for gene disruption in Saccharomyces cerevisiae. Yeast 15, 1541–1553. [DOI] [PubMed] [Google Scholar]
- Gomes CM, and Santos R (2013). Neurodegeneration in Friedreich’s ataxia: from defective frataxin to oxidative stress. Oxid Med Cell Longev 2013, 487534. [DOI] [PMC free article] [PubMed] [Google Scholar]
- Grahl N, and Cramer RA Jr. (2010). Regulation of hypoxia adaptation: an overlooked virulence attribute of pathogenic fungi? Med Mycol 48, 1–15. [DOI] [PMC free article] [PubMed] [Google Scholar]
- Gray JM, Karow DS, Lu H, Chang AJ, Chang JS, Ellis RE, Marletta MA, and Bargmann CI (2004). Oxygen sensation and social feeding mediated by a C. elegans guanylate cyclase homologue. Nature 430, 317–322. [DOI] [PubMed] [Google Scholar]
- Hanson ES, Foot LM, and Leibold EA (1999). Hypoxia post-translationally activates iron-regulatory protein 2. J Biol Chem 274, 5047–5052. [DOI] [PubMed] [Google Scholar]
- Harding AE (1981). Friedreich’s ataxia: a clinical and genetic study of 90 families with an analysis of early diagnostic criteria and intrafamilial clustering of clinical features. Brain 104, 589–620. [DOI] [PubMed] [Google Scholar]
- Herman D, Jenssen K, Burnett R, Soragni E, Perlman SL, and Gottesfeld JM (2006). Histone deacetylase inhibitors reverse gene silencing in Friedreich’s ataxia. Nat Chem Biol 2, 551–558. [DOI] [PubMed] [Google Scholar]
- Huang ML, Becker EM, Whitnall M, Suryo Rahmanto Y, Ponka P, and Richardson DR (2009). Elucidation of the mechanism of mitochondrial iron loading in Friedreich’s ataxia by analysis of a mouse mutant. Proc Natl Acad Sci U S A 106, 16381–16386. [DOI] [PMC free article] [PubMed] [Google Scholar]
- Huang ML, Sivagurunathan S, Ting S, Jansson PJ, Austin CJ, Kelly M, Semsarian C, Zhang D, and Richardson DR (2013). Molecular and functional alterations in a mouse cardiac model of Friedreich ataxia: activation of the integrated stress response, eIF2alpha phosphorylation, and the induction of downstream targets. Am J Pathol 183, 745–757. [DOI] [PubMed] [Google Scholar]
- Imlay JA (2006). Iron-sulphur clusters and the problem with oxygen. Mol Microbiol 59, 1073–1082. [DOI] [PubMed] [Google Scholar]
- Irie T, Sips PY, Kai S, Kida K, Ikeda K, Hirai S, Moazzami K, Jiramongkolchai P, Bloch DB, Doulias PT, et al. (2015). S-Nitrosylation of Calcium-Handling Proteins in Cardiac Adrenergic Signaling and Hypertrophy. Circ Res 117, 793–803. [DOI] [PMC free article] [PubMed] [Google Scholar]
- Jain IH, Zazzeron L, Goli R, Alexa K, Schatzman-Bone S, Dhillon H, Goldberger O, Peng J, Shalem O, Sanjana NE, et al. (2016). Hypoxia as a therapy for mitochondrial disease. Science 352, 54–61. [DOI] [PMC free article] [PubMed] [Google Scholar]
- Kearney M, Orrell RW, Fahey M, Brassington R, and Pandolfo M (2016). Pharmacological treatments for Friedreich ataxia. Cochrane Database Syst Rev, CD007791. [DOI] [PMC free article] [PubMed] [Google Scholar]
- Kemp KC, Cook AJ, Redondo J, Kurian KM, Scolding NJ, and Wilkins A (2016). Purkinje cell injury, structural plasticity and fusion in patients with Friedreich’s ataxia. Acta Neuropathol Commun 4, 53. [DOI] [PMC free article] [PubMed] [Google Scholar]
- Koeppen AH (1991). The Purkinje cell and its afferents in human hereditary ataxia. J Neuropathol Exp Neurol 50, 505–514. [DOI] [PubMed] [Google Scholar]
- Koeppen AH (2011). Friedreich’s ataxia: pathology, pathogenesis, and molecular genetics. J Neurol Sci 303, 1–12. [DOI] [PMC free article] [PubMed] [Google Scholar]
- Li K, Besse EK, Ha D, Kovtunovych G, and Rouault TA (2008). Iron-dependent regulation of frataxin expression: implications for treatment of Friedreich ataxia. Hum Mol Genet 17, 2265–2273. [DOI] [PMC free article] [PubMed] [Google Scholar]
- Lill R (2009). Function and biogenesis of iron-sulphur proteins. Nature 460, 831–838. [DOI] [PubMed] [Google Scholar]
- Lill R, Srinivasan V, and Muhlenhoff U (2014). The role of mitochondria in cytosolic-nuclear iron-sulfur protein biogenesis and in cellular iron regulation. Curr Opin Microbiol 22, 111–119. [DOI] [PubMed] [Google Scholar]
- Lin H, Magrane J, Clark EM, Halawani SM, Warren N, Rattelle A, and Lynch DR (2017). Early VGLUT1-specific parallel fiber synaptic deficits and dysregulated cerebellar circuit in the KIKO mouse model of Friedreich ataxia. Dis Model Mech 10, 1529–1538. [DOI] [PMC free article] [PubMed] [Google Scholar]
- Lu C, and Cortopassi G (2007). Frataxin knockdown causes loss of cytoplasmic iron-sulfur cluster functions, redox alterations and induction of heme transcripts. Arch Biochem Biophys 457, 111–122. [DOI] [PMC free article] [PubMed] [Google Scholar]
- Lu C, Schoenfeld R, Shan Y, Tsai HJ, Hammock B, and Cortopassi G (2009). Frataxin deficiency induces Schwann cell inflammation and death. Biochim Biophys Acta 1792, 1052–1061. [DOI] [PMC free article] [PubMed] [Google Scholar]
- Majmundar AJ, Wong WJ, and Simon MC (2010). Hypoxia-inducible factors and the response to hypoxic stress. Mol Cell 40, 294–309. [DOI] [PMC free article] [PubMed] [Google Scholar]
- Meyers RM, Bryan JG, McFarland JM, Weir BA, Sizemore AE, Xu H, Dharia NV, Montgomery PG, Cowley GS, Pantel S, et al. (2017). Computational correction of copy number effect improves specificity of CRISPR-Cas9 essentiality screens in cancer cells. Nat Genet 49, 1779–1784. [DOI] [PMC free article] [PubMed] [Google Scholar]
- Meyron-Holtz EG, Ghosh MC, Iwai K, LaVaute T, Brazzolotto X, Berger UV, Land W, Ollivierre-Wilson H, Grinberg A, Love P, et al. (2004a). Genetic ablations of iron regulatory proteins 1 and 2 reveal why iron regulatory protein 2 dominates iron homeostasis. EMBO J 23, 386–395. [DOI] [PMC free article] [PubMed] [Google Scholar]
- Meyron-Holtz EG, Ghosh MC, and Rouault TA (2004b). Mammalian tissue oxygen levels modulate iron-regulatory protein activities in vivo. Science 306, 2087–2090. [DOI] [PubMed] [Google Scholar]
- Michael S, Petrocine SV, Qian J, Lamarche JB, Knutson MD, Garrick MD, and Koeppen AH (2006). Iron and iron-responsive proteins in the cardiomyopathy of Friedreich’s ataxia. Cerebellum 5, 257–267. [DOI] [PubMed] [Google Scholar]
- Miranda CJ, Santos MM, Ohshima K, Smith J, Li L, Bunting M, Cossee M, Koenig M, Sequeiros J, Kaplan J, et al. (2002). Frataxin knockin mouse. FEBS Lett 512, 291–297. [DOI] [PubMed] [Google Scholar]
- Muhlenhoff U, Richhardt N, Gerber J, and Lill R (2002). Characterization of iron-sulfur protein assembly in isolated mitochondria. A requirement for ATP, NADH, and reduced iron. J Biol Chem 277, 29810–29816. [DOI] [PubMed] [Google Scholar]
- Ohgami RS, Campagna DR, Greer EL, Antiochos B, McDonald A, Chen J, Sharp JJ, Fujiwara Y, Barker JE, and Fleming MD (2005). Identification of a ferrireductase required for efficient transferrin-dependent iron uptake in erythroid cells. Nat Genet 37, 1264–1269. [DOI] [PMC free article] [PubMed] [Google Scholar]
- Ohgami RS, Campagna DR, McDonald A, and Fleming MD (2006). The Steap proteins are metalloreductases. Blood 108, 1388–1394. [DOI] [PMC free article] [PubMed] [Google Scholar]
- Parent A, Elduque X, Cornu D, Belot L, Le Caer JP, Grandas A, Toledano MB, and D’Autreaux B (2015). Mammalian frataxin directly enhances sulfur transfer of NFS1 persulfide to both ISCU and free thiols. Nat Commun 6, 5686. [DOI] [PubMed] [Google Scholar]
- Park S, Gakh O, O’Neill HA, Mangravita A, Nichol H, Ferreira GC, and Isaya G (2003). Yeast frataxin sequentially chaperones and stores iron by coupling protein assembly with iron oxidation. J Biol Chem 278, 31340–31351. [DOI] [PubMed] [Google Scholar]
- Parkinson MH, Boesch S, Nachbauer W, Mariotti C, and Giunti P (2013). Clinical features of Friedreich’s ataxia: classical and atypical phenotypes. J Neurochem 126 Suppl 1, 103–117. [DOI] [PubMed] [Google Scholar]
- Peterson EA, and Sober HA (1954). Preparation of Crystalline Phosphorylated Derivatives of Vitamin B6. Journal of the American Chemical Society 76, 169–175. [Google Scholar]
- Poburski D, Boerner JB, Koenig M, Ristow M, and Thierbach R (2016). Time-resolved functional analysis of acute impairment of frataxin expression in an inducible cell model of Friedreich ataxia. Biol Open 5, 654–661. [DOI] [PMC free article] [PubMed] [Google Scholar]
- Potaman VN, Oussatcheva EA, Lyubchenko YL, Shlyakhtenko LS, Bidichandani SI, Ashizawa T, and Sinden RR (2004). Length-dependent structure formation in Friedreich ataxia (GAA)n*(TTC)n repeats at neutral pH. Nucleic Acids Res 32, 1224–1231. [DOI] [PMC free article] [PubMed] [Google Scholar]
- Reetz K, Dogan I, Costa AS, Dafotakis M, Fedosov K, Giunti P, Parkinson MH, Sweeney MG, Mariotti C, Panzeri M, et al. (2015). Biological and clinical characteristics of the European Friedreich’s Ataxia Consortium for Translational Studies (EFACTS) cohort: a cross-sectional analysis of baseline data. Lancet Neurol 14, 174–182. [DOI] [PubMed] [Google Scholar]
- Rouault TA (2012). Biogenesis of iron-sulfur clusters in mammalian cells: new insights and relevance to human disease. Dis Model Mech 5, 155–164. [DOI] [PMC free article] [PubMed] [Google Scholar]
- Rouault TA, and Tong WH (2008). Iron-sulfur cluster biogenesis and human disease. Trends Genet 24, 398–407. [DOI] [PMC free article] [PubMed] [Google Scholar]
- Rouxel OJ, Bekker A, and Edwards KJ (2005). Iron isotope constraints on the Archean and Paleoproterozoic ocean redox state. Science 307, 1088–1091. [DOI] [PubMed] [Google Scholar]
- Rytkonen KT, and Storz JF (2011). Evolutionary origins of oxygen sensing in animals. EMBO Rep 12, 3–4. [DOI] [PMC free article] [PubMed] [Google Scholar]
- Salahudeen AA, Thompson JW, Ruiz JC, Ma HW, Kinch LN, Li Q, Grishin NV, and Bruick RK (2009). An E3 ligase possessing an iron-responsive hemerythrin domain is a regulator of iron homeostasis. Science 326, 722–726. [DOI] [PMC free article] [PubMed] [Google Scholar]
- Sanjana NE, Shalem O, and Zhang F (2014). Improved vectors and genome-wide libraries for CRISPR screening. Nat Methods 11, 783–784. [DOI] [PMC free article] [PubMed] [Google Scholar]
- Schofield CJ, and Ratcliffe PJ (2004). Oxygen sensing by HIF hydroxylases. Nat Rev Mol Cell Biol 5, 343–354. [DOI] [PubMed] [Google Scholar]
- Semenza GL (2003). Targeting HIF-1 for cancer therapy. Nat Rev Cancer 3, 721–732. [DOI] [PubMed] [Google Scholar]
- Shan Y, Schoenfeld RA, Hayashi G, Napoli E, Akiyama T, Iodi Carstens M, Carstens EE, Pook MA, and Cortopassi GA (2013). Frataxin deficiency leads to defects in expression of antioxidants and Nrf2 expression in dorsal root ganglia of the Friedreich’s ataxia YG8R mouse model. Antioxid Redox Signal 19, 1481–1493. [DOI] [PMC free article] [PubMed] [Google Scholar]
- Speerschneider T, and Thomsen MB (2013). Physiology and analysis of the electrocardiographic T wave in mice. Acta Physiol (Oxf) 209, 262–271. [DOI] [PubMed] [Google Scholar]
- Sturm B, Bistrich U, Schranzhofer M, Sarsero JP, Rauen U, Scheiber-Mojdehkar B, de Groot H, Ioannou P, and Petrat F (2005). Friedreich’s ataxia, no changes in mitochondrial labile iron in human lymphoblasts and fibroblasts: a decrease in antioxidative capacity? J Biol Chem 280, 6701–6708. [DOI] [PubMed] [Google Scholar]
- Sutton VR, Mettert EL, Beinert H, and Kiley PJ (2004). Kinetic analysis of the oxidative conversion of the [4Fe-4S]2+ cluster of FNR to a [2Fe-2S]2+ Cluster. J Bacteriol 186, 8018–8025. [DOI] [PMC free article] [PubMed] [Google Scholar]
- Thompson JW, Salahudeen AA, Chollangi S, Ruiz JC, Brautigam CA, Makris TM, Lipscomb JD, Tomchick DR, and Bruick RK (2012). Structural and molecular characterization of iron-sensing hemerythrin-like domain within F-box and leucine-rich repeat protein 5 (FBXL5). J Biol Chem 287, 7357–7365. [DOI] [PMC free article] [PubMed] [Google Scholar]
- Tsai CL, and Barondeau DP (2010). Human frataxin is an allosteric switch that activates the Fe-S cluster biosynthetic complex. Biochemistry 49, 9132–9139. [DOI] [PubMed] [Google Scholar]
- Van Vranken JG, Jeong MY, Wei P, Chen YC, Gygi SP, Winge DR, and Rutter J (2016). The mitochondrial acyl carrier protein (ACP) coordinates mitochondrial fatty acid synthesis with iron sulfur cluster biogenesis. Elife 5. [DOI] [PMC free article] [PubMed] [Google Scholar]
- Vashisht AA, Zumbrennen KB, Huang X, Powers DN, Durazo A, Sun D, Bhaskaran N, Persson A, Uhlen M, Sangfelt O, et al. (2009). Control of iron homeostasis by an iron-regulated ubiquitin ligase. Science 326, 718–721. [DOI] [PMC free article] [PubMed] [Google Scholar]
- Venkateswara Rao P, and Holm RH (2004). Synthetic analogues of the active sites of iron-sulfur proteins. Chem Rev 104, 527–559. [DOI] [PubMed] [Google Scholar]
- Vreugdenhil M, Jefferys JG, Celio MR, and Schwaller B (2003). Parvalbumin-deficiency facilitates repetitive IPSCs and gamma oscillations in the hippocampus. J Neurophysiol 89, 1414–1422. [DOI] [PubMed] [Google Scholar]
- Webert H, Freibert SA, Gallo A, Heidenreich T, Linne U, Amlacher S, Hurt E, Muhlenhoff U, Banci L, and Lill R (2014). Functional reconstitution of mitochondrial Fe/S cluster synthesis on Isu1 reveals the involvement of ferredoxin. Nat Commun 5, 5013. [DOI] [PubMed] [Google Scholar]
- Whitnall M, Suryo Rahmanto Y, Huang ML, Saletta F, Lok HC, Gutierrez L, Lazaro FJ, Fleming AJ, St Pierre TG, Mikhael MR, et al. (2012). Identification of nonferritin mitochondrial iron deposits in a mouse model of Friedreich ataxia. Proc Natl Acad Sci U S A 109, 20590–20595. [DOI] [PMC free article] [PubMed] [Google Scholar]
- Wilson RB, and Roof DM (1997). Respiratory deficiency due to loss of mitochondrial DNA in yeast lacking the frataxin homologue. Nat Genet 16, 352–357. [DOI] [PubMed] [Google Scholar]
- Yoon H, Golla R, Lesuisse E, Pain J, Donald JE, Lyver ER, Pain D, and Dancis A (2012). Mutation in the Fe-S scaffold protein Isu bypasses frataxin deletion. Biochem J 441, 473–480. [DOI] [PMC free article] [PubMed] [Google Scholar]
- Yoon H, Knight SA, Pandey A, Pain J, Zhang Y, Pain D, and Dancis A (2014). Frataxin-bypassing Isu1: characterization of the bypass activity in cells and mitochondria. Biochem J 459, 71–81. [DOI] [PMC free article] [PubMed] [Google Scholar]
Associated Data
This section collects any data citations, data availability statements, or supplementary materials included in this article.
Supplementary Materials
Figure S1- Proliferation, not cell death, is affected in FXN depleted cells. Related to Figure 1. (A) Three-day proliferation assay of control or FXN KO K562 cells. Cells were grown in 21% O2, 5% O2 or 1% O2 (B) Immunoblot of FXN KO 293T cells grown in 21% O2, 1% O2 or 21% O2 with 75 μM FG-4592, blotted for FXN and ACTIN. (C) Growth curve of WT and FXN KO 293T cells, generated under 1% O2, and transitioned to 21% O2 or 1% O2 on day 1. (D) Annexin V staining of FXN KO K562 cells grown in 21% O2 or 1% O2. As a positive control, K562 cells were treated for 24h with 2μg/ml puromycin. (E) Yeast genomic PCR for YFH1 or ACT1 from WT or Δyfh1 strains. (F) Top: Two-day proliferation assay of lymphoblastoid cells derived from FRDA patients or sex and age matched controls in 21% O2 or 30% O2. Bottom: Immunoblot of lymphoblastoid cells derived from FRDA patients or sex and age matched controls, blotted for FXN and TIMM23. (G) Top: Three-day proliferation assay of K562 cells KO for FXN or mitochondrial complex I subunits- NDUFS1 or NDUFA2- vs. control cells in 21% O2, 1% O2 or 21% O2 with 75 μM FG-4592. Bottom: Immunoblot and qPCR control of NDUFS1 or NDUFA2 depletion. All bar plots show mean ± SD. *=p < 0.05, **=p < 0.001, ***=p < 0.001, ****=p < 0.0001. One-way ANOVA with Bonferroni’s post-test.
Figure S2- Cytosolic and mitochondrial Fe-S biosynthesis machineries are highly essential in numerous cell lines. Related to Figure 2. (A) Essentiality of mitochondrial and cytosolic Fe-S assembly machinery (ISC and CIA, respectively) as well as Fe-S containing proteins, across 342 cancer cell lines. CERES score quantifies the growth defect of each gene knockout in genome-wide CRISPR screens. (B) Distribution of CERES score of ISC, CIA and Fe-S containing proteins across 342 cancer cell lines. (C) Immunoblot validation of Fe-S assembly and chaperone machinery depletion lines, blotting for ISCU, NFS1, LYRM4, GLRX5, HSCB, CIAO3, ACTIN and TIMM23. (D) Immunoblot of Fe-S assembly machinery overexpression lines, blotting for FXN, ISCU, LYRM4, NFS1 and TUBULIN.
Figure S3- Quantification of the steady state levels of Fe-S containing processes in FXN null cells grown in hypoxia. Related to Figure 3. (A) Quantification of NDUFB8 and SDHB immunoblots, normalized to TUBULIN levels. (B) Oxygen consumption rates for WT or FXN KO K562 cells grown at 21% O2 (top) or 1% O2 (bottom), following addition of oligomycin, CCCP and antimycin. (C) Basal and uncoupled maximal respiration of for WT or FXN KO K562 cells grown at 21% O2 or 1% O2. (D) Quantification of FECH immunoblots, normalized to TOMM20 levels. (E) Quantification of POLD1 immunoblots, normalized to ACTIN levels. All bar plots show mean ± SD. *=p < 0.05, **=p < 0.001. One-way ANOVA with Bonferroni’s post-test.
Figure S4- The nascent Fe-S cluster on ISCU is stable under anaerobic conditions. Related to Figure 4. CD intensity at 330 nm vs time of reaction for [2Fe-2S] cluster stability on ISCU-NFS1-LYRM4-ACPec complex without (left) and with (right) FXN under anaerobic conditions.
Figure S5- Multiple signaling pathways are remodeled in FXN null cells. Related to Figure 5. (A) Quantification of ATF4 activation immunoblots, normalized to ACTIN levels. (B) Immunoblot of FXN KO cells grown in 21% O2 or 1% O2, blotted for KEAP1 and ACTIN. (C) mRNA levels of NRF2 in FXN KO cells grown in 21% O2 or 1% O2. (D) Quantification of IRP2 activation immunoblots, normalized to ACTIN levels. (E) Immunoblot of control or ISC machinery KO cells grown in 21% O2 or 1% O2, blotted for ATF4, NRF2, IRP2, ACTIN. (F) Quantification of FER-H immunoblots, normalized to ACTIN levels. (G) Mitochondrial Fe2+ measurements with the quenchable fluorescent dye RPA in FXN KO cells grown in 21% O2 or 1% O2. (H) Mitochondrial membrane potential measurements with TMRE FXN KO cells grown in 21% O2 or 1% O2. As a control, the mitochondrial membrane potential was dissipated with Oligomycin and Antimycin (A+O). (I) Immunoblot validation of sgFBXL5 cells, blotted for FBXL5 and TUBULIN. (J) Immunoblot validation of sgIRP2, sgFXN and double sgIRP2+sgFXN cells, blotted for IRP2, FXN and ACTIN. (K) Three-day proliferation assay of control, FXN KO, STEAP3 KO or double STEAP3 FXN KO cells in 21% O2 or 1% O2. (L) Immunoblot validation of sgSTEAP3, sgFXN and double sgSTEAP3+sgFXN cells, blotted for STEAP3, FXN and ACTIN. All bar plots show mean ± SD. *=p < 0.05, **=p < 0.001, ***=p < 0.001, ****=p < 0.0001. One-way ANOVA with Bonferroni’s post-test.
Figure S6- Hypoxia improves the growth of many ISC mutants in C. elegans but only frataxin mutants are fully rescued. Related to Figure 6. (A) Total progeny produced from animals incubated at 21% O2, 5% O2 or 1% O2. Mothers were balanced heterozygotes (mutant/+). (B) Animal length after 4 days of growth at 21% or 1% O2. Mothers were frh-1(tm5913) homozygotes. (C) Animal length after 2 days growth at 21% or 1% O2. Mothers were balanced heterozygotes (mutant/+). (D) Animal length after 3 days growth at 21% or 1% O2. Mothers were balanced heterozygotes (mutant/+). All error bars represent standard deviation. *=p < 0.05, **=p < 0.01, ***=p < 0.001, ****=p < 0.0001. One-way ANOVA with Bonferroni’s post-test.
Figure S7- Hypoxia attenuates ataxia-associated phenotypes, but not cardiomyopathy, in murine model of FRDA. Related to Figure 7. (A) Weekly body weight measurements from WT and shFXN mice housed in hypoxia and normoxia (n=10 per group). (B) Stride length analysis for WT or shFXN mice housed in normoxia or hypoxia at 12 weeks. Stride length was calculated as the average of at least 3 strides per mouse (n≥ 6 per group). (C) Inverted screen test analysis for WT or shFXN mice housed in normoxia or hypoxia at 15 weeks. Time to fall is represented (n≥ 4 per group) (D) Accelerating rotarod analysis for WT or shFXN mice housed in normoxia or hypoxia at 15 weeks. Latency to fall measured as mean value of triplicate trials per mouse (n≥ 4 per group). (E) Stride length analysis for WT or shFXN mice housed in normoxia or hypoxia at 15 weeks. Stride length was calculated as the average of at least 3 strides per mouse (n≥ 4 per group). (F) Quantification of mean parvalbumin staining intensity in Purkinje cells from WT or shFXN mice housed in 21% O2 or 11% O2. Each plot represents one animal. (G) Quantification of mean parvalbumin staining intensity in the primary visual cortex WT or shFXN mice housed in normoxia or hypoxia. Each plot represents one animal. (H) Representative electrocardiogram traces of for WT or shFXN mice housed in normoxia or hypoxia. (I) Echocardiogram measurement of left ventricular (LV) internal diameter at end-systole from WT and shFXN mice housed in hypoxia and normoxia (n≥ 5 per group). (J) Echocardiogram measurement of LV fractional shortening from WT and shFXN mice housed in hypoxia and normoxia (n≥ 5 per group). (K) Summary model. Fe-S clusters are made from ferrous iron, cysteine (a sulfur donor), and electrons. Once made, this cluster can subsequently degrade. FXN can promote Fe-S biosynthesis, likely as an allosteric regulator of the ISC assembly machinery. Hypoxia can complement for loss of FXN through several mechanisms: (1) boosting Fe-S biosynthesis, (2) providing the appropriate environmental context for the activation of the iron response, which elevates the levels of bioavailable iron in hypoxic environments, (3) inhibiting Fe-S cluster degradation. All bar plots show mean ± SD. *=p < 0.05, **=p < 0.01, ***=p < 0.001, ****=p < 0.0001. One-way ANOVA with Bonferroni’s post-test for bar plots and nested one-way ANOVA with Bonferroni’s post-test for parvalbumin intensity.