

Abstract
Single-cell analysis provides insights into cellular heterogeneity and dynamics of individual cells. This feature highlights recent developments in key analytical techniques suited for single-cell metabolic analysis with a special focus on mass spectrometry-based analytical platforms and RNA-seq, as well as imaging techniques that reveal stochasticity in metabolism.
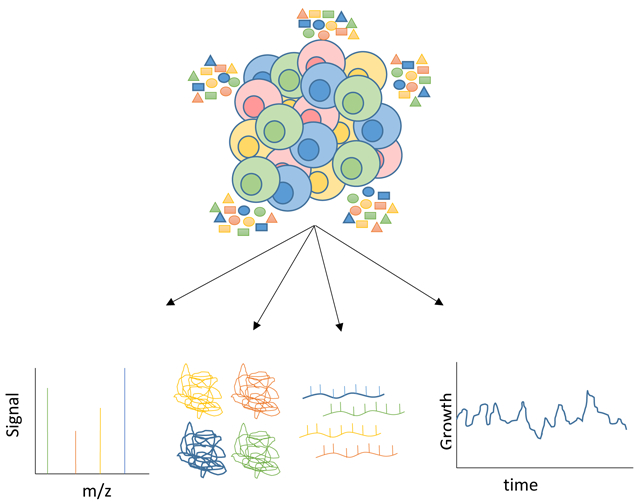
Graphical Abstract
Cellular heterogeneity and metabolism
Metabolism is a key physiological process that is involved in cellular maintenance, growth, division and contributes to cellular heterogeneity.1,2 Metabolism is an ensemble of biochemical reactions that sustain life in a cell. These reactions accomplish three major tasks: the provision of energy for biological functions, biosynthesis (anabolism) of the cell’s building blocks (lipids, proteins, and nucleic acids) and degradation (catabolism) of cellular content. Studies of cellular metabolism aim to characterize the abundance and activity of the plethora of enzymes, cofactors and metabolites which form large, complex metabolic networks. Metabolic heterogeneity underpins single-cell phenomena such as immune cell plasticity, microbial drug tolerance and growth variability.3
Cellular heterogeneity is a phenomenon that is often observed in biology but poorly understood. It is caused by various genetic, epigenetic and environmental factors and is reflected by differences in morphology, physiology and pathology.4,5 This highlights the necessity to study the biochemical and physiological characteristics of individual cells and their environment. However, conventional technologies often use bulk population-level measurements, ignoring the unique behavior resulting from cell-to-cell variations, including cellular metabolism, growth and proliferation.5 Most existing studies on metabolism have used population-level measurements, which implicitly assume that the used cell populations are homogeneous. Therefore, to understand the link between the genotype and phenotype of a single cell a holistic understanding of cell-heterogeneity at all levels of the molecular architecture (genome, epigenome transcriptome, proteome and metabolome) is needed.
Only recently advances in bioanalytical technologies have enabled the study of transcripts,6 proteins,7,8 and metabolites in single cells,9 which in turn empowered the ability to study cellular heterogeneity and how this heterogeneity is important to normal and impaired processes. Single-cell transcriptomics examines gene expression levels of individual cells by measuring messenger RNA (mRNA) concentrations and offers a comprehensive understanding of how transcriptomic cellular states translate into functional phenotypic states. How the expressed proteome differs from cell to cell is a question of high interest as proteins represent the main machinery of cells, performing a vast array of functions within organisms such as catabolizing metabolic reactions (enzymes), DNA replication and providing structure to the cell and transport. Single-cell metabolomics offers comprehensive profiling of the full complement of small molecular weight compounds and thereby provides the most accurate depiction of the cellular reaction network. Finally, single-cell phenotypic analysis using imaging-based techniques even allow the study of metabolism and growth heterogeneity in live cells.
This feature article provides vignettes of studies that have recently used single-cell analytics to study cell heterogeneity. We apologize to anyone whose important work could not be included due to size limitations.
Single-cell Transcriptomics
Single-cell transcriptomics is a rapidly evolving field that will play a major role in understanding metabolism at the single-cell level. Currently, the most prevalent method for transcriptomic studies is RNA-sequencing (RNA-seq). This method is based on reverse transcription of mRNA into complementary DNA, followed by subsequent polymerase chain reaction (PCR) amplification and deep sequencing.10 In contrast to earlier methods for gene expression analysis, RNA-seq allows for the sequencing of the entire transcriptome. Single-cell RNA-seq (scRNA-seq), which has been developed over the past few years, can obtain gene expression profiles of individual cells across cell types, states, and subpopulations (Fig. 1). This advance was made possible by the ability to capture and sequence very low amounts of RNA. Typically, individual cells are captured in sub-microliter droplets using dedicated microfluidic devices or sorted into regular multiwell plates. After lysing the cells in these small reaction volumes, cells are barcoded during reverse transcription using cell-specific DNA primers. During sequencing these barcodes are used to assign sequencing reads to individual cells. While some methods, such as Smart-seq11 collect reads from the entire transcript (full-length coverage), the majority of methods only capture the 3’ or 5’ ends. For example, Drop-seq12 identifies transcripts by their 3’ ends. This and other methods incorporate unique molecular identifiers, random transcript-specific barcodes to circumvent PCR bias and thereby improve quantification of gene expression. The choice of a particular scRNA-seq method largely depends on the scientific question. We refer the reader to recent reviews for detailed information about various methods13,14
Fig. 1: Single-cell transcriptome analyses of tissues and cell types.

Reproduced with permission from ref10 Copyright (2014) Springer Nature.
Despite being around for only a few years, scRNA-seq has already produced a host of valuable insights, for example, on the dynamics of embryonic developmental and stem cell differentiation,15 the composition of complex tissues,16 and expression differences and heterogeneity caused by diseases, such as cancer.17
Several studies have used scRNA-seq to catalog metabolic changes during developmental processes. Zeng et al. quantified gene expression in single mouse β cells during postnatal development.18 By collecting cells at different time points and ordering them along a common molecular trajectory, the transcriptional dynamics of β cell maturation were revealed. In particular, the authors identified the dynamic expression of genes related to several important metabolic pathways (regulation of amino acid uptake and metabolism, production of reactive oxygen species), as well as a network of nutrient-responsive transcription factors. Another scRNA-seq study, by Arris et al., focused on metabolic aspects of eye-disc development in Drosophila.19 By comparing wild-type eye disc-cells with Rbf (retinoblastoma family protein)-mutant cells, the authors identified a subpopulation of mutant cells with higher glycolytic activity. The metabolic state was inferred from the expression of the pro-apoptotic gene Hid (cell death protein) in conjunction with an upregulation of Ald (Fructose biphosphate aldolase), Ldh (lactate dehydrogenase) and Hif1α (Hypoxia-inducible factor 1 alpha). The results were validated by RNA interference and immunostaining. A paper by Guo et al. studied the development of human spermatogonial stem cells.20 This study discovered four dynamic cellular states (quiescent, proliferating, metabolically active, and differentiating), which differ substantially in their metabolism. Adult stem cells have also been characterized by scRNA-seq. Dulken et al. quantified the heterogeneity and transcriptional dynamics in the adult neural stem cell lineage (NSC) by scRNA-seq. They reported a continuum of cell states during the differentiation process and identified rare intermediate states with distinct molecular profiles.21
scRNA-seq has also been used extensively to catalog the cell types in complex tissues. For example, several recent studies have revealed the cell types in the human developing kidney (22-24). These studies revealed a clear divergence from mouse kidney development, arguing for caution when using the mouse as a model system for human development. In addition, scRNA-seq allowed the identification of several subtypes of renal progenitor cells which were distinguished by the expression of metabolism- and stress-related genes.24 Interestingly, the progenitor subtypes also differed in their proliferation state. These changes in metabolism and stress response are likely a consequence of differentiation but they could potentially also have a causal role.
Metabolic changes in disease are also increasingly studied with single-cell transcriptomics methods. Segerstolpe et al. profiled human pancreatic islets from healthy individuals as well as type 2 diabetes patients with scRNA-seq.25 They identified subpopulations within both endocrine and exocrine cell types. Clear transcriptional alterations were found in type 2 diabetes patients compared to healthy subjects. The well-known heterogeneity within or between tumors, is another area of application for scRNA-seq (see, for example, ref 17). In a recent paper, Xiao et al., have shown that mitochondrial activity is a major driver of the heterogeneity among both malignant and non malignant cells.26 In malignant cells the authors found a positive pairwise correlation between glycolysis, oxidative phosphorylation and hypoxia. The fact that these cells activate both glycolytic and oxidative phosphorylation pathways under hypoxic conditions may be an important factor contributing to the high proliferation of cancer cells. It will be a major challenge for the future to integrate a large number of such studies with the existing knowledge of metabolic networks and achieve a consistent view of metabolic changes in tumor tissue. An approach developed by Damiani et al.27 extended the well-established Flux Balance Analysis (FBA),28 to infer the flow of metabolites in single-cell. Their method allows the translation of single-cell transcriptomes to so-called single-cell fluxomes. Integration of single-cell cancer transcriptomes with bulk extracellular fluxes of the same samples revealed differences in growth rates between subpopulations captured cell-cell interactions.
scRNA-seq further unraveled the effect of obesity on the quality of oocytes in women undergoing fertility treatment29. In this study, single-cell transcriptomics was coupled with lipid level measurements in serum and follicular fluid. Some genes related to fat metabolism, proinflammatory conditions and oxidative stress were found to be deregulated in oocytes from obese women compared to normal weight women. This suggests that obesity might compromise the metabolism and thereby integrity and competence of oocytes.
A major limitation of current scRNA-seq modalities is that they provide snapshots of mRNA abundance, but cannot quantify RNA turnover dynamics (i.e. transcription and degradation rates). This is mainly due to the destruction of the cells in the process of sequencing library preparation.30 In a recent study, La Manno et al. partially overcame this limitation by using the ‘RNA velocity’ of each gene, i.e. the ratio of unspliced mRNA to spliced mRNA to deduce a probabilistic description of expression dynamics.31 Moreover, new approaches based on labeling of newly transcribed RNA and biochemical nucleoside conversions followed by RNA-seq have been used to study RNA dynamics in mammalian cells.32 These methods provide high temporal resolution of short-term changes in gene expression and are able to reveal kinetics of RNA processing and even catch the most unstable RNAs. Another recent method (NASC-seq) sequences simultaneously pre-existent and newly synthesized RNA.33 This method is based on the integration of 4-thiouridine (4sU) into newly synthesized RNA during transcription. 4sU-labelled and unlabelled RNA can then be distinguished after the reverse transcription step where alkylated 4sU residues triggers the misincorporation of guanines instead of adenosines in the complementary DNA.
Although scRNA-seq cannot measure metabolic state directly, the highlighted studies revealed the value of the method for studying metabolism. Major metabolic programs can often be inferred from the expression of key pathway components.
Single-cell Proteomics
Proteins represent the main machinery of cells, performing a vast array of functions within organisms such as catabolizing metabolic reactions (enzymes), DNA replication, providing structure to the cell and transport.34 How the expressed proteome differs from cell to cell is, therefore, a question of high interest. However, complex correlations between gene transcription and protein production in developing systems (see, for example,35) call for careful validation of transcriptomics results, one gene at a time (e.g., using antibodies). Only recently has mass spectrometry become sensitive enough to enable the direct (un)targeted characterization of proteins in single cells. The current state of single-cell mass spectrometry has been the focus of several reviews lately (see examples in references36-47); therefore, the following discussions are intended to only provide glimpses of developments that showcase emerging applications and developmental opportunities in proteomics and metabolomics of single cells.
Mass cytometry (CyTOF)7 has enabled the screening of known proteins among single cells in record throughput. This technology leverages heavy-metal conjugated antibodies to recognize surface receptors on cells as well as intracellular signaling molecules, which are then separated by flow cytometry, atomized and ionized in an inductively coupled plasma, and the generated heavy-metal ions are detected in a mass spectrometer with a capability for multiplexing (up to ~40 labels currently). Wang et al. revealed three major clusters of beta cells within the human endocrine pancreas. From these three clusters, two consisted of proliferating cells.48 Additionally, the technology was used to obtain a detailed view of immune system regeneration by measuring overall immune cell population variation over time in individual patients after allogeneic stem cell transplantation49 to identify early reprogramming regulators in induced pluripotent stem cell reprogramming systems 50 and for the high-throughput quantitation of inorganic nanoparticle bio-distribution in mouse lymph node cells.51 CyTOF presents new directions in single-cell proteomics for studies in which known proteins need analysis and functioning, high-fidelity antibodies are available for the proteins of interest.
Single-cell Proteomics by Mass Spectrometry
Label-free proteomics provides unbiased and quantitative characterization of large numbers of proteins in single cells without a requirement for known proteins or probes (e.g., no antibodies needed). Detection of abundant proteins (α and β globulins) in individual erythrocytes by capillary electrophoresis (CE)-MS52-54 raised the promise of MS-based proteomics for single cells already in the mid-1990s. However, without molecular amplification feasible for the whole proteome, label-free detection of hundreds-to-thousands of proteins required major leaps in MS sensitivity. To fill these technological gaps, Nemes et al. have pioneered custom-built microanalytical CE platforms53,55,56 for identifying proteins by high-resolution MS in ultrahigh sensitivity.57 Lombard et al. has identified ~1,709 different protein groups, including several transcription factors, in identified cells that were dissected from 16-cell X. laevis embryos,58 marking the first example of large-scale identification of proteins in single cells in MS. The Nemes group has uncovered previously unknown proteomic differences between cells that occupy the dorsal-ventral and animal-vegetal axes of the 16-cell X. laevis embryo,58 which were undetectable at the level of transcription, and even found evidence for proteomic differences between cells fated to give rise to neural tissue in the frog (intra-cell type heterogeneity).59 Choi et al. has developed specialized CE-ESI interfaces60 and microanalytical workflows61 towards detecting proteins from single neurons in the mouse brain, opening a door to the molecular characterization of cell types in the mammalian brain (unpublished). These developmental milestones essentially laid the foundation for single-cell proteomics using MS.57
They also spurred the development of other innovative technologies and methodologies. Sun et al. have demonstrated that whole-cell dissection of identified cells in X. laevis (recall reference58) can be integrated with conventional liquid chromatography MS to identify proteins in frog embryos,62 albeit at lower sensitivity than CE-MS. To minimize peptide losses, Shi et al. used abundant (carrier) proteins, thus enhancing protein detection to 200,000 copies per cell.63 Budnik et al. developed Single Cell ProtEomics by Mass Spectrometry (SCoPE-MS) as an alternative, in which peptides from single cells as well as a population of cells (pooled) were individually barcoded and mixed to boost sequence coverage for peptides while using the reporter ions for relative quantification of protein levels between the dissociated single cells8. The technology has demonstrated a utility in quantifying thousands of proteins in single differentiating cells, complementing information on gene expression using single-cell transcriptomics. Zhu et al. introduced nanoPOTS (nanodroplet processing in one pot for trace samples), a microfabricated platform, capable of minimizing peptide losses by miniaturization, enabling the identification of ~1,500–3,000 protein groups from ~10 cultured mammalian cells.64 Most recently, Lombard et al. have integrated subcellular capillary microsampling with CE-ESI-MS to enable, for the first time, proteomics in single identified cells directly in complex tissues, including live embryos of X. laevis and zebrafish, without necessitating whole-cell dissection.65 Quantification of ~800 protein groups in subcellular sampling has revealed previously unknown reorganization of the single-cell proteome as the midline dorsal-animal cell gave rise to is neural-tissue fated cell clone in the live frog embryo.
Next to CE-ESI-MS based plaforms to characterize proteins in single cells, nano-LC-MS/MS is widely used in proteome analysis. For instance, a combination of fluorescence-activated cell sorting and ultra sensitive nano-LC-MS/MS was used to identify specific protein markers for epithelial and mesenchymal cells in human lung primary cells.66 Additionally, integrated single HeLa cell proteomic analysis covered a maximum of 328 proteins by using a recently developed Orbitrap Fusion Tribrid MS. This integrated proteomic analysis device (the i-PAD1) clearly demonstrated cellular heterogeneity of the proteome at the single-cell level.67
These and ongoing technological developments (see reviews) are heralding a new era of systems cell biology by enabling the label-free quantification of large numbers of proteins and complementing single-cell transcriptomics.
Single-cell Metabolomics
In order to achieve a comprehensive characterization of single-cell metabolic dynamics, analytical techniques are required that perform quantitative analyses with high sensitivity, accuracy and precision. In this context, MS emerged as the eminent method of choice in single-cell metabolic studies68 (Fig. 2). Recent advances have provided MS with the necessary sensitivity to detect many metabolites in single cells, thus providing molecular information to complement data from single-cell transcriptomics and single-cell proteomics. In this section, we selected representative single-cell MS technologies for metabolomics studies.
Fig. 2: Common mass spectrometric techniques in single-cell metabolic analysis.

Working principles of MALDI (a), DESI (b) and SIMS (c), their beam diameters (d), mass detection ranges (e) and sample preparation times (f). Reproduced with permission from ref124 Copyright (2018) ROYAL SOCIETY OF CHEMISTRY.
Matrix- assisted laser desorption / ionization (MALDI)
Matrix-assisted laser desorption/ionization (MALDI) is a soft ionization method used for biological mass spectroscopy. It has become well-established in –omics studies as it requires low sample consumption, minimal sample handling and fragmentation and offers high sensitivity. Fundamentally, MALDI works by incorporating analytes into organic matrices and upon irradiation of the sample with a pulsed laser, analytes are ionized and accelerated to a mass spectrometer analyzer.69 Typically, a time-of-flight MS (TOF-MS) is used owing to its exceptional acquisition rates and dynamic range. Moreover, these spectrometers offer high sensitivity, resolving power and mass accuracy, thus facilitating characterization of metabolites. MALDI-MS has previously been used in single-cell analyses as well as multidimensional imaging of metabolic dynamics in cellular and sub-cellular space.70-73 For instance, the utility of MALDI-MS for tracing intracellular metabolic dynamics was investigated by Yukihira et al., who observed a time-dependent (7 minutes) rapid relief of glucose limitation in Escherichia coli during environmental carbon source perturbation.74 Furthermore, Duenas et al. were the first to apply MALDI-MS for 3D chemical imaging of single-cell lipid dynamics during the embryonic development of zebrafish. They revealed that the dimensional spatial distribution of phospholipids and ceramide containing lipids in embryos at the 1-, 2-, 4-, 8-, and 16-cell stage had heterogeneous localization.73 Moreover, microarrays for mass spectrometry (MAMS, a type of substrate for MALDI-MS) were used to automatically isolate single cells in a spatially organized matrix by using hydrophilic reservoirs. This approach enabled the successful monitoring of time-dependent (time scale: 0, 5 and 10 minutes) glycolytic metabolite change in environmentally (2-deoxy-d-glucose) and genetically (ΔPFK2) perturbed Saccharomyces cerevisiae (yeast) cells at the single-cell level.75
One of the main limitations of MALDI-MS in single-cell metabolomics is signal suppression by low-mass ions (typically, m/z <700) used in matrix preparation such as 2,5-dihydroxybenzoic acid (DHB) and α-cyano-4-hydroxycinnamic acid (CHCA)), resulting in difficulties to reliably measure low-molecular-weight metabolites.76 One potent approach proposed to circumvent this limitation is the use of matrix-free ionization methods, including laser desorption/ionization, based on nanophotonic effects. Nanostructures such as silicon nanopost arrays (NAPAs) substitute conventual matrices and act as nanoantennae that harvest light from the laser leading to subsequent ionization of the sample.77 NAPA-MS has already been used to detect intra- and interpopulation metabolic differences between stressed and control microbial cells.78 A recently developed method that combines fluidic force microscopy and MALDI-MS has been shown to be a potent tool for live analysis of the single-cell metabolome under physiological conditions.79
Secondary ion mass spectrometry imaging techniques
Secondary ion mass spectrometry (SIMS) has become an increasingly popular technique to measure metabolites at single-cell and sub-cellular resolution. In the SIMS modality, a focused primary pulsed ion beam is used to bombard a sample, ejecting secondary ions from the sample surface that are subsequently measured using a mass spectrometer. SIMS imaging modalities offer micrometer to nanometer scale lateral spatial resolution and combined with TOF-MS detection make these techniques highly suitable for measuring metabolic profiles of endogenous and exogenous species in the sub-cellular space. This was demonstrated by Kurczy et al., who followed lipid domain formation in the membrane of the unicellular organism Tetrahymena thermophile.80 Moreover, nano-scale SIMS (NanoSIMS), which combines high spatial resolution with simultaneous detection of both heavy and light elements, was used by Wedlock et al. to image a new group of platinum-based chemotherapeutics, triplatin, in MCF7 breast cancer cells. This approach enabled the successful monitoring of internalization and nucleolar targeting of the drug in a time span of 2 hours.81 Another study used a combination of NanoSIMS with stable isotope monitoring to track the proliferation of cardiomyocytes. 15N labeling of thymidine and its incorporation into the DNA of young adult transgenic C57Bl/6 male mice revealed that genesis of cardiomyocytes occurs at a low rate (approximately 0.76%/year) and that cell division originated from pre-existing cardiomyocytes.82
One of the major drawbacks of SIMS-based techniques lies in obtaining structural information on analytes. The recently developed commercial parallel imaging MS/MS instrument, in which a triple electrostatic sector TOF analyzer for desired mass range measurements is coupled to an MS/MS analyzer for target identification, significantly improved the acquirement of structural information on analytes.83 Moreover, another recent instrument that has greatly facilitated metabolite identification is the MALDI/Buckyball TOF-SIMS dual ion source instrument that combines high spatial imaging and a capability for intact ion generation with MS/MS cell to image and identify biomolecules (small and large) in one single instrument.84 This C60-SIMS/MALDI dual ion source MS revealed the spatial distribution of intact biomolecules in mammalian spinal cord samples as well as networks of cultured neurons from Aplysia californica.
Direct infusion mass spectrometry analysis
Direct infusion mass spectrometry (DI-MS) analysis is based on the direct injection or infusion of sample mixtures into the ionization source of the mass spectrometer without prior chromatographic separation. Fundamentally, DI-MS utilizes the electrospray soft ionization (ESI) technique to ionize the sample of interest. The ambient conditions with minimal prior handling in DI-ESI-MS minimize disruption of the cell and its metabolome, which is often not the case in other soft ionization techniques, such as MALDI.85 An application of DI-ESI-MS is live single-cell video MS (L-SC-MS), in which sample analytes are dispersed into charged droplets followed by subsequent ionization. Recently, this method has been used to localize terpenoid indole alkaloids in specific cell types from Catharanthus roseus stem tissues86 and for the quantification of amino acids and phospholipids in cheek cells.87 Additionally, this method enabled successful detection of heterogeneity in tafluprost (drug used for glaucoma) metabolite profiles in primary human hepatocytes at the single-cell level.88
Pan et al. recently developed the Single-probe, a miniaturized multifunctional sampling and ionization device coupled to an MS. This device is based on a continuous sample extraction system through a finely pulled theta-capillary pipette and has successfully been used for the absolute, dynamic quantification of lipids, metabolites and anti-cancer drugs in HeLa cells.89 Another interesting platform involves the integration of microfluidic surface sampling with ESI-MS by a dual probe microchip. This platform, which is based on combining a sample probe for providing sample extraction buffer with an emitter probe to ionize the sample, has substantially improved the analytical performance of ambient MS methods.90
Separation-based MS approaches
Separation aids single-cell metabolomics by improving sensitivity, removing spectral interferences, and providing compound-dependent information to aid molecular identifications using MS. For instance, El Azzouny et al. used HPLC-TOF-MS to probe the effects of 5-aminoimidazole-4-carboxamide ribonucleotide (AICAR) on the synthesis of glycerolipids, ceramides, and nucleotides in INS-1 cells (β-cells). They were able to measure the change in 66 metabolites in the presence or absence of AICAR using different stable isotopic labeled nutrients to probe selected pathways.91 Moreover, a recent study identified VOC profiles from single cells that were isolated from lung cancer cell lines using GC-MS.92 The study revealed that single cells of lung cancer have unique (volatile) molecular prints; of which 18 VOCs showed significant changes in their concentration levels in tumor cells versus control.
Capillary electrophoresis (CE) has achieved considerable success in profiling metabolites in single cells.93 The Sweedler and Nemes laboratories have custom-built microanalytical CE ESI platforms capable of detecting hundreds of metabolites with low tens of attomoles of sensitivity (reviewed in Refs.55,94,95) in single identified neurons dissected from the sea slug (Aplysia californica)53,96 rat ganglion55, and electrophysiologically identified neurons in the rat brain97 as well as single identified embryonic cells isolated from 8-98-100 and 16-cell56 embryos of the South African clawed frog. The metabolic profiles quantified during these studies allowed the researchers to uncover metabolic changes as neurons were exposed to culture101 and even discover metabolites capable of altering the normal tissue fates of embryonic cells.56 Moreover, a more recent study, for the first time, demonstrated the in situ characterization of metabolic cell heterogeneity directly in 8-to-32-cell live Xenopus laevis embryos.102
Single-cell phenotypic analysis
Until recently, stochastic variability was considered to have negligible effects due to averaging of the myriad biochemical events involved in cellular metabolism. However, a recent study by Kiviet et al. showed that fluctuations in the expression of flux-limiting catabolic enzymes propagate into fluxes through metabolic pathways/networks, eventually inducing changes in a cell’s growth rate103 (Fig. 3a). These changes in cellular growth rate, in turn, affect the expression of other genes, many being unrelated. Indeed, the expression of genes requires many building blocks such as amino acids and ATP, which are produced by the metabolic machinery (Fig. 3b). These results indicate that molecular noise propagated by single metabolic enzymes can affect the entire cellular metabolism and expression of genes, suggesting that cellular metabolism is inherently stochastic. Such metabolic stochasticity can affect many cellular properties such as cell size and the cell cycle, and for instance, require compensatory mechanisms to maintain homeostasis.104,105
Fig. 3. Following metabolic fluctuations in time.

Individual cells display gene expression and growth rates that vary strongly in time, in a correlated fashion, by at least two different mechanisms: a) Fluctuations in the expression of limiting metabolic enzymes lead to metabolic fluxes that vary in time, which in turn cause delayed growth rate fluctuations. Adapted with permission from ref103 Copyright (2014) Springer Nature b) Expression itself is also affected by metabolic fluctuations, possibly mediated by varying levels of amino acids or ATP. This mechanism also generates correlations in expression and growth fluctuations, but without the time delays seen in panel a. Adapted with permission from ref125 Copyright (2018) Elsevier.
Thomas et al. developed a stochastic cell model of bacterial dynamics, based on biochemical kinetics, to identify the potential sources of fluctuations in cell growth and to understand how these fluctuations eventually lead to phenotypic heterogeneity. Their model allowed statistical characterization of the macromolecular composition, growth rate and mass of single bacterial cells. The model revealed that dynamics of mRNAs coding for nutrient transporters and enzymes is a major source of fluctuations occurring in growth rate. Fluctuations in growth rate, in turn, propagated noise to other processes such as nutrient uptake and catabolism106.
Detection of fluctuations in metabolic dynamics due to stochastic influences requires following single-cell metabolic dynamics in real-time. One of the most common approaches to follow single-cell dynamics in real-time is the use of techniques based on the measurement of single-cell fluorescent protein markers. For instance, in the Kiviet et al study, expression fluctuations of metabolic enzymes were measured by fluorescent labeling, while the growth fluctuations were quantified by image analysis of time-lapse movies. Zhang et al. developed a method to measure NAD(P)H levels dynamically in single live E. coli cells using the autofluorescence of NAD(P)H. The method consists of a microfluidic device for culturing E. coli combined with UVA-optimized microscopy equipment, allowing the determination of NAD(P)H levels in single E. coli cells at a 10-min resolution for more than 20 hours. Using this method, they revealed that intracellular NAD(P)H levels oscillate along the bacterial cell division cycle, suggesting fluctuations in metabolic activity during E.coli proliferation.107 Besides, advances in genetically encoded ATP biosensors have allowed researchers to follow fluctuations in ATP levels in real-time at the single-cell level and characterize corresponding effects at the cellular, tissue, and organismal level. Amongst others, Arai et al. developed a multicolor palette of ATP single fluorescent proteins, which enabled them to simultaneously visualize subcellular ATP dynamics in the cytoplasm and mitochondria of mammalian, plant and worm single-cells.108 Depoali et al. utilized Förster resonance energy transfer (FRET)-based ATP probes targeted to mitochondria, endoplasmic reticulum (ER) and cytosol of cancer cells in order to investigate the dynamics of intracellular ATP pools in response to acute glucose depletion, glucose substitution, as well as mitochondrial toxins.109 Another example of an advanced fluorescent biosensor, PercevalHR, was reported by Tantama et al. which was utilized for real-time measurements of the ATP:ADP ratios in neurons and astrocytes. They observed activity-dependent changes in neuronal ATP:ADP ratios that could be correlated to potassium ATP single-channel activity in the cell-attached configuration.110
Cells can also be cultured on a surface while monitoring variations in the rate of cellular growth and gene expression using quantitative fluorescent time-lapse microscopy (QFTM) to follow single-cell metabolic dynamics in time. This technique is based on the measurement of fluorescent protein markers of gene expression while recording microscopic image sequences of cell growth. For instance, a recent study showed significant cell-to-cell heterogeneity in the three major processes of metabolism (catabolism, anabolism, nutrient uptake) by measuring metabolic activities and growth kinetics of starved E. coli cells subject to nutrient upshift at single-cell resolution.111
Jing et al. developed a microfluidic cell volume sensor to measure single-cell phenotypic growth heterogeneity in Saccharomyces cerevisiae. This strain of budding yeast that can exhibit a high or a low expression state of the PDFR5 gene (coding for a transmembrane pump) was used to measure the fitness of individual cells in normal and cytotoxic conditions. Their microfluidic platform revealed an inhibited growth response of low PDFR5 expressing yeasts in a cytotoxic environment whereas the high PDRF5 expressing yeasts showed a higher fitness. Therefore, their microfluidic cell volume sensor was successfully used for characterizing the growth response and fitness of single cells in different environments.112
A label-free approach was developed by Lombard et al. who did single-cell proteomics on live cells in Xenopus embryos to uncover proteomic reorganization as an identified embryonic cell gave rise to the neural tissue fated cell clone.65
At last, metabolite abundance can be tracked in time by spectroscopic methods such as Raman Spectroscopy.113 For instance, Kang et al. used a combination of Raman spectroscopy with fluorescent microscopy to track efficient and localized drug transportation in squamous carcinoma cells.114
Outlook
Over the last decade, the interdisciplinary integration of analytical chemistry and biology has spurred the development of several technologies to identify heterogeneities in cell populations. This Feature provides just a few select examples for such developments in bioanalytical NMR, MS, and optical spectroscopy that have enabled the characterization of transcripts, proteins, peptides, metabolites and elements in single cells in important models of basic biological and translational investigations. Among other developments, we would like to point to single-cell metallomics, the studies that determine the trace metals and the metal complexes within a cell that are critically important in biological processes including metabolic signaling (see e.g. ref. 115,116) and energy-dispersive X-ray analysis electron microscopy (EDX-EM) which allows interpretation of macromolecular functionality by analyzing endogenous elements, labels (gold and cadmium-based nanoparticles) as well as stains at nanometer resolution.117 Other recent developments include NanoString gene expression profiling, which provides a highly sensitive alternative to scRNA-seq for quantitative transcriptional profiling for a pre-defined set of genes of interest.118,119 and cryoelectron microscopy (cryoEM) which has the potential to uncover the dynamics of macromolecular machines at the single-cell level120,121. The data resulting from the above mentioned studies have already begun to uncover previously unavailable molecular information on cell-to-cell differences during states of health and disease, which in turn can now be used to design hypothesis-driven studies to test for the functional significance of the observed molecular differences between cells. Moreover, We anticipate that automation and commercialization (e.g., CyTOF122), as well as development of specialized software packages to recognize minuscule signals (e.g., TRACE123), will bring these bioanalytical technologies from select laboratories to many investigators, thus promoting a new era of interdisciplinary research to understand the basic building block of life: the cell.
ACKNOWLEDGEMENTS.
This work was partially funded by the research program NWO-TTW (IMMUNMET with project number 16249; to A.M. & R.H.) which is financed by the Netherlands Organisation for Scientific Research (NWO). R.H. is indebted for financial support by the Dutch Province of Limburg through the LINK program. This work was partially funded by the National Institutes of Health award no. 1R35GM124755 (to P.N.), the National Science Foundation CAREER award no. IOS-1832968 (to P.N.), and the Arnold and Mabel Beckman Foundation Young Investigator Award (to P.N.). The ideas expressed in this paper are solely those of the authors and do not represent the official views of the funding sources.
Biography
Evers TMJ is currently pursuing his Ph.D. studies in Dr. Alireza Mashaghi’s lab at Leiden University. He earned his M.Sc. degrees in biomedical sciences and physics from respectively Maastricht University and Tomsk State University in 2018.
Mazène Hochane obtained a Ph.D. in cell biology from the University of Strasbourg. Subsequently, he carried out postdoctoral research at the University of Nantes, studying the biology of mesenchymal stem cells, in particular, their metabolism. He is currently a postdoc in the lab of Stefan Semrau at Leiden University where he works on models for early mouse development and human kidney development.
Sander Tans obtained a Ph.D. in physics, is currently a group leader at the AMOLF institute, and is affiliated with Delft University. His group focusses on developing new approaches to reveal molecular and cellular dynamics. He has combined microfluidics, time-lapse microscopy, image analysis, and genetics to quantify growth and motility dynamics of individual cells.
Ron Heeren is a distinguished professor (universiteitshoogleraar) of molecular imaging at Maastricht University who specializes in mass spectrometry imaging (MSI) of biological surfaces. Heeren has made substantial contributions to the development of MSI instrumentation and applications to alleviate the limitations of resolution, speed, and sensitivity. Recently, he has engaged in high resolution metabolic imaging at the single cell level for molecular phenotyping.
Stefan Semrau is an assistant professor at Leiden University, where he uses single-cell transcriptomics and proteomics to study early mouse development. He holds a Ph.D. degree in physics from Leiden University and did his postdoctoral research at the Massachusetts Institute of Technology and the Whitehead Institute, on new methods to measure gene expression in single cells and the gene regulatory mechanisms underlying stem cell differentiation.
Peter Nemes is an Associate Professor of Chemistry and Biochemistry at the University of Maryland, College Park. His laboratory develops next-generation microanalytical mass spectrometry technologies capable of detecting proteins, peptides, and metabolites in ultra-high sensitivity in biopsied tissues and single cells to understand molecular mechanisms underlying normal and impaired development using Xenopus laevis, zebrafish, and mouse.
Alireza Mashaghi is a biophysicist and an ophthalmologist and the director of the Laboratory for Medical Systems Biophysics and Bioengineering at Leiden University. His lab develops and uses various acoustic, optical, and mass spectrometric techniques for studying single cells. He co-leads IMMUNMET, a NWO-TTW research program on single-cell analysis of immunometabolism.
References
- (1).Karmaus PWF; Chen X; Lim SA; Herrada AA; Nguyen T-LM; Xu B; Dhungana Y; Rankin S; Chen W; Rosencrance C; et al. Metabolic Heterogeneity Underlies Reciprocal Fates of TH17 Cell Stemness and Plasticity. Nature 2019. 10.1038/s41586-018-0806-7. [DOI] [PMC free article] [PubMed] [Google Scholar]
- (2).Walsh AJ; Sharick JT; Skala MC Imaging Intratumoral Metabolic Heterogeneity. Nat. Biomed. Eng 2019. 10.1038/s41551-019-0398-z. [DOI] [PubMed] [Google Scholar]
- (3).Tonn MK; Thomas P; Barahona M; Oyarzún DA Emergence of Non-Genetic Heterogeneity in Metabolic Reactions. bioRxiv 2019. [Google Scholar]
- (4).Oikawa A; Saito K Metabolite Analyses of Single Cells. Plant Journal. 2012. 10.1111/j.1365-313X.2012.04967.x. [DOI] [PubMed] [Google Scholar]
- (5).Altschuler SJ; Wu LF Cellular Heterogeneity: Do Differences Make a Difference? Cell. 2010. 10.1016/j.cell.2010.04.033. [DOI] [PMC free article] [PubMed] [Google Scholar]
- (6).Giustacchini A; Thongjuea S; Barkas N; Woll PS; Povinelli BJ; Booth CAG; Sopp P; Norfo R; Rodriguez-Meira A; Ashley N; et al. Single-Cell Transcriptomics Uncovers Distinct Molecular Signatures of Stem Cells in Chronic Myeloid Leukemia. Nat. Med 2017. 10.1038/nm.4336. [DOI] [PubMed] [Google Scholar]
- (7).Han G; Spitzer MH; Bendall SC; Fantl WJ; Nolan GP Metal-Isotope-Tagged Monoclonal Antibodies for High-Dimensional Mass Cytometry. Nat. Protoc 2018. 10.1038/s41596-018-0016-7. [DOI] [PMC free article] [PubMed] [Google Scholar]
- (8).Budnik B; Levy E; Harmange G; Slavov N SCoPE-MS: Mass Spectrometry of Single Mammalian Cells Quantifies Proteome Heterogeneity during Cell Differentiation. Genome Biol. 2018. 10.1186/s13059-018-1547-5. [DOI] [PMC free article] [PubMed] [Google Scholar]
- (9).Emara S; Amer S; Ali A; Abouleila Y; Oga A; Masujima T Single-Cell Metabolomics. In Advances in Experimental Medicine and Biology; 2017. 10.1007/978-3-319-47656-8_13. [DOI] [PubMed] [Google Scholar]
- (10).Sandberg R Entering the Era of Single-Cell Transcriptomics in Biology and Medicine. Nature Methods. 2014. 10.1038/nmeth.2764. [DOI] [PubMed] [Google Scholar]
- (11).Ramsköld D; Luo S; Wang YC; Li R; Deng Q; Faridani OR; Daniels GA; Khrebtukova I; Loring JF; Laurent LC; et al. Full-Length MRNA-Seq from Single-Cell Levels of RNA and Individual Circulating Tumor Cells. Nat. Biotechnol 2012. 10.1038/nbt.2282. [DOI] [PMC free article] [PubMed] [Google Scholar]
- (12).Macosko EZ; Basu A; Satija R; Nemesh J; Shekhar K; Goldman M; Tirosh I; Bialas AR; Kamitaki N; Martersteck EM; et al. Highly Parallel Genome-Wide Expression Profiling of Individual Cells Using Nanoliter Droplets. Cell 2015. 10.1016/j.cell.2015.05.002. [DOI] [PMC free article] [PubMed] [Google Scholar]
- (13).Birnbaum KD Power in Numbers: Single-Cell RNA-Seq Strategies to Dissect Complex Tissues. Annu. Rev. Genet 2018. 10.1146/annurev-genet-120417-031247. [DOI] [PMC free article] [PubMed] [Google Scholar]
- (14).Ding J; Adiconis X; Simmons SK; Kowalczyk MS; Hession CC; Marjanovic ND; Hughes TK; Wadsworth MH; Burks T; Nguyen LT;et al. Systematic Comparative Analysis of Single Cell RNA-Sequencing Methods. bioRxiv 2019. 10.1101/632216. [DOI] [Google Scholar]
- (15).Semrau S; Goldmann JE; Soumillon M; Mikkelsen TS; Jaenisch R; Van Oudenaarden A Dynamics of Lineage Commitment Revealed by Single-Cell Transcriptomics of Differentiating Embryonic Stem Cells. Nat. Commun 2017. 10.1038/s41467-017-01076-4. [DOI] [PMC free article] [PubMed] [Google Scholar]
- (16).Id A; Bialecka M; Nieveen M Single-Cell Transcriptomics Reveals Gene Expression Dynamics of Human Fetal Kidney Development, 2019. 10.1371/journal.pbio.3000152. [DOI] [PMC free article] [PubMed] [Google Scholar]
- (17).Patel AP; Tirosh I; Trombetta JJ; Shalek AK; Gillespie SM; Wakimoto H; Cahill DP; Nahed BV; Curry WT; Martuza RL; et al. Single-Cell RNA-Seq Highlights Intratumoral Heterogeneity in Primary Glioblastoma. Science (80-. ). 2014. 10.1126/science.1254257. [DOI] [PMC free article] [PubMed] [Google Scholar]
- (18).Zeng C; Mulas F; Sui Y; Guan T; Miller N; Tan Y; Liu F; Jin W; Carrano AC; Huising MO; et al. Pseudotemporal Ordering of Single Cells Reveals Metabolic Control of Postnatal β Cell Proliferation. Cell Metab. 2017. https://doi.Org/10.1016/j.cmet.2017.04.014. [DOI] [PMC free article] [PubMed] [Google Scholar]
- (19).Ariss MM; Islam ABMMK; Critcher M; Zappia MP; Frolov MV Single Cell RNA-Sequencing Identifies a Metabolic Aspect of Apoptosis in Rbf Mutant. Nat. Commun 2018. 10.1038/s41467-018-07540-z. [DOI] [PMC free article] [PubMed] [Google Scholar]
- (20).Guo J; Grow EJ; Yi C; Mlcochova H; Maher GJ; Lindskog C; Murphy PJ; Wike CL; Carrell DT; Goriely A; et al. Chromatin and Single-Cell RNA-Seq Profiling Reveal Dynamic Signaling and Metabolic Transitions during Human Spermatogonial Stem Cell Development. Cell Stem Cell 2017. https://doi.Org/10.1016/j.stem.2017.09.003. [DOI] [PMC free article] [PubMed] [Google Scholar]
- (21).Dulken BW; Leeman DS; Boutet SC; Hebestreit K; Brunet A Single-Cell Transcriptomic Analysis Defines Heterogeneity and Transcriptional Dynamics in the Adult Neural Stem Cell Lineage. Cell Rep. 2017. https://doi.Org/10.1016/j.celrep.2016.12.060. [DOI] [PMC free article] [PubMed] [Google Scholar]
- (22).Wang P; Chen Y; Yong J; Cui Y; Wang R; Wen L; Qiao J; Tang F Dissecting the Global Dynamic Molecular Profiles of Human Fetal Kidney Development by Single-Cell RNA Sequencing. Cell Rep. 2018. 10.1016/j.celrep.2018.08.056. [DOI] [PubMed] [Google Scholar]
- (23).Lindström NO; Guo J; Kim AD; Tran T; Guo Q; De Sena Brandine G; Ransick A; Parvez RK; Thornton ME; Basking L; et al. Conserved and Divergent Features of Mesenchymal Progenitor Cell Types within the Cortical Nephrogenic Niche of the Human and Mouse Kidney. J. Am. Soc. Nephrol 2018. 10.1681/ASN.2017080890. [DOI] [PMC free article] [PubMed] [Google Scholar]
- (24).Hochane M; van den Berg PR; Fan X; Bérenger-Currias N; Adegeest E; Bialecka M; Nieveen M; Menschaart M; Chuva de Sousa Lopes SM; Semrau S Single-Cell Transcriptomics Reveals Gene Expression Dynamics of Human Fetal Kidney Development. PLoS Biol. 2019. 10.1371/journal.pbio.3000152. [DOI] [PMC free article] [PubMed] [Google Scholar]
- (25).Segerstolpe Å; Palasantza A; Eliasson P; Andersson EM; Andréasson AC; Sun X; Picelli S; Sabirsh A; Clausen M; Bjursell MK; et al. Single-Cell Transcriptome Profiling of Human Pancreatic Islets in Health and Type 2 Diabetes. Cell Metab. 2016. https://doi.Org/10.1016/j.cmet.2016.08.020. [DOI] [PMC free article] [PubMed] [Google Scholar]
- (26).Xiao Z; Dai Z; Locasale JW Metabolic Landscape of the Tumor Microenvironment. bioRxiv 2019. 10.1101/527952. [DOI] [PMC free article] [PubMed] [Google Scholar]
- (27).Damiani C; Maspero D; Filippo M. Di; Colombo R; Pescini D; Graudenzi A; Westerhof HV; Alberghina L; Vanoni ME; Mauri G Integration of Single-Cell RNA-Seq Data into Metabolic Models to Characterize Tumour Cell Populations. bioRxiv 2018. 10.1101/256644. [DOI] [PMC free article] [PubMed] [Google Scholar]
- (28).Orth JD; Thiele I; Palsson BO What Is Flux Balance Analysis? Nature Biotechnology. 2010. 10.1038/nbt.1614. [DOI] [PMC free article] [PubMed] [Google Scholar]
- (29).Ruebel ML; Cotter M; Sims CR; Moutos DM; Badger TM; Cleves MA; Shankar K; Andres A Obesity Modulates Inflammation and Lipidmetabolism Oocyte Gene Expression: A Single-Cell Transcriptome Perspective. J. Clin. Endocrinol. Metab 2017. 10.1210/jc.2016-3524. [DOI] [PMC free article] [PubMed] [Google Scholar]
- (30).Socolovsky M; Weinreb C; Wolock S; Tusi BK; Klein AM Fundamental Limits on Dynamic Inference from Single-Cell Snapshots. Proc. Natl. Acad. Sci 2018. 10.1073/pnas.1714723115. [DOI] [PMC free article] [PubMed] [Google Scholar]
- (31).La Manno G; Soldatov R; Zeisel A; Braun E; Hochgemer H; Petukhov V; Lidschreiber K; Kastriti ME; Lönnerberg P; Furlan A; et al. RNA Velocity of Single Cells. Nature. 2018. 10.1038/s41586-018-0414-6. [DOI] [PMC free article] [PubMed] [Google Scholar]
- (32).Baptista MAP; Dölken L RNA Dynamics Revealed by Metabolic RNA Labeling and Biochemical Nucleoside Conversions. Nat. Methods 2018. 10.1038/nmeth.4608. [DOI] [PubMed] [Google Scholar]
- (33).Hendriks G-J; Jung LA; Larsson AJM; Lidschreiber M; Andersson Forsman O; Lidschreiber K; Cramer P; Sandberg R NASC-Seq Monitors RNA Synthesis in Single Cells. Nat. Commun 2019. 10.1038/s41467-019-11028-9. [DOI] [PMC free article] [PubMed] [Google Scholar]
- (34).Doerr A Single-Cell Proteomics. Nature Methods. 2019. 10.1038/s41592-018-0273-y. [DOI] [PubMed] [Google Scholar]
- (35).Peshkin L; Wühr M; Pearl E; Haas W; Freeman RM; Gerhart JC; Klein AM; Horb M; Gygi SP; Kirschner MW On the Relationship of Protein and MRNA Dynamics in Vertebrate Embryonic Development. Dev. Cell 2015. 10.1016/j.devcel.2015.10.010. [DOI] [PMC free article] [PubMed] [Google Scholar]
- (36).Rubakhin SS; Romanova EV; Nemes P; Sweedler JV Profiling Metabolites and Peptides in Single Cells. Nat. Methods 2011. 10.1038/nmeth.1549. [DOI] [PMC free article] [PubMed] [Google Scholar]
- (37).Lanni EJ; Rubakhin SS; Sweedler JV Mass Spectrometry Imaging and Profiling of Single Cells. Journal of Proteomics. 2012. 10.1016/j.jprot.2012.03.017. [DOI] [PMC free article] [PubMed] [Google Scholar]
- (38).Zhang L; Vertes A Single-Cell Mass Spectrometry Approaches to Explore Cellular Heterogeneity. Angewandte Chemie - International Edition. 2018. 10.1002/anie.201709719. [DOI] [PubMed] [Google Scholar]
- (39).Specht H; Slavov N Transformative Opportunities for Single-Cell Proteomics. Journal of Proteome Research. 2018. 10.1021/acs.jproteome.8b00257. [DOI] [PMC free article] [PubMed] [Google Scholar]
- (40).Zenobi R Single-Cell Metabolomics: Analytical and Biological Perspectives. Science. 2013. 10.1126/science.1243259. [DOI] [PubMed] [Google Scholar]
- (41).Rubakhin SS; Lanni EJ; Sweedler JV Progress toward Single Cell Metabolomics. Current Opinion in Biotechnology. 2013. 10.1016/j.copbio.2012.10.021 [DOI] [PMC free article] [PubMed] [Google Scholar]
- (42).Passarelli MK; Ewing AG Single-Cell Imaging Mass Spectrometry. Current Opinion in Chemical Biology. 2013. 10.1016/j.cbpa.2013.07.017. [DOI] [PMC free article] [PubMed] [Google Scholar]
- (43).Chen X; Love JC; Navin NE; Pachter L; Stubbington MJT; Svensson V; Sweedler JV; Teichmann SA Single-Cell Analysis at the Threshold. Nat. Biotechnol 2016. 10.1038/nbt.3721. [DOI] [PubMed] [Google Scholar]
- (44).Acunha T; Simó C; Ibáñez C; Gallardo A; Cifuentes A Anionic Metabolite Profiling by Capillary Electrophoresis-Mass Spectrometry Using a Noncovalent Polymeric Coating. Orange Juice and Wine as Case Studies. J. Chromatogr. A 2016. 10.1016/j.chroma.2015.08.001 [DOI] [PubMed] [Google Scholar]
- (45).Yang Y; Huang Y; Wu J; Liu N; Deng J; Luan T Single-Cell Analysis by Ambient Mass Spectrometry. TrAC - Trends in Analytical Chemistry. 2017. 10.1016/j.trac.2017.02.009. [DOI] [Google Scholar]
- (46).Comi TJ; Do TD; Rubakhin SS; Sweedler JV Categorizing Cells on the Basis of Their Chemical Profiles: Progress in Single-Cell Mass Spectrometry. Journal of the American Chemical Society. 2017. 10.1021/jacs.6b12822. [DOI] [PMC free article] [PubMed] [Google Scholar]
- (47).Yin L; Zhang Z; Liu Y; Gao Y; Gu J Recent Advances in Single-Cell Analysis by Mass Spectrometry. Analyst. 2019. 10.1039/c8an01190g. [DOI] [PubMed] [Google Scholar]
- (48).Wang YJ; Golson ML; Schug J; Traum D; Liu C; Vivek K; Dorrell C; Naji A; Powers AC; Chang KM; et al. Single-Cell Mass Cytometry Analysis of the Human Endocrine Pancreas. Cell Metab. 2016. 10.1016/j.cmet.2016.09.007. [DOI] [PMC free article] [PubMed] [Google Scholar]
- (49).Lakshmikanth T; Olin A; Chen Y; Mikes J; Fredlund E; Remberger M; Omazic B; Brodin P Mass Cytometry and Topological Data Analysis Reveal Immune Parameters Associated with Complications after Allogeneic Stem Cell Transplantation. Cell Rep. 2017. 10.1016/j.celrep.2017.08.021 [DOI] [PubMed] [Google Scholar]
- (50).Lujan E; Zunder ER; Ng YH; Goronzy IN; Nolan GP; Wernig M Early Reprogramming Regulators Identified by Prospective Isolation and Mass Cytometry. Nature 2015. 10.1038/nature14274. [DOI] [PMC free article] [PubMed] [Google Scholar]
- (51).Yang YSS; Atukorale PU; D Moynihan K; Bekdemir A; Rakhra K; Tang L; Stellacci F; Irvine DJ Erratum: High-Throughput Quantitation of Inorganic Nanoparticle Biodistribution at the Single-Cell Level Using Mass Cytometry. Nature communications. 2017. 10.1038/ncomms15343. [DOI] [PMC free article] [PubMed] [Google Scholar]
- (52).Valaskovic GA; Kelleher NL; McLafferty FW Attomole Protein Characterization by Capillary Electrophoresis-Mass Spectrometry. Science (80-. ). 1996. 10.1126/science.273.5279.1199. [DOI] [PubMed] [Google Scholar]
- (53).Lapainis T; Rubakhin SS; Sweedler JV Capillary Electrophoresis with Electrospray Ionization Mass Spectrometric Detection for Single-Cell Metabolomics. Anal. Chem 2009. 10.1021/ac900936g. [DOI] [PMC free article] [PubMed] [Google Scholar]
- (54).Mellors JS; Jorabchi K; Smith LM; Ramsey JM Integrated Microfluidic Device for Automated Single Cell Analysis Using Electrophoretic Separation and Electrospray Ionization Mass Spectrometry. Anal. Chem 2010. 10.1021/ac902218y. [DOI] [PMC free article] [PubMed] [Google Scholar]
- (55).Nemes P; Rubakhin SS; Aerts JT; Sweedler JV Qualitative and Quantitative Metabolomic Investigation of Single Neurons by Capillary Electrophoresis Electrospray Ionization Mass Spectrometry. Nat. Protoc 2013. 10.1038/nprot.2013.035. [DOI] [PMC free article] [PubMed] [Google Scholar]
- (56).Onjiko RM; Moody SA; Nemes P Single-Cell Mass Spectrometry Reveals Small Molecules That Affect Cell Fates in the 16-Cell Embryo. Proc. Natl. Acad. Sci 2015. 10.1073/pnas.1423682112. [DOI] [PMC free article] [PubMed] [Google Scholar]
- (57).Lombard-Banek C; Moody SA; Nemes P High-Sensitivity Mass Spectrometry for Probing Gene Translation in Single Embryonic Cells in the Early Frog (Xenopus) Embryo. Front. Cell Dev. Biol 2016. 10.3389/fcell.2016.00100. [DOI] [PMC free article] [PubMed] [Google Scholar]
- (58).Lombard-Banek C; Moody SA; Nemes P Single-Cell Mass Spectrometry for Discovery Proteomics: Quantifying Translational Cell Heterogeneity in the 16-Cell Frog (Xenopus) Embryo. Angew. Chemie - Int. Ed 2016. 10.1002/anie.201510411. [DOI] [PMC free article] [PubMed] [Google Scholar]
- (59).Lombard-Banek C; Reddy S; Moody SA; Nemes P Label-Free Quantification of Proteins in Single Embryonic Cells with Neural Fate in the Cleavage-Stage Frog ( Xenopus Laevis ) Embryo Using Capillary Electrophoresis Electrospray Ionization High-Resolution Mass Spectrometry (CE-ESI-HRMS) . Mol. Cell. Proteomics 2016. 10.1074/mcp.m115.057760. [DOI] [PMC free article] [PubMed] [Google Scholar]
- (60).Choi SB; Zamarbide M; Manzini MC; Nemes P Tapered-Tip Capillary Electrophoresis Nano-Electrospray Ionization Mass Spectrometry for Ultrasensitive Proteomics: The Mouse Cortex. J. Am. Soc. Mass Spectrom 2017. 10.1007/s13361-016-1532-8. [DOI] [PubMed] [Google Scholar]
- (61).Choi SB; Lombard-Banek C; Muñoz-LLancao P; Manzini MC; Nemes P Enhanced Peptide Detection Toward Single-Neuron Proteomics by Reversed-Phase Fractionation Capillary Electrophoresis Mass Spectrometry. J. Am. Soc. Mass Spectrom 2018. 10.1007/s13361-017-1838-1. [DOI] [PubMed] [Google Scholar]
- (62).Sun L; Dubiak KM; Peuchen EH; Zhang Z; Zhu G; Huber PW; Dovichi NJ Single Cell Proteomics Using Frog (Xenopus Laevis) Blastomeres Isolated from Early Stage Embryos, Which Form a Geometric Progression in Protein Content. Anal. Chem 2016. 10.1021/acs.analchem.6b01921. [DOI] [PMC free article] [PubMed] [Google Scholar]
- (63).Shi T; Gaffrey MJ; Fillmore TL; Nicora CD; Yi L; Zhang P; Shukla AK; Wiley HS; Rodland KD; Liu T; et al. Facile Carrier-Assisted Targeted Mass Spectrometric Approach for Proteomic Analysis of Low Numbers of Mammalian Cells. Commun. Biol 2018. 10.1038/s42003-018-0107-6. [DOI] [PMC free article] [PubMed] [Google Scholar]
- (64).Zhu Y; Piehowski PD; Zhao R; Chen J; Shen Y; Moore RJ; Shukla AK; Petyuk VA; Campbell-Thompson M; Mathews CE; et al. Nanodroplet Processing Platform for Deep and Quantitative Proteome Profiling of 10-100 Mammalian Cells. Nat. Commun 2018. 10.1038/s41467-018-03367-w. [DOI] [PMC free article] [PubMed] [Google Scholar]
- (65).Lombard-Banek C; Moody SA; Manzini MC; Nemes P Microsampling Capillary Electrophoresis Mass Spectrometry Enables Single-Cell Proteomics in Complex Tissues: Developing Cell Clones in Live Xenopus Laevis and Zebrafish Embryos. Anal. Chem 2019. 10.1021/acs.analchem.9b00345. [DOI] [PMC free article] [PubMed] [Google Scholar]
- (66).Zhu Y; Clair G; Chrisler WB; Shen Y; Zhao R; Shukla AK; Moore RJ; Misra RS; Pryhuber GS; Smith RD; et al. Proteomic Analysis of Single Mammalian Cells Enabled by Microfluidic Nanodroplet Sample Preparation and Ultrasensitive NanoLC-MS. Angew. Chemie - Int. Ed 2018. 10.1002/anie.201802843. [DOI] [PMC free article] [PubMed] [Google Scholar]
- (67).Shao X; Wang X; Guan S; Lin H; Yan G; Gao M; Deng C; Zhang X Integrated Proteome Analysis Device for Fast Single-Cell Protein Profiling. Anal. Chem 2018. 10.1021/acs.analchem.8b03692. [DOI] [PubMed] [Google Scholar]
- (68).Nagana Gowda GA; Djukovic D Overview of Mass Spectrometry-Based Metabolomics: Opportunities and Challenges. Methods Mol. Biol 2014. 10.1007/978-1-4939-1258-2_1. [DOI] [PMC free article] [PubMed] [Google Scholar]
- (69).Lai Y-H; Wang Y-S Matrix-Assisted Laser Desorption/Ionization Mass Spectrometry: Mechanistic Studies and Methods for Improving the Structural Identification of Carbohydrates. Mass Spectrom. 2017. 10.5702/massspectrometry.s0072. [DOI] [PMC free article] [PubMed] [Google Scholar]
- (70).Amantonico A; Urban PL; Fagerer SR; Balabin RM; Zenobi R Single-Cell MALDI-MS as an Analytical Tool for Studying Intrapopulation Metabolic Heterogeneity of Unicellular Organisms. Anal. Chem 2010. 10.1021/ac1015326. [DOI] [PubMed] [Google Scholar]
- (71).Aichler M; Walch A MALDI Imaging Mass Spectrometry: Current Frontiers and Perspectives in Pathology Research and Practice. Lab. Investig 2015. 10.1038/labinvest.2014.156. [DOI] [PubMed] [Google Scholar]
- (72).Hossen MA; Nagata Y; Waki M; Ide Y; Takei S; Fukano H; Romero-Perez GA; Tajima S; Yao I; Ohnishi K; et al. Decreased Level of Phosphatidylcholine (16:0/20:4) in Multiple Myeloma Cells Compared to Plasma Cells: A Single-Cell MALDI-IMS Approach. Anal. Bioanal. Chem 2015. 10.1007/s00216-015-8741-z. [DOI] [PubMed] [Google Scholar]
- (73).Dueñas ME; Essner JJ; Lee YJ 3D MALDI Mass Spectrometry Imaging of a Single Cell: Spatial Mapping of Lipids in the Embryonic Development of Zebrafish. Sci. Rep 2017. 10.1038/s41598-017-14949-x. [DOI] [PMC free article] [PubMed] [Google Scholar]
- (74).Yukihira D; Miura D; Saito K; Takahashi K; Wariishi H MALDI-MS-Based High-Throughput Metabolite Analysis for Intracellular Metabolic Dynamics. Anal. Chem 2010. 10.1021/ac100024w. [DOI] [PubMed] [Google Scholar]
- (75).Ibanez AJ; Fagerer SR; Schmidt AM; Urban PL; Jefimovs K; Geiger P; Dechant R; Heinemann M; Zenobi R Mass Spectrometry-Based Metabolomics of Single Yeast Cells. Proc. Natl. Acad. Sci 2013. 10.1073/pnas.1209302110. [DOI] [PMC free article] [PubMed] [Google Scholar]
- (76).Calvano CD; Monopoli A; Cataldi TRI; Palmisano F MALDI Matrices for Low Molecular Weight Compounds: An Endless Story? Analytical and Bioanalytical Chemistry. 2018. 10.1007/s00216-018-1014-x. [DOI] [PubMed] [Google Scholar]
- (77).Walker BN; Stolee JA; Vertes A Nanophotonic Ionization for Ultratrace and Single-Cell Analysis by Mass Spectrometry. Anal. Chem 2012. 10.1021/ac301238k. [DOI] [PubMed] [Google Scholar]
- (78).Walker BN; Antonakos C; Retterer ST; Vertes A Metabolic Differences in Microbial Cell Populations Revealed by Nanophotonic Ionization. Angew. Chemie - Int. Ed 2013. 10.1002/anie.201207348. [DOI] [PubMed] [Google Scholar]
- (79).Guillaume-Gentil O; Rey T; Kiefer P; Ibáñez AJ; Steinhoff R; Brönnimann R; Dorwling-Carter L; Zambelli T; Zenobi R; Vorholt JA Single-Cell Mass Spectrometry of Metabolites Extracted from Live Cells by Fluidic Force Microscopy. Anal. Chem 2017. 10.1021/acs.analchem.7b00367. [DOI] [PubMed] [Google Scholar]
- (80).Heien ML; Ewing AG; Piehowski PD; Van Bell CT; Kurczy ME; Winograd N Mass Spectrometry Imaging of Mating Tetrahymena Show That Changes in Cell Morphology Regulate Lipid Domain Formation. Proc. Natl. Acad. Sci 2010. 10.1073/pnas.0908101107. [DOI] [PMC free article] [PubMed] [Google Scholar]
- (81).Wedlock LE; Kilburn MR; Liu R; Shaw JA; Berners-Price SJ; Farrell NP NanoSIMS Multi-Element Imaging Reveals Internalisation and Nucleolar Targeting for a Highly-Charged Polynuclear Platinum Compound. Chem. Commun 2013. 10.1039/c3cc42098a. [DOI] [PMC free article] [PubMed] [Google Scholar]
- (82).Senyo SE; Steinhauser ML; Pizzimenti CL; Yang VK; Cai L; Wang M; Wu T. Di; Guerquin-Kern JL; Lechene CP; Lee RT Mammalian Heart Renewal by Pre-Existing Cardiomyocytes. Nature 2013. 10.1038/nature11682. [DOI] [PMC free article] [PubMed] [Google Scholar]
- (83).Fisher GL; Bruinen AL; Ogrinc Potočnik N; Hammond JS; Bryan SR; Larson PE; Heeren RMA A New Method and Mass Spectrometer Design for TOF-SIMS Parallel Imaging MS/MS. Anal. Chem 2016. 10.1021/acs.analchem.6b01022. [DOI] [PubMed] [Google Scholar]
- (84).Lanni EJ; Dunham SJB; Nemes P; Rubakhin SS; Sweedler JV Biomolecular Imaging with a C60-SIMS/MALDI Dual Ion Source Hybrid Mass Spectrometer: Instrumentation, Matrix Enhancement, and Single Cell Analysis. J. Am. Soc. Mass Spectrom 2014. 10.1007/s13361-014-0978-9. [DOI] [PubMed] [Google Scholar]
- (85).González-Domínguez R; Sayago A; Fernández-Recamales Á Direct Infusion Mass Spectrometry for Metabolomic Phenotyping of Diseases. Bioanalysis. 2017. 10.4155/bio-2016-0202. [DOI] [PubMed] [Google Scholar]
- (86).Yamamoto K; Takahashi K; Mizuno H; Anegawa A; Ishizaki K; Fukaki H; Ohnishi M; Yamazaki M; Masujima T; Mimura T Cell-Specific Localization of Alkaloids in Catharanthus Roseus Stem Tissue Measured with Imaging MS and Single-Cell MS. Proc. Natl. Acad. Sci 2016. 10.1073/pnas.1521959113. [DOI] [PMC free article] [PubMed] [Google Scholar]
- (87).Bergman HM; Lanekoff I Profiling and Quantifying Endogenous Molecules in Single Cells Using Nano-DESI MS. Analyst 2017. 10.1039/c7an00885f. [DOI] [PubMed] [Google Scholar]
- (88).Fukano Y; Tsuyama N; Mizuno H; Date S; Takano M; Masujima T Drug Metabolite Heterogeneity in Cultured Single Cells Profiled by Pico-Trapping Direct Mass Spectrometry. Nanomedicine 2012. 10.2217/nnm.12.34. [DOI] [PubMed] [Google Scholar]
- (89).Pan N; Rao W; Kothapalli NR; Liu R; Burgett AWG; Yang Z The Single-Probe: A Miniaturized Multifunctional Device for Single Cell Mass Spectrometry Analysis. Anal. Chem 2014. 10.1021/ac5029038. [DOI] [PubMed] [Google Scholar]
- (90).Huang CM; Zhu Y; Jin DQ; Kelly RT; Fang Q Direct Surface and Droplet Microsampling for Electrospray Ionization Mass Spectrometry Analysis with an Integrated Dual-Probe Microfluidic Chip. Anal. Chem 2017. 10.1021/acs.analchem.7b01679. [DOI] [PubMed] [Google Scholar]
- (91).Elazzouny MA; Evans CR; Burant CF; Kennedy RT Metabolomics Analysis Reveals That AICAR Affect Glycerolipid, Ceramide and Nucleotide Synthesis Pathways in INS-1 Cells. PLoS One 2015. 10.1371/journal.pone.0129029. [DOI] [PMC free article] [PubMed] [Google Scholar]
- (92).Serasanambati M; Broza YY; Marmur A; Haick H Profiling Single Cancer Cells with Volatolomics Approach. iScience 2018. 10.1016/j.isci.2018.12.008. [DOI] [PMC free article] [PubMed] [Google Scholar]
- (93).Ramautar R; Somsen GW; de Jong GJ CE-MS for Metabolomics: Developments and Applications in the Period 2016–2018. Electrophoresis. 2019. 10.1002/elps.201800323. [DOI] [PMC free article] [PubMed] [Google Scholar]
- (94).Onjiko RM; Portero EP; Moody SA; Nemes P Microprobe Capillary Electrophoresis Mass Spectrometry for Single-Cell Metabolomics in Live Frog (Xenopus Laevis) Embryos. J. Vis. Exp 2017. 10.3791/56956. [DOI] [PMC free article] [PubMed] [Google Scholar]
- (95).Lombard-Banek C; Portero EP; Onjiko RM; Nemes P New-Generation Mass Spectrometry Expands the Toolbox of Cell and Developmental Biology. Genesis. 2017. 10.1002/dvg.23012. [DOI] [PMC free article] [PubMed] [Google Scholar]
- (96).Nemes P; Knolhoff AM; Rubakhin SS; Sweedler JV Metabolic Differentiation of Neuronal Phenotypes by Single-Cell Capillary Electrophoresis-Electrospray Ionization-Mass Spectrometry. Anal. Chem 2011. 10.1021/ac2015855. [DOI] [PMC free article] [PubMed] [Google Scholar]
- (97).Aerts JT; Louis KR; Crandall SR; Govindaiah G; Cox CL; Sweedler JV Patch Clamp Electrophysiology and Capillary Electrophoresis-Mass Spectrometry Metabolomics for Single Cell Characterization. Anal. Chem 2014. 10.1021/ac500168d. [DOI] [PMC free article] [PubMed] [Google Scholar]
- (98).Onjiko RM; Plotnick DO; Moody SA; Nemes P Metabolic Comparison of Dorsal: Versus Ventral Cells Directly in the Live 8-Cell Frog Embryo by Microprobe Single-Cell CE-ESI-MS. Anal. Methods 2017. 10.1039/c7ay00834a. [DOI] [PMC free article] [PubMed] [Google Scholar]
- (99).Onjiko RM; Morris SE; Moody SA; Nemes P Single-Cell Mass Spectrometry with Multi-Solvent Extraction Identifies Metabolic Differences between Left and Right Blastomeres in the 8-Cell Frog (: Xenopus) Embryo. Analyst 2016. 10.1039/c6an00200e. [DOI] [PMC free article] [PubMed] [Google Scholar]
- (100).Portero EP; Nemes P Dual Cationic-Anionic Profiling of Metabolites in a Single Identified Cell in a Live: Xenopus Laevis Embryo by Microprobe CE-ESI-MS. Analyst 2019. 10.1039/c8an01999a. [DOI] [PMC free article] [PubMed] [Google Scholar]
- (101).Nemes P; Knolhoff AM; Rubakhin SS; Sweedler JV Single-Cell Metabolomics: Changes in the Metabolome of Freshly Isolated and Cultured Neurons. ACS Chem. Neurosci 2012. 10.1021/cn300100u. [DOI] [PMC free article] [PubMed] [Google Scholar]
- (102).Onjiko RM; Portero EP; Moody SA; Nemes P In Situ Microprobe Single-Cell Capillary Electrophoresis Mass Spectrometry: Metabolic Reorganization in Single Differentiating Cells in the Live Vertebrate (Xenopus Laevis) Embryo. Anal. Chem 2017. 10.1021/acs.analchem.7b00880. [DOI] [PMC free article] [PubMed] [Google Scholar]
- (103).Kiviet DJ; Nghe P; Walker N; Boulineau S; Sunderlikova V; Tans SJ Stochasticity of Metabolism and Growth at the Single-Cell Level. Nature 2014. 10.1038/nature13582. [DOI] [PubMed] [Google Scholar]
- (104).Walker N; Nghe P; Tans SJ Generation and Filtering of Gene Expression Noise by the Bacterial Cell Cycle. BMC Biol. 2016, 14 (1). 10.1186/s12915-016-0231-z. [DOI] [PMC free article] [PubMed] [Google Scholar]
- (105).Adiciptaningrum A; Osella M; Moolman MC; Cosentino Lagomarsino M; Tans SJ Stochasticity and Homeostasis in the E. Coli Replication and Division Cycle. Sci. Rep 2015. 10.1038/srep18261. [DOI] [PMC free article] [PubMed] [Google Scholar]
- (106).Thomas P; Terradot G; Danos V; Weiße AY Sources, Propagation and Consequences of Stochasticity in Cellular Growth. Nat. Commun 2018. 10.1038/s41467-018-06912-9. [DOI] [PMC free article] [PubMed] [Google Scholar]
- (107).Zhang Z; Milias-Argeitis A; Heinemann M Dynamic Single-Cell NAD(P)H Measurement Reveals Oscillatory Metabolism throughout the E. Coli Cell Division Cycle. Sci. Rep 2018. 10.1038/s41598-018-20550-7. [DOI] [PMC free article] [PubMed] [Google Scholar]
- (108).Arai S; Kriszt R; Harada K; Looi LS; Matsuda S; Wongso D; Suo S; Ishiura S; Tseng YH; Raghunath M; et al. RGB-Color Intensiometric Indicators to Visualize Spatiotemporal Dynamics of ATP in Single Cells. Angew. Chemie -Int. Ed 2018. 10.1002/anie.201804304. [DOI] [PMC free article] [PubMed] [Google Scholar]
- (109).Depaoli MR; Karsten F; Madreiter-Sokolowski CT; Klee C; Gottschalk B; Bischof H; Eroglu E; Waldeck-Weiermair M; Simmen T; Graier WF; et al. Real-Time Imaging of Mitochondrial ATP Dynamics Reveals the Metabolic Setting of Single Cells. Cell Rep. 2018. https://doi.Org/10.1016/j.celrep.2018.09.027. [DOI] [PMC free article] [PubMed] [Google Scholar]
- (110).Tantama M; Martínez-François JR; Mongeon R; Yellen G Imaging Energy Status in Live Cells with a Fluorescent Biosensor of the Intracellular ATP-to-ADP Ratio. Nat. Commun 2013. 10.1038/ncomms3550. [DOI] [PMC free article] [PubMed] [Google Scholar]
- (111).Şimşek E; Kim M The Emergence of Metabolic Heterogeneity and Diverse Growth Responses in Isogenic Bacterial Cells. ISME J. 2018. 10.1038/s41396-017-0036-2. [DOI] [PMC free article] [PubMed] [Google Scholar]
- (112).Jing W; Camellato B; Roney IJ; Kaern M; Godin M Measuring Single-Cell Phenotypic Growth Heterogeneity Using a Microfluidic Cell Volume Sensor. Sci. Rep 2018. 10.1038/s41598-018-36000-3. [DOI] [PMC free article] [PubMed] [Google Scholar]
- (113).Yue S; Cheng JX Deciphering Single Cell Metabolism by Coherent Raman Scattering Microscopy. Current Opinion in Chemical Biology. 2016. 10.1016/j.cbpa.2016.05.016. [DOI] [PMC free article] [PubMed] [Google Scholar]
- (114).Kang B; Afifi MM; Austin LA; El-Sayed MA Exploiting the Nanoparticle Plasmon Effect: Observing Drug Delivery Dynamics in Single Cells via Raman/Fluorescence Imaging Spectroscopy. ACS Nano 2013. 10.1021/nn403351z. [DOI] [PubMed] [Google Scholar]
- (115).Jiménez-Lamana J; Szpunar J; Łobinski R New Frontiers of Metallomics: Elemental and Species-Specific Analysis and Imaging of Single Cells. In Advances in Experimental Medicine and Biology; 2018. 10.1007/978-3-319-90143-5_10. [DOI] [PubMed] [Google Scholar]
- (116).Guo Y; Baumgart S; Stärk HJ; Harms H; Müller S Mass Cytometry for Detection of Silver at the Bacterial Single Cell Level. Front. Microbiol 2017. 10.3389/fmicb.2017.01326. [DOI] [PMC free article] [PubMed] [Google Scholar]
- (117).Scotuzzi M; Kuipers J; Wensveen DI; De Boer P; Hagen KCW; Hoogenboom JP; Giepmans BNG Multi-Color Electron Microscopy by Element-Guided Identification of Cells, Organelles and Molecules. Sci. Rep 2017. 10.1038/srep45970. [DOI] [PMC free article] [PubMed] [Google Scholar]
- (118).Speranza E; Altamura LA; Kulcsar K; Bixler SL; Rossi CA; Schoepp RJ; Nagle E; Aguilar W; Douglas CE; Delp KL; et al. Comparison of Transcriptomic Platforms for Analysis of Whole Blood from Ebola-Infected Cynomolgus Macaques. Sci. Rep 2017. 10.1038/s41598-017-15145-7. [DOI] [PMC free article] [PubMed] [Google Scholar]
- (119).Subkhankulova T; Kelsh RN Fluorescence-Activated Cell Sorting and NanoString Profiling of Single Neural Crest Cells and Pigment Cells. Methods Mol. Biol 2019. 10.1007/978-1-4939-9412-0_14. [DOI] [PubMed] [Google Scholar]
- (120).Lyumkis D Challenges and Opportunities in Cryo-EM Single-Particle Analysis. J. Biol. Chem 2019. 10.1074/jbc.REV118.005602. [DOI] [PMC free article] [PubMed] [Google Scholar]
- (121).Yi X; Verbeke EJ; Chang Y; Dickinson DJ; Taylor DW Electron Microscopy Snapshots of Single Particles from Single Cells. J. Biol. Chem 2019. 10.1074/jbc.RA118.006686. [DOI] [PMC free article] [PubMed] [Google Scholar]
- (122).Bodenmiller B; Zunder ER; Finck R; Chen TJ; Savig ES; Bruggner RV; Simonds EF; Bendall SC; Sachs K; Krutzik PO; et al. Multiplexed Mass Cytometry Profiling of Cellular States Perturbed by Small-Molecule Regulators. Nat. Biotechnol 2012. 10.1038/nbt.2317. [DOI] [PMC free article] [PubMed] [Google Scholar]
- (123).Liu Z; Portero EP; Jian Y; Zhao Y; Onjiko RM; Zeng C; Nemes P Trace, Machine Learning of Signal Images for Trace-Sensitive Mass Spectrometry: A Case Study from Single-Cell Metabolomics. Anal. Chem 2019. 10.1021/acs.analchem.8b05985. [DOI] [PMC free article] [PubMed] [Google Scholar]
- (124).Vaysse PM; Heeren RMA; Porta T; Balluff B Mass Spectrometry Imaging for Clinical Research-Latest Developments, Applications, and Current Limitations. Analyst. 2017. 10.1039/c7an00565b. [DOI] [PubMed] [Google Scholar]
- (125).Wehrens M; Büke F; Nghe P; Tans SJ Stochasticity in Cellular Metabolism and Growth: Approaches and Consequences. Current Opinion in Systems Biology. 2018. https://doi.Org/10.1016/j.coisb.2018.02.006. [Google Scholar]