

1. STRUCTURED ABSTRACT
INTRODUCTION:
We examined the influence of enrollment factors demonstrated to differ by race on incident mild cognitive impairment (MCI) and dementia using Alzheimer’s Disease Center (ADC) data.
METHODS:
Differences in rates of incident impairment between non-Latino Whites and Blacks (n=12,242) were examined with age-at-progression survival models. Models included race, sex, education, source of recruitment, health factors, and family history of dementia.
RESULTS:
No significant race differences in progression were observed in cognitively unimpaired participants. In those with MCI at baseline, Whites evidenced greater risk for progression than Blacks. Enrollment factors e.g., referral source, were significantly related to progression.
DISCUSSION:
The finding that Blacks demonstrated lower rate of progression than Whites is contrary to extant literature. Nested-regression analyses suggested that selection-related factors, differing by race, may account for these findings and influence our ability to accurately estimate risk for progression. It is potentially problematic to make racial comparisons using ADC datasets.
Keywords: Alzheimer’s Disease Dementia, Mild Cognitive Impairment, Racial Disparities, Recruitment, Outreach Strategies, Selection Bias, Alzheimer’s Disease Centers
2. BACKGROUND
Recruitment for Alzheimer’s disease and related dementias (ADRD) research is challenging, especially for communities in which research participation connotes mistreatment and abuse from scientists[1, 2]. Research teams recruiting for ADRD research are encouraged to devise creative recruitment strategies to enlist adequate numbers of research volunteers, particularly when recruiting individuals from under-represented groups (URG) [3].
Successful programs employ various enrollment approaches including clinic and community-based approaches[4], both of which represent departures from random sampling and introduce potential threats to external and internal validity. Moreover, non-random sampling methods introduce systematic-biases associated with both independent variables (e.g., race) and outcomes (e.g., incident cognitive impairment)[5].
While selection bias and the resultant challenges with generalizability are often acknowledged as limitations in cognitive aging studies, the extent to which enrollment strategies contribute to selection bias and influence ADRD datasets is relatively unexamined. A recent exception highlighted the influence of sampling strategy on ADRD-related risk estimation. Chen et al[6]. found that rates of progression from cognitive health to mild cognitive impairment (MCI) differed based on recruitment setting with individuals recruited from clinic demonstrating an annual rate of conversion to MCI six times that of individuals recruited from the community.
We explored the effects of enrollment factors on incident MCI and dementia in a sample of Blacks and Whites from a large ADRD database. We hypothesized that referral source and a factor likely to influence enrollment, known family history of ADRD, would associate with primary clinical outcomes including rates of incident MCI and dementia and with racial identity in a sample of non-Latino Blacks and Whites. To investigate this hypothesis, we first depicted rates of diagnostic progression in Blacks and Whites, with separate survival analyses based on baseline cognitive status (cognitively unimpaired or MCI). We then used nested models to assess stability of race-associated risk for diagnostic progression associated with enrollment factors, e.g., referral source and family history of dementia.
3. METHODS
3.1. Participants
Data were collected between January 2005 and February 2017 at US-based Alzheimer’s Disease Centers (ADC) and complied by the National Alzheimer’s Coordinating Center (NACC). All participants provided informed consent. The NACC dataset (dated 5/10/17) used here included 33,444 subjects from 37 Centers with visits occurring on or before 2/24/2017.
Exclusion criteria included 1) Down syndrome, known autosomal dominant mutations for Alzheimer’s disease (AD) and frontotemporal lobar dementias (FTLD), 2) self-identified race other than solely Black or White, or Hispanic/Latino ethnicity, 3) baseline age <60 years. Subsequently, we excluded participants 4) with baseline cognitive diagnosis other than cognitively unimpaired or MCI, 5) with baseline MCI due to FTLD, given the relatively young age of onset for this dementia, and 6) those without follow-up. The resulting analytical sample included 8,182 subjects, cognitively unimpaired at baseline (15.7% Black), and 4,060 subjects with MCI at baseline (15.2% Black). Figure 1 depicts analytic sample derivation.
Figure 1.
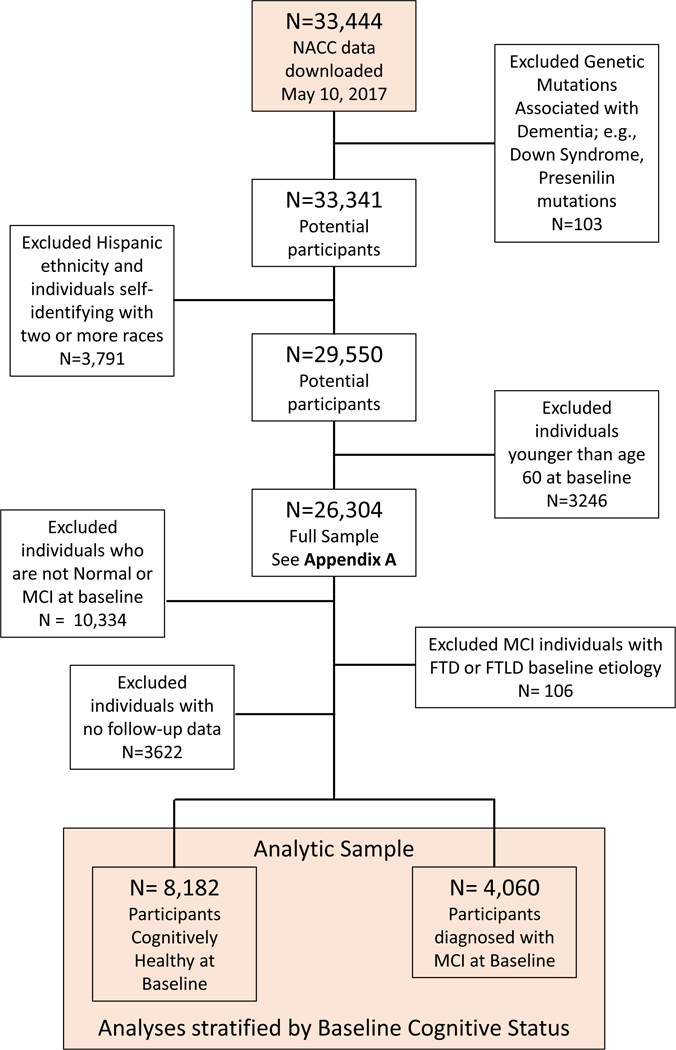
CONSORT Diagram
3.2. Primary Outcomes
We examined the influence of (1) race, cardiovascular and MCI etiology and (2) enrollment factors on age-to-incident progression. Incident progression in cognitive impairment was defined as the first visit with a diagnosis of MCI or dementia, if the participant was cognitively unimpaired at baseline. For those with MCI at baseline, incident progression was denoted at first diagnosis of dementia. ADC clinicians determined cognitive status based on clinical examination data obtained at a research visit. Age of progression represents age when progression was ascertained.
3.3. Additional Variables
We investigated the relationship between enrollment factors and incident cognitive impairment using a nested modeling strategy. After examining the contributions of underlying differences in risk including cardiovascular conditions and etiology of impairment, enrollment factors were added to models.
3.3.1. Examination of cardiovascular factors and etiology of cognitive impairment:
Model 1 incorporated a number of cardiovascular conditions including diabetes, hypertension, history of myocardial infarction (MI), atrial fibrillation (AFib), and congestive heart failure (CHF), ascertained by clinical interview and physical examination. All conditions were categorized as (absent, recent/active, remote/inactive, or unknown) based on clinical interview. In the NACC database, recent/active events were conditions occurring in the year prior to study visit or requiring continued management. Conditions no longer needing management or events occurring >1 year ago were designated as remote/inactive. To simplify models, three cardiovascular events or conditions, MI, AFib, and CHF were combined into one covariate, categorized as: “recent/active” if any of the three conditions were “recent/active”, “absent” if all three were “absent” or “remote/inactive”, and “unknown” for combinations of “unknown”, “absent”, and “remote/inactive”.
For participants diagnosed with baseline MCI, we included suspected etiology of MCI at baseline in our regression models. Etiologic determinations were made by ADC clinician(s) using research visit data. Primary etiology was determined at the time of MCI diagnosis and categorized as either AD, vascular disease (VaD), Lewy Body dementia (DLB), other cause (Other), and unassessed/unknown (Unknown).
3.3.2. Examination of enrollment processes:
Factors judged to influence the participant’s decision to enroll in an ADC’s Clinical Core included (1) referral source and (2) family history of dementia. Data from individuals referred by a research study clinician or investigator, a nurse, doctor or other health-care provider were denoted as referral by a “Health Professional”. The health professional referral source here is presumed to reflect recruitment from a clinical or clinical research setting. In the case of ADCs, this is most likely neurology, psychiatry or geriatrics clinics. Family history, captured as one or more first degree relative with dementia, no first degree relative, or unknown, is included as an enrollment factor. Although family history is most often interpreted as a biological risk factor, we propose that self-reported family history represents knowledge of a family history – information not equally accessible across racial groups. The awareness of family history encompasses access to diagnostic services and awareness of dementia symptoms as a diagnosable condition as opposed to a phenomenon of aging. Dementia is frequently undiagnosed[7–9], especially for non-White populations[10]. Moreover, referral patterns differ between non-Hispanic Blacks and Whites, such that White patients diagnosed with dementia are more frequently evaluated in Neurology clinics than are Black patients[11].
This interpretation of known family history considers motivations for participation in intensive research protocols as a potential source of selection bias. As such, known family history may not only be a strong motivating factor for participation in intensive cognitive aging protocols[12], but in Black populations may correlate with protective factors such as socioeconomic advantage and health literacy.
3.4. Analyses
Characteristics of Black and White participants included in the analytic sample were compared using Mann-Whitney U tests and Chi-squared tests. Adjusted age-to-progression within Black and White subjects was compared using Cox proportional hazard models. All survival models used a variable entry setup, wherein baseline age was entry age paired with participants’ progression or censoring age. Participants diagnosed with incident MCI or dementia did not re-enter the at-risk pool if the diagnosis was later reversed. Differences in unadjusted age-to-progression between Blacks and Whites were compared visually using Kaplan-Meier curves.
Separate nested regression models were fitted for two subgroups: (1) participants cognitively unimpaired at baseline, and (2) participants with baseline MCI. For each subgroup, the base model included covariates of sex, education category (<high school, high school, >high school, bachelors, masters, doctorate, or unknown), race (black or white), diabetes, hypertension and cardiac events/conditions, and baseline etiology for MCI subgroup (Model 1). Subsequent models added covariates – referral source and family history of dementia (Model 2) allowing us to assess robustness of the hazard ratios for racial groups. Assumption checks yielded no concerns for non-proportionality, outliers, and goodness-of-fit. All analyses and graphics were performed in R version 3.4.0[13]. Survival analyses were performed using ‘survival’ package[14].
4. RESULTS
4.1. Group differences at baseline
Table 1 depicts the analytic sample characteristics. Racial comparisons revealed numerous baseline differences. Compared to Whites, Blacks were less likely to die during follow-up (e.g., cognitively unimpaired subsample: 9.3% vs 14.1%, p<0.001). Blacks had more cardiovascular and metabolic risk factors than Whites. Regarding enrollment factors, Blacks were less likely to have been referred by health professionals (e.g., baseline MCI subgroup: 25.0% vs 43.4%, p<0.001), and less likely than Whites to report 1st degree family history of cognitive impairment (45.9% vs 57.4%, p<0.001).
Table 1.
Racial comparisons of analytic (regression) sample by baseline cognitive status. Regression sample included only non-Hispanic Whites and Blacks. Data were collected between June 2005 and February 2017.
| Cognitively Normal at Baseline | MCI at Baseline | ||||||
|---|---|---|---|---|---|---|---|
| White | Black | p | White | Black | p | ||
| N | 6894 | 1288 | 3444 | 616 | |||
| Converted, N(%) | 1559 (22.6) | 267 (20.7) | 0.146 | 1598 (46.4) | 189 (30.7) | <0.001 | |
| Entry age in yrs, mean(SD) | 74.33 (8.16) | 72.66 (7.08) | <0.001 | 75.27 (7.75) | 73.58 (7.59) | <0.001 | |
| Female Sex, N(%) | 4272 (62.0) | 1014 (78.7) | <0.001 | 1526 (44.3) | 423 (68.7) | <0.001 | |
| Died, N(%) | 971 (14.1) | 120 (9.3) | <0.001 | 775(22.5) | 67 (10.9) | <0.001 | |
| Age at censoring /conversion, mean(SD) | 78.73 (8.37) | 76.97 (7.68) | <0.001 | 78.30 (7.92) | 76.85 (7.74) | <0.001 | |
| Education Category | <0.001 | <0.001 | |||||
| Under High School, N(%) | 116 (1.7) | 124 (9.6) | 114 (3.3) | 92 (14.9) | |||
| High School, N(%) | 896 (13.0) | 282 (21.9) | 565 (16.4) | 172 (27.9) | |||
| Over High School, N(%) | 1229 (17.8) | 341 (26.5) | 599 (17.4) | 145 (23.5) | |||
| Bachelor degree, N(%) | 1738 (25.2) | 186 (14.4) | 888 (25.8) | 82 (13.3) | |||
| Masters degree, N(%) | 2064 (29.9) | 276 (21.4) | 835 (24.2) | 95 (15.4) | |||
| Doctorate degree, N(%) | 822 (11.9) | 76 (5.9) | 437 (12.7) | 30 (4.9) | |||
| Unknown, N(%) | 29 (0.4) | 3 (0.2) | 6 (0.2) | 0 (0.0) | |||
| Diabetes | <0.001 | <0.001 | |||||
| Absent, N(%) | 6307 (91.5) | 956 (74.2) | 3066 (89.0) | 420 (68.2) | |||
| Recent/active, N(%) | 548 (7.9) | 316 (24.5) | 346 (10.0) | 184 (29.9) | |||
| Remote/inactive, N(%) | 27 (0.4) | 6 (0.5) | 23 (0.7) | 8 (1.3) | |||
| unknown, (N%) | 12 (0.2) | 10 (0.8) | 9 (0.3) | 4 (0.6) | |||
| Hypertension | <0.001 | <0.001 | |||||
| Absent, N(%) | 3623 (52.6) | 316 (24.5) | 1672 (48.5) | 132 (21.4) | |||
| Recent/active, N(%) | 3080 (44.7) | 941 (73.1) | 1658 (48.1) | 460 (74.7) | |||
| Remote/inactive, N(%) | 171 (2.5) | 29 (2.3) | 104 (3.0) | 22 (3.6) | |||
| Unknown, (N%) | 20 (0.3) | 2 (0.2) | 10 (0.3) | 2 (0.3) | |||
| Cardiac event/Condition* | 0.009 | 0.022 | |||||
| Absent, N(%) | 5997 (87.0) | 1143 (88.7) | 2887 (83.8) | 541 (87.8) | |||
| Recent/active, N(%) | 514 (7.5) | 66 (5.1) | 295 (8.6) | 34 (5.5) | |||
| Unknown, (N%) | 383 (5.6) | 79 (6.1) | 262 (7.6) | 41 (6.7) | |||
| Primary Etiology of MCI at Baseline | NA | NA | <0.001 | ||||
| Alzheimer’s disease, N(%) | NA | NA | 1436 (41.7) | 214 (34.7) | |||
| Vascular disease, N(%) | NA | NA | 137 (4.0) | 58 (9.4) | |||
| Lewy Body dementia, N(%) | NA | NA | 176 (5.1) | 3 (0.5) | |||
| Mixed or Other, N(%) | NA | NA | 1695 (49.2) | 341 (55.4) | |||
| Referral Source | <0.001 | <0.001 | |||||
| Self/relative/friend, N(%) | 2786 (40.4) | 550 (42.7) | 876 (25.4) | 146 (23.7) | |||
| Health professional, N(%) | 1004 (14.6) | 105 ( 8.2) | 1494 (43.4) | 154 (25.0) | |||
| Other, N(%)† | 2846 (41.3) | 593 ( 46.0) | 961 (27.9) | 288 (46.8) | |||
| Unknown, N(%) | 258 ( 3.7) | 40 ( 3.1) | 113 (3.3) | 28 (4.5) | |||
| Family History of dementia | <0.001 | <0.001 | |||||
| No 1st degree relative, N(%) | 2548 (37.0) | 544 (42.2) | 1168 (33.9) | 262 (42.5) | |||
| ≥ One 1st degree relative, N(%) | 3773 (54.7) | 569 (44.2) | 1976 (57.4) | 283 (45.9) | |||
| unknown, (N%) | 573 (8.3) | 175 (13.6) | 300 (8.7) | 71 (11.5) | |||
| Years of follow-up, mean(SD) | 4.92 (2.93) | 4.77 (2.87) | 0.158 | 3.88 (2.49) | 3.79 (2.65) | 0.08 | |
The designation of “recent/active” was given if the condition occurred within the year prior to the study visit or required active management in the case of chronic conditions and the report was consistent with information obtained during the subject and study partner interview. The label “remote/inactive” was indicated if the condition existed or occurred in the past or more than one year ago, but had resolved or no longer needed treatment or management. As implied, if a condition was reported by either the participant or the study partner or indicated from other records, it was designated as “absent”. A label of “unknown” selected if there was insufficient data to determine the status of the condition.
Cardiac event/condition includes history of myocardial infarction (MI), atrial fibrillation (AFib), and congestive heart failure (CHF). “Recent/active” selected if any of the three conditions were “recent/active”; categorization “absent” if all three were “absent” or “remote/inactive”, and “unknown” for combinations of “unknown”, “absent”, and “remote/inactive”.
The category of “Other” for Referral Source represents a mixture of categories, including Alzheimer’s Disease Center (ADC) solicitation, non-ADC study, population sample, or non-ADC media appeal.
For participants with MCI at baseline, there were racial differences in primary etiology. Whites were more often diagnosed with MCI due to AD pathology (41.7% vs 34.7%) and DLB (5.1% vs 0.5%), and less likely than Blacks to have Vascular disease denoted as primary MCI etiology (4.0% vs. 9.4%). In both subgroups (cognitively unimpaired and MCI), total follow-up time was similar between Blacks and Whites (cognitively unimpaired: 4.77 vs 4.92 years, p=0.158; MCI: 3.79 vs 3.88 years, p=0.080). (Table 1.)
Appendix A contains outcome and covariate comparisons for the full sample before applying final exclusion criteria, i.e., baseline dementia status, MCI etiology of FTLD, no follow-up. Appendix B provides comparisons of individuals in the final analytic sample to those satisfying all inclusion criteria, with the exception of having follow-up data.
4.2. Unadjusted racial differences in rate of incident cognitive impairment
Kaplan-Meier survival curves portray progression over time by race (Figure 2). In the cognitively unimpaired group (Table 1) progression proportions between Blacks and Whites did not differ (20.7% and 22.6%, p=0.146). In contrast, differences in progression by race were noted in the MCI subgroup, with more Whites progressing than Blacks (46.4% vs 30.7%, p<0.001).
Figure 2.

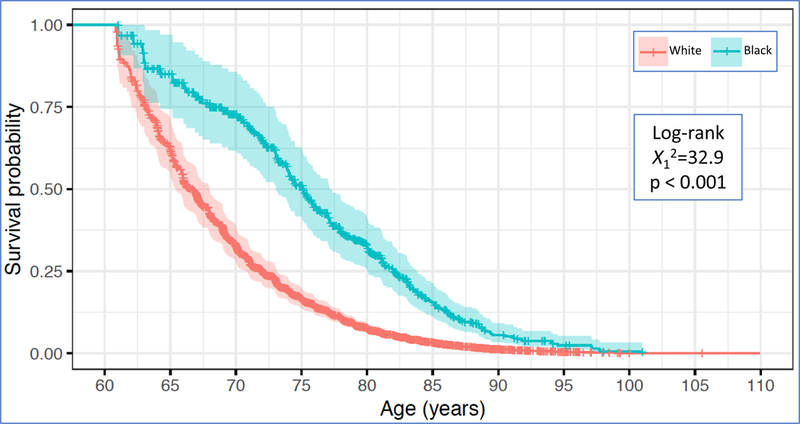
Survival analyses for incident cognitive impairment. Kaplan-Meier curves portrayed for baseline cognitive status subgroups.
Figure 2a. Kaplan-Meier Curves for non-Hispanic Whites and Blacks cognitively unimpaired at Baseline
Figure 2b. Kaplan-Meier Curves for non-Hispanic Whites and Blacks diagnosed with MCI at Baseline
4.3. Model 1: Cardiovascular factors and baseline MCI etiology
4.3.1. Demographic factors:
In participants who were cognitively unimpaired at baseline (Table 2, Model 1), women demonstrated lower risk than men for incident cognitive impairment as did individuals with advanced education. For those with MCI at baseline, education conferred a reduced risk for progression (Table 3, Model 1). Black race had no effect in those who were cognitive healthy at baseline and was associated with a reduced hazard for progression for those with MCI at baseline (HR=0.71; p<0.0001).
Table 2.
Regression models predicting incident MCI or Dementia in participants who were cognitively unimpaired at Baseline. Model 1 included demographic and cardiovascular risk factors; Model 2 adds recruitment factors.
| Model 1 | Model 2 | ||||||
|---|---|---|---|---|---|---|---|
| Coefficient | HR | HR 95% CI | p value | HR | HR 95% CI | p value | |
| African American (reference: White) | 0.99 | 0.86 — 1.14 | 0.8963 | 1.05 | 0.91 — 1.21 | 0.4864 | |
| Female (reference: Male) | 0.79 | 0.72 — 0.87 | <0.0001 | 0.79 | 0.72 — 0.87 | <0.0001 | |
| Education: (reference: HS education) | |||||||
| under HS | 1.21 | 0.94 — 1.56 | 0.1335 | 1.25 | 0.97 — 1.60 | 0.0870 | |
| over HS | 0.93 | 0.80 — 1.08 | 0.3471 | 0.93 | 0.80 — 1.09 | 0.3843 | |
| Bachelor | 0.92 | 0.79 — 1.06 | 0.2461 | 0.91 | 0.79 — 1.06 | 0.2265 | |
| Masters | 0.83 | 0.72 — 0.96 | 0.0146 | 0.83 | 0.72 — 0.97 | 0.0166 | |
| Doctorate | 0.80 | 0.66 — 0.97 | 0.0221 | 0.79 | 0.65 — 0.96 | 0.0178 | |
| unknown | 1.37 | 0.71 — 2.67 | 0.3515 | 1.38 | 0.71 — 2.69 | 0.3401 | |
| Diabetes: (reference: non-diabetic) | |||||||
| recent/active | 1.20 | 1.03 — 1.40 | 0.0172 | 1.21 | 1.04 — 1.41 | 0.0137 | |
| remote/inactive | 1.27 | 0.66 — 2.45 | 0.4779 | 1.21 | 0.62 — 2.33 | 0.5798 | |
| unknown | 1.65 | 0.73 — 3.73 | 0.2278 | 1.68 | 0.74 — 3.81 | 0.2122 | |
| Hypertension: (reference: non hypertensive) | |||||||
| recent/active | 0.99 | 0.90 — 1.09 | 0.8102 | 0.99 | 0.90 — 1.09 | 0.8364 | |
| remote/inactive | 1.28 | 0.97 — 1.68 | 0.0852 | 1.29 | 0.98 — 1.70 | 0.0717 | |
| unknown | 0.96 | 0.39 — 2.36 | 0.9348 | 0.91 | 0.37 — 2.24 | 0.8394 | |
| Cardiac Event/Condition:* (reference: no event/condition) | |||||||
| recent/active | 1.15 | 0.98 — 1.34 | 0.0971 | 1.15 | 0.98 — 1.35 | 0.0940 | |
| unknown | 1.25 | 1.04 — 1.49 | 0.0146 | 1.22 | 1.02 — 1.46 | 0.0277 | |
| Referral: (reference: referred by self/relative/friend) | |||||||
| health professional | 1.39 | 1.21 — 1.60 | <0.0001 | ||||
| other† | 1.20 | 1.08 — 1.33 | 0.0005 | ||||
| unknown | 1.29 | 1.03 — 1.62 | 0.0282 | ||||
| Family History of Dementia: (reference: no family history) | |||||||
| ≥1 1st degree relative | 1.22 | 1.11 — 1.35 | 0.0001 | ||||
| unknown | 0.87 | 0.73 — 1.04 | 0.1239 | ||||
Reference for Baseline cognitively unimpaired: White, Male, High School education, non-diabetic, non-hypertensive, no history of cardiac event/condition, referred by self/relative/friend, and no family history of dementia.
The designation of “recent/active” was given if the condition occurred within the year prior to the study visit or required active management in the case of chronic conditions and the report was consistent with information obtained during the subject and study partner interview. The label “remote/inactive” was indicated if the condition existed or occurred in the past or more than one year ago, but had resolved or no longer needed treatment or management. As implied, if a condition was reported by either the participant or the study partner or indicated from other records, it was designated as “absent”. A label of “unknown” selected if there was insufficient data to determine the status of the condition.
Cardiac event/condition includes history of myocardial infarction (MI), atrial fibrillation (AFib), and congestive heart failure (CHF). “Recent/active” selected if any of the three conditions were “recent/active”; categorization “absent” if all three were “absent” or “remote/inactive”, and “unknown” for combinations of “unknown”, “absent”, and “remote/inactive”.
The category of “Other” for Referral Source represents a mixture of categories, including Alzheimer’s Disease Center (ADC) solicitation, non-ADC study, population sample, or non-ADC media appeal.
NOTE: As is evident in the table, variables of interest included a number of “unknown” responses. Sensitivity analyses were performed, wherein an “unknown” response for any of the covariates in the table resulted in the subject being excluded from analyses. Although sample size was markedly reduced, race results were practically unchanged
Table 3.
Regression models predicting incident Dementia in participants who were diagnosed with MCI at Baseline. Model 1 included demographic, cardiovascular risk factors and baseline MCI etiology; Model 2 adds recruitment factors.
| Model 1 | Model 2 | ||||||
|---|---|---|---|---|---|---|---|
| Coefficient | HR | HR 95% CI | p value | HR | HR 95% CI | p value | |
| African American (reference: White) | 0.66 | 0.56 — 0.77 | <0.0001 | 0.71 | 0.61 — 0.84 | <0.0001 | |
| Female (reference: Male) | 1.01 | 0.91 — 1.11 | 0.8642 | 1.03 | 0.94 — 1.14 | 0.5172 | |
| Education: (reference: HS education) | |||||||
| under HS | 1.02 | 0.81 — 1.28 | 0.8859 | 0.99 | 0.79 — 1.25 | 0.9542 | |
| over HS | 0.79 | 0.68 — 0.93 | 0.0035 | 0.80 | 0.68 — 0.93 | 0.0049 | |
| Bachelor | 0.93 | 0.81 — 1.08 | 0.3359 | 0.94 | 0.82 — 1.09 | 0.4149 | |
| Masters | 0.85 | 0.73 — 0.98 | 0.0298 | 0.85 | 0.74 — 0.99 | 0.0343 | |
| Doctorate | 0.81 | 0.68 — 0.97 | 0.0236 | 0.79 | 0.66 — 0.95 | 0.0112 | |
| unknown | 2.14 | 0.79 — 5.77 | 0.1332 | 2.13 | 0.79 — 5.77 | 0.1350 | |
| Diabetes: (reference: non-diabetic) | |||||||
| recent/active | 1.04 | 0.89 — 1.22 | 0.5856 | 1.07 | 0.91 — 1.25 | 0.4100 | |
| remote/inactive | 1.77 | 1.12 — 2.79 | 0.0148 | 1.96 | 1.24 — 3.10 | 0.0040 | |
| unknown | 1.33 | 0.60 — 2.94 | 0.4785 | 1.33 | 0.59 — 2.98 | 0.4885 | |
| Hypertension: (reference: non hypertensive) | |||||||
| recent/active | 0.98 | 0.89 — 1.09 | 0.7567 | 0.98 | 0.89 — 1.08 | 0.6952 | |
| remote/inactive | 1.01 | 0.77 — 1.32 | 0.9447 | 0.97 | 0.74 — 1.28 | 0.8546 | |
| unknown | 0.91 | 0.39 — 2.15 | 0.8351 | 0.95 | 0.40 — 2.28 | 0.9086 | |
| Cardiac Event/Condition:* (reference: no event/condition) | |||||||
| recent/active | 0.95 | 0.80 — 1.13 | 0.5712 | 0.95 | 0.80 — 1.14 | 0.5954 | |
| unknown | 0.88 | 0.73 — 1.06 | 0.1770 | 0.87 | 0.72 — 1.05 | 0.1374 | |
| Primary etiology for MCI (reference: Alzheimer’s disease) | |||||||
| Vascular disease | 0.60 | 0.46 — 0.79 | 0.0003 | 0.63 | 0.48 — 0.83 | 9.00E-04 | |
| Lewy body | 1.17 | 0.93 — 1.47 | 0.1716 | 1.10 | 0.88 — 1.38 | 0.4079 | |
| other | 0.64 | 0.52 — 0.79 | <0.0001 | 0.63 | 0.51 — 0.77 | <0.0001 | |
| missing/unknown | 0.59 | 0.54 — 0.66 | <0.0001 | 0.63 | 0.57 — 0.70 | <0.0001 | |
| Referral: (reference: referred by self/relative/friend) | |||||||
| health professional | 1.46 | 1.29 — 1.64 | <0.0001 | ||||
| other† | 0.88 | 0.77 — 1.00 | 0.0574 | ||||
| unknown | 0.80 | 0.61 — 1.06 | 0.1225 | ||||
| Family History of Dementia: (reference: no family history) | |||||||
| ≥1 1st degree relative | 1.12 | 1.01 — 1.25 | 0.0256 | ||||
| unknown | 1.00 | 0.83 — 1.21 | 0.9727 | ||||
Reference for Baseline cognitively unimpaired: White, Male, High School education, non-diabetic, non-hypertensive, no history of cardiac event/condition, referred by self/relative/friend, and no family history of dementia.
The designation of “recent/active” was given if the condition occurred within the year prior to the study visit or required active management in the case of chronic conditions and the report was consistent with information obtained during the subject and study partner interview. The label “remote/inactive” was indicated if the condition existed or occurred in the past or more than one year ago, but had resolved or no longer needed treatment or management. As implied, if a condition was reported by either the participant or the study partner or indicated from other records, it was designated as “absent”. A label of “unknown” selected if there was insufficient data to determine the status of the condition.
Cardiac event/condition includes history of myocardial infarction (MI), atrial fibrillation (AFib), and congestive heart failure (CHF). “Recent/active” selected if any of the three conditions were “recent/active”; categorization “absent” if all three were “absent” or “remote/inactive”, and “unknown” for combinations of “unknown”, “absent”, and “remote/inactive”.
The category of “Other” for Referral Source represents a mixture of categories, including Alzheimer’s Disease Center (ADC) solicitation, non-ADC study, population sample, or non-ADC media appeal.
NOTE: As is evident in the table, variables of interest included a number of “unknown” responses. Sensitivity analyses were performed, wherein an “unknown” response for any of the covariates in the table resulted in the subject being excluded from analyses. Although sample size was markedly reduced, race results were practically unchanged.
4.3.2. Cardiovascular conditions and risk factors:
In those cognitively unimpaired at baseline, cardiovascular conditions were associated with risk of progression. Compared to those without a cardiac history, individuals with an unknown history for cardiac events demonstrated increased risk for progression to cognitive impairment. Additionally, recent/active diabetes conferred elevated risk for incident progression (Table 2, Model 1). In contrast, among those with baseline MCI, only remote/inactive diabetes was associated with risk for progression to dementia (Table 3, Model 1), although only a few participants reported remote/inactive diabetes (N=31; Table 1).
4.3.3. Etiology of MCI at Baseline:
For participants with MCI at baseline, primary etiology was included in the regression model (Table 3, Model 1). Non-AD etiologies were associated with reduced risk for progression. Specifically, VaD, “other”, and “missing/unknown” etiologies for MCI demonstrated an approximately 40% reduced hazard for progression compared to cases where AD was considered the primary cause for MCI.
4.4. Model 2: Examination of recruitment processes
With few exceptions, when enrollment factors were added to regression models, model parameters were generally unchanged. Notably, for those with MCI at baseline, the protective effect associated with being Black decreased slightly with the addition of enrollment factors.
In general, being referred by a clinician, and referral sources other than self, family or friend, was associated with increased risk for progression to cognitive impairment (Tables 2 and 3, Model 2). For those with baseline MCI, any referral source other than self, family or friend was associated with greater hazard for progression (Table 3, Model 2). Referral to the ADC by a health professional was associated with a 39% increased hazard for progression in those who were cognitively unimpaired at baseline and 46% increased hazard for those with MCI at baseline. Likewise, compared to individuals reporting no family history, those with a known family history of dementia exhibited an elevated risk for incident cognitive impairment – 22% increased hazard for those who were cognitively unimpaired at baseline, and 12% increased hazard in those with MCI at baseline.
Of note, sensitivity analyses excluding participants with ‘unknown’ responses for variables of interest were performed. The influence of race was essentially unchanged.
5. DISCUSSION
Employing a widely-used ADRD database, we derived a subsample of 12,242 participants from 37 US-based ADCs, and found that (1) non-Latino Blacks with MCI at baseline demonstrated a lower hazard for progression to dementia than Whites with MCI, and (2) cognitively unimpaired Blacks had a similar hazard for dementia or MCI compared to Whites. These findings contradict numerous reports of increased risk for incident cognitive impairment and dementia in Blacks compared to non-Latino Whites[15–22]. Published reports – predominantly population-based samples – include a meta-analysis suggesting that rate of progression to AD dementia was 64% higher in Blacks compared to non-Latino Whites[23] and a systematic review depicting an incident dementia rate 1.6 times higher in Blacks than in non-Latino Whites[24].
Considering findings from nested regression models including (1) subject characteristics, cardiovascular and metabolic risk factors, primary etiology for those with MCI at baseline, and (2) enrollment-related factors such as referral source and knowledge of family history of dementia, alongside differences in enrollment practices between Blacks and Whites, we suggest that selection bias could be among the factors contributing to results divergent from the extant literature. Specifically, survival models including the above factors revealed that outside of expected factors (female sex, education and diabetes), referral source and known family history of dementia were prominent predictors of incident cognitive impairment. Cognitively healthy participants referred to the ADCs Clinical Core by a health professional had approximately 39% higher hazard for MCI or dementia than those who were self- or family/friend-referred. Similarly, in the MCI subgroup, health professional referral was associated with 46% elevation in hazard. Importantly, enrollment factors differed between Blacks and Whites with Blacks being less likely than Whites to be recruited by a health professional.
These findings extend those of Chen et al[6] and others[25, 26]. Examining participants from a single ADC, Chen et al. found rate of progression to MCI differed based on recruitment source. Clinic-based recruitment was associated with a 25% higher rate of progression than community-based recruitment. The number of Blacks included in Chen et al.’s analysis was small, precluding an examination by race. It is nonetheless notable that all Blacks (N=8) in their analyses were recruited from non-clinical settings.
Individual Centers devise recruitment strategies to meet enrollment needs of Center-affiliated projects. Participant recruitment at ADCs typifies that of other similarly reputable multi-site ADRD cohort studies, e.g., Alzheimer’s Disease Neuroimaging Studies. These datasets include research volunteers recruited using a variety of strategies: recruitment from clinics, community outreach, among others. Data derived from ADCs serve to establish standards and models of disease progression, such as the recently published Research Framework for AD[27]. Moreover, seminal papers describing racial differences in cerebrospinal fluid proteins[28–30] and neuropathological findings have utilized ADC data[31, 32].
This study examined simple markers of sampling strategy and found preliminary evidence that sampling strategies may introduce selection bias at an aggregate level and likely at the level of individual ADCs. Selection bias occurs when sampling methods – in this case, our enrollment factors - are systematically associated with both an exposure of interest such as race and with outcomes of interest, e.g., incident dementia. Subsequently, our sampling strategies result in bias analogous to what is termed Healthy Worker Bias (HWB) [33] and obscure true relationships between race and cognitive aging trajectories. See Figure 3. for an elaboration of the potential effects of enrollment differences in reference to the HWB.
Figure 3.
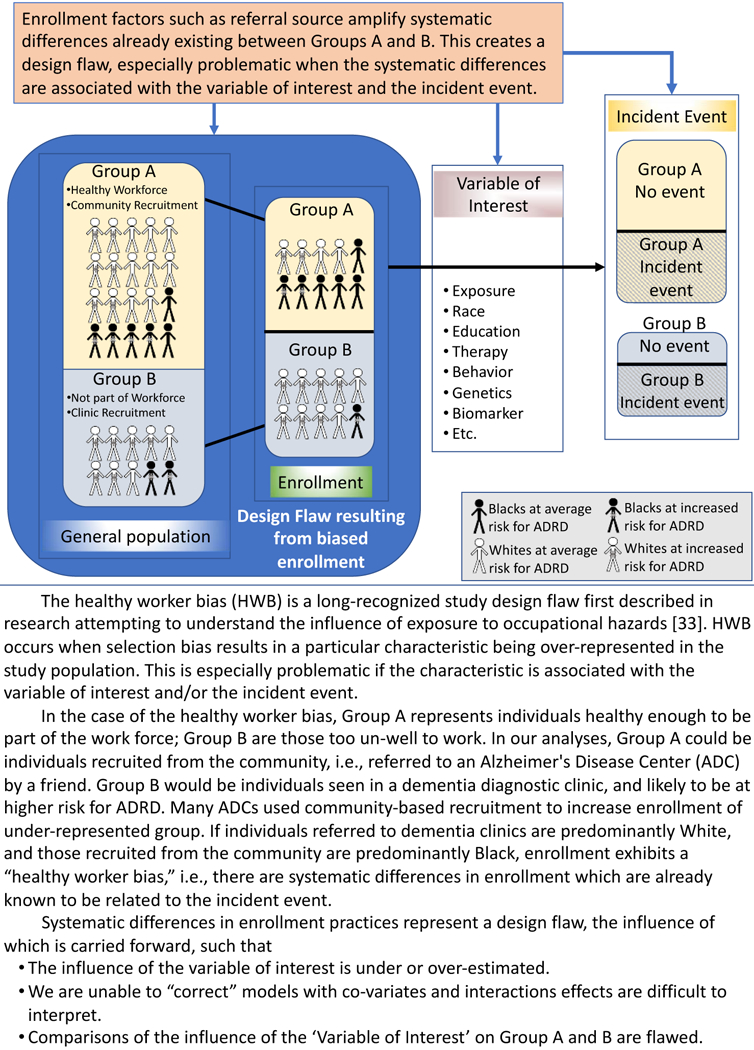
Potential downstream influence of the enrollment factors, illustrated using the Healthy Worker bias as an example.
The degree to which this bias occurs likely varies by Center, as centers employ systematically different enrollment strategies. In the short-term, these findings suggest that including sampling strategy-related covariates may be important for analyses examining cognitive progression. In the longer-term, using community-based approaches for all groups could reduce both sampling and selection bias. Finally, the data support the idea that well-powered within-group analyses may provide more valid information on risk estimation than racial comparison studies[34].
It is possible that the present findings accurately reflect racial patterns in risk for cognitive impairment and dementia. Some studies report comparable rates for prevalence and incidence of dementia for non-Latino Blacks and Whites[35–37], or that adjusting for social factors such as education or literacy eliminates observed racial disparities in dementia prevalence and incidence[38, 39]. Data suggesting reductions in racial disparities for dementia, possibly related to improved education and healthcare, support the latter position[40].
To explore alternative contributing factors, we examined whether rate of incident dementia and cognitive impairment was influenced by underlying differences in (1) vascular risk and (2) clinically assessed baseline MCI etiology. Racial differences in vascular disease burden between non-Latino Whites and Blacks are hypothesized to underlie racial disparities in dementia prevalence. Data from the Atherosclerosis Risk in Communities (ARIC) Cohort study revealed that midlife vascular risk factors increased risk for dementia[41, 42] and amyloid deposition[43, 44], finding no interaction between race and vascular risk, i.e., elevated dementia risk in Blacks reflects differences in underlying vascular disease. In our analytic sample, Black participants had more cardiovascular disease than Whites. In total, our data did not suggest that elevated vascular burden in Whites accounted for Whites elevated risk for progression.
We also explored whether the lower rate of incident cognitive impairment in non-Latino Blacks occurred because their underlying etiology was less progressive, e.g., MCI due to VaD, as opposed to AD or DLB. In the present study, MCI due to VaD was associated with decreased hazard rate compared to MCI due to AD, supporting this supposition. On the other hand, MCI due to VaD accounted for fewer than 10% of diagnoses; the vast majority were AD or Mixed pathology. The limited number of autopsy studies including Black decedents precludes a full understanding of race-based etiological differences for MCI and dementia. Moreover, data from published studies were obtained from ADCs[31, 32], and may be subject to similar enrollment-based bias. The limited autopsy data available suggest that Blacks with a clinical diagnosis of dementia were more likely than Whites to have a mixed pathological load at autopsy; however, a mixed pathology including AD.
5.1. Limitations
5.1.1. The present study’s limitations include our inability to dissociate enrollment factors from other multi-dimensional factors, most obvious with family history. Family history is a dimensional risk factor, encompassing genetics, exposures, etc. We propose it also represents an enrollment factor, i.e., access to diagnostic services and/or awareness of risk – likely differentially associated with outcomes in Whites and Blacks. This position is based on the following reasoning: (1) the disease is frequently undiagnosed, especially in non-White populations[10]. Recent data suggest that 1/2 to 3/4 of dementia cases go undiagnosed[7–9], and specialty-clinic referral patterns differ between non-Hispanic Blacks and Whites[11]; (2) Those affected by the disease would be inclined to participate in AD research[45]. A survey found that individuals with a family history of AD were both fearful of developing the disease and highly motivated to be in ADRD research [12].
We present a secondary analysis of variables collected for reasons other than assessing the effects of selection practices. Although imperfect, referral source and family history provide an estimate of how the participant was initially encouraged to join an ADC Clinical Core. Moreover, persons attending and enrolling at ADCs likely have markedly different factors influencing their cognitive health and in different proportions from individuals from the general population. Appendix B highlights the differences between the analytic sample and those excluded due to lack of follow-up.
Finally, regression models predicting incident cognitive impairment cannot fully account for participant attrition and events occurring before monitoring. Systematic differences between comparator groups in attrition and age of events would alter results. These concerns along with the sample’s racial imbalance make generalization beyond this population problematic.
5.2. Conclusions
Altogether, we suggest that it may be problematic to draw conclusions based on racial comparisons derived from datasets with racial differences in enrollment strategies. The bias introduced by enrollment strategies resulting in selection bias would be difficult to address in statistical models, as discussed by investigators wrestling with the Healthy Worker Bias[46]. Many ADCs rely on clinic-based recruitment, especially for MCI cases. Blacks are less likely to be evaluated in clinic[10]. Thus, URG recruitment often relies on community-based strategies. If clinic-based recruitment is the predominant source for White participants and community-based recruitment the primary source of Black participants, as is the case for many ADCs, the bias introduced by design would be difficult to overcome.
Socio-cultural factors including lack of access to quality education[47], neighborhood factors[48], and higher lifetime stress[49] are hypothesized to contribute mechanistically, either driving disease and comorbid risk factors (e.g., weathering, elevated cardiovascular disease), or lowering reserve (See Brewster et al[50]. for review). Blacks and other historically marginalized groups are more likely to carry the burden of these social-contextual inequities. It is imperative that we address study design flaws that may obscure accurate understanding of these factors’ influence on ADRD for both Blacks and Whites.
We argue that the approach to reducing the influence of selection bias in ADC datasets is two-fold. ADCs should (1) use community-based approaches applied within URG populations to recruit and retain both White and URG samples; and (2) improve clinic access for Blacks, e.g., encouraging primary care providers to refer Black patients with concerns, and empowering Black families to advocate for diagnostic services. In the meantime, it will be important to exercise caution when using ADC data to derive new frameworks and cut-points based on cohorts, subject to selection bias[50].
7. ACKNOWLEDGEMENTS
This work was supported by the National Institute on Aging – National Institutes of Health (NIA-NIH) [R01 AG054059; PI Carey E. Gleason, PhD]. The NACC database is funded by NIA-NIH Grant U01 AG016976. NACC data are contributed by the NIA-funded ADCs: P30 AG019610 (PI Eric Reiman, MD), P30 AG013846 (PI Neil Kowall, MD), P50 AG008702 (PI Scott Small, MD), P50 AG025688 (PI Allan Levey, MD, PhD), P50 AG047266 (PI Todd Golde, MD, PhD), P30 AG010133 (PI Andrew Saykin, PsyD), P50 AG005146 (PI Marilyn Albert, PhD), P50 AG005134 (PI Bradley Hyman, MD, PhD), P50 AG016574 (PI Ronald Petersen, MD, PhD), P50 AG005138 (PI Mary Sano, PhD), P30 AG008051 (PI Thomas Wisniewski, MD), P30 AG013854 (PI M. Marsel Mesulam, MD), P30 AG008017 (PI Jeffrey Kaye, MD), P30 AG010161 (PI David Bennett, MD), P50 AG047366 (PI Victor Henderson, MD, MS), P30 AG010129 (PI Charles DeCarli, MD), P50 AG016573 (PI Frank LaFerla, PhD), P50 AG005131 (PI James Brewer, MD, PhD), P50 AG023501 (PI Bruce Miller, MD), P30 AG035982 (PI Russell Swerdlow, MD), P30 AG028383 (PI Linda Van Eldik, PhD), P30 AG053760 (PI Henry Paulson, MD, PhD), P30 AG010124 (PI John Trojanowski, MD, PhD), P50 AG005133 (PI Oscar Lopez, MD), P50 AG005142 (PI Helena Chui, MD), P30 AG012300 (PI Roger Rosenberg, MD), P30 AG049638 (PI Suzanne Craft, PhD), P50 AG005136 (PI Thomas Grabowski, MD), P50 AG033514 (PI Sanjay Asthana, MD, FRCP), P50 AG005681 (PI John Morris, MD), P50 AG047270 (PI Stephen Strittmatter, MD, PhD).
Appendix A.
Appendix Table A.
Racial comparisons of full sample.
Full Sample, included only non-Hispanic Whites and Blacks. N of 26,304 includes some individual excluded from analyses after additional exclusion criteria were applied. Data were collected between June 2005 and February 2017.
| Overall | White | Black | P | ||
|---|---|---|---|---|---|
| N | 26304 | 22225 | 4079 | ||
| African American or Black, N(%) | 4079 (15.5) | ||||
| Entry age in yrs, mean(SD) | 74.65 (8.09) | 74.79 (8.13) | 73.90 (7.84) | <0.001 | |
| Female Sex, N(%) | 14834 (56.4) | 11857 (53.3) | 2977 (73.0) | <0.001 | |
| Died, N(%) | 6314 (24.0) | 5696 (25.6) | 618 (15.2) | <0.001 | |
| Education Category | <0.001 | ||||
| Under High School, N(%) | 1513 (5.8) | 817 (3.7) | 696 (17.1) | ||
| High School, N(%) | 5141 (19.5) | 4091 (18.4) | 1050 (25.7) | ||
| Over High School, N(%) | 4809 (18.3) | 3866 (17.4) | 943 (23.1) | ||
| Bachelor degree, N(%) | 5976 (22.7) | 5426 (24.4) | 550 (13.5) | ||
| Masters degree, N(%) | 6051 (23.0) | 5408 (24.3) | 643 (15.8) | ||
| Doctorate degree, N(%) | 2666 (10.1) | 2491 (11.2) | 175 (4.3) | ||
| Unknown, N(%) | 148 (0.6) | 126 (0.6) | 22 (0.5) | ||
| Diabetes | <0.001 | ||||
| Absent, N(%) | 22988 (87.4) | 20018 (90.1) | 2970 (72.8) | ||
| Recent/active, N(%) | 3074 (11.7) | 2024 (9.1) | 1050 (25.7) | ||
| Remote/inactive, N(%) | 165 (0.6) | 128 (0.6) | 37 (0.9) | ||
| unknown, (N%) | 77 (0.3) | 55 (0.2) | 22 (0.5) | ||
| Hypertension | <0.001 | ||||
| Absent, N(%) | 12189 (46.3) | 11208 (50.4) | 981 (24.1) | ||
| Recent/active, N(%) | 13145 (50.0) | 10200 (45.9) | 2945 (72.2) | ||
| Remote/inactive, N(%) | 885 (3.4) | 745 (3.4) | 140 (3.4) | ||
| Unknown, (N%) | 85 (0.3) | 72 (0.3) | 13 (0.3) | ||
| Cardiac event/condition* | <0.001 | ||||
| Absent, N(%) | 22435 (85.3) | 18880 (84.9) | 3555 (87.2) | ||
| Recent/active, N(%) | 2044 (7.8) | 1795 (8.1) | 249 (6.1) | ||
| Unknown, (N%) | 1825 (6.9) | 1550 (7.0) | 275 (6.7) | ||
| Diagnosis at Baseline | <0.001 | ||||
| Cognitively unimpaired | 10249 (39.0) | 8556 (38.5) | 1693 (41.5) | ||
| Impaired-not-MCI | 1126 (4.3) | 894 (4.0) | 232 (5.7) | ||
| MCI | 5721 (21.7) | 4768 (21.5) | 953 (23.4) | ||
| Dementia | 9208 (35.0) | 8007 (36.0) | 1201 (29.4) | ||
| Referral Source | <0.001 | ||||
| Self/relative/friend, N(%) | 8134 (30.9) | 6745 (30.3) | 1389 (34.1) | ||
| Health professional, N(%) | 9527 (36.2) | 8475 (38.1) | 1052 (25.8) | ||
| Other, N(%)† | 7937 (30.2) | 6393 (28.8) | 1544 (37.9) | ||
| Unknown, N(%) | 706 (2.7) | 612 (2.8) | 94 (2.3) | ||
| Family History of dementia | <0.001 | ||||
| No 1st degree relative, N(%) | 9855 (37.5) | 8218 (37.0) | 1637 (40.1) | ||
| ≥One 1st degree relative, N(%) | 13677 (52.0) | 11880 (53.5) | 1797 (44.1) | ||
| unknown, (N%) | 2772 (10.5) | 2127 (9.6) | 645 (15.8) | ||
| ≥ One follow-up visit, N(%) | 18812 (71.5) | 16083 (72.4) | 2729 (66.9) | <0.001 | |
| Years of follow-up, mean (SD) | 2.94 (2.94) | 2.97 (2.94) | 2.75 (2.96) | <0.001 |
The designation of “recent/active” was given if the condition occurred within the year prior to the study visit or required active management in the case of chronic conditions and the report was consistent with information obtained during the subject and study partner interview. The label “remote/inactive” was indicated if the condition existed or occurred in the past or more than one year ago, but had resolved or no longer needed treatment or management. As implied, if a condition was reported by either the participant or the study partner or indicated from other records, it was designated as “absent”. A label of “unknown” selected if there was insufficient data to determine the status of the condition.
Cardiac event/condition includes history of myocardial infarction (MI), atrial fibrillation (AFib), and congestive heart failure (CHF). “Recent/active” selected if any of the three conditions were “recent/active”; categorization “absent” if all three were “absent” or “remote/inactive”, and “unknown” for combinations of “unknown”, “absent”, and “remote/inactive”.
The category of “Other” for Referral Source represents a mixture of categories, including Alzheimer’s Disease Center (ADC) solicitation, non-ADC study, population sample, or non- ADC media appeal.
Appendix B.
Appendix Table B.1.
Comparison of analytic sample to group meeting all inclusion criteria with the exception of having follow-up data. Data were collected between June 2005 and February 2017.
| Analytic Sample |
Excluded - No Follow-up data |
P | |
|---|---|---|---|
| N | 12,242 | 3,622 | |
| African American or Black, N(%) | 1904 (15.6) | 742 (20.5) | <0.001 |
| Entry age in yrs, mean(SD) | 74.38 (7.94) | 73.78 (8.15) | <0.001 |
| Female Sex, N{%) | 7235 ( 59.1) | 2148 ( 59.3) | 0.841 |
| Died, N(%) | 1933 (15.8) | 397 (11.0) | <0.001 |
| Education Category | <0.001 | ||
| Under High School, N{%) | 446 (3.6) | 182 (5.0) | |
| High School, N(%} | 1915 (15.6) | 647 (17.9) | |
| Over High School, N(%) | 2314 (18.9) | 692 (19.1) | |
| Bachelor degree, N(%) | 2894 (23.6) | 801 (22.1) | |
| Masters degree, N(%) | 3270 (26.7) | 923 (25.5) | |
| Doctorate degree, N(%) | 1365 (11.2) | 356 (9.8) | |
| Unknown, N(%) | 38 (0.3) | 21 (0.6) | |
| Diabetes | <0.001 | ||
| Absent, N(%) | 10749 (87.8) | 3079 (85.0) | |
| Recent/active, N(%) | 1394 (11.4) | 499 (13.8) | |
| Remote/inactive, N(%) | 64 (0.5) | 33 (0.9) | |
| unknown, (N%) | 35 (0.3) | 11 (0.3) | |
| Hypertension | 0.006 | ||
| Absent, N(%) | 5743 (46.9) | 1608 (44.4) | |
| Recent/active, N(%) | 6139 (50.1) | 1878 (51.8) | |
| Remote/inactive, N(%) | 326 (2.7) | 119 (3.3) | |
| Unknown, (N%) | 34 (0.3) | 17 (0.5) | |
| Cardiac event/condition* | 0.058 | ||
| Absent, N(%) | 10568 (86.3) | 3070 (84.8) | |
| Recent/active, N(%) | 909 (7.4) | 299 (8.3) | |
| Unknown, (N%) | 765 (6.2) | 253 (7.0) | |
| Diagnosis at Baseline | |||
| Cognitively unimpaired | 8182 (66.8) | 2067 (57.1) | |
| Impaired-not-MCI | 0(0.0) | 0(0.0) | |
| MCI | 4060 (33.2) | 1555 (42.9) | |
| Dementia | 0 (0.0) | 0 (0.0) | |
| Referral Source | <0.001 | ||
| Self/relative/friend, N(%) | 4358 (35.6) | 1248 (34.5) | |
| Health professional, N(%) | 2757 (22.5) | 1181 (32.6) | |
| Other, N(%)† | 4688 (38.3) | 1106 (30.5) | |
| Unknown, N{%) | 439 (3.6) | 87 (2.4) | |
| Family History of dementia | <0.001 | ||
| No 1st degree relative, N(%) | 4522 (36.9) | 1501 (41.4) | |
| ≥ One 1st degree relative, N(%} | 6601 (53.9) | 1661 (45.9) | |
| unknown, (N%) | 1119 (9.1) | 460 (12.7) | |
| ≥ One follow-up visit, N(%) | 12.242 (100.0) | 0 (0) | <0.001 |
| Years of follow-up, mean (SD) | 4.55 (2.83) | 0(0) | <0.001 |
The designation of “recent/active” was given if the condition occurred within the year prior to the study visit or required active management in the case of chronic conditions and the report was consistent with information obtained during the subject and study partner interview. The label “remote/inactive” was indicated if the condition existed or occurred in the past or more than one year ago, but had resolved or no longer needed treatment or management. As implied, if a condition was reported by either the participant or the study partner or indicated from other records, it was designated as “absent” A label of “unknown” selected if there was insufficient data to determine the status of the condition.
Cardiac event/condition includes history of myocardial infarction (Ml), atrial fibrillation (AFib), and congestive heart failure {CHF). “Recent/active” selected if any of the three conditions were “recent/active’’; categorization “absent” if all three were “absent or “remote/inactive”, and “unknown” for combinations of “unknown”, “absent”, and “remote/inactive”.
The category of “Other” for Referral Source represents a mixture of categories, including Alzheimer’s Disease Center (ADC) solicitation, non-ADC study, population sample, or non-ADC media appeal.
Appendix Table B.2.
Comparison of inclusion status by race. Analytic sample is compared to group meeting all inclusion criteria with the exception of having follow-up data. Data were collected between June 2005 and February 2017.
| Analytic Sample | Excluded - No Follow-up data |
p | ||||
|---|---|---|---|---|---|---|
| Blacks | Whites | Blacks | Whites | |||
| N | 1904 | 10338 | 742 | 2880 | ||
| Entry age in yrs, mean(SD) | 72.96 {7.26) | 74.64 (8.03) | 72.15(7.34) | 74.19 (8.29) | <0.001 | |
| Female Sex, N(%) | 1437 (75.5) | 5798 (56.1) | 539 (72.6) | 1609 (55.9) | <0.001 | |
| Died, N(%) | 187 (9.8) | 1746 (16.9) | 55 (7.4) | 342 (11.9) | <0.001 | |
| Education Category | <0.001 | |||||
| Under High School, N(%) | 216(11.3) | 230(2.2) | 101(13,6) | 81 (2.8) | ||
| High School, N(%) | 454(23.8) | 1461(14,1) | 185 (24,9) | 462 (16.0) | ||
| Over High School, N(%) | 486 (25.5) | 1828 (17.7) | 179 (24.1) | 513 (17.8) | ||
| Bachelor degree, N(%) | 268(14.1) | 2626 (25.4) | 124(16.7) | 677 (23.5) | ||
| Masters degree, N(%) | 371(19.5) | 2899 (28.0) | 127(17.1) | 796 (27.6) | ||
| Doctorate degree, N(%) | 106 (5.6) | 1259(12.2) | 26 (3.5) | 330 (11.5) | ||
| Unknown, N(%) | 3 (0.2) | 35 (0.3) | 0 (0.0) | 21(0.7) | ||
| Diabetes | <0.001 | |||||
| Absent, N(%) | 1376 (72.3) | 9373 (90.7) | 535(72.1) | 2544 (88.3) | ||
| Recent/active, N(%) | 500(26.3) | 894 (8.6) | 196(26.4) | 303 (10.5) | ||
| Remote/inactive, N(%) | 14 (0.7) | 50 (0.5) | 10 (1.3) | 23 (0.8) | ||
| unknown, (N%) | 14 (0.7) | 21(0.2) | 1 (0.1) | 10 (0.3) | ||
| Hypertension | <0.001 | |||||
| Absent, N(%) | 448 (23.5) | 5295 (51.2) | 190(25.6) | 1418 (49.2) | ||
| Recent/active, N(%) | 1401 (73.6) | 4738 (45.8) | 519 (69.9) | 1359 (47.2) | ||
| Remote/inactive, N(%) | 51 (2.7) | 275 (2.7) | 27 (3.6) | 92(3.2) | ||
| Unknown, (N%) | 4 (0.2) | 30 (0.3) | 6 (0.8) | 11(0.4) | ||
| Cardiac event/condition* | <0.001 | |||||
| Absent, N(%) | 1684 (88.4) | 8884 (85.9) | 645 (86.9) | 2425 (84.2) | ||
| Recent/active, N(%) | 100 (5.3) | 809 (7.8) | 45 (6.1) | 254 (8.8) | ||
| Unknown, (N%) | 120 (6.3) | 645 (6.2) | 52 (7.0) | 201 (7.0) | ||
| Diagnosis at Baseline | ||||||
| Cognitively unimpaired | 1288 (67.6) | 6894 (66.7) | 405 (54.6) | 1662 (57.7) | ||
| Impaired-not-MCI | 0 (0.0) | 0 (0.0) | 0 (0.0) | 0 (0.0) | ||
| MCI | 616 (32.4) | 3444 (33.3) | 337 (45.4) | 1218 (42.3) | ||
| Dementia | 0 (0.0) | 0 (0.0) | 0 (0.0) | 0 (0.0) | ||
| Referral Source | <0.001 | |||||
| Self/relative/friend, N(%) | 696 (36.6) | 3662 (35.4) | 286 (38.5) | 962 (33.4) | ||
| Health professional, N(%) | 259 (13.6) | 2498 (24.2) | 169 (22.8) | 1012 (35.1) | ||
| Other, N(%)† | 881 (46.3) | 3807 (36.8) | 274(36.9) | 832 (28.9) | ||
| Unknown, N(%) | 68 (3.6) | 371 (3.6) | 13 (1.8) | 74 (2.6) | ||
| Family Flistory of dementia | <0.001 | |||||
| No 1st degree relative, N(%) | 806 (42.3) | 3716 (35.9) | 347 (46.8) | 1154 (40.1) | ||
| ≥ One 1st degree relative, N(%) | 852 (44.7) | 5749 (55.6) | 272 (36.7) | 1389 (48.2) | ||
| unknown, (N%) | 246 (12.9) | 873 (8.4) | 123 (16.6) | 337 (11.7) | ||
| ≥ One follow-up visit, IM(%) | 1904 (100.0) | 10338 (100,0) | 0(0) | 0(0) | <0.001 | |
| Years of follow-up, mean (SD) | 4.45 (2.84) | 4.57 (2.83) | 0 (0) | 0 (0) | <0.001 | |
The designation of “recent/active” was given if the condition occurred within the year prior to the study visit or required active management in the case of chronic conditions and the report was consistent with information obtained during the subject and study partner interview. The label “remote/inactive” was indicated if the condition existed or occurred in the past or more than one year ago, but had resolved or no longer needed treatment or management. As implied, if a condition was reported by either the participant or the study partner or indicated from other records, it was designated as “absent”. A label of “unknown” selected it there was insufficient data to determine the status of the condition.
‘Cardiac event/condition includes history of myocardial infarction (Ml), atrial fibrillation (AFib), and congestive heart failure (CHF). “Recent/active” selected if any of the three conditions were “recent/active”; categorization “absent” if all three were “absent or “remote/inactive”, and “unknown” for combinations of “unknown” “absent” and “remote/inactive”.
The category of “Other” for Referral Source represents a mixture of categories, including Alzheimer’s Disease Center (ADC) solicitation, non-ADC study, population sample, or non-ADC media appeal.
Footnotes
6. REFERENCES
- [1].Scharff DP, Mathews KJ, Jackson P, Hoffsuemmer J, Martin E, Edwards D. More than Tuskegee: understanding mistrust about research participation. J Health Care Poor Underserved. 2010;21:879–97. [DOI] [PMC free article] [PubMed] [Google Scholar]
- [2].Lambe S, Cantwell N, Islam F, Horvath K, Jefferson AL. Perceptions, knowledge, incentives, and barriers of brain donation among African American elders enrolled in an Alzheimer’s research program. Gerontologist. 2011;51:28–38. [DOI] [PMC free article] [PubMed] [Google Scholar]
- [3].Watson JL, Ryan L, Silverberg N, Cahan V, Bernard MA. Obstacles and opportunities in Alzheimer’s clinical trial recruitment. Health Aff (Millwood). 2014;33:574–9. [DOI] [PMC free article] [PubMed] [Google Scholar]
- [4].Vidoni ED, Bothwell RJ, Burns JM, Dwyer JR. Novel recruitment models will drive Alzheimer’s trial success. Alzheimers Dement. 2018;14:117–9. [DOI] [PMC free article] [PubMed] [Google Scholar]
- [5].Campbell DT, Stanley JC, Gage NL. Experimental and quasi-experimental designs for research. Chicago,: R. McNally; 1966. [Google Scholar]
- [6].Chen Y, Denny KG, Harvey D, Farias ST, Mungas D, DeCarli C, et al. Progression from normal cognition to mild cognitive impairment in a diverse clinic-based and community-based elderly cohort. Alzheimers Dement. 2017;13:399–405. [DOI] [PMC free article] [PubMed] [Google Scholar]
- [7].Prince M, Bryce R, Albanese E, Wimo A, Ribeiro W, Ferri CP. The global prevalence of dementia: a systematic review and metaanalysis. Alzheimers Dement. 2013;9:63–75 e2. [DOI] [PubMed] [Google Scholar]
- [8].Eichler T, Thyrian JR, Hertel J, Kohler L, Wucherer D, Dreier A, et al. Rates of formal diagnosis in people screened positive for dementia in primary care: results of the DelpHi-Trial. J Alzheimers Dis. 2014;42:451–8. [DOI] [PubMed] [Google Scholar]
- [9].Boustani M, Peterson B, Hanson L, Harris R, Lohr KN. Screening for dementia in primary care: A summary of the evidence for the US Preventive Services Task Force. Annals of Internal Medicine. 2003;138:927–37. [DOI] [PubMed] [Google Scholar]
- [10].Clark PC, Kutner NG, Goldstein FC, Peterson-Hazen S, Garner V, Zhang R, et al. Impediments to timely diagnosis of Alzheimer’s disease in African Americans. J Am Geriatr Soc. 2005;53:2012–7. [DOI] [PubMed] [Google Scholar]
- [11].Kalkonde YV, Pinto-Patarroyo GP, Goldman T, Strutt AM, York MK, Kunik ME, et al. Ethnic disparities in the treatment of dementia in veterans. Dementia and geriatric cognitive disorders. 2009;28:145–52. [DOI] [PubMed] [Google Scholar]
- [12].Wendler D, Martinez RA, Fairclough D, Sunderland T, Emanuel E. Views of potential subjects toward proposed regulations for clinical research with adults unable to consent. Am J Psychiatry. 2002;159:585–91. [DOI] [PubMed] [Google Scholar]
- [13].R Core Team. R: A language and environment for statistical computing. http://www.R-project.org/ R Found Stat Comput Vienna, Austria 2017.
- [14].Therneau TM, Grambsch PM. Modeling survival data : extending the Cox model. New York: Springer; 2000. [Google Scholar]
- [15].Mayeda ER, Glymour MM, Quesenberry CP, Whitmer RA. Inequalities in dementia incidence between six racial and ethnic groups over 14 years. Alzheimers Dement. 2016;12:216–24. [DOI] [PMC free article] [PubMed] [Google Scholar]
- [16].Weuve J, Barnes LL, Mendes de Leon CF, Rajan KB, Beck T, Aggarwal NT, et al. Cognitive Aging in Black and White Americans: Cognition, Cognitive Decline, and Incidence of Alzheimer Disease Dementia. Epidemiology. 2018;29:151–9. [DOI] [PMC free article] [PubMed] [Google Scholar]
- [17].Hebert LE, Bienias JL, Aggarwal NT, Wilson RS, Bennett DA, Shah RC, et al. Change in risk of Alzheimer disease over time. Neurology. 2010;75:786–91. [DOI] [PMC free article] [PubMed] [Google Scholar]
- [18].Tang MX, Cross P, Andrews H, Jacobs DM, Small S, Bell K, et al. Incidence of AD in African-Americans, Caribbean Hispanics, and Caucasians in northern Manhattan. Neurology. 2001;56:49–56. [DOI] [PubMed] [Google Scholar]
- [19].Kukull WA, Higdon R, Bowen JD, McCormick WC, Teri L, Schellenberg GD, et al. Dementia and Alzheimer disease incidence: a prospective cohort study. Arch Neurol. 2002;59:1737–46. [DOI] [PubMed] [Google Scholar]
- [20].Plassman BL, Langa KM, McCammon RJ, Fisher GG, Potter GG, Burke JR, et al. Incidence of dementia and cognitive impairment, not dementia in the United States. Ann Neurol. 2011;70:418–26. [DOI] [PMC free article] [PubMed] [Google Scholar]
- [21].Perkins P, Annegers JF, Doody RS, Cooke N, Aday L, Vernon SW. Incidence and prevalence of dementia in a multiethnic cohort of municipal retirees. Neurology. 1997;49:44–50. [DOI] [PubMed] [Google Scholar]
- [22].Rajan KB, Weuve J, Barnes LL, Wilson RS, Evans DA. Prevalence and incidence of clinically diagnosed Alzheimer’s disease dementia from 1994 to 2012 in a population study. Alzheimers Dement. 2018. [DOI] [PMC free article] [PubMed] [Google Scholar]
- [23].Steenland K, Goldstein FC, Levey A, Wharton W. A Meta-Analysis of Alzheimer’s Disease Incidence and Prevalence Comparing African-Americans and Caucasians. J Alzheimers Dis. 2016;50:71–6. [DOI] [PMC free article] [PubMed] [Google Scholar]
- [24].Mehta KM, Yeo GW. Systematic review of dementia prevalence and incidence in United States race/ethnic populations. Alzheimers Dement. 2017;13:72–83. [DOI] [PubMed] [Google Scholar]
- [25].Mitchell AJ, Shiri-Feshki M. Rate of progression of mild cognitive impairment to dementia--meta-analysis of 41 robust inception cohort studies. Acta Psychiatr Scand. 2009;119:252–65. [DOI] [PubMed] [Google Scholar]
- [26].Farias ST, Mungas D, Reed BR, Harvey D, DeCarli C. Progression of mild cognitive impairment to dementia in clinic- vs community-based cohorts. Arch Neurol. 2009;66:1151–7. [DOI] [PMC free article] [PubMed] [Google Scholar]
- [27].Jack CR, Bennett DA, Blennow K, Carrillo MC, Dunn B, Haeberlein SB, et al. NIA-AA Research Framework: Toward a biological definition of Alzheimer’s disease. Alzheimers & Dementia. 2018;14:535–62. [DOI] [PMC free article] [PubMed] [Google Scholar]
- [28].Howell JC, Watts KD, Parker MW, Wu J, Kollhoff A, Wingo TS, et al. Race modifies the relationship between cognition and Alzheimer’s disease cerebrospinal fluid biomarkers. Alzheimers Res Ther. 2017;9:88. [DOI] [PMC free article] [PubMed] [Google Scholar]
- [29].Morris JC, Benzinger TLS, Buckles VD, Fagan AM, Gordon BA, Grant EA, et al. Racial Differences and Similarities in Molecular Biomarkers for Alzheimer’s Disease. Alzheimer’s & Dementia: The Journal of the Alzheimer’s Association. 2017;13:P560–P1. [Google Scholar]
- [30].Morris JC, Schindler SE, McCue LM, Moulder KL, Benzinger TLS, Cruchaga C, et al. Assessment of Racial Disparities in Biomarkers for Alzheimer Disease. JAMA Neurol. 2019. epub ahead of print. [DOI] [PMC free article] [PubMed] [Google Scholar]
- [31].Barnes LL, Leurgans S, Aggarwal NT, Shah RC, Arvanitakis Z, James BD, et al. Mixed pathology is more likely in black than white decedents with Alzheimer dementia. Neurology. 2015;85:528–34. [DOI] [PMC free article] [PubMed] [Google Scholar]
- [32].Graff-Radford NR, Besser LM, Crook JE, Kukull WA, Dickson DW. Neuropathologic differences by race from the National Alzheimer’s Coordinating Center. Alzheimers Dement. 2016;12:669–77. [DOI] [PMC free article] [PubMed] [Google Scholar]
- [33].Fox AJ, Collier PF. Low mortality rates in industrial cohort studies due to selection for work and survival in the industry. Br J Prev Soc Med. 1976;30:225–30. [DOI] [PMC free article] [PubMed] [Google Scholar]
- [34].Whitfield KE, Allaire JC, Belue R, Edwards CL. Are comparisons the answer to understanding behavioral aspects of aging in racial and ethnic groups? J Gerontol B Psychol Sci Soc Sci. 2008;63:P301–8. [DOI] [PMC free article] [PubMed] [Google Scholar]
- [35].Fillenbaum GG, Heyman A, Huber MS, Woodbury MA, Leiss J, Schmader KE, et al. The prevalence and 3-year incidence of dementia in older Black and White community residents. J Clin Epidemiol. 1998;51:587–95. [DOI] [PubMed] [Google Scholar]
- [36].Katz MJ, Lipton RB, Hall CB, Zimmerman ME, Sanders AE, Verghese J, et al. Age-specific and sex-specific prevalence and incidence of mild cognitive impairment, dementia, and Alzheimer dementia in blacks and whites: a report from the Einstein Aging Study. Alzheimer Dis Assoc Disord. 2012;26:335–43. [DOI] [PMC free article] [PubMed] [Google Scholar]
- [37].Hendrie HC, Ogunniyi A, Hall KS, Baiyewu O, Unverzagt FW, Gureje O, et al. Incidence of dementia and Alzheimer disease in 2 communities: Yoruba residing in Ibadan, Nigeria, and African Americans residing in Indianapolis, Indiana. JAMA. 2001;285:739–47. [DOI] [PubMed] [Google Scholar]
- [38].Fitzpatrick AL, Kuller LH, Ives DG, Lopez OL, Jagust W, Breitner JC, et al. Incidence and prevalence of dementia in the Cardiovascular Health Study. J Am Geriatr Soc. 2004;52:195–204. [DOI] [PubMed] [Google Scholar]
- [39].Yaffe K, Falvey C, Harris TB, Newman A, Satterfield S, Koster A, et al. Effect of socioeconomic disparities on incidence of dementia among biracial older adults: prospective study. BMJ. 2013;347:f7051. [DOI] [PMC free article] [PubMed] [Google Scholar]
- [40].Zissimopoulos JM, Barthold D, Brinton RD, Joyce G. Sex and Race Differences in the Association Between Statin Use and the Incidence of Alzheimer Disease. JAMA Neurol. 2017;74:225–32. [DOI] [PMC free article] [PubMed] [Google Scholar]
- [41].Chen LY, Norby FL, Gottesman RF, Mosley TH, Soliman EZ, Agarwal SK, et al. Association of Atrial Fibrillation With Cognitive Decline and Dementia Over 20 Years: The ARIC-NCS (Atherosclerosis Risk in Communities Neurocognitive Study). J Am Heart Assoc. 2018;7. [DOI] [PMC free article] [PubMed] [Google Scholar]
- [42].Gottesman RF, Albert MS, Alonso A, Coker LH, Coresh J, Davis SM, et al. Associations Between Midlife Vascular Risk Factors and 25-Year Incident Dementia in the Atherosclerosis Risk in Communities (ARIC) Cohort. JAMA Neurol. 2017;74:1246–54. [DOI] [PMC free article] [PubMed] [Google Scholar]
- [43].Gottesman RF, Schneider AL, Zhou Y, Coresh J, Green E, Gupta N, et al. Association Between Midlife Vascular Risk Factors and Estimated Brain Amyloid Deposition. JAMA. 2017;317:1443–50. [DOI] [PMC free article] [PubMed] [Google Scholar]
- [44].Hughes TM, Wagenknecht LE, Craft S, Mintz A, Heiss G, Palta P, et al. Arterial stiffness and dementia pathology: Atherosclerosis Risk in Communities (ARIC)-PET Study. Neurology. 2018;90:e1248–e56. [DOI] [PMC free article] [PubMed] [Google Scholar]
- [45].Schmitt FA, Wetherby MM, Wekstein DR, Dearth CM, Markesbery WR. Brain donation in normal aging: procedures, motivations, and donor characteristics from the Biologically Resilient Adults in Neurological Studies (BRAiNS) Project. Gerontologist. 2001;41:716–22. [DOI] [PubMed] [Google Scholar]
- [46].Buckley JP, Keil AP, McGrath LJ, Edwards JK. Evolving methods for inference in the presence of healthy worker survivor bias. Epidemiology. 2015;26:204–12. [DOI] [PubMed] [Google Scholar]
- [47].Manly JJ, Jacobs DM, Touradji P, Small SA, Stern Y. Reading level attenuates differences in neuropsychological test performance between African American and White elders. J Int Neuropsychol Soc. 2002;8:341–8. [DOI] [PubMed] [Google Scholar]
- [48].Powell LM, Slater S, Chaloupka FJ, Harper D. Availability of physical activity-related facilities and neighborhood demographic and socioeconomic characteristics: a national study. Am J Public Health. 2006;96:1676–80. [DOI] [PMC free article] [PubMed] [Google Scholar]
- [49].Turner AD, James BD, Capuano AW, Aggarwal NT, Barnes LL. Perceived Stress and Cognitive Decline in Different Cognitive Domains in a Cohort of Older African Americans. Am J Geriatr Psychiatry. 2017;25:25–34. [DOI] [PMC free article] [PubMed] [Google Scholar]
- [50].Brewster P, Barnes L, Haan M, Johnson JK, Manly JJ, Napoles AM, et al. Progress and future challenges in aging and diversity research in the United States. Alzheimers Dement. 2018: In press. [DOI] [PMC free article] [PubMed] [Google Scholar]