Significance
Self-organization of bacterial MinD and MinE into a standing oscillatory wave controls midcell positioning of the cytokinetic septum, ensuring equal-sized daughter cells for efficient vegetative growth. During this process, the MinE dimer structure switches folds between the resting state (6-stranded β-sheet sandwiched by 2 pairs of helices), a membrane-binding state (N-terminal helix detached and disordered to latch the membrane), and a MinD-binding state (β-strands at dimer interface extruded to interact with MinD, leaving behind a 4-stranded β-sheet). Using relaxation dispersion NMR, we probe millisecond exchange dynamics between ground and excited states of MinE in 3 forms that mimic the major conformations sampled by MinE. These excited states play crucial roles in membrane binding and MinD interaction processes.
Keywords: fold switching, excited states, millisecond exchange dynamics, protein conformational dynamics, self-organizing standing wave
Abstract
Bacterial MinD and MinE form a standing oscillatory wave which positions the cell division inhibitor MinC, that binds MinD, everywhere on the membrane except at the midpoint of the cell, ensuring midcell positioning of the cytokinetic septum. During this process MinE undergoes fold switching as it interacts with different partners. We explore the exchange dynamics between major and excited states of the MinE dimer in 3 forms using 15N relaxation dispersion NMR: the full-length protein (6-stranded β-sheet sandwiched between 4 helices) representing the resting state; a 10-residue N-terminal deletion (Δ10) mimicking the membrane-binding competent state where the N-terminal helix is detached to interact with membrane; and N-terminal deletions of either 30 (Δ30) or 10 residues with an I24N mutation (Δ10/I24N), in which the β1-strands at the dimer interface are extruded and available to bind MinD, leaving behind a 4-stranded β-sheet. Full-length MinE samples 2 “excited” states: The first is similar to a full-length/Δ10 heterodimer; the second, also sampled by Δ10, is either similar to or well along the pathway toward the 4-stranded β-sheet form. Both Δ30 and Δ10/I24N sample 2 excited species: The first may involve destabilization of the β3- and β3′-strands at the dimer interface; changes in the second are more extensive, involving further disruption of secondary structure, possibly representing an ensemble of states on the pathway toward restoration of the resting state. The quantitative information on MinE conformational dynamics involving these excited states is crucial for understanding the oscillation pattern self-organization by MinD–MinE interaction dynamics on the membrane.
Cell division in bacteria is dependent upon the assembly of a cytokinetic septum, morphogenesis of which is controlled by a large protein assembly called the divisome that comprises several dozen proteins (1, 2). Divisome assembly is initiated by guanosine triphosphate-dependent polymerization of the tubulin homolog FtsZ anchored to the inner membrane by FtsA, forming the so-called Z-ring. Thus, the position of FtsZ polymerization determines the position of the cell division septum. The positioning of FtsZ polymerization is controlled by multiple systems, one of which is the MinC/D/E system that limits FtsZ polymerization to near the center of elongating cells (3–5), thereby ensuring proper partitioning of replicated copies of the chromosome and even inheritance of cellular contents to the daughter cells. MinC is an FtsZ polymerization inhibitor whose membrane localization is determined by its binding partner, MinD, an adenosine 5′-triphosphate (ATP)-dependent membrane-binding protein. In the presence of MinE, which controls MinD–membrane interaction dynamics including its ATPase activity, MinD and MinE self-organize in a cell pole-to-cell pole standing wave oscillatory pattern with a node at the midcell where the time-averaged MinD density, and accompanying MinC density, is at a minimum, directing midcell polymerization of FtsZ (6). MinC is not required for oscillatory pattern formation per se but tracks the distribution of MinD. This ATP-driven dynamic reaction–diffusion system apparently involves positive feedback loops both in the protein–membrane association phase and membrane dissociation phase of the cycle (7). Throughout this process, the MinE dimer is believed to cycle through different conformational states as it switches its binding partner interaction mode (8–11).
The MinE dimer represents a classical example of a fold-switching protein (12) where major conformational transitions are critical to its function. The resting state of MinE (state I) comprises a 6-stranded β-sheet, 3 from each subunit, sandwiched between 4 helices, 2 from each subunit (9). The N-terminal helix α1 is referred to as the membrane targeting sequence (MTS), because it is thought to anchor onto the anionic cell membrane via its hydrophobic face and associated positively charged residues when the protein is in the active state (13). Thus, to be in a conformation capable of membrane binding, helix α1 must first detach from the 6-stranded sheet (state II). Finally, to bind MinD, the β-strands at the dimer interface must be extruded so that they can interact directly with MinD, leaving behind a 4-stranded β-sheet dimer (state III) (14). When bound to MinD, the extruded β-strand refolds, forming a part of an α-helix that packs against the MinD dimer (10).
Considering the extent of the conformational changes involved, we hypothesized that full-length MinE dimers and truncated or mutant derivatives, that predominantly adopt different structural states, would also likely visit less-populated states resembling those of different conformational states on a short enough time scale to permit their characterization by NMR spectroscopy. To probe and characterize such low occupancy, transient conformational states at the kinetic and structural levels we made use of 15N Carr–Purcell–Meiboom–Gill (CPMG) relaxation dispersion NMR measurements (15–17) on a series of constructs of Neisseria gonorrhoea MinE (ngMinE) that are considered to represent the folded core of the 3 major conformational states (ground states) adopted by MinE at different stages of the pattern self-organization cycle. We show that each construct samples one or more sparsely populated, excited conformational states on the submillisecond to millisecond time scale that provide insights into how fold switching and interconversion between the 3 ground states occurs.
Results and Discussion
N. gonorrhoea MinE and MinD Patterning on Supported Lipid Bilayers.
Wild-type ngMinE has limited solubility that prevents its solution structure determination by NMR and, in our hands, the E46A mutant, employed by Ghasriani et al. (9) to improve solubility, degrades slowly over time due to proteolytic cleavage between Gly9 and Arg10. We therefore mutated Arg10 to Gln, which blocks proteolytic degradation, and the double R10Q/E46A mutant used in the current study is referred to here as wt* ngMinE.
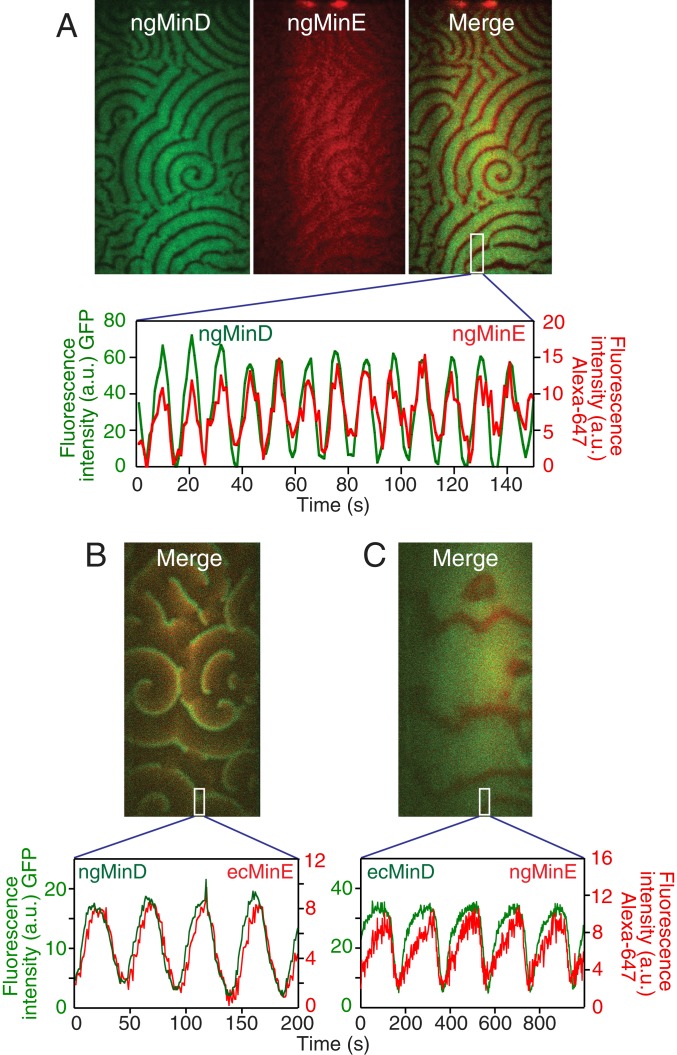
The activity of wt* ngMinE was verified by examining N. gonorrhoea MinE/MinD patterning on supported lipid bilayers, as described previously (7, 18) and shown in Fig. 1A. The oscillatory patterning of wt* ngMinE tracks that of ngMinD, organizing propagating waves under standard reaction conditions (SI Appendix) adopted from those previously employed to study cell-free Escherichia coli MinE/MinD pattern self-organization for this mode of dynamics (7), indicating that wt* ngMinE retains activity in terms of pattern formation. Mutations of positively charged residues within the MTS, such as R10Q, would be predicted to weaken membrane interaction (13) and therefore be expected to exhibit a shortened MinD/MinE oscillation time scale in vitro, shortening the wave length and narrowing the low protein density gaps between the bands of high protein density in the waves (18). The observed oscillation pattern, obtained with the wt* ngMinE protein studied here, agrees with these expected trends.
Fig. 1.
Oscillatory patterns formed by N. gonorrhoea MinD/MinE and combinations of the 2 proteins derived from N. gonorrhoea and E. coli on supported lipid bilayers monitored by total internal reflection fluorescence microscopy. (A) Spiral wave patterns and temporal oscillation of ngMinD/ngMinE. ngMinE(R10Q/E46A) was labeled with the fluorophore Alexa-647 (red) conjugated to an engineered cysteine (L88C) close to its C terminus. ngMinD was tagged to green fluorescent protein (GFP) at its N terminus. (B) Spiral wave patterns and temporal oscillation of ngMinD/ecMinE. ecMinE was labeled with the fluorophore Alexa-647 (red) conjugated to Cys51. MinD was tagged to GFP at its N terminus. (C) Spiral wave patterns and temporal oscillation of ecMinD/ngMinE(R10Q/E46A). See SI Appendix for experimental details.
To confirm the close functional properties of the ngMin proteins to those of the more extensively studied E. coli Min (ecMin) proteins, we tested cell-free pattern self-organization by interspecies mixtures of MinD and MinE under our standard conditions. The combination of ecMinE and ngMinD self-organized into more typical propagating wave patterns resembling those observed with E. coli proteins (18–20), indicating that the interaction of ngMinD with ecMinE is functionally close to that between the 2 E. coli proteins (Fig. 1B). Propagating wave patterns were also readily observed with the wt* ngMinE and ecMinD combination (Fig. 1C). In this instance, the wave propagation velocity was much slower and the high protein density bands were significantly broader (Fig. 1C). Based on the previous study of the E. coli Min system under different reaction conditions and concentrations of MinE (18), the observed wave pattern deviation from the standard patterns with wild-type E. coli proteins can be explained by a lower effective concentration of MinE, likely reflecting somewhat compromised interactions between the proteins of the N. gonorrhoea and E. coli cross-species combination. The observed cross-species complementation among Min proteins in the cell-free system is fully consistent with in vivo complementation among Min proteins derived from N. gonorrhoea in E. coli cells reported earlier (21).
Structures of ngMinE Constructs.
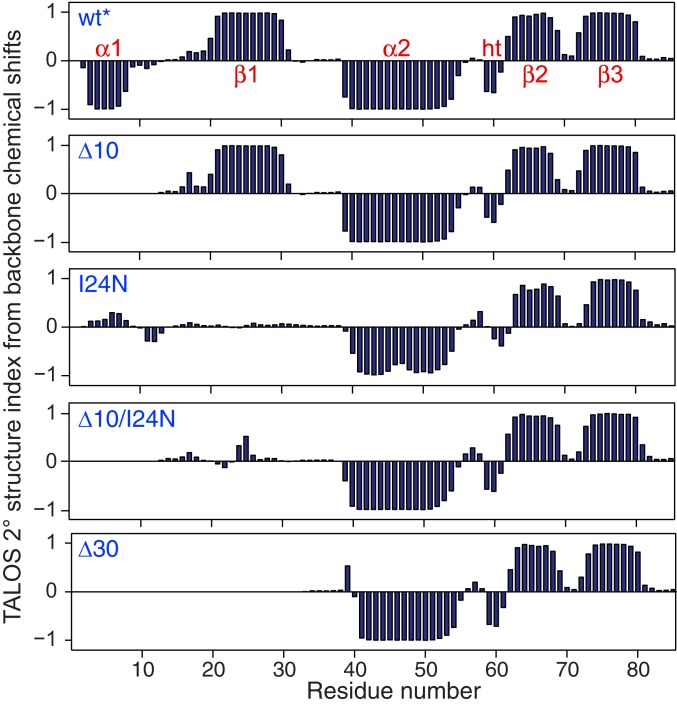
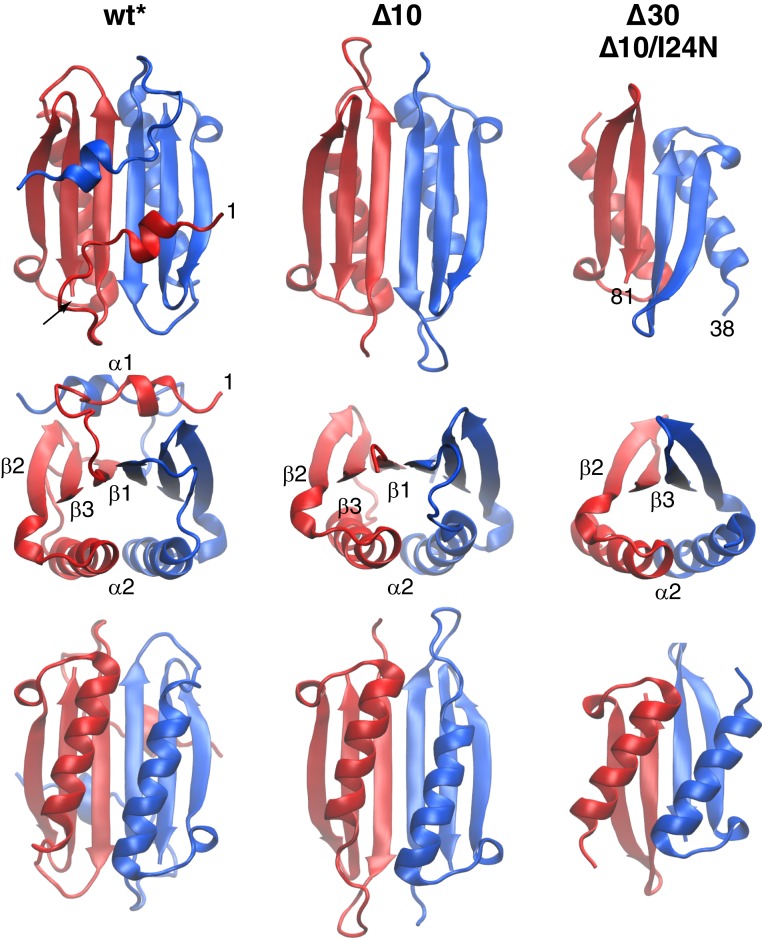
Five constructs of ngMinE were investigated by NMR spectroscopy: wt* representing the resting state I; a 10-residue N-terminal deletion mutant, Δ10, representing state II; and I24N, Δ10/I24N, and Δ30 ngMinE representing state III. The TALOS-N–predicted secondary structures derived from the backbone (15N, 13Cα, 13Cβ, 13C′, and 1HN) chemical shifts are shown in Fig. 2. The wt* construct comprises 2 α-helices (residues 3 to 8 and 40 to 54) and 3 β-strands (residues 21 to 30, 63 to 69, and 71 to 79). The secondary structure of the Δ10 construct is identical to that of wt* with the exception that helix α1 is no longer present (Fig. 2). I24N, Δ10/I24N, and Δ30 all have the same secondary structure with a single helix and 2 β-strands that correspond to α2, β2, and β3 of wt* (Fig. 2). The 3-dimensional (3D) folds of the wt*, Δ10, Δ10/I24N, and Δ30 dimers were modeled using the program CS-ROSETTA based on the backbone chemical shifts, supplemented by residual dipolar coupling (RDC) data (22, 23) (see SI Appendix for details). CS-ROSETTA makes use of an empirically optimized procedure to select protein fragments from the Protein Data Bank on the basis of sequence and backbone chemical shifts, followed by ROSETTA Monte Carlo assembly, driven in part by the RDC data, to search for compact low-energy folds that are then subject to minimization with an all-atom force field to obtain low-energy models with complementary side-chain packing. The results are shown in Fig. 3. Good structural convergence was obtained with excellent agreement between observed and calculated RDCs (SI Appendix, Fig. S2).
Fig. 2.
TALOS secondary structure index derived from backbone 15N, 13C, and 1H chemical shifts for the various ngMinE constructs (wt*, Δ10, I24N, Δ10/I24N, and Δ30) used in the current study. Stretches of positive and negative TALOS secondary structures indices are indicative of β-sheet and α-helix, respectively. ht, helical turn.
Fig. 3.
Ribbon diagrams showing different views of the CS-ROSETTA structures of wt*, Δ10, and Δ30 (Δ10/I24N) ngMinE derived from backbone chemical shifts and 1DNH RDCs. (Note the structures of Δ30 and Δ10/I24N are the same.)
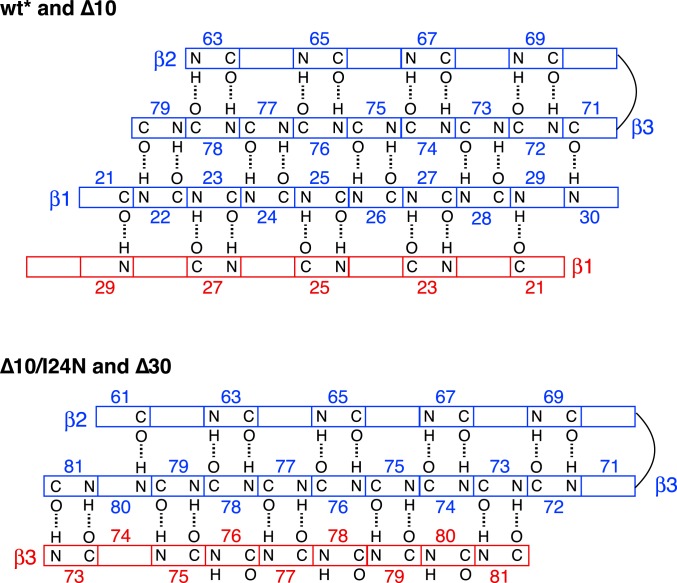
Wt* ngMinE comprises a 6-stranded β-sheet sandwiched between helices α1 and α2 (Fig. 3, Left). This structure, which is in complete agreement with the previously determined solution NMR structure of the E46A mutant of full-length ngMinE (9), is preserved in the Δ10 construct except that the α1 helix is no longer present (Fig. 3, Middle). The β1 strand is located at the dimer interface, and the β-sheet topology, derived from the CS-ROSETTA structures, is shown in Fig. 4, Top. The structure of the Δ10 construct represents the conformation of the cytoplasmic component of MinE in which helix α1 is no longer packed against the β-sheet but ready to bind to the cell membrane.
Fig. 4.
β-sheet topology of wt* and Δ10 (Top), and Δ10/I24N and Δ30 (Bottom) ngMinE constructs derived from the CS-ROSETTA structures. The complete sheet for one subunit is shown in blue, and only the strand of the second subunit located at the dimer interface is shown in red. The registers of the β-sheets, including those at the dimer interface, for both the 6-stranded (wt* and Δ10) and 4-stranded (Δ10/I24N and Δ30) forms of ngMinE, are fully consistent with the corresponding previously published structures [NMR structure of full-length ngMinE, 2KXO (9); NMR structure of Δ30-ecMinE, 1EVO (14); 4.3-Å resolution X-ray structure of I24N ecMinE complexed to MinD, 3R9J (10); these structures were not present in the high-resolution 3D protein coordinate database used in the CS-ROSETTA calculations].
The Δ10/I24N and Δ30 constructs share the same structure comprising a 4-stranded β-sheet, with strand β3 at the dimer interface (Fig. 4, Bottom), onto which are packed the 2 α2 helices, one from each subunit (Fig. 3, Right). The residues N-terminal to helix α2, which in the case of Δ10/I24N include the residues that form strand β1 in wt* and Δ10, are intrinsically disordered as judged by both secondary chemical shifts (Fig. 2) and 15N transverse relaxation rates (SI Appendix, Fig. S1). The structures of Δ10/I24N and Δ30 are in agreement with that of a 30-residue N-terminal truncation of E. coli MinE previously determined by NMR (14), except that a small 5-residue N-terminal helix preceding the equivalent of helix α2 is absent in ngMinE. In the complex of ecMinE with ecMinD, the 4-stranded β-sheet form of MinE constitutes the active conformation that binds to MinD via the disordered N-terminal residues that adopt a helical conformation upon complex formation (10).
Conformational Dynamics of ngMinE.
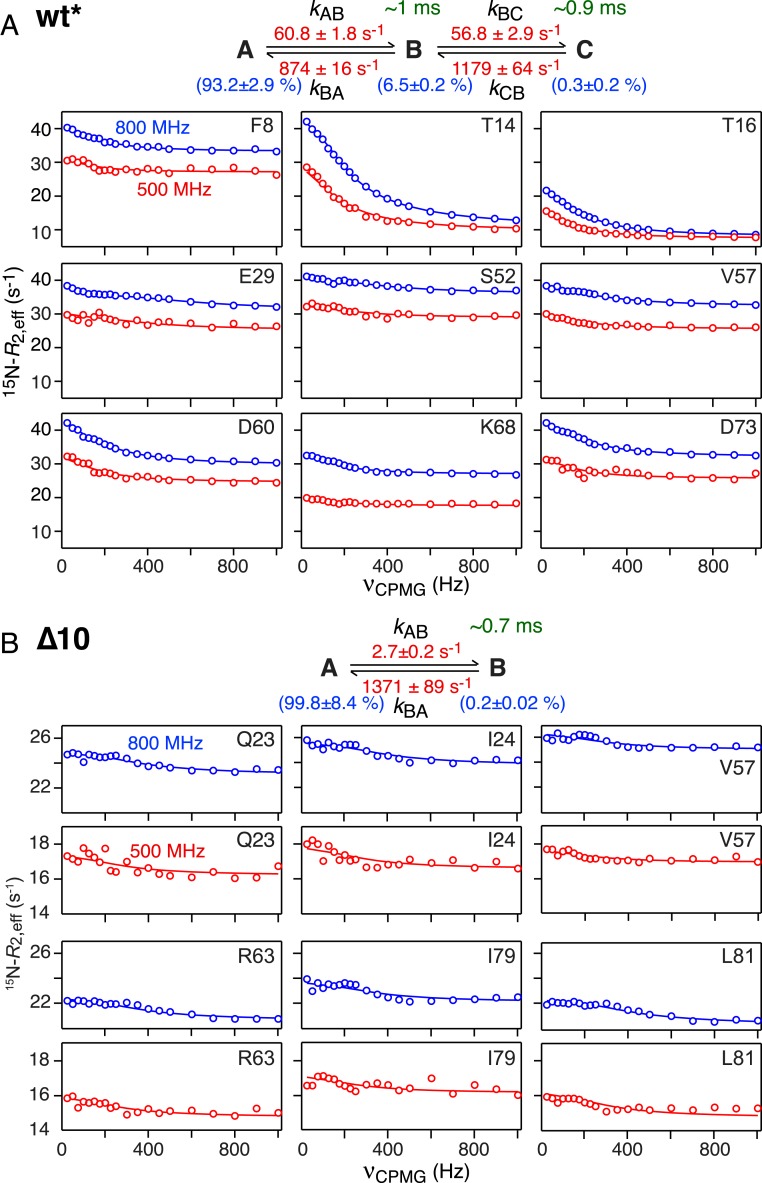
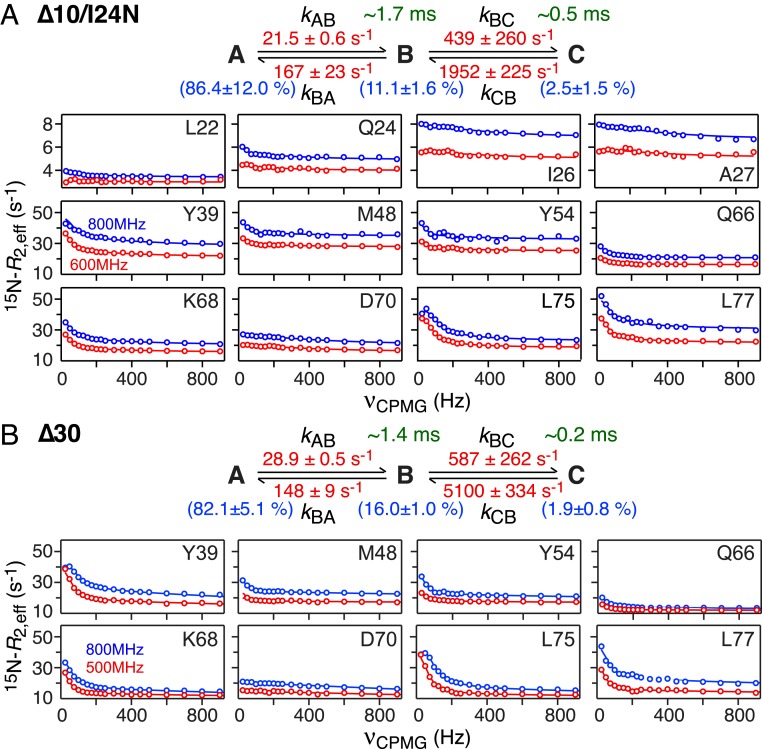
Conformational exchange dynamics for wt*, Δ10, Δ10/24N, and Δ30 mgMinE constructs were studied by 15N CPMG relaxation dispersion, which probes exchange between major and sparsely populated species differing in their 15N backbone chemical shifts (15–17). Significant 15N CPMG relaxation dispersions were observed in all 4 cases, indicative of conformational exchange that is intermediate on the chemical shift time scale (Figs. 5 and 6). The 15N CPMG relaxation dispersion curves were concentration-independent over a range of 0.5 to 2 mM for the Δ10 construct and 1 to 2 mM for the Δ30 construct (SI Appendix, Fig. S3). Further, analytical ultracentrifugation data on full-length ngMinE (E46A) (9), as well as on the Δ10 and Δ30 constructs (SI Appendix, Fig. S4), indicate that the constructs exist as stable dimers with no evidence for the presence of a monomeric species at concentrations as low as 4 to 5 μM. These data further support that the exchange processes observed by 15N CPMG relaxation dispersion do not involve interconversion between a major dimeric form and a minor population of monomer but rather the interconversion between different conformations of the dimer.
Fig. 5.
Nitrogen-15 CPMG relaxation dispersion measurements on wt* and Δ10 ngMinE constructs. (A) wt* and (B) Δ10. Representative experimental data (recorded at 25 °C) are shown as circles (blue, 800 MHz; red, 500 MHz) and the best-fit curves to a 3-state linear scheme for wt* and a 2-state scheme for Δ10 are shown as continuous lines. The rate constants (in red), species populations (in blue), and lifetimes of the excited states (in green) are also indicated.
Fig. 6.
Nitrogen-15 CPMG relaxation dispersion measurements on Δ10/I24N and Δ30 MinE constructs. (A) Δ10/I24N and (B) Δ30. Representative experimental data (recorded at 25 °C) are shown as circles and the best-fit curves to a 3-state linear scheme are shown as continuous lines. The rate constants (in red), species populations (in blue), and lifetimes of the excited states (in green) are also indicated.
Analysis of the 15N CPMG relaxation dispersion data was performed by simultaneously fitting the data for 62, 47, 48, and 39 residues of wt*, Δ10, Δ10/I24N, and Δ30 ngMinE, respectively, to the appropriate McConnell equations (24), optimizing global rate constants for a given kinetic model together with residue-specific chemical shift differences between the states (Δω) and residue specific R2 transverse relaxation rates (assumed to be the same for major and minor species). Residues were excluded where there was either cross-peak overlap or little to no relaxation dispersion. In addition, the relaxation dispersion data for residues 60, 71, and 74 of the Δ30 and Δ10/I24N constructs were excluded as these residues exhibit unusually large 15N R2,eff values relative to adjacent residues at a 1-kHz CPMG field (SI Appendix, Fig. S1), suggesting that they are involved in a faster exchange process such that chemical shift exchange line broadening is not fully suppressed (see also SI Appendix, Fig. S5).
While the data for the Δ10 construct could be well fit to a simple 2-state exchange, the minimal kinetic models required to account for the wt*, Δ10/I24N, and Δ30 data comprised linear 3-state exchange systems. (Note that fits to a 3-state branched exchange scheme in which the major species interconverts directly with 2 minor species are significantly worse for the wt* and Δ30 data both in terms of goodness of fit and the presence of systematic errors in the fits, and slightly worse for the Δ10/I24N data, as shown in SI Appendix, Figs. S6–S8, respectively. Further, application of Occam’s razor would lead one to expect the same exchange model for the Δ30 and Δ10/I24N constructs.) Examples of 15N CPMG relaxation dispersion data together with the best-fit curves and associated kinetic models, rate constants, and species populations are shown in Fig. 5 (wt* and Δ10) and Fig. 6 (Δ10/I24N and Δ30).
In the case of the 3-state exchange models, the self-consistency of the residue-specific Δω values was improved by fitting the data simultaneously to a 2-member, 3-state exchange system where the 2 members share the kinetic rate constants and residue-specific R2 rates, but in one member the A major state is chosen as the chemical shift reference (i.e., ωA = 0) while in the second the B minor state is used as the chemical shift reference (i.e., ωB = 0); the residue-specific ΔωAB values are optimized and shared between the 2 members, the residue-specific ΔωBC values are optimized for the second member only, and the residue-specific ΔωAC values for the first member are given by ΔωAB + ΔωBC. This procedure also ensures that the relative sign information of the Δω values is preserved.
In the case of the Δ30 and Δ10/I24N constructs, the exchange rate (kex = kAB + kBA) for the A ↔ B transition is sufficiently slow (180 to 190 s−1; see Fig. 6) to also be observed by chemical exchange saturation transfer (CEST) spectroscopy (25). Examples of CEST profiles for the Δ30 construct are shown in SI Appendix, Fig. S9 and are fully consistent with the ΔωAB values obtained from the fits to the CPMG relaxation dispersion data.
Exchange Processes Observed for wt* and Δ10 ngMinE.
The exchange processes involving wt* and Δ10 are in the millisecond regime with values of ∼0.7 and ∼0.5 ms for the A ↔ B and B ↔ C transitions in wt* and ∼0.5 ms for the A ↔ B transition in the Δ10 construct (where A is the major, spectroscopically observable species). The lifetimes of the B and C excited states of wt* are ∼1 and ∼0.9 ms, respectively, while that of B state of the Δ10 construct is ∼0.7 ms. The populations of the C state of wt* and the B state of Δ10 are comparable with a value of 0.2 to 0.3%, while that of the intermediate B state of wt* is about 20-fold higher (∼6.5%).
The differences in 15N chemical shifts between the states provide insight into the nature of the associated conformational transitions. The main determinants of secondary 15N shifts are the ψi-1 and ϕi backbone torsion angles of residues i-1 and i, respectively; hence, large 15N shifts would be expected in many instances where the conformation of a segment of polypeptide chain shifts from a well-defined ordered structure (such as a helix or sheet) to a random coil (26). Smaller secondary 15N shifts are associated with the rotameric states of residues i-1 and i, as well as hydrogen bonding of the HN proton of residue i (26). While 13Cα secondary shifts provide easily interpretable information on backbone secondary structure (26), unfortunately 13Cα CPMG measurements on selectively 13Cα-labeled ngMinE constructs proved not to be feasible owing to large linewidths and poor signal-to-noise ratio.
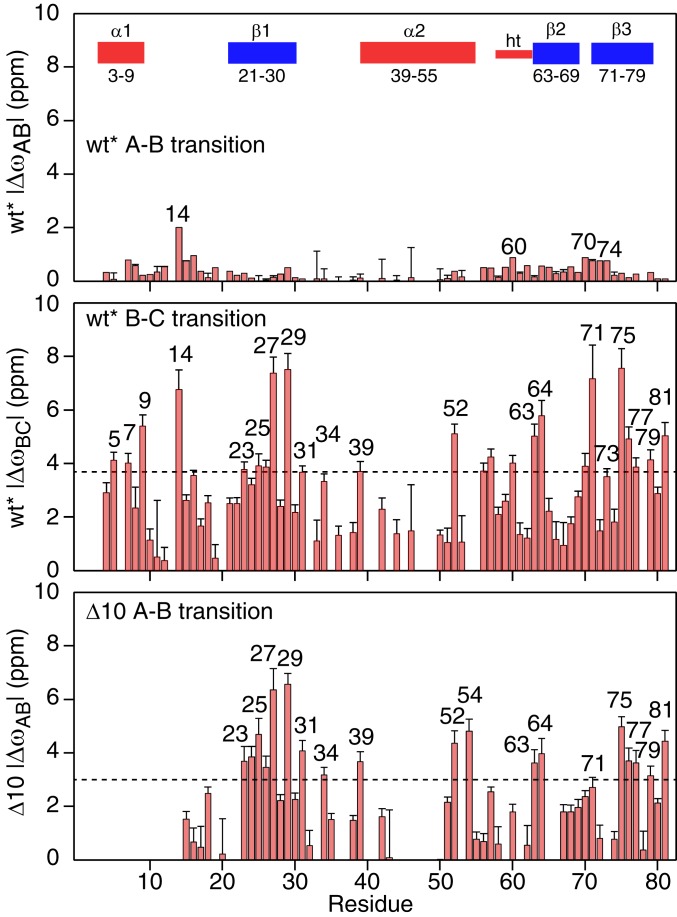
Plots of the ΔωAB and ΔωBC values for wt* and ΔωAB values for Δ10 as a function of residue are shown in Fig. 7. It is immediately apparent that the ΔωAB values for wt* (Fig. 7, Top) are much smaller than the ΔωBC and ΔωAB values for wt* and Δ10, respectively, which are clearly correlated with one another (Fig. 7, Middle and Bottom and Fig. 8C). One can therefore conclude that the conformational changes in the main body of the protein (i.e., excluding helix α1, which is absent in Δ10) associated with the B ↔ C and A ↔ B transitions in wt* and Δ10, respectively, are similar. It is also worth noting that the good correlation between the wt* ΔωBC values and the Δ10 ΔωAB values provides further support for the 3-state linear exchange model for wt*.
Fig. 7.
Profile of 15N chemical shift differences between the exchanging species in wt* and Δ10 ngMinE constructs derived from the fits to the 15N CPMG relaxation dispersion data.
Fig. 8.
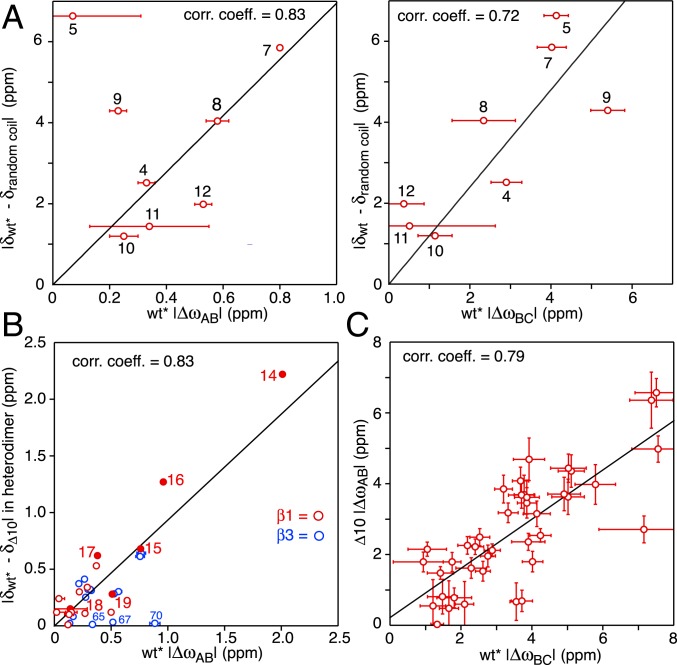
Nitrogen-15 chemical shift difference correlations involving wt* and Δ10 ngMinE constructs. (A) Correlation of the 15N chemical shift differences for residues 5 to 12 (encompassing helix α1 in the wt* construct) between folded and random coil wt* and between the A (ground) and B (excited) states (Left) and between the B and C excited states (Right) of wt*. The random coil shifts for residues 5 to 12 were calculated from the sequence using the algorithm of ref. 40. (B) Correlation of the 15N chemical shift differences for the loop preceding strand β1 (residues 14 to 19; solid red circles), strand β1 (open red circles), and strand β3 (open blue circles) between wt* and Δ10 in the wt*/Δ10 heterodimer and between the A (ground) and B (excited) states of wt*. (C) Correlation of the 15N chemical shift differences between the A (ground) and B (excited) states of Δ10 and the B and C excited states of wt*.
A comparison of the difference between folded and predicted random coil 15N chemical shifts for the N-terminal 12 residues of wt*, which includes helix α1 (residues 3 to 9), with the corresponding ΔωAB and ΔωBC values for wt* show reasonable correlations but with very different slopes of ∼6 and ∼1.1, respectively (Fig. 8A). This suggests that helix α1 exhibits slightly reduced helicity in state B but is effectively disordered in state C. Thus, the unstructured N-terminal residues in state C can act as a fly-cast (27, 28) to attach wt* ngMinE to the cell membrane.
When heterodimers of wt* and Δ10 were made by mixing 15N-labeled wt* with a large excess of unlabeled Δ10, and vice versa, the difference in 15N chemical shifts between the 2 subunits in the heterodimer for the loop (residues 14 to 19) preceding strand β1 is correlated with the corresponding ΔωAB values for wt*; weaker correlations are also observed for residues of strands β2 and β3, although the differences in 15N chemical shifts are much smaller (Fig. 8B). These data suggest that the B state of wt* is similar to the wt*/Δ10 heterodimer, and that the reduced helicity of helix α1 in state B, noted above, is possibly due to an exchange phenomenon in which only a single α1 helix at a time is detached from the underlying β-sheet within the lifetime of state B (∼1 ms). This interpretation is also supported by the observation that the large dispersions for the loop residues 14 to 16 in the wt* homodimer are significantly reduced in the 15N-labeled wt* chain of the wt*/Δ10 heterodimer (SI Appendix, Fig. S10). Thus, in state B, the probability of 2 α1 helices being detached from the β-sheet surface simultaneously is likely very low, and the slope of ∼6 for the 15N chemical shift correlation shown in Fig. 8 A, Left would correspond to a ∼30% reduction in the helicity of a single α1 helix. The latter implies that even when a single α1 helix no longer makes contact with the underlying β sheet in state Β, residues 5 to 9 retain significant helicity and do not locally unfold to a random coil within a ∼1-ms time frame.
Further support that state B of wt* is similar to the wt*/Δ10 heterodimer comes from 15N CPMG relaxation dispersion data recorded on the heterodimer with either wt* or Δ10 15N-labeled, and the unlabeled component present at 10-fold excess to ensure the absence of any significant amount of homodimeric 15N-labeled species. Although quantitative analysis of the heterodimer 15N CPMG relaxation data were precluded owing to low signal-to-noise ratio as the 15N-labeled component is only present at low concentration, the data are sufficient to draw some qualitative inferences. The 15N CPMG dispersion curves for Δ10 in the context of the homodimer and heterodimer are comparable, suggesting that the Δ10 chain undergoes a similar 2-state exchange process in both environments. In contrast, residues 14 to 16, located in the loop connecting helix α1 to strand β1, show large dispersions in the homodimer that are effectively quenched in the heterodimer (SI Appendix, Fig. S10), consistent with only a single α1 helix at a time losing contact with the main body of the protein in state B of the wt* homodimer.
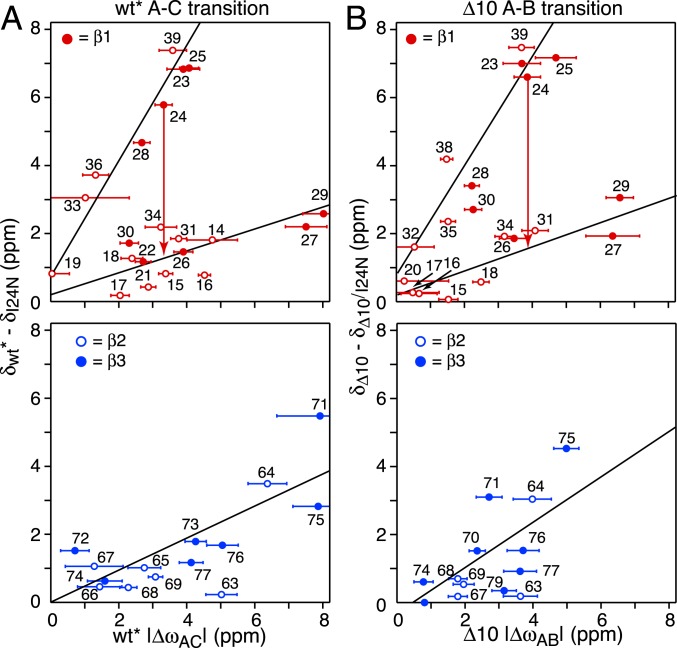
The next question is what is the nature of states C and B of wt* and Δ10, respectively. The correlation plots of the chemical shift differences between 6-stranded (wt* or Δ10) and 4-stranded (I24N and Δ10/I24N) constructs versus ΔωAC for wt* and ΔωAB for Δ10 shown in Fig. 9 provide some clues. The top panels depict the correlations for strand β1 (residues 21 to 30) and the preceding (residues 15 to 20) and following (residues 31 to 39) loop residues. Two linear correlations are apparent: one with a slope of ∼0.3 which includes the backbone nitrogens of residues 29 and 27 and those of residues 24, 26, and 30 that participate in intersubunit β1–β1 and intrasubunit β1–β3 hydrogen bonds, respectively (Fig. 4, Top); and the second with a slope of ∼1.8 which includes the backbone nitrogens of residues 23 and 25 and those of residue 28 that participate in intersubunit β1–β1 and intrasubunit β1–β3 hydrogen bonds, respectively (Fig. 4, Top). These data suggest that state C of wt* and state B of the Δ10 construct may represent an intermediate form that is well along the pathway toward the 4-stranded conformation of MinE. This conclusion is supported by the correlations observed for strands β2 and β3 shown in Fig. 9, Bottom.
Fig. 9.
Correlation of 15N chemical shift changes (Δω) between major (ground) and sparsely populated (excited) states for wt* and Δ10 determined from 15N CPMG relaxation dispersion and the 15N chemical shift differences between 6-stranded and 4-stranded ground states of ngMinE. (A) Correlation between ΔωAC values for the wt* A–C transition and the 15N chemical shift differences between wt* (6-stranded) and I24N (4-stranded) constructs. (B) Correlation between ΔωAB values for the Δ10 A–B transition and the 15N chemical shift differences between wt* (6-stranded) and Δ10/I24N (4-stranded) constructs. (Top) The correlations for strand β1 (solid circles) as well as residues in loops preceding and following strand β1 (open circles); the arrow for residue 24 serves to indicate the chemical shift difference between wt* and predicted random coil values since this residue is mutated from Ile to Asn in the 4-stranded constructs. (Bottom) The correlations for strands β2 (open circles) and β3 (solid circles). The lines serve purely to guide the eye.
Given the 15N chemical shift considerations (Fig. 8C) that indicate that the conformations of the C state of wt* and the B state of Δ10 are very similar, it might appear curious that the wt* kBC rate constant is ∼20-fold larger than the Δ10 kAB rate constant. However, the forward and backward rate constants for the overall wt* A to C interconversion, given by kAB.kBC(kBA + kBC) ∼ 4 s−1 and kCB.kBA/(kBA + kBC) ∼ 1,100 s−1, respectively, are comparable to the forward (kAB ∼ 3 s−1) and backward (kBA ∼ 1,400 s−1) rate constants for the Δ10 A ↔ B interconversion.
Exchange Processes Observed for Δ10/I24N and Δ30 ngMinE.
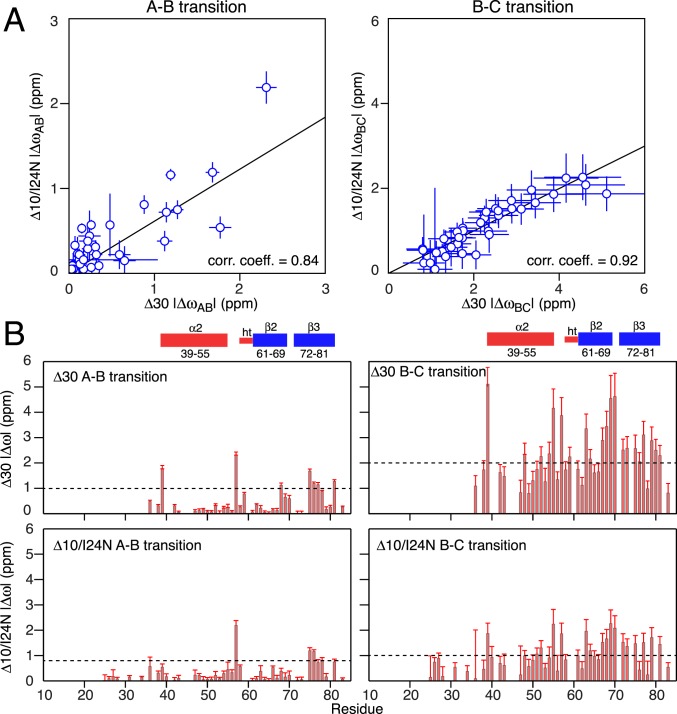
Both 4-stranded MinE constructs exhibit similar exchange dynamics (Fig. 6). The intermediate B state has an occupancy of 11 to 16% with a lifetime of ∼1.4 to 1.7 ms. The C state has an occupancy of 2 to 2.5%.The lifetime of the C state for Δ10/I24N (∼0.5 ms) is about 2.5 times longer than that for Δ30 (∼0.2 ms), suggesting the existence of transient interactions between the globular portion of the 2 constructs (comprising helix α2 and strands β2 and β3) and the intrinsically disordered segment of polypeptide chain preceding helix α2 that are more pronounced in the case of the Δ10/I24N construct on account of the longer length of the disordered segment (residues 11 to 38 versus 31 to 38). The ΔωAB values for the 2 constructs, and likewise the ΔωBC values for the 2 constructs, are correlated (Fig. 10A), indicating that the conformations of the B and C states are probably of a similar nature in the 2 constructs. However, the slopes of the correlations are significantly less than unity, with the ΔωAB and ΔωBC values for the Δ30 construct on average ∼1.7- and ∼2-fold larger, respectively, than for the Δ10/I24N construct. This might suggest that the B and C excited states comprise an ensemble of conformations whose distribution is different in the Δ30 and Δ10/I24N constructs as a consequence of transient stabilizing interactions between the long disordered N terminus of the Δ10/I24N construct and the folded core of the protein. These chemical shift correlation data also indicate that whatever the conformations adopted by the B and C minor states, they do not represent the 6-stranded conformation of the wt* and Δ10 ngMinE constructs, since the residues comprising strand β1 in wt* and Δ10 are deleted in the Δ30 construct.
Fig. 10.
Nitrogen-15 chemical shift differences between species for Δ10/I24N and Δ30 MinE constructs. (A) Correlation of chemical shift differences observed for the Δ30 and I24N/Δ10 constructs between species A (ground state) and the excited state B (Left) and between the excited state species B and C (Right). (B) Profile of 15N chemical shift differences between the exchanging species in Δ30 (Top) and Δ10/I24N (Bottom) derived from the fits to the 15N CPMG relaxation dispersion data. (Left) Difference between the major ground state species A and the minor excited state species B. (Right) Difference between the minor excited state species B and C.
The A–B transition is accompanied by relatively small (1 to 2.5 ppm) 15N shifts (Fig. 10 B, Right) involving the N-terminal residue of helix α2 (residue 39), residue 57 in the loop connecting strand β2 to the helical turn, residue 68 in strand β2, and residues 75 to 77 and 81 of strand β3. It is tempting to suggest that these may reflect partial fraying along the C-terminal half of strand β3 and at the N terminus of helix α2 (such that the helix starts at residue 40 in state B); residue 57 is in close spatial proximity to strand β3, as is residue 68 to the N terminus of helix α2 (Fig. 3, Right).
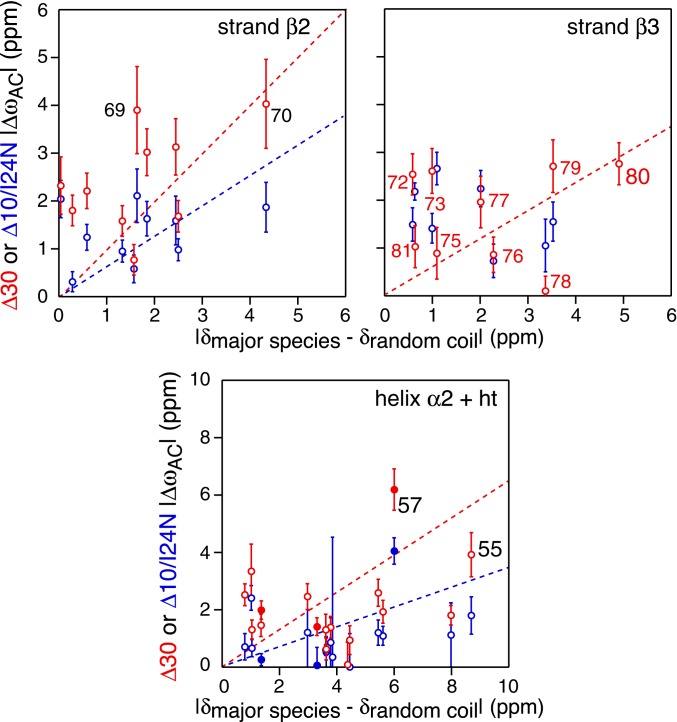
Larger 15N shifts overall are observed for the B–C transition (Fig. 10 B, Right). For the Δ30 construct (Fig. 10 B, Top Right), ΔωBC values in the 2- to 5-ppm range are seen within helix α2 (residues 39, 48, 52, 54, and 55), strand β2 (residues 63, 64, and 67 to 69), the β2–β3 turn (residue 70), and strand β3 (residues 72, 73, 75 to 77, and 79 to 81). Residues 69 and 72 are hydrogen-bonded to one another, and residues 73, 75, 77, 79, and 81 participate in hydrogen bonds at the β3–β3′ dimer interface (Fig. 4, Bottom). These data are suggestive of significant conformational transitions involving helix α2 and strands β2 and β3. This is supported by the correlations (albeit relatively weak with a slope significantly less than unity) observed for both the Δ30 and Δ10/I24N constructs between the ΔωAC values of residues in helix α2 and strands β2 and β3 and the difference in chemical shifts between the major folded A species and the predicted random coil shifts (Fig. 11).
Fig. 11.
Correlation of 15N chemical shift differences between the ground state A and the excited state C for the Δ10/I24N and Δ30 constructs determined from 15N CPMG relaxation dispersion, and the differences in chemical shifts between folded and random coil states. The correlations for Δ30 and Δ10/I24N are shown in red and blue, respectively. (Top) β2-strand including the first residue (Asp70) of the β2–β3 turn. (Middle) β3 strand. (Bottom) α2-helix, helical turn, and loop connecting them. The correlations for the helical turn (ht) and the short loop connecting the helix to the helical turn are shown as solid circles. The dashed lines serve to guide the eye. The random coil shifts were calculated from the sequence using the algorithm of ref. 40.
Concluding Remarks.
Here we have investigated the conformational exchange dynamics exhibited by 3 functionally and structurally distinct ground states of ngMinE: the resting state exemplified by the wt* 6-stranded β-sheet conformation sandwiched by 2 pairs of α-helices; the precursor state for membrane anchoring in which the N-terminal helix no longer lies on the 6-stranded β-sheet but is ready to be anchored to the membrane, mimicked by the Δ10 truncation mutant in which the N-terminal α-helix is deleted; and the MinD binding competent state in which the internal β1 strands at the dimer interface of the resting and membrane-binding precursor configurations are extruded to be ready to interact with MinD, leaving a 4-stranded β-sheet form represented by the Δ10/I24N and Δ30 constructs (as well as the I24N construct). Such large conformational transitions imply the presence of extensive conformational dynamics involving minor, “excited” states for each of these forms of the MinE protein. The 15N CPMG relaxation dispersion experiments reveal the presence of conformational exchange on the submillisecond to millisecond time scales: wt*, Δ10/I24N, and Δ30 constructs exhibit 3-state linear transitions (A ↔ B ↔ C) between the major A species and 2 minor species B and C, while the Δ10 construct displays 2-state transition (A ↔ B) between the major A and minor B species (Figs. 5 and 6).
A comparison of the 15N chemical shift changes accompanying these transitions, obtained from the fits to the 15N CPMG relaxation dispersion data, with differences in the experimental 15N chemical shifts between the various constructs, as well as between the constructs and calculated random coil shifts (Figs. 7–11), are suggestive of the following processes summarized below.
The A ↔ B transition in wt* involves the interconversion of the resting state to a state that is similar to that of a wt*/Δ10 heterodimer and in which the N-terminal α-helix of one subunit no longer contacts the underlying β sheet and hence exhibits reduced helicity (presumably due to rapid interconversion between helical and intrinsically disordered conformations). The B ↔ C wt* transition involves complete disordering of the N-terminal helix of both subunits, in conjunction with a conformational transition involving the β-sheet that is similar to that accompanying the A ↔ B transition in the Δ10 construct. The 15N chemical shift differences between the A and C states of wt* and between the A and B states of the Δ10 construct reveal correlations with the 15N chemical shift differences between the 6-stranded (wt* and Δ10) and 4-stranded (I24N and Δ10/I24N, respectively) forms of ngMinE, suggesting that both the wt* and Δ10 constructs perhaps sample a state close to the major ground state of the I24N and Δ10/I24N constructs with the N-terminal parts of the protein disordered.
The sparsely populated states sampled by the two 4-stranded constructs (Δ10/I24N and Δ30) are similar. In each instance the excited species appear to comprise an ensemble of conformations whose distribution is different in the Δ30 and Δ10/I24N constructs, presumably as a result of stabilizing, transient interactions involving the long, disordered N-terminal segment of Δ10/I24N. The A ↔ B transition may involve partial destabilization of the β3-β3′ sheet at the dimer interface. The B ↔ C transition is more extensive, suggesting further disruption and/or destabilization of the β3–β3′ interface and a portion of the β2–β3 sheet formed by the N-terminal end of the latter and the C-terminal end of the former, as well as a transient reduction in helicity of helix α2. Thus, the C state of the 4-stranded forms of ngMinE may represent an ensemble of states along the restoration pathway from the 4-stranded to 6-stranded conformations. The wt* and Δ10 constructs presumably also visit similar states corresponding to the minor states detected for Δ10/I24N and Δ30 constructs but are not expected to be sufficiently populated to be experimentally detectable as separate states.
The major conformational ground states studied here correspond well to those described in previous crystallographic and NMR structural studies and are expected to play important roles at different steps of MinD/MinE pattern self-organization (9, 10, 14). Here we showed that full-length wt* ngMinE visits transient exited states that are close to the major states of N-terminal deletion constructs, and we successfully measured the equilibrium and transition rate parameters between the different states. We also detected additional excited states that perhaps lie along the reverse path from 4-stranded to 6-stranded core states. The finding that excited states along the fold-switching energy landscape are sampled by the major species is reminiscent of the situation with dihydrofolate reductase where intermediates in the catalytic cycle sample conformations that are close to the ground states of the preceding and following intermediates (29).
The conformational transitions observed for ngMinE take place on time scales that are 5 to 6 orders of magnitude faster (Figs. 5 and 6) than the time scale of ngMinD/ngMinE self-organized oscillation on the lipid bilayer (Fig. 1), indicating that the interconversions between ground and excited states per se are not rate-limiting. Nevertheless, the information obtained here on the occupancies and residence time scales of these excited states is invaluable for an understanding of MinE–membrane–MinD interaction dynamics during the oscillatory pattern self-organization cycle, considering that these sparsely populated species represent intermediates for these multicomponent interaction processes. Further, the large separation of time scales between the lifetimes of the excited states and the period of the oscillatory waves allows for many cycles of conformational rearrangement and fold switching to occur until optimal configurations are obtained for interaction with the appropriate partner. Thus, the rapid excursion between ground and excited states can be thought of as a bath coupled to binding reactions with interaction partners, in a manner analogous to that found for the multisubstrate enzyme adenylate kinase where rapid exchange between closed and open states eventually leads to a conformation that permits a chemical reaction (phosphoryl transfer) to occur between 2 substrates (30). Critical questions, however, remain to be addressed concerning the impact of MinE interaction partners, specifically the membrane and MinD, on the conformational dynamics, which are left to be addressed in a future study.
Experiment
Details of protein expression and purification, isotope labeling, NMR experimental details, quantitative analysis of 15N CPMG relaxation dispersion data, structural modeling with CS-ROSETTA, and MinE/MinD spatial patterning experiments on supported lipid bilayers monitored by total internal reflection fluorescence microscopy are provided in SI Appendix. The complete set of CPMG relaxation dispersion data is provided in SI Appendix, Figs. S11–S14, and the optimized values of the residue-specific parameters (R2,eff values at 2 spectrometer frequencies and Δω values) are listed in SI Appendix, Tables S1–S4.
Atomic coordinates, backbone chemical shift assignments and experimental restraints have been deposited in the Protein Data Bank (http://www.wwpdb.org/) and Biological Magnetic Resonance Data Bank (http://www.bmrb.wisc.edu/). The PDB/BMRB codes are as follows: wt* ngMinE, 6U6P (31)/30661 (32); Δ10 ngMinE, 6U6Q (33)/30662 (34); Δ30 ngMinE, 6U6R (35)/30663 (36); Δ10/I24N ngMinE, 6U6S (37)/30664 (38). The BMRB code for the backbone chemical shifts of I24N is 50008 (39).
Supplementary Material
Acknowledgments
We thank Drs. Sam Kotler and Vitali Tugarinov for useful discussions and Drs. Dusty Baber, Dan Garrett, and Jinfa Ying for technical support. This work was supported by the Intramural Program of the National Institute of Diabetes and Digestive and Kidney Diseases, National Institutes of Health (to G.M.C. and K.M.).
Footnotes
The authors declare no competing interest.
Data deposition: Atomic coordinates, backbone chemical shift assignments, and experimental restraints have been deposited in the Protein Data Bank (http://www.wwpdb.org/) and Biological Magnetic Resonance Data Bank (http://www.bmrb.wisc.edu/). The PDB/BMRB ID codes are as follows: wt* ngMinE, 6U6P/30661; Δ10 ngMinE, 6U6Q/30662; Δ30 ngMinE, 6U6R/30663; and Δ10/I24N ngMinE, 6U6S/30664. The BMRB code for the backbone chemical shifts of I24N is 50008.
This article contains supporting information online at https://www.pnas.org/lookup/suppl/doi:10.1073/pnas.1915948116/-/DCSupplemental.
References
- 1.Haeusser D. P., Margolin W., Splitsville: Structural and functional insights into the dynamic bacterial Z ring. Nat. Rev. Microbiol. 14, 305–319 (2016). [DOI] [PMC free article] [PubMed] [Google Scholar]
- 2.Du S., Lutkenhaus J., At the heart of bacterial cytokinesis: The Z ring. Trends Microbiol. 27, 781–791 (2019). [DOI] [PMC free article] [PubMed] [Google Scholar]
- 3.Rothfield L., Taghbalout A., Shih Y. L., Spatial control of bacterial division-site placement. Nat. Rev. Microbiol. 3, 959–968 (2005). [DOI] [PubMed] [Google Scholar]
- 4.Monahan L. G., Liew A. T., Bottomley A. L., Harry E. J., Division site positioning in bacteria: One size does not fit all. Front. Microbiol. 5, 19 (2014). [DOI] [PMC free article] [PubMed] [Google Scholar]
- 5.Rowlett V. W., Margolin W., The Min system and other nucleoid-independent regulators of Z ring positioning. Front. Microbiol. 6, 478 (2015). [DOI] [PMC free article] [PubMed] [Google Scholar]
- 6.Lutkenhaus J., Assembly dynamics of the bacterial MinCDE system and spatial regulation of the Z ring. Annu. Rev. Biochem. 76, 539–562 (2007). [DOI] [PubMed] [Google Scholar]
- 7.Vecchiarelli A. G., et al. , Membrane-bound MinDE complex acts as a toggle switch that drives Min oscillation coupled to cytoplasmic depletion of MinD. Proc. Natl. Acad. Sci. U.S.A. 113, E1479–E1488 (2016). [DOI] [PMC free article] [PubMed] [Google Scholar]
- 8.Ma L. Y., King G., Rothfield L., Mapping the MinE site involved in interaction with the MinD division site selection protein of Escherichia coli. J. Bacteriol. 185, 4948–4955 (2003). [DOI] [PMC free article] [PubMed] [Google Scholar]
- 9.Ghasriani H., et al. , Appropriation of the MinD protein-interaction motif by the dimeric interface of the bacterial cell division regulator MinE. Proc. Natl. Acad. Sci. U.S.A. 107, 18416–18421 (2010). [DOI] [PMC free article] [PubMed] [Google Scholar]
- 10.Park K. T., et al. , The Min oscillator uses MinD-dependent conformational changes in MinE to spatially regulate cytokinesis. Cell 146, 396–407 (2011). [DOI] [PMC free article] [PubMed] [Google Scholar]
- 11.Park K. T., Villar M. T., Artigues A., Lutkenhaus J., MinE conformational dynamics regulate membrane binding, MinD interaction, and Min oscillation. Proc. Natl. Acad. Sci. U.S.A. 114, 7497–7504 (2017). [DOI] [PMC free article] [PubMed] [Google Scholar]
- 12.Porter L. L., Looger L. L., Extant fold-switching proteins are widespread. Proc. Natl. Acad. Sci. U.S.A. 115, 5968–5973 (2018). [DOI] [PMC free article] [PubMed] [Google Scholar]
- 13.Hsieh C. W., et al. , Direct MinE-membrane interaction contributes to the proper localization of MinDE in E. coli. Mol. Microbiol. 75, 499–512 (2010). [DOI] [PMC free article] [PubMed] [Google Scholar]
- 14.King G. F., et al. , Structural basis for the topological specificity function of MinE. Nat. Struct. Biol. 7, 1013–1017 (2000). [DOI] [PubMed] [Google Scholar]
- 15.Korzhnev D. M., Kay L. E., Probing invisible, low-populated States of protein molecules by relaxation dispersion NMR spectroscopy: An application to protein folding. Acc. Chem. Res. 41, 442–451 (2008). [DOI] [PubMed] [Google Scholar]
- 16.Palmer A. G., 3rd, Chemical exchange in biomacromolecules: Past, present, and future. J. Magn. Reson. 241, 3–17 (2014). [DOI] [PMC free article] [PubMed] [Google Scholar]
- 17.Anthis N. J., Clore G. M., Visualizing transient dark states by NMR spectroscopy. Q. Rev. Biophys. 48, 35–116 (2015). [DOI] [PMC free article] [PubMed] [Google Scholar]
- 18.Vecchiarelli A. G., Li M., Mizuuchi M., Mizuuchi K., Differential affinities of MinD and MinE to anionic phospholipid influence Min patterning dynamics in vitro. Mol. Microbiol. 93, 453–463 (2014). [DOI] [PMC free article] [PubMed] [Google Scholar]
- 19.Ivanov V., Mizuuchi K., Multiple modes of interconverting dynamic pattern formation by bacterial cell division proteins. Proc. Natl. Acad. Sci. U.S.A. 107, 8071–8078 (2010). [DOI] [PMC free article] [PubMed] [Google Scholar]
- 20.Loose M., Kruse K., Schwille P., Protein self-organization: Lessons from the Min system. Annu. Rev. Biophys. 40, 315–336 (2011). [DOI] [PubMed] [Google Scholar]
- 21.Ramirez-Arcos S., Szeto J., Dillon J. A., Margolin W., Conservation of dynamic localization among MinD and MinE orthologues: Oscillation of Neisseria gonorrhoeae proteins in Escherichia coli. Mol. Microbiol. 46, 493–504 (2002). [DOI] [PubMed] [Google Scholar]
- 22.Shen Y., et al. , Consistent blind protein structure generation from NMR chemical shift data. Proc. Natl. Acad. Sci. U.S.A. 105, 4685–4690 (2008). [DOI] [PMC free article] [PubMed] [Google Scholar]
- 23.Das R., et al. , Simultaneous prediction of protein folding and docking at high resolution. Proc. Natl. Acad. Sci. U.S.A. 106, 18978–18983 (2009). [DOI] [PMC free article] [PubMed] [Google Scholar]
- 24.McConnell H. M., Reaction rates by nuclear magnetic resonance. J. Chem. Phys. 28, 430–431 (1958). [Google Scholar]
- 25.Vallurupalli P., Bouvignies G., Kay L. E., Studying “invisible” excited protein states in slow exchange with a major state conformation. J. Am. Chem. Soc. 134, 8148–8161 (2012). [DOI] [PubMed] [Google Scholar]
- 26.Shen Y., Bax A., Protein backbone chemical shifts predicted from searching a database for torsion angle and sequence homology. J. Biomol. NMR 38, 289–302 (2007). [DOI] [PubMed] [Google Scholar]
- 27.Shoemaker B. A., Portman J. J., Wolynes P. G., Speeding molecular recognition by using the folding funnel: The fly-casting mechanism. Proc. Natl. Acad. Sci. U.S.A. 97, 8868–8873 (2000). [DOI] [PMC free article] [PubMed] [Google Scholar]
- 28.Levy Y., Onuchic J. N., Wolynes P. G., Fly-casting in protein-DNA binding: Frustration between protein folding and electrostatics facilitates target recognition. J. Am. Chem. Soc. 129, 738–739 (2007). [DOI] [PubMed] [Google Scholar]
- 29.Boehr D. D., McElheny D., Dyson H. J., Wright P. E., The dynamic energy landscape of dihydrofolate reductase catalysis. Science 313, 1638–1642 (2006). [DOI] [PubMed] [Google Scholar]
- 30.Aviram H. Y., et al. , Direct observation of ultrafast large-scale dynamics of an enzyme under turnover conditions. Proc. Natl. Acad. Sci. U.S.A. 115, 3243–3248 (2018). [DOI] [PMC free article] [PubMed] [Google Scholar]
- 31.Cai M., Shen Y., Clore G. M., Solution NMR structure of the full length latent form of the MinE protein from Neisseria gonorrhoea. Protein Data Bank. https://www.wwpdb.org.structure/6U6P. Deposited 30 August 2019.
- 32.Cai M., Shen Y., Clore G. M., Solution NMR structure of the full length latent form of the MinE protein from Neisseria gonorrhoea. Biological Magnetic Resonance Data Bank. https://www.bmrb.wisc.edu/data_library/summary/index_php?/bmrbid=30661. Deposited 30 August 2019.
- 33.Cai M., Shen Y., Clore G. M., Solution NMR structure of the MTS deleted (Δ10-ngMinE) form of the MinE protein from Neisseria gonorrhoea. Protein Data Bank. https://www.wwpdb.org.structure/6U6P. Deposited 30 August 2019.
- 34.Cai M., Shen Y., Clore G. M., Solution NMR structure of the MTS deleted (Δ10-ngMinE) form of the MinE protein from Neisseria gonorrhoea. Biological Magnetic Resonance Data Bank. https://www.bmrb.wisc.edu/data_library/summary/index_php?/bmrbid=30662. Deposited 30 August 2019.
- 35.Cai M., Shen Y., Clore G. M., Solution NMR structure of the Δ30-ngMinE protein from Neisseria gonorrhoea. Protein Data Bank. https://www.wwpdb.org.structure/6U6R. Deposited 30 August 2019.
- 36.Cai M., Shen Y., Clore G. M., Solution NMR structure of the Δ30-ngMinE protein from Neisseria gonorrhoea. Biological Magnetic Resonance Data Bank. Available at https://www.bmrb.wisc.edu/data_library/summary/index_php?/bmrbid=30663. Deposited 30 August 2019.
- 37.Cai M., Shen Y., Clore G. M., Solution structure of the Δ10/I24N-ngMinE protein from Neisseria gonorrhoea. Protein Data Bank. https://www.wwpdb.org.structure/6U6S. Deposited 30 August 2019.
- 38.Cai M., Shen Y., Clore G. M., Solution structure of the Δ10/I24N-ngMinE protein from Neisseria gonorrhoea. Biological Magnetic Resonance Data Bank. https://www.bmrb.wisc.edu/data_library/summary/index_php?/bmrbid=30664. Deposited 30 August 2019.
- 39.Cai M., Clore G. M., Backbone assignments of the I24N-ngMinE protein from Neisseria gonorrhoea. Biological Magnetic Resonance Data Bank. https://www.bmrb.wisc.edu/data_library/summary/index_php?/bmrbid=50008. Deposited 3 September 2019.
- 40.Kjaergaard M., Poulsen F. M., Sequence correction of random coil chemical shifts: Correlation between neighbor correction factors and changes in the Ramachandran distribution. J. Biomol. NMR 50, 157–165 (2011). [DOI] [PubMed] [Google Scholar]
Associated Data
This section collects any data citations, data availability statements, or supplementary materials included in this article.


