

Abstract
Background
Antimicrobial resistance (AMR) is a major threat to global public health because it makes standard treatments ineffective and contributes to the spread of infections. It is important to understand AMR’s biological mechanisms for the development of new drugs and more rapid and accurate clinical diagnostics. The increasing availability of whole-genome SNP (single nucleotide polymorphism) information, obtained from whole-genome sequence data, along with AMR profiles provides an opportunity to use feature selection in machine learning to find AMR-associated mutations. This work describes the use of a supervised feature selection approach using deep neural networks to detect AMR-associated genetic factors from whole-genome SNP data.
Results
The proposed method, DNP-AAP (deep neural pursuit – average activation potential), was tested on a Neisseria gonorrhoeae dataset with paired whole-genome sequence data and resistance profiles to five commonly used antibiotics including penicillin, tetracycline, azithromycin, ciprofloxacin, and cefixime. The results show that DNP-AAP can effectively identify known AMR-associated genes in N. gonorrhoeae, and also provide a list of candidate genomic features (SNPs) that might lead to the discovery of novel AMR determinants. Logistic regression classifiers were built with the identified SNPs and the prediction AUCs (area under the curve) for penicillin, tetracycline, azithromycin, ciprofloxacin, and cefixime were 0.974, 0.969, 0.949, 0.994, and 0.976, respectively.
Conclusions
DNP-AAP can effectively identify known AMR-associated genes in N. gonorrhoeae. It also provides a list of candidate genes and intergenic regions that might lead to novel AMR factor discovery. More generally, DNP-AAP can be applied to AMR analysis of any bacterial species with genomic variants and phenotype data. It can serve as a useful screening tool for microbiologists to generate genetic candidates for further lab experiments.
Electronic supplementary material
The online version of this article (10.1186/s12859-019-3054-4) contains supplementary material, which is available to authorized users.
Keywords: SNP, Antimicrobial resistance, Feature selection, Deep neural network, Neisseria gonorrhoeae
Background
Antimicrobial resistance (AMR) is a natural feature of microbial ecosystems. In a therapeutic context, AMR is the ability of a microorganism to stop a medication from working against it. AMR is a major threat to global public health because it makes standard treatments ineffective and contributes to the spread of microbial infections. It is estimated that 700,000 deaths were attributable to AMR in 2016 and that this number will increase to 10 million by 2050 if no actions are taken to tackle this problem [1]. One vital step in fighting AMR is identification of resistance determinants, such as single nucleotide polymorphisms (SNPs), from whole-genome sequence (WGS) data so that AMR’s biological mechanisms can be studied and understood. This understanding will provide crucial insights into the design and development of rapid and accurate clinical diagnostics for AMR as well as new antimicrobial drugs.
It is becoming increasingly feasible to predict AMR phenotypes directly from whole-genome SNP data as the cost of genotyping is continually decreasing with the advance of rapid and high-throughput sequencers. It is advantageous to predict AMR phenotypes from whole-genome genotype data because it does not require bacterial growth, pure cultures or previously identified marker genes as in vitro phenotype tests [2, 3]. In order to make such predictions, the variations between individual genomes are examined and related to phenotypes. To this end, a genome-wide association study (GWAS) is commonly performed to detect associations between SNPs and AMR phenotypes [4]. This is one way to address the curse of dimensionality—the feature dimension being much higher than the sample size—in building models to predict phenotypes from genotypes. A standard GWAS calculates a p-value for each SNP by performing a statistical significance test and sets a threshold to output only the most significant SNPs. The primary limitation of this approach is that the results are sensitive to the degree of match between the assumed statistical model and the real data distribution. One demonstration of this point is that different GWAS packages often output different detected SNPs and some with causal SNPs missing. Moreover, p-values from GWAS only indicate whether or not SNPs are related to a phenotype, but not how strongly they are related. This is one reason why SNPs selected by GWAS are not always good predictors, and why we cannot completely rely on them as features to build predictive models. In this regard, machine learning algorithms can serve as an alternative and complementary method to GWAS.
Machine-learning algorithms can identify relevant features in a complex dataset or make accurate predictions from such data. In the context of predicting AMR phenotypes based on whole-genome sequence (WGS) data, there are many examples of applying machine-learning methods to the problem [2, 3, 5–7]. For instance, a logistic regression classifier was implemented to classify the susceptibility phenotype consistent with vancomycin-intermediate Staphylococcus aureus (VISA) based on 14 gene parameters selected from 45 initial parameters [5]. Pesesky et al. compared rules-based algorithms to a machine-learning algorithm (logistic regression) for predicting AMR resistance profiles in Enterobacteriaceae [3]. The features used to build the prediction model were resistance genes determined by the AMR database Resfams [8]. Other studies used k-mers to represent bacterial genomes to build machine-learning models for AMR genotype identification and phenotype prediction [2, 6, 7].
In this paper, we propose an alternative to GWAS: use a completely data-driven feature selection method to identify significant SNPs. Compared to GWAS, this method needs no model assumptions and identifies SNPs based on their predictive powers. Then, these SNPs are used in two ways: (1) as markers to locate the genetic factors that affect AMR phenotypes, like SNPs from GWAS; (2) as features to build predictive models. Although the machine learning methods mentioned above start from WGS data, they only use WGS data to find known AMR-associated genes, and use these genes as predictors in their models. They ignore other novel genetic factors potentially associated with AMR. In comparison, in this study, the whole-genome SNP data (generated from WGS data) are directly used as input to our deep neural networks for feature selection. In this way, significant SNPs (and thus genetic factors) are identified by our method, rather than being selected from an AMR database, such as CARD [9] or ARDB [10]. It is worth mentioning that by directly using whole-genome SNP data as input, our method can also identify SNPs that fall in intergenic regions such as regulatory elements or promoters and that can be putatively associated with AMR. After significant SNPs are identified, predictive models are built based on these features. The whole workflow is shown in Fig. 1.
Fig. 1.

Workflow of the proposed machine learning approach to identify SNPs from WGS data. The prediction of AMR resistance profiles based on these identified SNPs is also part of the workflow. Although prediction is not the main purpose of this study, it is a natural next step after feature selection. In the figure, rectangles represent methodological steps, while parallelograms without right angles represent data or information. From the SNPs, resistance genes and other genetic elements can then be identified
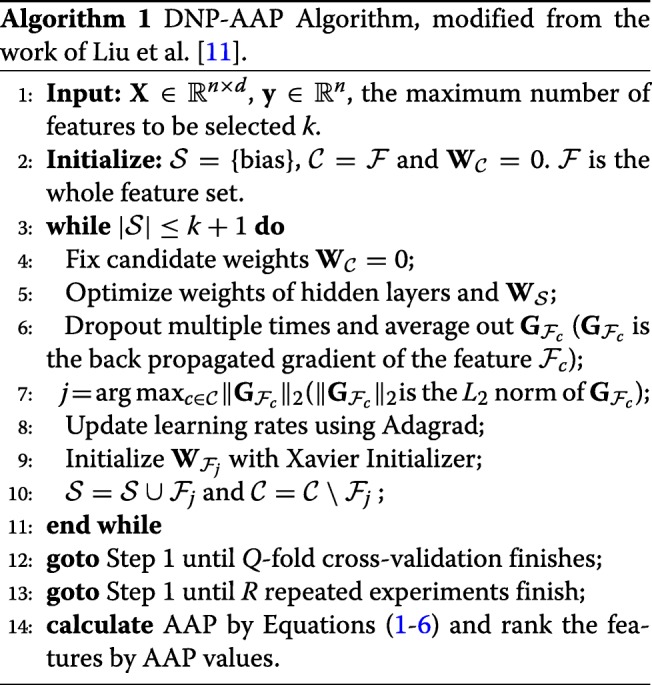
The proposed method, DNP-AAP (deep neural pursuit – average activation potential), involves two steps. DNP is a generic method using deep neural networks to perform feature selection and prediction, specifically designed for low-sample, high-dimension data, such as WGS data and plant genotype data [11]. One problem for DNP is that when it is fed different training data as in k-fold cross-validation, it outputs different sets of features. This makes it hard to select the final set of features, especially when the maximum number of features to be selected is large. This happens because DNP is dealing with high dimensional data and it uses dropout regularization in the feature selection process. Averaging multiple dropout results can reduce gradient variance in neural network training. This helps to improve the stability of feature selection results, but the instability is inherent in the model. To provide a more consistent way to select the final set of features generated by DNP, we add a calculation of average activation potential (AAP) for each selected feature, and use this AAP as the criterion to rank the feature importance. Activation potential has also been used to select features in action recognition from videos [12].
We applied DNP-AAP on a published N. gonorrhoeae WGS data with minimum inhibitory concentration (MIC) phenotypes for five commonly used antibiotics. Our experiment results show that DNP-AAP can effectively identify known AMR determinants in N. gonorrhoeae, and discover new potential AMR determinants. Subsequently, the identified SNPs were used to build logistic regression classifiers and the prediction AUCs (area under the curve) range from 0.949 to 0.994 for five subsets tested in our experiments.
The goal of this research is to design and test a data driven, deep learning method (DNP-AAP) that can predict SNPs associated with antimicrobial resistance, rather than to conduct a systematic comparison of feature selection methods. However, it is still worthwhile to place the results from DNP-AAP within the context of other feature selection methods. To this end we compared the results from DNP-AAP to those when using two other popular feature selection methods, LASSO [13] and AdaBoost [14].
Results
We now present the results we obtained by applying DNP-AAP to the N. gonorrhoeae dataset. In the following analysis, we use the genes that have been reported to associate with N. gonorrhoeae AMR as a reference standard to evaluate the efficacy of our model in identifying known genes from WGS data. To test the significance of the identified SNPs in terms of power to predict a resistance profile, a very simple and efficient logistic regression classifier was trained for each antibiotic with the identified SNPs as features to classify N. gonorrhoeae strains.
One parameter that needs to be determined is how many features (SNPs) should be selected when performing feature selection. There is no universal solution to this problem. One strategy is to do a sensitivity analysis and see how adding or removing a feature affects the prediction accuracy. Another way is to choose this number based on the capacity of wet lab experiment facilities. If a lab can handle 50 (for example) genes in one experiment, then one can set the number of features to be 50. The results presented in this paper were obtained with a mix of these two criteria; that is, the criterion to select SNPs was that either a minimum number was reached or the prediction accuracy stopped increasing (< 0.05). The minimum number of SNPs to be selected was set to 10. This number was chosen given preliminary experimental results showing that the genes in the reference standard (Table S2 in Additional file 1) were not always at the top of the result list, but they were usually within the top 10. It is normal to not always see the genes in the reference standard at the top of the result list; because DNP is a greedy algorithm, the SNPs selected earlier are not always the globally optimal results.
The deep neural network (DNN) architecture was determined based on the structure suggested by Liu et al. [11] and preliminary investigations. According to Liu et al., the DNN that performs best in identifying known genes is a 4 layer neural network with 2 hidden layers. They also showed that changing the number of neurons in the hidden layers does not make much difference in identifying the known genes. Thus we used a simple DNN with the structure “ 41502/50′′−30−20−2, corresponding to the number of neurons in the input–hidden1–hidden2–output layers. The 2 neurons in the output layer correspond to our binary classes, susceptible and resistant to an antibiotic. 41502 in “ 41502/50” is the number of neurons used in the back propagation step, but not in the feed forward step. Every time a new feature is added to the selected set , the subnetwork, , is trained. In all our analyses, fifty features, including the bias item, were selected in each cross-validation for every antibiotic. Thus the final neural network that was trained had the structure 50−30−20−2.
Ciprofloxacin resistance analysis
We first tested DNP-AAP on the ciprofloxacin resistance dataset which includes 302 susceptible and 364 resistant strains. Given the criterion to determine the number of SNPs to report, ten SNPs with the highest AAP were identified and are listed in Table 1. Gene annotations are from the reference genome NCCP11945 from EnsemblBacteria [15]. The annotation using NCBI is listed in Additional file 1: Table S3.
Table 1.
SNPs identified for the resistance to ciprofloxacin (CIP) by DNP-AAP
| ID Range | ID | AAP | Genes | Annotations | Known |
|---|---|---|---|---|---|
| [18797,18817] | 18799 | 0.658 | gyrA | DNA gyrase subunit A | ✓ |
| [4309,4366] | 4363 | 0.536 | parC | DNA topoisomerase IV subunit A | ✓ |
| 5087 | 0.506 | intergenic between NGK_0295 and NGK_0296 ∗ | |||
| 5075 | 0.497 | NGK_0295 | glutathione synthetase | ||
| 34282 | 0.483 | intergenic between NGK_2199 and NGK_2200 ∗ | |||
| 33843 | 0.482 | NGK_2182 | putative integral membrane protein | ||
| 20553 | 0.478 | NGK_1395 | OTB_PSEPK Probable sugar efflux transporter | ||
| 2285 | 0.477 | NGK_0116 | conserved hypothetical protein | ||
| 34301 | 0.475 | NGK_2201 | hypoxanthine-guanine phosphoribosyltransferase | ||
| 16353 | 0.447 | NGK_1090 | conjugal transfer pilus assembly protein TraD |
Annotations are from EnsemblBacteria. The column “ID Range” lists the ranges of SNPs that fall in known AMR-associated genes (only) in our data. ID: ID of Identified SNP.
*NGK_0295: glutathione synthetase; NGK_0296: diacylglycerol kinase (DagK); NGK_2199: PtsH; NGK_2200: putative sugar transport PTS system IIA protein
Two genes associated with ciprofloxacin resistance, gyrA and parC, were identified by DNP-AAP, and the order of their importance also matches the published results [16]. The point mutation S91F (amino acid substitution) in gyrA was detected, while for parC, P88S was identified instead of the usually reported S87R, though both are present in resistant strains. The mutations in both gyrA and parC proteins can decrease the affinity between ciprofloxacin molecule and its binding sites, thereby conferring resistance to the antibiotic.
The SNP with ID 33843 falls in the gene NGK_1282, which encodes a putative integral membrane protein (GeneBank) in N. gonorrhoeae. KEGG Orthology (K07243) shows that this protein is a high-affinity iron transporter. Duncan [17] showed that ciprofloxacin kills bacteria by a mechanism involving production of hydroxyl radicals (·OH) from the Fenton reaction [18] and metabolic stress. The way for bacteria to avoid being killed is either by inhibiting the Fenton reaction through reducing ferrous iron (Fe 2+) or by reducing hydroxyl radicals (·OH) produced by the Fenton reaction after the addition of antibiotics. Although it is not clear how the pathway involving the gene NGK_1282 works, it seems possibly relevant to this antibiotic resistance mechanism. Two SNPs with ID 5087 and 34282 that fall in intergenic regions were also identified.
Cefixime resistance analysis
The SNPs identified for cefixime resistance are shown in Table 2. The most significant mutations associated with cefixime resistance happen in the mosaic penA gene. Several penA SNPs were always selected with the highest AAP values. This shows that DNP-AAP can effectively identify these significant features contributing to cefixime resistance. DNP-AAP also identified several point mutations in two 16S RNA proteins which have been shown to be associated with azithromycin resistance [16, 19].
Table 2.
SNPs identified for the resistance to cefixime (CFX) by DNP-AAP
| ID Range | ID | AAP | Genes | Annotations | Known |
|---|---|---|---|---|---|
| 31799 | 0.423 | NGK_rrna16s3 | NGK_rrna16s3 | ||
| [28398,28481] | 28431 | 0.419 | penA | penicillin-binding protein 2 | ✓ |
| [28398,28481] | 28418 | 0.406 | penA | penicillin-binding protein 2 | ✓ |
| 29914 | 0.402 | NGK_rrna16s2 | NGK_rrna16s2 | ||
| [28398,28481] | 28417 | 0.382 | penA | penicillin-binding protein 2 | ✓ |
| [28398,28481] | 28428 | 0.382 | penA | penicillin-binding protein 2 | ✓ |
| 29915 | 0.376 | NGK_rrna16s2 | NGK_rrna16s2 | ||
| 29916 | 0.370 | NGK_rrna16s2 | NGK_rrna16s2 | ||
| [28398,28481] | 28427 | 0.368 | penA | penicillin-binding protein 2 | ✓ |
| [28398,28481] | 28429 | 0.367 | penA | penicillin-binding protein 2 | ✓ |
Annotations are from EnsemblBacteria. The column “ID Range” lists the ranges of SNPs that fall in known AMR-associated genes (only) in our data. ID: ID of Identified SNP
Penicillin resistance analysis
As for penicillin resistance, the gene ponA, which has been reported as being associated with penicillin resistance, was among the 10 locations of SNPs output by DNP-AAP (Table 3). Specifically, the SNP with ID 2755 leads to an amino acid substitution L421P in ponA product penicillin-binding protein 1A (PBP1). This mutation decreases penicillin acylation of PBP1 and increases penicillin resistance [16]. The SNP with the highest AAP value is in a conserved hypothetical protein, the function of which is not yet determined. The SNP with the second highest AAP falls in the gene NGK_2170 which encodes the outer membrane protein PIIc. GO (gene ontology) terms describe PIIc as “enables porin activity; involved in trans-membrane transport; part of membrane; part of integral component of membrane”. This is an interesting finding because one AMR mechanism is antibiotic efflux that can be conferred by membrane and membrane-associated proteins. These proteins can pump antimicrobial compounds out of microbial cells [20]. Another SNP, one with ID 10120, falls in a putative phage-associated gene NGK_0679. A bacteriaphage is a virus that infects and replicates within bacteria [21]. Bacteriaphages are one of the mobile genetic elements considered in the AMR studies of N. gonorrhoeae (see [22] and references therein). Bacteriaphages were also examined in other AMR studies [23, 24].
Table 3.
SNPs identified for the resistance to penicillin (PEN) by DNP-AAP
| ID Range | ID | AAP | Genes | Annotations | Known |
|---|---|---|---|---|---|
| 38424 | 0.344 | NGK_2469 | conserved hypothetical protein | ||
| 33601 | 0.342 | NGK_2170 | outer membrane preprotein PIIc | ||
| 18799 | 0.330 | gyrA | DNA gyrase subunit A | ||
| 29502 | 0.322 | NGK_1906 | monofunctional biosynthetic peptidoglycan | ||
| transglycosylase | |||||
| 29504 | 0.251 | NGK_1906 | monofunctional biosynthetic peptidoglycan | ||
| transglycosylase | |||||
| [2749,2763] | 2755 | 0.236 | ponA | penicillin-binding protein 1A | ✓ |
| 35095 | 0.219 | NGK_2270 | adhesin MafA | ||
| 10120 | 0.213 | NGK_0679 | putative phage associated protein | ||
| 40335 | 0.204 | intergenic between NGK_2581 and NGK_2582 ∗ | |||
| 6817 | 0.203 | NGK_0423 | 23S rRNA pseudo-uridine 1911/1915/1917 | ||
| synthase |
Annotations are from EnsemblBacteria. The column “ID Range” lists the ranges of SNPs that fall in known AMR-associated genes (only) in our data. ID: ID of Identified SNP
*NGK_2581: Putative hemoglobin receptor component precursor HpuA; NGK_2582: Conserved hypothetical protein
Although effects of these mutations on penicillin resistance need further investigation, they seem relevant and can make promising candidates for microbiological experiments.
Tetracycline resistance analysis
A SNP in the gene rpsJ associated with tetracycline resistance was identified by DNP-AAP (Table 4). The identified SNP (with ID 37927) leads to the amino acid substitution V57M in the encoded ribosomal protein S10, which reduces the affinity between tetracycline and the 30S ribosomal target [16]. The other observation regarding tetracycline resistance is that two genes encoding putative phage proteins are potentially implicated, each with two SNPs identified among the ten output from DNP-AAP. As mentioned before, bacteriaphages could potentially contribute to bacteria resistance (see references above). More verification is needed to see if these implicated genes contribute to tetracycline resistance.
Table 4.
SNPs identified for the resistance to tetracycline (TET) by DNP-AAP
| ID Range | ID | AAP | Genes | Annotations | Known |
|---|---|---|---|---|---|
| 27095 | 0.470 | intergenic between NGK_1771 and NGK_1772 ∗ | |||
| 21468 | 0.205 | NGK_1458 | putative phage associated protein | ||
| [37926,37927] | 37927 | 0.196 | rpsJ | 30S ribosomal protein S10 | ✓ |
| 29960 | 0.159 | NGK_1968 | IS1016 transposase | ||
| 37300 | 0.150 | NGK_2398 | methionyl-tRNA formyltransferase | ||
| 40041 | 0.131 | NGK_2557 | hemoglobin/transferrin/lactoferrin receptor | ||
| protein | |||||
| 21467 | 0.121 | NGK_1458 | putative phage associated protein | ||
| 9785 | 0.120 | NGK_0668 | putative phage associated protein | ||
| 9787 | 0.120 | NGK_0668 | putative phage associated protein | ||
| 18761 | 0.119 | NGK_1227 | putative HTH-type transcriptional regulator | ||
| NMB1378 |
Annotations are from EnsemblBacteria. The column “ID Range” lists the ranges of SNPs that fall in known AMR-associated genes (only) in our data. ID: ID of Identified SNP
*NGK_1771: transferrin-binding protein A; NGK_1772: TbpB
Azithromycin resistance analysis
DNP-AAP did not identify any known genes associated with azithromycin resistance among the output SNPs given the selection criterion (Table 5). However, it identified a putative drug resistance gene NGK_1793 with the second highest AAP value. In addition, a SNP falling in the gene NGK_2342, which encodes pilC protein, is identified. pilC is the adhesion protein located at the tip of a bacterium pilus. Research shows that pilC can act on the bacterial cell surface and cooperate in DNA recognition and/or outer membrane trans-location [25]. Dötsch et al. [26] reported that mutations in pilC can increase drug resistance in Pseudomonas aeruginosa. Thus there is potential that this mutation can also relate to N. gonorrhoeae AMR.
Table 5.
SNPs identified for the resistance to azithromycin (AZM) by DNP-AAP
| ID Range | ID | AAP | Genes | Annotations | Known |
|---|---|---|---|---|---|
| 27421 | 0.424 | NGK_1776 | conserved hypothetical protein | ||
| 27690 | 0.420 | NGK_1793 | putative drug resistance protein | ||
| 30659 | 0.300 | NGK_2022 | Infection response protein Irg2 | ||
| 36328 | 0.294 | NGK_2342 | pilC protein | ||
| 36810 | 0.290 | intergenic between NGK_2354 and NGK_2355 ∗ | |||
| 30434 | 0.278 | intergenic between NGK_1994 and NGK_1995 ∗ | |||
| 21513 | 0.269 | NGK_1463 | putative phage associated protein | ||
| 39676 | 0.266 | NGK_2537 | homoserine kinase | ||
| 36809 | 0.258 | intergenic between NGK_2354 and NGK_2355 ∗ | |||
| 29095 | 0.254 | NGK_1872 | phosphatidylglycerophosphatase A |
Annotations are from EnsemblBacteria. The column “ID Range” lists the ranges of SNPs that fall in known AMR-associated genes (only) in our data. ID: ID of Identified SNP
*NGK_2354: Conserved hypothetical protein; NGK_2355: Hypothetical protein; NGK_1994: TspB2; NGK_1995: putative phage associated protein
Prediction accuracy
ROC (receiver operating characteristic) curves and the average AUCs (Area Under the Curve) calculated from 5-fold cross-validation were used as a measure of the predictive power of the identified SNPs. A simple and efficient logistic regression classifier implemented using scikit-learn was trained with the identified SNPs. Although DNP performs classification simultaneously with feature selection, a separate classifier is built because the final identified features are selected with AAP from the aggregate candidate features from multiple experiments with cross-validation.
The ROC curves and AUCs generated by logistic regression with 5-fold cross-validation for the five antibiotic datasets are shown in Fig. 2. Of note is that the significant SNPs were identified with strains most resistant/susceptible to each antibiotic (statistics in Table 6), while the ROC curves and AUCs were obtained by considering the whole dataset with intermediate strains removed (statistics in Table 7).
Fig. 2.
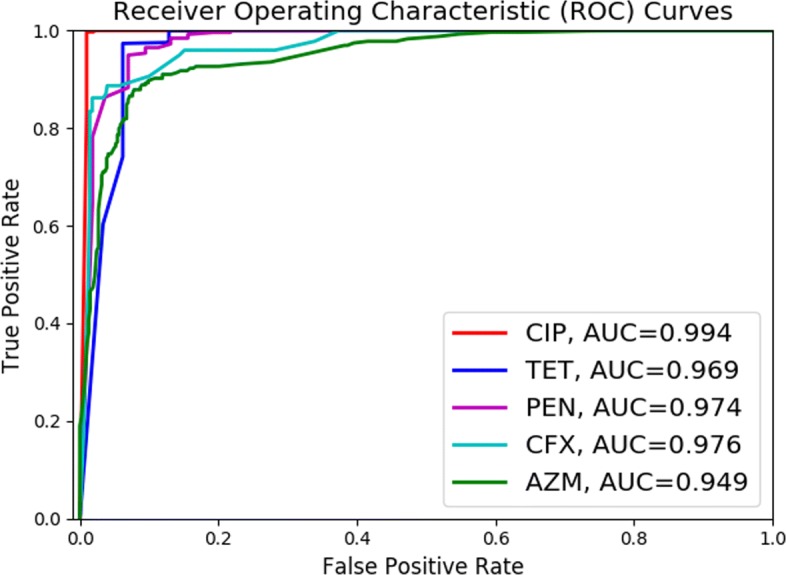
ROC curves and AUCs for the predicted resistance profiles for the five antibiotics under consideration
Table 6.
Counts of N. gonorrhoeae strains for each antibiotic
| AMR/Antibiotics | CIP | AZM | TET | CFX | PEN |
|---|---|---|---|---|---|
| Susceptible | 302 | ≤0.1 | ≤0.25 | ≤0.005 | ≤0.06 |
| 45 | 26 | 75 | 46 | ||
| Resistant | 364 | ≥16 | ≥50 | ≥0.25 | ≥6 |
| 38 | 26 | 108 | 37 | ||
| Total number | 666 | 83 | 52 | 183 | 83 |
N. gonorrhoeae strains for each antibiotic are balanced by selecting strains with the lowest and the highest MIC values. Criteria for selection are given above each count
Table 7.
Summary of original antibiotic resistance data for N. gonorrhoeae strains
| AMR/Antibiotic | CIP | AZM | TET | CFX | PEN |
|---|---|---|---|---|---|
| Susceptible | 302 | 443 | 26 | 557 | 258 |
| Intermediate | 5 | 0 | 124 | 0 | 363 |
| Resistant | 364 | 233 | 526 | 108 | 46 |
| Total number | 671 | 676 | 676 | 665 | 667 |
There are 676 strains in total. MIC values were available for most strains for all five antibiotics. The numbers under each antibiotic are the counts in each category, obtained based on its CLSI breakpoints. CIP: ciprofloxacin; CFX: cefixime; PEN: penicillin; TET: tetracycline (TET); AZM: azithromycin (AZM)
Table 8 presents the true positive rate (TPR) for the classification of resistant strains given different false positive rates (FPR). TPR measures the proportion of resistant strains that are correctly classified as such and FPR measures the proportion of susceptible strains that are classified wrongly as resistant. When FPR is controlled around 10%, about 98%, 95%, 91% and 89% of resistant strains can be correctly classified for TET, PEN, CFX and AZM respectively. The reasons behind the differences in trends exhibited in Table 8 are not clear and deserve further investigation.
Table 8.
TPR (=TP/(TP+FN)) for each antibiotic resistance prediction given different FPR (=FP/(FP+TN))
| Drug/FPR | 0.05 | 0.10 | 0.15 | 0.20 |
|---|---|---|---|---|
| CIP | 1.00 | 1.00 | 1.00 | 1.00 |
| TET | 0.74 | 0.98 | 1.00 | 1.00 |
| PEN | 0.86 | 0.95 | 0.98 | 0.996 |
| CFX | 0.89 | 0.91 | 0.96 | 0.96 |
| AZM | 0.76 | 0.89 | 0.92 | 0.93 |
CIP: Ciprofloxacin; AZM: azithromycin; TET: tetracycline; CFX: cefixime; PEN: penicillin
To further show the predictive power of the identified SNPs, we compared the ROC curves and AUCs obtained by using the identified SNPs and the same number of SNPs randomly selected as features to build the logistic regression classifier. The ciprofloxacin dataset is used as an example here, and the results were similar for the other four antibiotics. It can be seen from Fig. 3 that SNPs identified by DNP-AAP were substantially better at predicting the AMR resistance of ciprofloxacin than the same number of randomly selected SNPs.
Fig. 3.
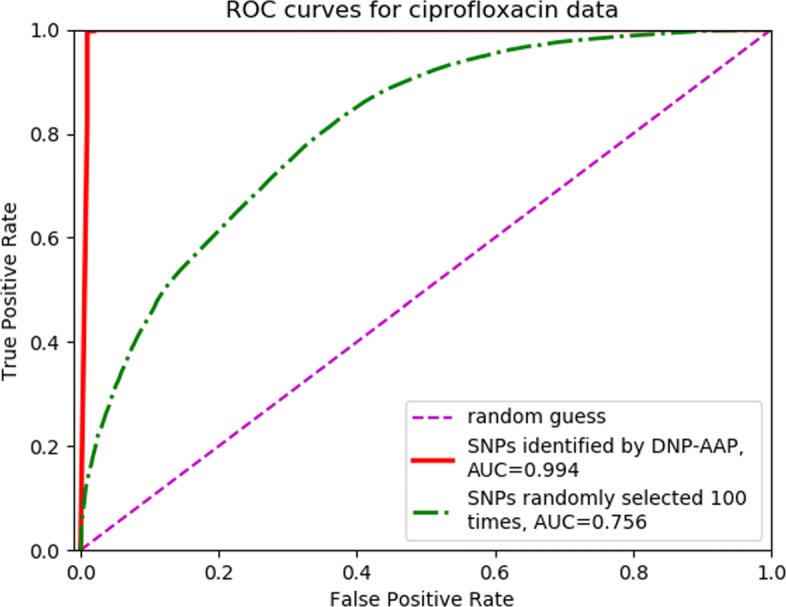
Classification performance of SNPs identified by DNP-AAP versus randomly selected SNPs. Shown are ROC curves for classifications made with SNPs identified by DNP-AAP and with randomly selected SNPs for ciprofloxacin data. The latter curve was obtained by randomly selecting 10 SNPs 100 times and averaging the resultant FPR (false positive rate) and TPR (true positive rate) values
Distribution of AAP
Average activation potentials (AAP) can be calculated between any layers in a deep neural network. We calculated AAPs between the input layer and the first hidden layer because direct correlation between the input features and their contribution to the whole neural network can only be established in this layer [12]. Figure 4 shows the input features sorted in the decreasing order of AAPs. Most of the selected input features from the 5-repeat experiments with 10-fold cross-validation had AAP close to zero, while only the first few inputs had significantly larger AAPs. These inputs contribute most to the activation of neurons in the neural network. The tails of the AAP distributions demonstrate the degree of selection consistency of the input features. On closer inspection, we can see that the total number of selected input features for ciprofloxacin is the smallest and the one for tetracycline is the largest. The shorter the tail, the more stable are the features output from DNP-AAP. However, since we are usually most interested in the top few (for example, 50 or 100) output SNPs, our DNP-AAP method provides good stability in identifying the most significant features.
Fig. 4.

Distribution of average activation potentials (AAP) for the five antibiotic datasets
Performance of comparison techniques
As for DNP-AAP, the best SNPs from LASSO and AdaBoost and for each drug were examined to identify whether they were located within genes known to be associated with antimicrobial resistance. As shown by Additional file 1: Table S4, with one exception DNP-AAP reports the same number or more SNPs than the comparison methods.
Following the procedure for SNPs from DNP-AAP, logistic regression classifiers were constructed for each drug using the best SNPs identified by LASSO and AdaBoost, and the accuracies of the predictors were determined. The AUC values are given in Additional file 1: Table S5, while the ROC curves themselves are given in Additional file 1: Figures S3 and S4. As shown in the table, DNP-AAP performs better than LASSO and AdaBoost in a majority of cases.
Discussion
It can be seen that the general predictive power of the identified SNPs is fairly strong for the five antibiotic resistance profiles. The SNPs for ciprofloxacin show the strongest predictive power, yielding the AUC of 0.994, while SNPs identified for azithromycin resistance show the weakest predictive power, yielding the AUC of 0.949. One possible explanation for the difference in predictive power among the drugs is the amount of data available for each in the various resistance categories. For example, as shown in Table 7, the data for ciprofloxacin – the drug with the best predictive power – was well-balanced and numerous in both the susceptible and resistant categories. However, the data for the other drugs was less balanced. Filtering to obtain a better balance between the susceptible and resistant categories (see Table 6) resulted in less data for training. The reduction in data quantity might be the cause of the reduced predictive power.
The purpose of tools such as DNP-AAP is to provide microbiologists with a list of candidate genes and other genetic factors. They can further distill these candidates by applying their domain knowledge with the aim of improving their experimental productivity. Although the new potential determinants are strongly predictive of AMR resistance in N. gonorrhoeae, their functions need to be verified by further examination.
Conclusions
In biology, phenotypes are determined by genotype and the interaction between genotype and environment. Thus, by looking into genomic variations between individuals, we can identify contributors to their phenotypic differences. This is why SNPs are commonly used as markers to study the genetic cause of diseases and antimicrobial resistance, and also used in plant and animal breeding programs to select superior varieties. SNPs can be tracked and quantified over time, so they are also used to study evolutionary change in populations.
In this work, we propose DNP-AAP to identify known and discover new potential AMR-associated point mutations from whole-genome SNP data. This step can serve as a starting point of building machine learning models for AMR resistance profile prediction based on whole-genome genotype data. We also propose a general workflow to build machine learning models for AMR prediction from WGS data (shown in Fig. 1). The advantages of this workflow include: (1) it is generic and completely data-driven; (2) AMR predictors identified are not limited to known genes from AMR databases and new, putative AMR-associated genes and intergenic regions can be identified; (3) once significant predictors are identified, only position-specific SNP calling needs to be performed for the AMR resistance prediction of new samples; (4) it is easy to monitor the development of point mutations when new WGS and resistance phenotype data becomes available.
In order to test the efficacy of DNP-AAP, we applied it to a N. gonorrhoeae WGS data with resistance profiles to five commonly used antibiotics for gonorrhoea treatments. The results show that DNP-AAP can effectively identify known AMR-associated SNPs for the antibiotics ciprofloxacin, cefixime, penicillin and tetracycline. It also provides a list of candidate genes and intergenic regions that might lead to novel AMR factor discovery, though further verification is required. DNP-AAP can be applied to AMR analysis of any bacterial species with genomic variants and phenotype data. This can provide microbiologists with a useful screening tool to generate genetic candidates for further lab experiments.
Despite the promising results, DNP-AAP has limitations. First, it cannot provide explicit evidence of the interactions between SNPs, although the neural network accounts for non-linear relationships between neurons. Second, the features identified can vary depending on the training data and also the number to be output from DNP. This stochastic characteristic of the algorithm should not deter others from applying this method, however, since the features identified with high rank by AAP are relatively stable.
Methods
DNP-AAP is a quantifying method to select features from low-sample, high-dimension data. In this section, we will introduce DNP and AAP in more detail.
Preliminary feature selection with DNP
DNP provides a general way to select features from high-dimension, low-sample size data within a deep neural network (DNN) architecture, which makes it possible to apply DNNs to problems such as plant phenotype prediction from genotype and antimicrobial resistance prediction based on WGS data. Both problems suffer from insufficiency of samples while being burdened with high-dimension data. Essentially, DNP applies conventional forward feature selection to deep neural networks using back propagated gradients. It starts with initializing a selected set with a bias node added to the input layer so that not all neurons in the DNN are inactive; that is, . This means that only weights connected to the bias node are initialized with values, while the weights for all other features are set to 0. Then features in the candidate set are selected one by one according to the L2 norm of their back-propagated gradients. The higher the norm, the more the change of the candidate feature’s weights contributes to minimizing the cost function in neural network training, and thus the feature is removed from and added to . This process is illustrated in Additional file 1: Figure S1.
The way DNP selects features is similar to the grafting algorithm proposed by Perkins et al. [27] where, in each iteration, the feature with the largest norm of back propagated gradient is added from a candidate set to a selected set. Both DNP and the grafting algorithm are greedy because they can only ensure the feature selected is the best at this point but cannot guarantee that the final set of features is the global optimum set. A simple description on why back-propagated gradients can be used to select features is given in Section S1 of Additional file 1.
DNP adopts dropout on hidden layers to reduce the high variance of back propagated gradients when dealing with small-sample data. Although dropout can also be applied on the input layer, in practice, this is usually not performed because it will directly discard information from input data. Especially in feature selection settings, we want to keep all the features in the input layer so that we do not lose any important features during random dropouts. In each iteration to select one feature, dropouts are performed multiple times, and each candidate feature’s back propagated gradient is averaged over all dropouts. This can help to reduce gradient variance and add some stability to feature selection. The DNP process is illustrated in the first 11 lines in Algorithm 1.
Feature importance ranking with AAP
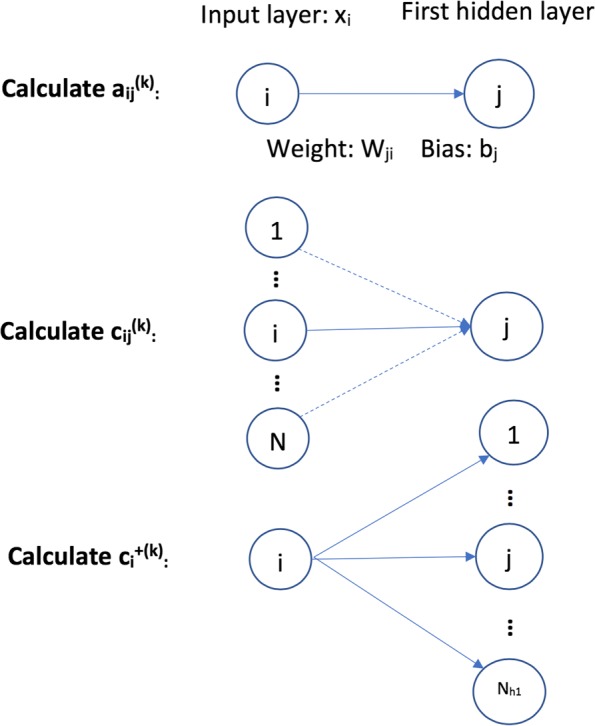
In order to evaluate the contribution of each identified feature to a prediction model, a quantitative metric is required to rank the importances. To this end, we use a concept called average activation potential (AAP) [12] as the metric to evaluate the importance of a feature selected by DNP. For each input feature, AAP calculates its activation potential on each neuron in the first hidden layer, and averages this potential among all training samples. Then, the total activation potential of this input variable is the sum of its activation potential on all the neurons in the first hidden layer. Since DNP is a stochastic algorithm, to further improve the consistency of identified features, we run multiple repeated experiments on each dataset. Therefore, AAP is also averaged on multiple experiment results. Intuitively, the more a feature is selected by cross-validation in multiple experiments, the more likely it is significant. The definition of AAP is given next and its main steps are shown in Fig. 5.
Fig. 5.
The main steps in defining average activation potential (AAP)
To define the activation contribution of a node i in the input layer to all nodes in the first hidden layer, , we first define its activation potential to one node j in the first hidden layer given one training instance k, ,
| 1 |
where is the ith input feature value of the kth training instance, and is the weight between node i and j, and is the bias item to node j given instance k. This is the first step “Calculate ” in Fig. 5. Now we define the average absolute activation potential of node i to node j given all the training instances:
| 2 |
where M is the number of training instances. The absolute value is used to penalize nodes with large negative depression of the nodes in the next layer. Now we use aaij to define , the contribution of node i to the activation of node j given training instance k, which is shown as follows:
| 3 |
where N is the number of nodes in the input layer. Before we define the final activation contribution of node i in the input layer to all nodes in the first hidden layer, we briefly introduce the activation function used in neural network training. An activation function performs non-linear transformation to input features. This makes a neural network capable of learning and solving more complex tasks. A neural network without an activation function is just a linear regression model. One commonly used activation function in DNN training is a Rectifier Linear Unit (ReLU), which is also used in this work. A node is activated when its output value is greater than 0; otherwise, it is not activated. The following is the ReLU function:
Given the ReLU activation function, we define the positive activation contribution of node i to the whole neural network given the kth training instance as follows:
| 4 |
This is reasonable because when ReLU is used as the activation function, any nodes in a hidden layer with negative output values are set to be inactive, and these nodes will not contribute to the final training of the neural network. Thus, we only count the positive contribution of input features. Then the activation potential of node i to the whole neural network given all training data is given as
| 5 |
Due to the stochastic nature of DNP, to further increase the stability of DNP results, we rank the features based on multiple repeated experiments. Because of the small number of training instances, cross-validation is used in DNP training. Therefore, we average the activation potential of node i to the whole neural network among R repeated experiments and Q-fold cross validation,
| 6 |
and use this as the final criterion to rank feature importance. The superscript (r,q) refers to the qth cross validation in the rth experiment. The whole learning process of DNP-AAP is shown in Algorithm 1.
Implementation
The DNP-AAP algorithm is implemented in Python Version 3 utilizing the deep learning package MXNet.
Comparison
We compare the feature selection performance of DNP-AAP with two well-established methods for feature selection, LASSO [13] and AdaBoost [14]. Adaboost has been utilized for feature selection for antimicrobial resistance prediction using k-mers [2]. Here we apply this approach to SNP prediction in antimicrobial resistance genetic factor identification. blackImplementations of LASSO and AdaBoost are provided through the linear_model.lasso and AdaBoostClassifier packages from scikit-learn version 0.20.2, respectively. lasso is run with default parameters except for alpha, which is set to 0.01 to achieve a number of reported SNPs comparable to that from DNP-AAP. For AdaBoostClassifier the following parameters are specified: decision tree classifiers of maximum depth of 1 are used as weak learners; the maximum number of weak learners is set to be 100; 1 is used as the learning rate; and the learning algorithm is set to “SAMME.R”.
Whole-genome sequence data
Whole-genome sequence data of N. gonorrhoeae with antimicrobial susceptibilities to five commonly used antibiotics from three published studies [19, 28, 29] were downloaded from NCBI Sequence Read Archive (SRA) [30]. The NCBI identifiers of all strains are listed in Additional file 2. The steps to preprocess the WGS data are outlined as follows:
Paired-end short reads were downloaded from NCBI SRA [30] with fastq-dump.
Sequence alignments were performed with BWA MEM [31] using NCCP11945 [32] as reference genome.
sam files generated from BWA MEM were transformed to bam format with SAMtools [33, 34].
Variant calling was performed using Freebayes [35] with parameters set as in other studies which also used Freebayes for SNP calling in N. gonorrhoeae [19].
Variant calling results were filtered with Freebayes setting ‘vcffilter -f ~TYPE = snp~’ to retain only SNP data.
Eventually, we generated a dataset with 676 samples, each of which had 41502 SNPs. A SNP is a variation at a single position on the DNA sequences of different individuals. A variation is considered as a polymorphism only when it is detected above a certain threshold such as 1% or 5% in a population. Such a constraint [19] is used here to exclude variations arising from errors or very rare mutations.
SNPs usually take values 0 (the same as reference allele), 1 (the alternative allele), and “.” (missing data). However, Freebayes also generates numbers larger than 1 for some positions. This means that it finds multiple alleles at those positions. We replaced the numbers > 1 with 1 to only show that there is variation at those positions. As for missing values, we did not try to impute them, but rather assigned them the value 0.5 (simply the mean of 0 and 1) instead of following the example in GAPIT [36], which replaces missing values with 0 or 1 by simple imputations. The reason for not imputing missing values is that our sample is not big enough to make a verifiable imputation. Further, simple imputation methods, such as mode imputation, which fills the missing data with the most common value each SNP takes, can introduce bias into data favoring the strains with major SNPs.
Antimicrobial resistance phenotype
Minimum inhibitory concentration (MIC) was used as a numerical measurement of AMR phenotype. It is the lowest concentration of a drug that will inhibit the visible growth of a microorganism [37]. In this study, two classes of N. gonorrhoeae strains were used, i.e., susceptible versus resistant, which were grouped based on their MIC values and the breakpoints (thresholds) given by Clinical Laboratory Standard Institute (CLSI) [38]. The MIC thresholds for the five antibiotics examined in the data are shown in Additional file 1: Table S1. The MIC distribution for each of the five drugs is given in Figure S2 of Additional file 1.
Dataset for each antibiotic
As mentioned above, N. gonorrhoeae strains were grouped into Susceptible (S) or Resistant (R) classes based on their MIC values and CLSI breakpoints [38]. Based on the CLSI breakpoints for each antibiotic, we obtained five datasets, shown in Table 7. To simplify the description, Decreased Susceptibility for cefixime is also referred to as Resistant in this paper. The complete labeled data, including “Intermediate" (I) class, is summarized in Table 7.
From the clinical application perspective, we only considered the strains in S and R classes. It can be seen from the table that most sub-datasets were imbalanced except for ciprofloxacin. To increase the quality of the limited data for feature selection, we balanced the datasets by taking strains with the most extreme MIC values; i.e., susceptible strains were selected with the lowest MIC values, and resistant strains were selected with the highest MIC values. The thresholds used were the ones that yield approximately the same numbers of resistant and susceptible strains. The data statistics are summarized in Table 6. Ciprofloxacin data was approximately balanced and is listed in the table for completeness.
Antimicrobial loci in N. gonorrhoeae
The genetic factors that have been reported to be associated with AMR in N. gonorrhoeae to the five antibiotics are summarized in Additional file 1: Table S2. There were no SNPs from plasmids in the data because only chromosomal DNAs were extracted for sequencing [19, 28, 29]. The plasmid genes are listed in the table for reference purposes.
Additional files
Supporting information. This PDF file includes: (1) Section S1: a description of how back propagated gradients in neural network training are used for feature selection; (2) Figure S1 gives an illustration on how DNP works; (3) Figure S2 shows the MIC distribution of the five drugs; (4) Figure S3 provides the predicted resistance profiles and AUC values for the classifier built using SNPs identified by AdaBoost; (5) Figure S4 shows the predicted resistance profiles and AUC values for the classifier built using SNPs identified by LASSO; (6) Table S1 provides the CLSI breakpoints; (7) Table S2 lists the known AMR loci of the five drugs examined in this study; (8) Table S3 lists the SNPs output from DNP-AAP with NCBI annotations for the reference genome NCCP11945; (9) Table S4 lists the numbers of SNPs in known chromosomal AMR determinants in Table 2 reported by DNP-AAP, AdaBoost, and LASSO; (10) Table S5 lists the AUC values for the logistic regression classifiers built using the SNPs reported by each of DNP-AAP, AdaBoost, and LASSO. (PDF 394 kb)
NCBI identifiers. This is a text (.txt) file with NCBI identifiers of the raw reads of 676 N. gonorrhoeae strains used and analyzed in this study. URLs at NCBI corresponding to those identifiers are also given. (TXT 45 kb)
Acknowledgments
We would like to thank B. Liu for sharing the DNP package used in this work. We also thank Farhad Maleki for his assistance with the comparison to other feature selection methods.
About this supplement
This article has been published as part of BMC Bioinformatics, Volume 20 Supplement 15, 2019: Selected articles from the 14th International Symposium on Bioinformatics Research and Applications (ISBRA-18): bioinformatics. The full contents of the supplement are available at https://bmcbioinformatics.biomedcentral.com/articles/supplements/volume-20-supplement-15.
Abbreviations
- AMR
Antimicrobial resistance
- AUC
Area under the curve
- AZM
Azithromycin
- CFX
Cefixime
- CIP
Ciprofloxacin
- CLSI
Clinical laboratory standard institute
- DNN
Deep neural network
- DNP-AAP
Deep neural pursuit – average activation potential
- FPR
False positive rate
- GWAS
Genome-wide association study
- MIC
Minimum inhibitory concentration
- PEN
Penicillin
- ROC
Receiver operating characteristic
- SNP
Single nucleotide polymorphism
- TET
Tetracycline
- TPR
True positive rate
- WGS
Whole-genome sequencing
Authors’ contributions
JS designed and implemented the study and wrote the manuscript under the supervision of AK (primary investigator) and MH. JS, YY, and AK compared the proposed method with other software. ML helped obtain the dataset used in the study. YY and LL provided valuable insights in comparing this method with the statistical analysis in GWAS. JD provided insight into the microbiology of N. gonorrhoeae. All authors were involved in reviewing the manuscript and providing valuable feedback. All authors approved the final version.
Funding
This work is funded by Plant Phenotyping and Imaging Research Center (P2IRC) at the U. of Saskatchewan and the Canadian First Research Excellence Fund.
Ethics approval and consent to participate
Not applicable. No human subjects, human material, or human data were involved in this research.
Consent for publication
Not applicable. No details, images, or videos relating to an individual person are present in this manuscript.
Competing interests
The authors declare that they have no competing interests.
Footnotes
Publisher’s Note
Springer Nature remains neutral with regard to jurisdictional claims in published maps and institutional affiliations.
Contributor Information
Jinhong Shi, Email: jinhong.shi@usask.ca.
Yan Yan, Email: yan.yan@usask.ca.
Matthew G. Links, Email: matthew.links@usask.ca
Longhai Li, Email: longhai.li@usask.ca.
Jo-Anne R. Dillon, Email: j.dillon@usask.ca
Michael Horsch, Email: michael.horsch@usask.ca.
Anthony Kusalik, Email: kusalik@cs.usask.ca.
References
- 1.O’Neill J. Tackling Drug-resistant Infections Globally: Final Report and Recommendations. The Review on Antimicrobial Resistance. London: HM Government and the Wellcome Trust. 2016. Accessed October, 2017. https://amr-review.org/sites/default/files/160518_Final%20paper_with%20cover.pdf.
- 2.Davis JJ, Boisvert S, Brettin T, Kenyon RW, Mao C, Olson R, Overbeek R, Santerre J, Shukla M, Wattam AR, Will R, Xia F, Stevens R. Antimicrobial resistance prediction in PATRIC and RAST. Sci Rep. 2016; 6(27930). [DOI] [PMC free article] [PubMed]
- 3.Pesesky MW, Hussain T, Wallace M, Patel S, Andleeb S, Burnham C. -A. D., Dantas G. Evaluation of machine learning and rules-based approaches for predicting antimicrobial resistance profiles in gram-negative bacilli from whole genome sequence data. Front Microbiol. 2016; 7(1887). [DOI] [PMC free article] [PubMed]
- 4.Wozniak M, Tiuryn J, Wong L. GWAMAR: genome-wide assessment of mutations associated with drug resistance in bacteria. BMC Genom. 2014;15(S10):1–11. doi: 10.1186/1471-2164-15-S10-S10. [DOI] [PMC free article] [PubMed] [Google Scholar]
- 5.Rishishwar L, Petit RA, Kraft CS, Jordan IK. Genome sequence-based discriminator for vancomycin-intermediate Staphylococcus aureus. J Bacteriol. 2014;196:940–8. doi: 10.1128/JB.01410-13. [DOI] [PMC free article] [PubMed] [Google Scholar]
- 6.Santerre J, Davis JJ, Xia F, Stevens R. Machine learning for antimicrobial resistance. arXiv preprint. 2016. https://doi.org/arXiv:1607.01224.
- 7.Drouin A, Giguère S, Déraspe M, Marchand M, Tyers M, Loo VG, Bourgault A. -M., Laviolette F, Corbeil J. Predictive computational phenotyping and biomarker discovery using reference-free genome comparisons. BMC Genomics. 2016;17:754. doi: 10.1186/s12864-016-2889-6. [DOI] [PMC free article] [PubMed] [Google Scholar]
- 8.Gibson MK, Forsberg KJ, Dantas G. Improved annotation of antibiotic resistance functions reveals microbial resistomes cluster by ecology. ISME J. 2015;9:207–16. doi: 10.1038/ismej.2014.106. [DOI] [PMC free article] [PubMed] [Google Scholar]
- 9.McArthur AG, Waglechner N, Nizam F, Yan A, Azad MA, Baylay AJ, Bhullar K, Canova MJ, De Pascale G, Ejim L, Kalan L, King AM, Koteva K, Morar M, Mulvey MR, O’Brien JS, Pawlowski AC, Piddock LJ, Spanogiannopoulos P, Sutherland AD, Tang I, Taylor PL, Thaker M, Wang W, Yan M, Yu T, Wright GD. The comprehensive antibiotic resistance database. Antimicrob Agents Chemother. 2013;57(7):3348–57. doi: 10.1128/AAC.00419-13. [DOI] [PMC free article] [PubMed] [Google Scholar]
- 10.Liu B, Pop M. ARDB – antibiotic resistance genes database. Nucleic Acids Res. 2009;37(Database issue):443–7. doi: 10.1093/nar/gkn656. [DOI] [PMC free article] [PubMed] [Google Scholar]
- 11.Liu B, Wei Y, Zhang Y, Yang Q. Deep neural networks for high dimension, low sample size data In: Sierra C, editor. Proceedings of the 26th International Joint Conference on Artificial Intelligence: 19-25 August 2017; Melbourne: 2017. p. 2287–93. 10.24963/ijcai.2017/318.
- 12.Roy D, Murty KSR, Mohan CK. Feature selection using deep neural networks. In: Proceedings of the 2015 International Joint Conference on Neural Networks: 12-17 July 2015; Killarney, Ireland: 2015. p. 1–6. 10.1109/ijcnn.2015.7280626.
- 13.Tibshirani R. Regression shrinkage and selection via the LASSO. J Royal Stat Soc Ser B (Methodol) 1996;58(1):267–88. [Google Scholar]
- 14.Freund Y, Schapire RE. A decision-theoretic generalization of on-line learning and an application to boosting. J Comput Syst Sci. 1997;55(1):119–39. doi: 10.1006/jcss.1997.1504. [DOI] [Google Scholar]
- 15.NCCP, 11945 Gene Annotation from Ensembl. Accessed November, 2017. http://bacteria.ensembl.org/Neisseria_gonorrhoeae_nccp11945/Info/Index.
- 16.Unemo M, Shafer WM. Genomic analyses of antimicrobial resistance in Neisseria gonorrhoeae in the 21st century: past, evolution, and future. Clin Microbiol Rev. 2014;27(3):587–613. doi: 10.1128/CMR.00010-14. [DOI] [PMC free article] [PubMed] [Google Scholar]
- 17.Duncan ME. Characterization of mechanisms of antibiotic resistance in Neisseria gonorrhoeae. PhD thesis, University of North Carolina at Chapel Hill, Department of Pharmacology. 2012.
- 18.Winterbourn CC. Toxicity of iron and hydrogen peroxide: the Fenton reaction. Toxicol Lett. 1995;82-83:969–74. doi: 10.1016/0378-4274(95)03532-X. [DOI] [PubMed] [Google Scholar]
- 19.Demczuk W, Martin I, Peterson S, Bharat A, Van Domselaar G, Graham M, Lefebvre B, Allen V, Hoang L, Tyrrell G, Horsman G, Wylie J, Haldane D, Archibald C, Wong T, Unemo M, Mulvey MR. Genomic epidemiology and molecular resistance mechanisms of azithromycin-resistant Neisseria gonorrhoeae in Canada from 1997 to 2014. J Clin Microbiol. 2016;54(5):1304–13. doi: 10.1128/JCM.03195-15. [DOI] [PMC free article] [PubMed] [Google Scholar]
- 20.Levy SB. Active efflux, a common mechanism for biocide and antibiotic resistance. J Appl Microbiol. 2002;92(s1):65–71. doi: 10.1046/j.1365-2672.92.5s1.4.x. [DOI] [PubMed] [Google Scholar]
- 21.Wikipedia Definition of “Phage”. Accessed October, 2017. https://en.wikipedia.org/wiki/Bacteriophage.
- 22.Cehovin A, Lewis SB. Mobile genetic elements in Neisseria gonorrhoeae: movement for change. Pathog Dis. 2017;75(6):1–12. doi: 10.1093/femspd/ftx071. [DOI] [PubMed] [Google Scholar]
- 23.Maryury B-J, Caléro-Caceres W, Muniesa M. Transfer of antibiotic-resistance genes via phage-related mobile elements. Plasmid. 2015;79:1–7. doi: 10.1016/j.plasmid.2015.01.001. [DOI] [PubMed] [Google Scholar]
- 24.Subirats J, Alexandre Sànchez-Melsió A, Borrego CM, Balcázar JL, P S. Metagenomic analysis reveals that bacteriophages are reservoirs of antibiotic resistance genes. Int J Antimicrob Agents. 2016;48(2):163–7. doi: 10.1016/j.ijantimicag.2016.04.028. [DOI] [PubMed] [Google Scholar]
- 25.Rudel T, Facius D, Barten R, Scheuerpflug I, Nonnenmacher E, Meyer TF. Role of pili and the phase-variable PilC protein in natural competence for transformation of Neisseria gonorrhoeae. Proc Natl Acad Sci USA. 1995;92(17):7986–90. doi: 10.1073/pnas.92.17.7986. [DOI] [PMC free article] [PubMed] [Google Scholar]
- 26.Dötsch A, Becker T, Pommerenke C, Magnowska Z, Jänsch L, Häussler S. Genomewide identification of genetic determinants of antimicrobial drug resistance in Pseudomonas aeruginosa. Antimicrob Agents Chemother. 2009;53(6):2522–31. doi: 10.1128/AAC.00035-09. [DOI] [PMC free article] [PubMed] [Google Scholar]
- 27.Perkins S, Lacker K, Theiler J. Grafting: Fast, incremental feature selection by gradient descent in function space. J Mach Learn Res. 2003;3:1333–56. [Google Scholar]
- 28.Grad YH, Kirkcaldy RD, Trees D, Dordel J, Harris SR, Goldstein E, Weinstock H, Parkhill J, Hanage WP, Bentley S, Lipsitch M. Genomic epidemiology of Neisseria gonorrhoeae with reduced susceptibility to cefixime in the USA: a retrospective observational study. Lancet Infect Dis. 2014;14(3):220–6. doi: 10.1016/S1473-3099(13)70693-5. [DOI] [PMC free article] [PubMed] [Google Scholar]
- 29.De Silva D, Peters J, Cole K, Cole MJ, Cresswell F, Dean G, Dave J, Thomas DR, Foster K, Waldram A, Wilson DJ, Didelot X, Grad YH, Crook DW, Peto TE, Walker AS, Paul J, Eyre DW. Whole-genome sequencing to determine transmission of Neisseria gonorrhoeae: an observational study. Lancet Infect Dis. 2016;16(11):1295–303. doi: 10.1016/S1473-3099(16)30157-8. [DOI] [PMC free article] [PubMed] [Google Scholar]
- 30.NCBI SRA. Accessed October, 2017. https://www.ncbi.nlm.nih.gov/sra.
- 31.Li H, Durbin R. Fast and accurate long-read alignment with Burrows-Wheeler transform. Bioinformatics. 2010;26(5):589–95. doi: 10.1093/bioinformatics/btp698. [DOI] [PMC free article] [PubMed] [Google Scholar]
- 32.N. gonorrhoeae Reference Genome NCCP11945 from NCBI. Accessed November, 2017. https://www.ncbi.nlm.nih.gov/nuccore/CP001050.
- 33.Li H, Handsaker B, Wysoker A, Fennell T, Ruan J, Homer N, Marth G, Abecasis G, Durbin R, Subgroup GPDP. The sequence alignment/map (SAM) format and SAMtools. Bioinformatics. 2009;25:2078–9. doi: 10.1093/bioinformatics/btp352. [DOI] [PMC free article] [PubMed] [Google Scholar]
- 34.Li H. A statistical framework for SNP calling, mutation discovery, association mapping and population genetical parameter estimation from sequencing data. Bioinformatics. 2011;27(21):2987–93. doi: 10.1093/bioinformatics/btr509. [DOI] [PMC free article] [PubMed] [Google Scholar]
- 35.Garrison E, Marth G. Haplotype-based variant detection from short-read sequencing. arXiv preprint. 2012. https://arxiv.org/abs/1207.3907v2.
- 36.GAPIT. Accessed October, 2017. http://www.maizegenetics.net/gapit.
- 37.Wikipedia Definition of “MIC”. Accessed October, 2017. https://en.wikipedia.org/wiki/Minimum_inhibitory_concentration.
- 38.Public Health Agency of Canada: National Surveillance of Antimicrobial Susceptibilities of Neisseria Gonorrhoeae Annual Summary 2014. Ottawa, Canada. 2014. Public Health Agency of Canada. Accessed November, 2017. http://healthycanadians.gc.ca/publications/drugs-products-medicaments-pro%duits/2014-neisseria/alt/surveillance-gonorrhoeae-2014-eng.pdf.
Associated Data
This section collects any data citations, data availability statements, or supplementary materials included in this article.
Supplementary Materials
Supporting information. This PDF file includes: (1) Section S1: a description of how back propagated gradients in neural network training are used for feature selection; (2) Figure S1 gives an illustration on how DNP works; (3) Figure S2 shows the MIC distribution of the five drugs; (4) Figure S3 provides the predicted resistance profiles and AUC values for the classifier built using SNPs identified by AdaBoost; (5) Figure S4 shows the predicted resistance profiles and AUC values for the classifier built using SNPs identified by LASSO; (6) Table S1 provides the CLSI breakpoints; (7) Table S2 lists the known AMR loci of the five drugs examined in this study; (8) Table S3 lists the SNPs output from DNP-AAP with NCBI annotations for the reference genome NCCP11945; (9) Table S4 lists the numbers of SNPs in known chromosomal AMR determinants in Table 2 reported by DNP-AAP, AdaBoost, and LASSO; (10) Table S5 lists the AUC values for the logistic regression classifiers built using the SNPs reported by each of DNP-AAP, AdaBoost, and LASSO. (PDF 394 kb)
NCBI identifiers. This is a text (.txt) file with NCBI identifiers of the raw reads of 676 N. gonorrhoeae strains used and analyzed in this study. URLs at NCBI corresponding to those identifiers are also given. (TXT 45 kb)