Abstract
Receptor Interacting Protein Kinase 1 (RIPK1) is a key regulator of innate immune signalling pathways. To ensure an optimal inflammatory response, RIPK1 is post-translationally regulated by well characterised ubiquitylation and phosphorylation events, as well as caspase-8 mediated cleavage1–7. The physiological relevance of this cleavage remains unclear, though it is believed to inhibit activation of RIPK3 and necroptosis8. Here we show that heterozygous missense mutations p.D324N, p.D324H and p.D324Y prevent caspase cleavage of RIPK1 in humans and result in early-onset periodic fever episodes and severe intermittent lymphadenopathy, a condition we designate ‘Cleavage-resistant RIPK1-Induced Autoinflammatory’ (CRIA) syndrome. To define the mechanism for this disease we generated a cleavage-resistant Ripk1D325A mutant mouse strain. While Ripk1-/- mice die postnatally from systemic inflammation, Ripk1D325A/D325A mice died during embryogenesis. Embryonic lethality was completely prevented by combined loss of Casp8 and Ripk3 but not by loss of Ripk3 or Mlkl alone. Loss of RIPK1 kinase activity also prevented Ripk1D325A/D325A embryonic lethality, however the mice died before weaning from multi organ inflammation in a RIPK3 dependent manner. Consistently, Ripk1D325A/D325A and Ripk1D325A/+ cells were hypersensitive to RIPK3 dependent TNF-induced apoptosis and necroptosis. Heterozygous Ripk1D325A/+ mice were viable and grossly normal, but were hyper-responsive to inflammatory stimuli in vivo. Our results demonstrate the importance of caspase-mediated RIPK1 cleavage during embryonic development and show that caspase cleavage of RIPK1 not only inhibits necroptosis but maintains inflammatory homeostasis throughout life.
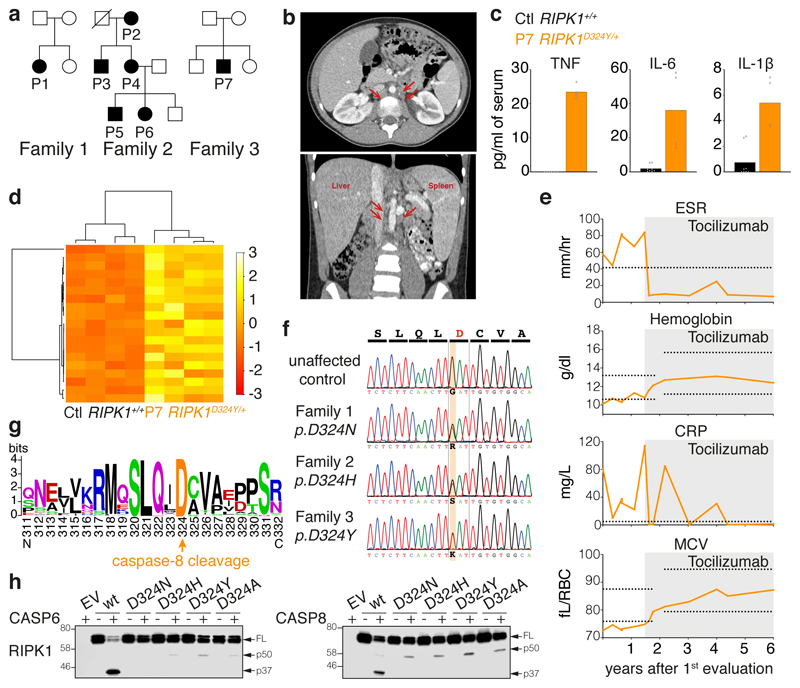
Members of three families presented with a previously undescribed autoinflammatory disorder characterised by fevers and pronounced lymphadenopathy beginning in early childhood and continuing throughout adulthood (Fig. 1a). From birth or shortly thereafter, all affected individuals experienced fevers usually occurring approximately every 2-4 weeks, lasting 1-7 days, and reaching temperatures as high as 40-41°C. Some subjects reported extreme chills, severe headaches, and/or hallucinations coincident with their fevers. These flares were accompanied by intermittent episodes of cervical, axillary, inguinal, and/or periaortic lymphadenopathy that often caused pain or discomfort (Fig. 1b, Table 1). Several individuals experienced splenomegaly and/or hepatomegaly, which were generally more prominent early in life, as well as oral ulcers, arthralgia, or gastrointestinal symptoms including abdominal pain, nausea, diarrhea, constipation, loss of appetite, or weight loss (Table 1). Patient 7 (P7) exhibited a more chronic inflammation with acute exacerbation. Subjects often had elevated inflammatory markers even during symptom-free periods. In contrast to some more severe autoinflammatory disorders, there were no signs of rash, arthritis, genital ulcers or end-stage organ damage and the condition was not life-threatening in any of the patients (Table 1).
Figure 1. Heterozygous mutations of the RIPK1 caspase-8 cleavage site cause autoinflammatory disease.
a, Affected individuals (filled symbols) in three families carried mutations in RIPK1 D324. Crossed symbol indicates a deceased individual.
b, Axial (left) and coronal (right) planes of abdominal computerized tomography scans of P1 at age 11, after 2 months on tocilizumab but prior to substantial resolution of symptoms, revealing periaortic lymphadenopathy (arrows), splenomegaly (14 cm craniocaudal length), and liver at upper limit of normal (16 cm craniocaudal length).
c, Serum cytokine levels of two P7 samples taken within 1 week, both during infliximab and prior to tocilizumab treatment, and 4 unrelated adolescent controls. Dots are from technical duplicates for each time point. Graphs show mean.
d, RNA sequencing of whole blood RNA from P7 (two time points, as in Fig. 1c) and 2 unrelated adolescent healthy controls, both with technical duplicates. Heatmap shows differentially expressed inflammatory response genes (GO:0006954). For gene names, see Supplementary Figure 1.
e, Response to tocilizumab infusion in P1. Erythrocyte Sedimentation Rate (ESR), C-Reactive Protein (CRP), hemoglobin, and Mean Corpuscular Volume (MCV) were measured serially before and after initiation of tocilizumab treatment (grey shading). X-axis denotes time following the initial evaluation of this subject at age 10 years. Horizontal lines indicate high values (ESR and CRP) or high and low values (hemoglobin and MCV) for the subject age-specific laboratory reference ranges for these markers.
f, RIPK1 DNA sequence chromatograms show heterozygous single-base substitutions.
g, Weblogo demonstrating conservation of the caspase-8 cleavage tetrapeptide motif in RIPK1 (human numbering) in 184 vertebrate species.
h, In vitro caspase assays on wild type and RIPK1 mutants. Western blots are representative of 2 independent experiments. For gel source data, see Supplementary Figure 2.
Table 1. Clinical features of CRIA syndrome patients.
Family 2 was first evaluated at NIH in 1999 for unexplained periodic fever, but the data shown here are from their first return visit after identification of their RIPK1 mutation. NA, not applicable; RF, rheumatoid factor; ANA, antinuclear antibody; ±, partial or mixed response; D, discontinued treatment after less than 1 year due to reported side effects.
| Family 1 | Family 2 | Family 3 | |||||
|---|---|---|---|---|---|---|---|
| Mutation | p.Asp324Asn | p.Asp324His | p.Asp324Tyr | ||||
| Patient number | P1 | P2 | P3 | P4 | P5 | P6 | P7 |
| Gender | F | F | M | F | M | F | M |
| Age at evaluation | 10 yrs. | 82 yrs. | 55 yrs. | 54 yrs. | 22 yrs. | 20 yrs. | 13 yrs. |
| Age at onset | 2 mos. | Birth | 2 wks. | Birth | Birth | Birth | 6 mos. |
| Recurrent fevers | + | + | + | + | + | + | + |
| Fever maximum (°C/°F) | 40.5/105 | 41/106 | 38.9/102 | 40.5/105 | 41/106 | 41/106 | 40.5105 |
| Fever frequency | 1 / 2 wks. | 1 / mo. | 1 / 3 wks. | 1 / 2 wks. | 1 / 3 wks. | 1 / 2 wks. | 1-3 / 2 wks |
| Fever duration | 3-7 days | 3 days | 3-5 days | 2-5 days | 2-5 days | 3-5 days | 1 day |
| Lymphadenopathy | + | + | + | + | + | + | + |
| Splenomegaly | + | - | - | - | + | + | + |
| Hepatomegaly | - | - | - | - | + | + | - |
| Tonsillitis | + | - | - | - | - | + | + |
| Abdominal pain | + | - | + | - | - | + | + |
| Rash | - | - | - | - | - | - | - |
| Oral ulcers | - | - | + | + | + | + | + |
| Genital ulcers | - | - | - | - | - | - | - |
| Arthritis | - | - | - | - | - | - | - |
| Arthralgia | - | - | + | - | - | + | + |
| Autoantibodies | + ANA | + RF | - | - | - | NA | - |
| Response to: | |||||||
| Prednisone | + | + | + | + | + | + | + |
| Colchicine | NA | - | - | - | - | - | - |
| Anti-IL1R | - | - | NA | - | NA | NA | - |
| Anti-TNF | - | - | NA | - | NA | NA | ± |
| Anti-IL6R | + | + | + | ± D | NA | + D | + |
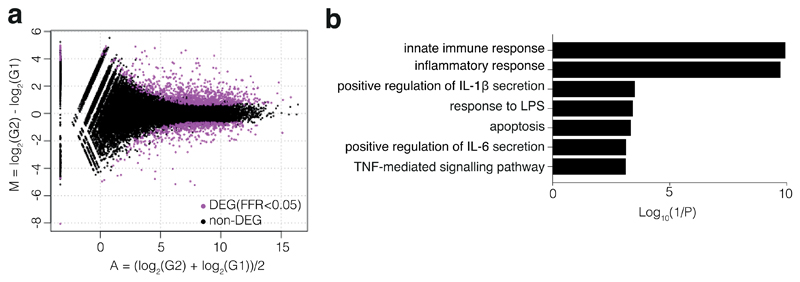
Lymphocyte counts were normal between flares in the seven affected subjects (Extended Data Table 1). However, pro-inflammatory cytokines were elevated in the serum from P7 when inflamed but not during a flare (Fig. 1c). Transcriptomic analysis from P7 whole blood RNA revealed an enrichment of several inflammatory gene signatures (Fig. 1d,Extended Data Fig. 1a, b). Affected members of family 2 had all taken prednisone during flares, with varying degrees of acute relief but without long term prevention of future episodes (Table 1). P1, P6 and P7 had tonsillitis (Table 1), but tonsillectomy did not improve symptoms. Similarly, the IL-1 receptor antagonist, anakinra, and the TNF antagonist, etanercept, did not suppress inflammation in P1, P2, P4 or P7 (Table 1). However, treatment with the IL-6 receptor antagonist tocilizumab markedly, and in some cases dramatically, reduced the severity and frequency of the symptoms of P1, P2, P3, P6 and P7 (Fig. 1e, Table 1, Extended Data Table 2a). Tocilizumab also provided some initial relief to P4, but P4 reported aggravation of pre-existing oral ulcers, while P6 reported eventual onset of hand pain, and both subjects elected to discontinue treatment (Table 1).
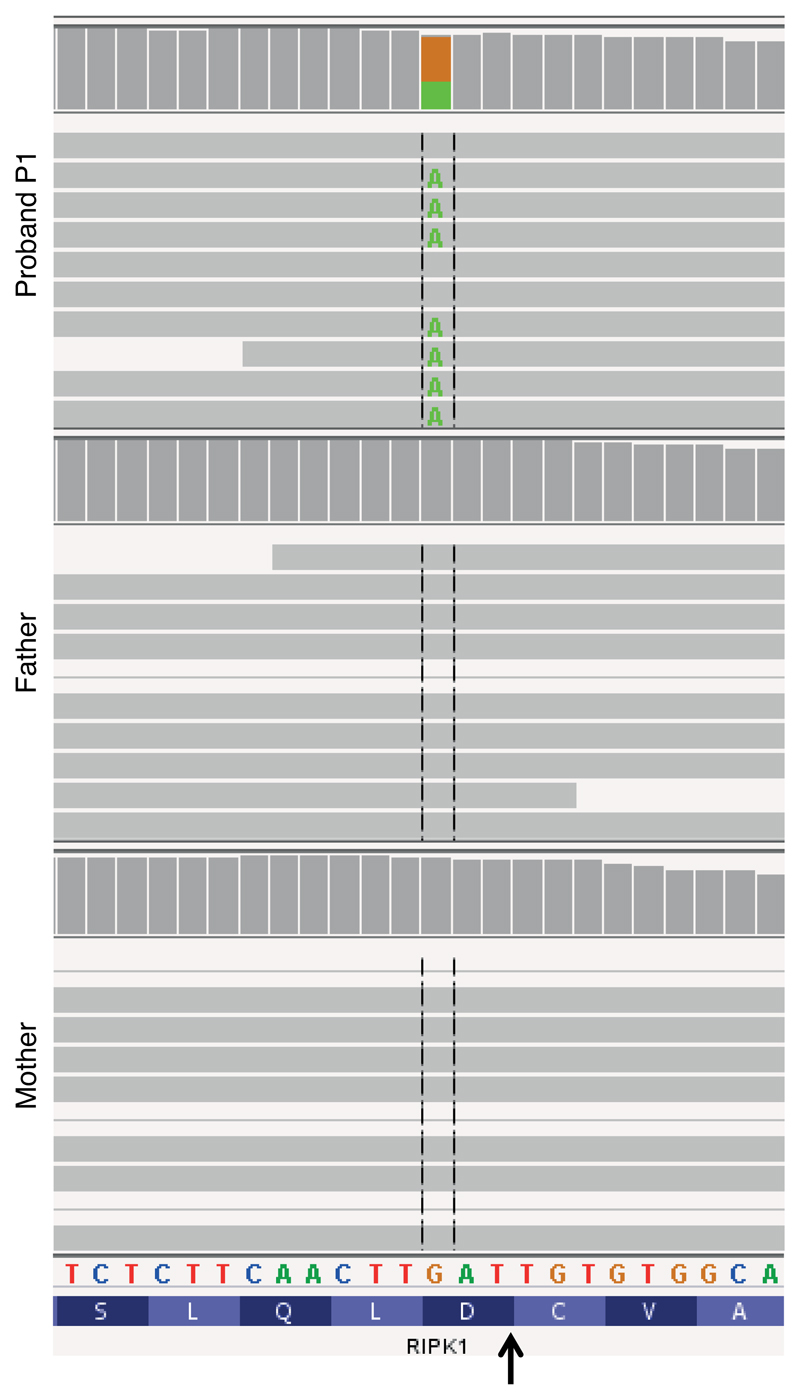
Exome sequencing in P1 and her unaffected parents and all eight members of family 2 revealed that RIPK1 was the only gene in which a variant from both families satisfied filtering criteria. A third mutation in RIPK1 was later discovered in family 3. Affected individuals from the three families had different heterozygous missense mutations at the same critical aspartate residue required for RIPK1 cleavage by caspase-8 (Fig. 1f). The mutations p.D324N and p.D324Y occurred de novo in families 1 (Extended Data Fig. 2) and 3, respectively, while p.D324H was inherited in an autosomal dominant pattern in family 2. These mutations are not reported in variant databases (Extended Data Table 2b), and none of the families had rare co-segregating coding or splice mutations in genes previously implicated in autoimmune lymphoproliferative syndrome (ALPS) or other monogenic autoinflammatory disorders. RIPK1 cleavage site mutations were not found in an additional 554 individuals with sporadic unexplained fever, lymphadenopathy, ALPS, or idiopathic Castleman disease that we screened by Sanger or targeted hybrid capture sequencing (Extended Data Table 2c). We therefore designated this condition as ‘Cleavage-resistant RIPK1-Induced Autoinflammatory’ (CRIA) syndrome.
The optimal caspase-8 cleavage motif is highly conserved in vertebrates (Fig. 1g, Extended Data Table 3). RIPK1 can be cleaved by both caspase-6 and -8 yielding products of similar size, though the caspase-6 cleavage site has not been defined9–11. Consistent with these reports, RIPK1 mutants found in the patients, as well as D324A that has previously been shown to prevent RIPK1 cleavage by caspase-8 (ref. 6), were resistant to both caspase-6 and -8 cleavage in vitro suggesting the caspase-6/8 cleavage site is the same (Fig. 1h).
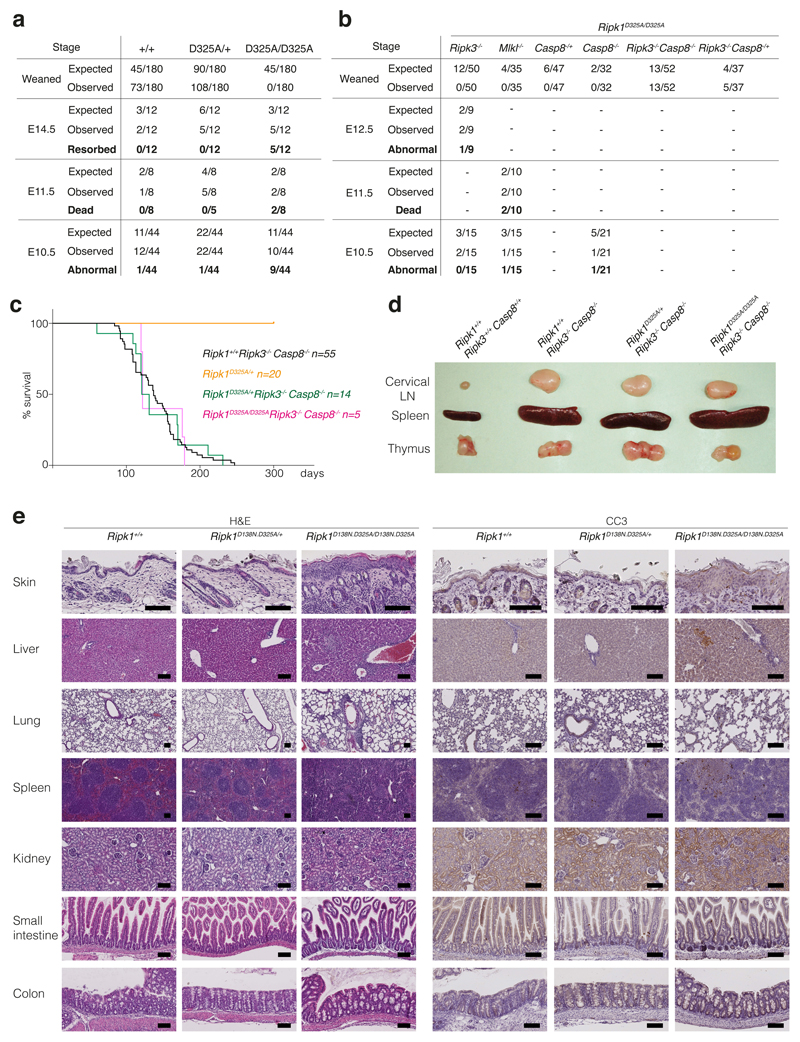
To investigate the molecular mechanism for CRIA syndrome and characterise the role of RIPK1 cleavage in vivo, we generated RIPK1 cleavage-resistant mice. Rather than choose one of the disease-associated variants we mutated the aspartate to alanine. While the heterozygous Ripk1D325A/+ mice were viable and grossly normal, the homozygous Ripk1D325A/D325A mice died mid-embryogenesis; much earlier than the postnatal lethality of the Ripk1-/- mice12–15 (Fig. 2a, Extended Data Fig. 3a). Ripk1D325A/D325A lethality occurred between embryonic day 10.5 (E10.5) and E11.5, with the embryos showing multiple sites of mild to severe hemorrhage beginning in the cephalic vascular plexus, in the the midbrain and hindbrain, but ultimately affecting the entire embryo including the pharyngeal arches and the pericardial space (Fig. 2a). At E11.5, all Ripk1D325A/D325A embryos were dead and displayed major hemorrhage in multiple locations (Fig. 2a, Extended Data Fig. 3a). E10.5 Ripk1D325A/D325A embryos had endocardial cushion hypoplasia, smaller limbs buds and a thinner neural retina (Fig. 2b). These developmental delays might be due to the defective vasculature, associated with extensive cell death observed in the yolk sac of these embryos (Fig. 2c). This phenotype was reminiscent of several strains of knock-out mice with defects in TNF signalling, including Casp8-/- mice8,16–22. The E10.5 lethality of Casp8-/- mice is TNF-dependent12, and can be prevented by loss of either Ripk3 or Mlkl8,22,23, suggesting that the lethality is due to TNF-induced activation of the necroptotic pathway that is normally inhibited by caspase-8. These findings led to the idea that cleavage of RIPK1 by caspase-8 inhibits necroptosis during embryogenesis8,22. However, Ripk1D325A/D325ARipk3-/- mice were not viable, consistent with Zhang et al.24. Nevertheless loss of RIPK3 extended survival more than MLKL loss indicating that RIPK3 plays a non-necroptotic role in the early embryonic lethality (Fig. 2d, Extended Data Fig. 3b). Combined loss of Casp8 and Ripk3 in these mice prevented the embryonic lethality, implying that caspase-8 does more than inhibit RIPK1/RIPK3/MLKL-induced necroptosis at this embryonic stage (Fig. 2d, Extended Data Fig. 3b). While loss of Ripk1 ameliorates the ALPS-like disorder observed in Casp8-/-Ripk3-/-mice8,12,13,15, lack of RIPK1 cleavage did not dramatically affect it (Extended Data Fig. 3c, d), consistent with observations in Fadd-/-Ripk3-/-Ripk1D325A/D325A mice24. Interestingly, inhibition of RIPK1 kinase activity also rescued the lethality of Ripk1D325A/D325A (Fig. 2d). However, Ripk1D138N.D325A/D138N.D325A mice were runty and did not survive past weaning (Fig. 2d, e). These mice had a multi organ inflammation presenting with skin hyperplasia, infiltration of leukocytes in the liver and the lung, disorganised splenic architecture and scattered cleaved caspase-3 positive cells in these organs (Extended Data Fig. 3e). Loss of one allele of Ripk3 or Casp8 prolonged survival of Ripk1D138N.D325A/D138N.D325A mice to 5-weeks-old and complete loss of Ripk3 rescued the inflammatory phenotype of Ripk1D138N.D325A/D138N.D325A mice (Fig. 2d, e).
Figure 2. Homozygous mutation of the RIPK1 caspase-8 cleavage site in mice causes early embryonic lethality.
a, E10.5 embryos representative of 4 embryos per genotype. FB, forebrain; MB, midbrain; HB, hindbrain; He, heart; FL, forelimb; PA, pharyngeal arches. Arrows show sites of hemorrhage. Scale bar is 900 μm for E10.5 and 1400 μm for E11.5.
b, Hematoxylin and Eosin stained section of E10.5 embryos representative of 3 embryos per genotype. Arrows show endocardial cushions (top panel) and neural retina (middle panel). Scale bar is 200 μm.
c, E10.5 yolk sacs stained with anti-PECAM-1 (cyan) and anti-cleaved caspase-3 (Cl. Casp-3; magenta) antibodies. Images with severely and less severely disrupted vasculature are shown. Scale bar is 50 μm. Images are representative of 4 embryos per genotype.
d, Diagram depicting the extent of viability of different strains of Ripk1D325A mice.
e, Representative pictures of 3 mice per genotype numbered in d.
To explore the function of RIPK1 cleavage in TNF signalling, we tested homozygous Ripk1D325A/D325A Mouse Embryonic Fibroblasts (MEFs) for their response to TNF-induced cell death. Remarkably, even though TNF is not usually cytotoxic, we found that Ripk1D325A/D325A MEFs were sensitive to TNF alone and this induced increased phosphorylation of RIPK1, as well as activation of caspase-8 when compared to wild type MEFs (Fig. 3a, b). While inhibiting caspases or RIPK3 kinase activity did not affect cell death induced by TNF, genetic loss of RIPK3 or RIPK1 kinase activity significantly reduced TNF-induced cell death (Fig. 3a, b). Interestingly, loss of RIPK3 not only completely abrogated death but also blocked RIPK1 phosphorylation and caspase activation (Fig. 3a, b).
Figure 3. Ripk1D325A/D325A and Ripk1D325A/+ cells are hypersensitive to TNF-induced death.
a, c, Cell death of MEFs monitored by time-lapse imaging over 16 hours. a, T; 100 ng/ml of TNF. c, T; 10 ng/ml of TNF, S; 100 nM of Smac-mimetic. a, c, NT; untreated, I; 5 μM of caspase-8 inhibitor, R; 1 μM of RIPK3 inhibitor, N; 10 μM of Necrostatin. Graphs are representative of 4 independent experiments performed with 2 biological repeats per genotype.
b, d, Western blot of MEFs b, treated as in (a) for 2 hours, and d, as in (c) for 2 hours. Results are representative of 2 independent experiments. β-Actin loading control performed after cleaved caspase-8. For gel source data, see Supplementary Figure 2.
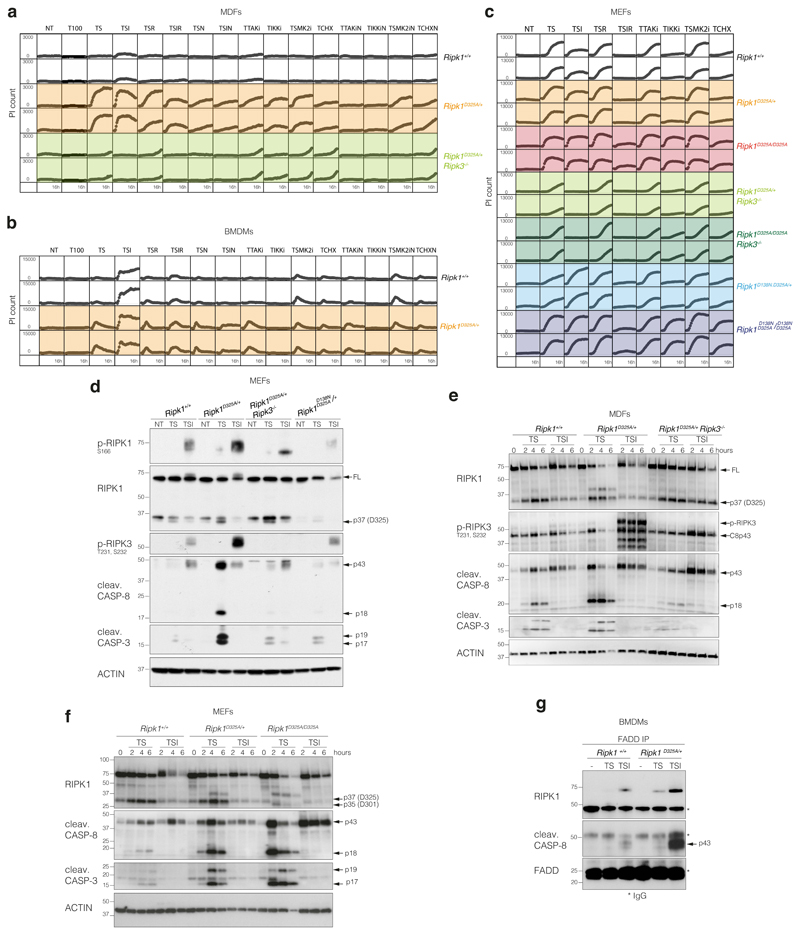
Given that the patients harbor RIPK1 mutations in only one allele, we tested the sensitivity of several Ripk1D325A/+ heterozygous cell types to TNF. In contrast to homozygote Ripk1D325A/D325A MEFs, none of the tested Ripk1D325A/+ cell types were sensitive to TNF alone (Extended Data Fig. 4a, b). However, inhibitors that directly activate the cytotoxic activity of RIPK1 (e.g. Smac-mimetic, TAK1, IKK and MK2 inhibitors)1–4,6,25,26 rapidly sensitised Ripk1D325A/+ MEFs and Mouse Dermal Fibroblasts (MDFs) to low dose TNF (Fig. 3c, Extended Data Fig. 4a, c). In contrast, only Smac-mimetic and TAK1 inhibitor sensitised Ripk1D325A/+ Bone Marrow Derived Macrophages (BMDMs) to low dose TNF (Extended Data Fig. 4b). In Ripk1D325A/D325A MEFs, TNF-induced cell death was more pronounced upon addition of IKK, TAK1 or Smac-mimetic/MK2 inhibitor (Extended Data Fig. 4c). In addition, homozygote and heterozygote Ripk1D325A MEFs and MDFs were slightly more sensitive to apoptosis induced by low dose TNF and cycloheximide (Extended Data Fig. 4a, c).
Treatment with TNF plus Smac mimetic (TS) induced a strong phosphorylation of RIPK1 and RIPK3, as well as activation of caspase-8 and -3, in Ripk1D325A/+ cells (Extended Data Fig. 4d-f) which was more pronounced in the Ripk1D325A homozygote cells (Fig. 3d, Extended Data Fig. 4f). This increase in TS-induced cell death correlated with increased formation of a RIPK1/caspase-8 containing complex 2 (Extended Data Fig. 4g).
Surprisingly, given the increase in caspase-8 activation, loss of RIPK3 dramatically delayed cell death induced by TNF plus Smac-mimetic or TAK1 or IKK or MK2 inhibitors in both Ripk1D325A homozygote and heterozygote fibroblasts (Fig. 3c, Extended Data Fig. 4a, c). In fibroblasts, loss of RIPK3 correlated with significantly reduced RIPK1 auto-phosphorylation and caspase activation upon TS treatment (Fig. 3d, Extended Data Fig. 4d, e). However, inhibition of RIPK3 kinase had little effect on the induction of cell death (Extended Data Fig. 4a-c), suggesting that RIPK3 contributes mostly in a structural capacity to the activation of caspase-8 in Ripk1D325A cells.
We next analysed both Ripk1D138N.D325A homozygote and heterozygote cells and, as expected, genetic loss of RIPK1 kinase activity prevented RIPK1 auto-phosphorylation (Fig. 3d, Extended Data Fig. 4d). It also provided some protection from cell death and this effect was mirrored by treatment with the RIPK1 inhibitor, Necrostatin (Fig. 3c, Extended Data Fig. 4a-c). Akin to RIPK3 loss, this correlated with reduced caspase-8 activation (Fig. 3d, Extended Data Fig. 4d). Taken together, these results imply that, in fibroblasts RIPK3 promotes caspase-8 activation in a manner that is independent of its kinase activity and mostly independent of RIPK1's kinase activity (Fig. 3a, b), unless RIPK1 is further activated by an activating stimulus, such as Smac-mimetic (Fig. 3c, d).
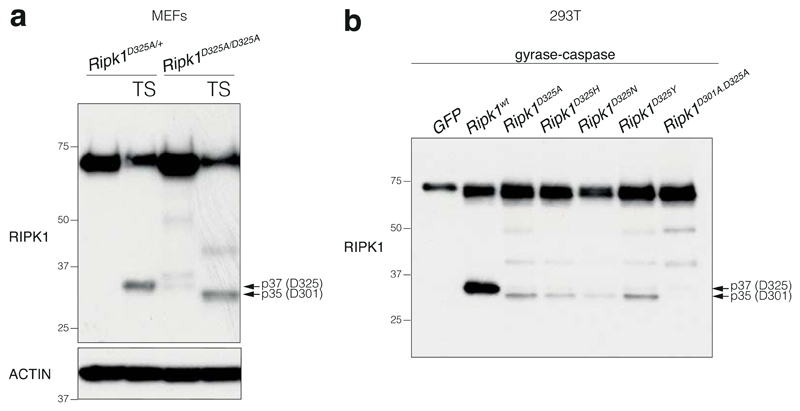
One surprising observation was that the strong activation of caspase-8 in Ripk1D325A cells led to RIPK1 cleavage (Fig. 3d, Extended Data Fig. 4d, f, 5a). In the case of the heterozygote cells this was almost certainly due to cleavage of the wild type protein, however, we also detected a slightly smaller RIPK1 cleavage product in homozygote cells (Fig. 3d, Extended Data Fig. 4f, 5a). This was the result of an alternative cleavage site (D301 in mouse) that is as well conserved as the canonical site (Extended Data Fig. 5, Extended Data Table 2b). However, possibly due to the unfavourable hydrophobic amino acid in the P1' position27, the D301 site was far less efficiently cleaved than the D325 site and only when the canonical site was mutated (Fig. 3d, Extended Data Fig. 4f, 5).
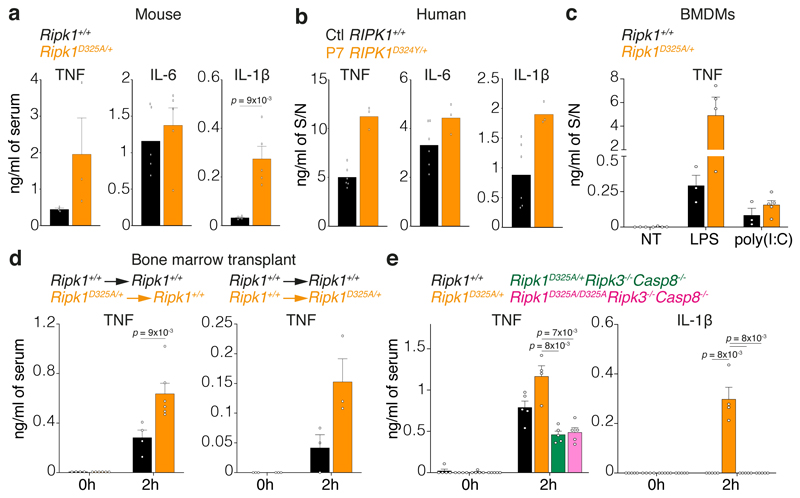
CRIA syndrome patients suffer from recurrent fevers, so to understand how loss of RIPK1 cleavage might affect the response to inflammatory stimuli, we tested the responsiveness of the Ripk1D325A/+ mice to Toll-Like Receptor (TLR) ligands. While there was not a dramatic difference in IL-6 levels, TNF and IL-1β levels were higher in the Ripk1D325A/+ sera after injection of a non-lethal dose of either LPS or poly(I:C) (Fig. 4a, Extended Data Fig. 6a). Similarly, PBMCs from P7 produced more TNF and IL-1β upon LPS or poly(I:C) (Fig. 4b, Extended Data Fig. 6b). Despite these elevated cytokine levels, hypothermia induced by LPS was not life-threatening (Extended Data Fig. 6c), which was also consistent with the symptoms of the CRIA syndrome patients. BMDMs also produced more TNF upon TLR activation (Fig. 4c), which correlated with the amount of cell death induced (Extended Data Fig. 6d).
Figure 4. RIPK1 cleavage limits inflammation in vivo.
a, Serum cytokine levels after 2 hours treatment with 2 mg/kg of LPS. Graph show mean ± SEM, n = 3 mice for TNF and n = 5 mice for IL-6 and IL-1β.
b, Cytokine levels in the supernatant (S/N) of 2 unrelated adolescent controls (Ctl RIPK1+/+) and P7 RIPK1D324Y/+ PBMCs treated for 3 hours with 10 ng/ml of LPS. Graph shows mean of triplicates.
c, TNF levels in the supernatant (S/N) of BMDMs treated for 24 hours with 25 ng/ml of LPS or with 2.5 μg/ml of poly(I:C). Graph shows mean ± SEM, n = 3 for Ripk1+/+ and n = 3-4 for Ripk1D325A/+.
d, Serum TNF levels in wild type mice reconstituted with Ripk1D325A/+ hematopoietic cells (left panel) or Ripk1D325A/+ mice reconstituted with wild type hematopoietic cells mice treated 2 hours with 2 mg/kg of LPS. Graph shows mean ± SEM, n = 3 and 4 Ripk1+/+ → Ripk1+/+, n = 6 Ripk1D325A/+ → Ripk1+/+, n = 3 for Ripk1+/+ → Ripk1D325A/+ mice/genotype.
e, Serum cytokines levels after 2 hours treatment with 2 mg/kg of LPS. Graph shows mean ± SEM, n = 4 for Ripk1D325A/+, n = 5 for the other genotypes
a, c, and e, Results are representative of 2 independent experiments. a, c, d and e, Each dot represents a mouse. a, d and e, Unpaired, two-tailed t-test.
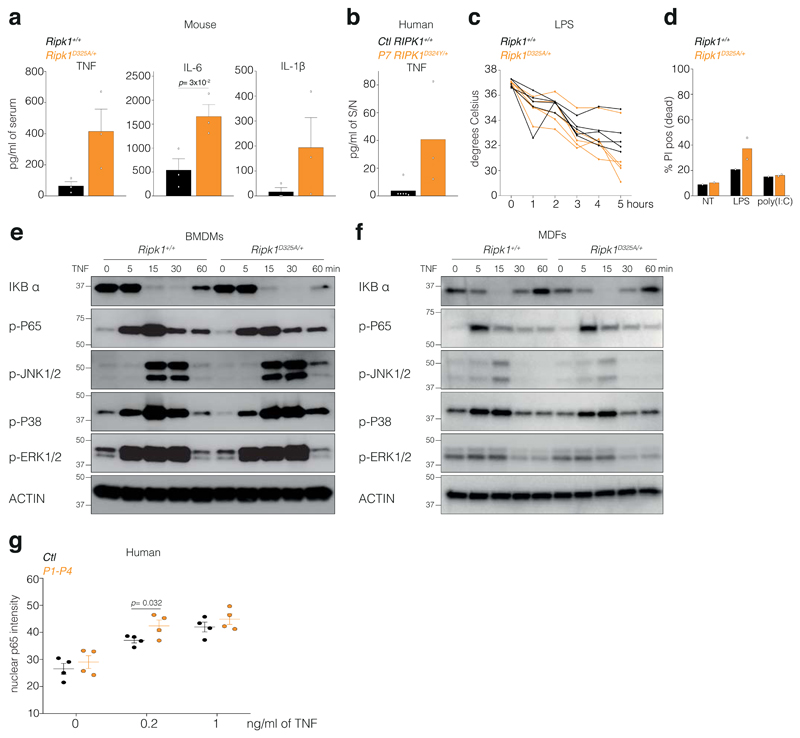
To define the contribution of the hematopoietic compartment to the hyper-inflammatory phenotype, we generated bone marrow chimeras. Interestingly, both wild type mice transplanted with Ripk1D325A/+ hematopoietic cells and Ripk1D325A/+ mice transplanted with wild type bone marrow were hyper-responsive to LPS compared with the controls (Fig. 4d). Although our data suggest that the increased inflammatory response in mice correlates with increased cell death in Ripk1D325A/+ cells, RIPK1 also contributes to the activation of NF-κB and MAPK signalling pathways14,28–30. However, loss of RIPK1 cleavage did not affect TNF-induced NF-κB or MAPK activation in either mouse cells or patient derived dermal-fibroblasts (Extended Data Fig. 6e-g). Furthermore, the cytokine increases observed in the Ripk1D325A/+ sera were dependent on RIPK3 and caspase-8, suggesting that cell death is the major contributor to cytokine induction in these mice (Fig. 4e).
RIPK1 plays a role in activating NF-κB and MAPK inflammatory pathways, caspase-8 mediated apoptosis and RIPK3-dependent necroptosis. Each of these distinct responses can contribute to inflammatory signalling and it has been difficult to disentangle which pathway causes inflammation in any given physiological situation. We describe a human autoinflammatory disorder caused by heterozygous mutations in RIPK1 seemingly constrained to a single, evolutionary conserved, aspartate residue at the caspase-6/8 cleavage site. Mutation of this key aspartate prevents caspase-6/8 cleavage of RIPK1, sensitises cells to TNF-induced cell death, and causes embryonic lethality in homozygous mice. Multiple mechanisms inhibit cell death upon TNF stimulation1–7,26,31 and our data emphasize how important this is in limiting an inflammatory response. Pathogens may counter cell death mediated inflammation by expressing caspase-8 inhibitors and a cellular defensive mechanism that amplifies the cell death response in the absence of RIPK1 cleavage makes intuitive sense, and may explain why some pathogens also attempt to cleave RIPK132,33. Previously, the presumption was that pathogen inhibition of caspase-8 unleashed the necroptotic pathway, however RIPK1 cleavage not only limits necroptosis, as previously assumed but can also limit caspase-8 mediated apoptosis. Furthermore, RIPK3 and RIPK1's kinase activity have mainly been thought of as activators of necroptosis. However, the rescue of the post-natal lethal phenotype of the Ripk1D138N.D325A mice by loss of Casp8 or Ripk3 reveals a far more complex interplay between these molecules than previously anticipated. Our data provide support for the concept of a hierarchy of preferred responses to TNF signalling: cell survival, then caspase-8-mediated apoptosis, with necroptosis as a last resort (Extended Data Fig. 7). Notably, despite the fact that most of our knowledge of RIPK1 function comes from analyses of TNF signalling, and that TNF plays a pivotal role in many inflammatory diseases, CRIA syndrome patients responded to the IL-6 inhibitor tocilizumab but failed to respond to TNF inhibitors. It will be interesting therefore to determine what role RIPK1 plays in IL-6 mediated inflammation.
Methods
Subject enrollment
Families were enrolled and evaluated in the Clinical Center at the National Institutes of Health under a protocol approved by the Institutional Review Board of the National Institute of Diabetes and Digestive and Kidney Diseases and the National Institute of Arthritis and Musculoskeletal and Skin Diseases. Human studies complied with relevant ethical regulations and all subjects provided written informed consent.
Tocilizumab treatment
P1 was 11 years old at the time of her first intravenous (IV) infusion of tocilizumab at a dose of 8 mg/kg. She initially received medication every 3 weeks but later reduced the frequency to every 4 or 5 weeks because of a busy high school schedule. On the less frequent dosing, P1 had more breakthrough symptoms, mainly tender lymphadenopathy. In 2018, when the FDA approved the use of the injectable form in children with JIA, P1 was switched to 162 mg by subcutaneous injection every 2 weeks and did very well on this regimen. P2, P3, P4, and P6 received regular self-administered tocilizumab by 162 mg subcutaneous injections starting at every 2 weeks, the standard dose and route of administration for adults. The dose frequency for P3 was gradually increased to every 6 days. P7 received an initial infusion of tocilizumab at 8 mg/kg before being switched to the subcutaneous injectable form (162 mg every 2 weeks) for convenience. On this regimen, P7 noted prompt resolution of fevers, abdominal pain, and joint pain, and gradual normalization of lab testing, including CRP, ESR, Hgb, hematologic indices and serum iron.
Exome sequencing
Exome capture (Illumina TruSeq v2 for family 1, Roche SeqCap EZ Exome+UTR for family 2, and IDT xGen Exome Research Panel for family 3) and sequencing (Illumina HiSeq 2000, 2500 and NovaSeq 6000) was performed for all available family members at the National Institutes of Health (NIH) Intramural Sequencing Center (NISC) using 2×101, 2×126, and 2x151 bp paired-end reads. The data were analyzed as follows: alignment with Novoalign; duplicate marking with Picard; re-alignment, re-calibration, and variant calling with GATK; and annotation with Annovar. Variants were filtered to select those that were nonsynonymous or in splice sites within 6 base pairs of an exon, had less than 1% mutant allele frequency in variant databases, and co-segregated with the phenotype. The mutations were validated by Sanger sequencing in all family members, and to rule out non-paternity, non-maternity, or other sample identity errors, genders and relatedness were confirmed by examining heterozygous call rates on the X chromosome, Y chromosome call rates, and Mendelian inheritance error rates in the exome data.
In vitro cleavage assays
Unlabelled in vitro transcription and translation of 1 μg of empty pCMV6-Entry control vector (Origene), wild type RIPK1 cDNA cloned into pCMV6-Entry vector (Origene), p.D324N, p.D324H, p.D324Y and p.D324A mutant RIPK1 constructs (GENEART Site-Directed Mutagenesis System, Invitrogen) was performed in a 50 μl reaction using the TnT T7 Quick Coupled Transcription/Translation System (Promega). We incubated 2 μl of this reaction with either 12 U of purified recombinant caspase-8 (Calbiochem), 12 U of purified recombinant caspase-6 (Calbiochem), or an equal volume of re-suspension buffer, in caspase reaction buffer from the Caspase-8 Fluorometric Assay Kit (Enzo Life Sciences) and 10 mM DTT in a 40 μl final volume at 37 °C for 3 hours. These reactions were blotted for RIPK1 using an antibody recognizing a RIPK1 C-terminal antibody (610459, BD Transduction Laboratories).
RNA sequencing
Total RNA was isolated from whole blood collected in PAXgene Blood RNA Tubes using PAXgene Blood RNA Kit (PreAnalytiX) per manufacturer’s instructions. Total RNA was used for cDNA library preparation using the TruSeq Stranded mRNA Library Preparation kit for NeoPrep (Illumina). Sequencing was performed on an Illumina HiSeq 3000 System in a 1 x 50 bp single read mode. Sequenced reads were mapped against the human reference genome (GRCh38) using hisat v2.2.1.034. Reads mapped to hemoglobin genes were removed from further analysis. Mapped reads were quantified using HTSeq35,36. All the count data were normalized using TCC37 and differentially expressed genes were detected using edgeR38. Gene ontology enrichment analysis was performed using DAVID36. The original RNA sequencing data is uploaded and available online (Gene Expression Omnibus: GSE127572).
Mice
All mouse studies complied with relevant ethical regulations and approved by the Walter and Eliza Hall Institute Animal Ethics Committee. The Ripk1D325A and Ripk1D138N.D325A mice were generated by the MAGEC laboratory (WEHI) on a C57BL/6J background. To generate Ripk1D325A mice 20 ng/μl of Cas9 mRNA, 10 ng/μl of sgRNA (ATTTGACCTGCTCGGAGGTA) and 40 ng/μl of oligo donor (tgtcttctcattacagAAAGAGTATCCAGATCAAAGCCCAGTGCTGCAGAGAATGTTTTCACTGCAGCATGCCTGTGTACCATTACCTCCGAGCAGGTCAAATTCAGgtaactcacctattcgttcatttgcatactcgctca) were injected into the cytoplasm of fertilized one-cell stage embryos generated from wild type C57BL/6J breeders. To generate Ripk1D138N.D325A mice 20 ng/μl of Cas9 mRNA, 10 ng/μl of sgRNA (TGACAAAGGTGTGATACACA) and 40 ng/μl of oligo donor (GGATAATCGTGGAGGCCATAGAAGGCATGTGCTACTTACATGACAAAGGTGTGATACACAAGAACCTGAAGCCTGAGAATATCCTCGTTGATCGTGACTTTCACATTAAGgtaatccacaatctg) were injected into the cytoplasm of fertilized one-cell stage embryos generated from Ripk1D325A/D325ARipk3-/-Casp8-/+ breeders. Twenty-four hours later, two-cell stage embryos were transferred into the uteri of pseudo-pregnant female mice. Viable offspring were genotyped by next-generation sequencing. Targeted animals were backcrossed twice to wild type C57BL/6J to eliminate off-target mutations and to re-integrate Ripk3 and Casp8 genes into Ripk1D138N.D325A mice. The Ripk3-/-39, Casp8-/-19 and Mlkl-/-40 mice were described previously. The Ripk3-/- mice were backcrossed to C57BL/6J mice for >10 generations.
TLR challenge
Eight to 12-week-old males received intraperitoneal injection of either 2 mg/kg LPS or 50 μg of poly(I:C). Calculations to determine group sizes were not performed, mice were not randomized but were grouped according to genotype, and experiments were blinded.
Cells
MEFs were isolated from E10.5 embryos and MDFs were isolated from mouse tails. After SV40 transformation MEFs and MDFs were tested for mycoplasma. 293T cells (ATCC) used to produce SV40 viruses and in Extended Data Fig. 5b were tested for mycoplasma but not authenticated.
Time-lapse imaging
Percentage cell death was assayed every 30-45 mins by time-lapse imaging using the IncuCyte® live cell analysis imaging (Essenbioscience) or the Opera Phenix™ High Content Screening System (PerkinElmer, USA) for 16 hours with 5%CO2 and 37°C climate control. For the IncuCyte® and Opera Phenix™ dead cells were identified by propidium iodide (PI; 0.25 μg/ml) staining and for the Opera Phenix™ all cells were stained with 250nM of SiR-DNA (Spirochrome, Switzerland). Dyes were added to the cells 2 hours before imaging and compounds were added 10 minutes before the start of imaging. For the Opera Phenix™, images were analysed using the server based Columbus 2.8.0 software (PerkinElmer, USA) to identify nuclei based on SiR-DNA staining and dead cells using PI staining. Results were exported as counts per well to be processed and graphed using R Studio (https://www.R-project.org/) with the tidyverse package (https://CRAN.R-project.org/package=tidyverse).
Human and mouse cytokines measurement
Human serum and PBMC supernatant cytokine content was measured by ELISA (R&D: SLB50, STA00C and S6050) according to the manufacturer’s instructions. The measurements were performed in technical duplicates. Student’s t-test was performed for the statistical analysis. Mouse serum and BMDMs supernatant cytokine content was measured by ELISA (eBioscience for TNF and IL-6 and R&D for IL-1β) according to the manufacturer’s instructions.
Human PBMC ex vivo stimulation
Ficoll-isolated human PBMCs were serum starved for 20 minutes and were stimulated for 3 hours with LPS (Invivogen, tlrl-3pelps) or 6 hours with poly(I:C) (Invivogen, tlrl-pic). Cytokines were measured by ELISA as described above.
Reagents
The Smac-mimetic Compound A, the caspase inhibitor IDN-6556 (Idun Pharmaceuticals) and the RIPK1 inhibitor Necrostatin were synthesized by TetraLogic Pharmaceuticals. The RIPK3 inhibitor GSK’872 was from Calbiochem. The TAK1 inhibitor (5Z)-7-Oxozeaenol, the IKK inhibitor IKK-16 and the MK2 inhibitor PF-3644022 were from Tocris Bioscience. Cycloheximide was from Sigma. Recombinant Fc-TNF was produced in house. Ultrapure LPS-EB and poly(I:C) were purchased from Invivogen.
Immunostaining
Embryonic yolk sacs were fixed for 20 minutes at room temperature in 4% paraformaldehyde, blocked and permeabilised in PBS with 2% normal donkey serum (Jackson ImmunoResearch, 017-000-121) and 0.6% triton X, probed with primary antibodies, cleaved caspase-3 (9661, CST) and PECAM1 (AF3628, R&D Systems) at 4’C overnight, then secondary antibodies goat anti-rabbit AF488 (Invitrogen A-11008) and donkey anti-goat cy3 (705-165-147, Jackson ImmunoResearch) at room temperature for 1 hour. Samples were cleared in a glycerol gradient (5%-80%) overnight, whole mounted in 80% glycerol and imaged using a DP72 microscope and cellSens Standard software (Olympus).
Immunoprecipitation
Ten million cells were seeded in 10 cm dishes. After the indicated treatments, cells were lysed in DISC lysis buffer (150 mM sodium chloride, 2 mM EDTA, 1% Triton X-100, 10% glycerol, 20 mM Tris pH 7.5). Proteins were immunoprecipitated with 20 μL of protein G Sepharose plus 1.5 μg of FADD antibody (clone 7A2, in house) with rotation overnight at 4°C. Beads were washed 4x in DISC and samples eluted by boiling in 60 μL 1x SDS loading dye.
Western blotting
Cells lysates were separated on 4-12% gradient SDS/polyacrylamide gels (Biorad), transferred to polyvinylidene fluoride (Millipore) membranes and blotted with indicated antibodies purchased from CST except for phospho-RIPK3 (Gift from Genentech), Actin (Sigma) and FADD (clone 7A2, in house). In vitro cleavage assays were blotted with a with an anti-RIPK1 antibody recognising the C-terminal part (BD Transduction Laboratories, #610459). Cell lysates were blotted with an anti-RIPK1 antibody recognising the N-terminal part (3493, Cell Signaling Technology).
NF-κB assay in patient-derived cells
NF-κB activation was assessed by measuring nuclear translocation of subunit p65 in single skin biopsy-derived fibroblasts. Cells were grown overnight in 96-well plates seeded at 16000 cells/well, and treated for 30 minutes with TNFα (PeproTech) in PBS containing 1 mM CaCl2 and 1 mM MgCl2 (PBS-CM). Cells were pre-fixed for 5 minutes with 2% paraformaldehyde (PFA) in PBS-CM, then fixed for 10 minutes with 6% PFA in PBS-CM, and aldehyde groups were quenched with 50 mM NH4Cl in PBS-CM for 15 minutes. After permeabilization with 0.3% SDS in PBS-CM for 5 minutes, cells were incubated with donkey serum dilution buffer (DSDB: 16% donkey serum, 0.3% Triton X-100, and 0.3M NaCl in PBS) for 30 minutes, followed by overnight incubation at 4°C with rabbit monoclonal NF-κB subunit p65 antibody (8242, Cell Signaling Technology) diluted at 1:500 in DSDB. Samples were then washed three times with permeabilization buffer (0.3% Triton X-100 and 0.1% BSA in PBS) and incubated with a 1:300 dilution of donkey anti-rabbit secondary antibody coupled to Alexa 488 (A21206, Molecular Probes) in DSDB for 1 hour. Nuclei were counter-stained with a 1:2000 dilution of SYTO 59 (Thermo Fisher) for 15 minutes. Automated field selection and plate imaging were performed with an IncuCyte® Zoom incubator-microscopy system (Essen Bioscience) using a 20X objective. Nine fields per well of 4 wells per subject were pooled for analysis of nuclear p65 signal intensity. Nuclei were marked in red over a phase contrast image, and p65 immunofluorescence was labelled in green. Overlaying a p65 mask on a nuclear mask showed both positive and negative nuclei, and a yellow co-staining mask showed positive nuclei only.
Extended Data
Extended Data Figure 1. Inflammatory gene signature in P7 whole blood RNA.
a, MA-plot between two P7 samples and two unrelated adolescent healthy controls, both sequenced with technical duplicates. TCC-edgeR package of R followed by adjustment for multiple comparisons detected 1394 differentially expressed genes (false discovery rate <0.05), with 903 genes upregulated in P7, and 491 genes downregulated in P7.
b, Representative gene ontology terms associated with immune signalling.
Extended Data Figure 2. Exome reads in family 1.
Excerpts of coverage histograms and aligned exome sequence reads for the proband and her parents in family 1, displayed using the Integrative Genomics Viewer, demonstrate de novo occurrence of the c.970G>A (p.D324N) missense mutation in the LXXD caspase-6/8 cleavage motif preceding the cleavage site (arrow). Paternity and maternity were confirmed using Mendelian inheritance error rates from the same exome data.
Extended Data Figure 3. ‘Kinase-dead’ RIPK1 or combined loss of Ripk3 and Casp8 rescue Ripk1D325A/D325A lethality.
a, b, Observed numbers of offspring from Ripk1D325A/+ intercrosses and numbers expected from Mendelian ratios at the indicated stage of development. Ripk1D325A/D325A mice are E10.5. All observed E11.5 Ripk1D325A/D325A embryos were dead and most of the E10.5 Ripk1D325A/D325A embryos were abnormal as described in Fig. 2a-b. Loss of Ripk3 rescued to E12.5, however 50% of the embryos were abnormal. None of the Ripk1D325A/D325ARipk3-/- mice were born. All observed E11.5 Ripk1D325A/D325AMlkl-/- embryos were dead showing that loss of Mlkl did not provide any protection. All Ripk1D325A/D325ARipk3-/-Casp8-/- mice were born and developed ALPS due to loss of Casp8.
c, Kaplan-Meyer survival curves of the indicated genotypes.
d, Cervical lymph nodes (LN), spleen and thymus of 17-week-old mice of the indicated genotypes. Picture are representative of 5 mice per genotype.
e, Tissue sections of 18 day old Ripk1D138N.D325A/+, Ripk1D138N.D325A/D138N.D325A and control mice stained with H&E (left panel) and anti-CC3 (brown, right panel). Picture are representative of 2 mice per genotype.
Extended Data Figure 4. Ripk1D325A/+ cells are hypersensitive to TNF-induced death.
a, MDFs b, BMDMs and c, MEFs of the indicated genotypes were treated with either high dose of TNF (T100; 100 ng/ml) or low dose of TNF (T; 10 ng/ml) combined with Smac-mimetic (S; 100 nM), caspase inhibitor (I; 5 μM), RIPK3 inhibitor (R; 1 μM), Necrostatin (N; 10 μM), TAK1 inhibitor (TAKi; 100 nM), IKK inhibitor (IKKi; 100 nM), MK2 inhibitor (MK2i; 2 μM) or cycloheximide (1 μg/ml) for 16 hours. Cell death was quantified by PI uptake and time-lapse imaging every 30-45 minutes by time-lapse imaging using the IncuCyte®. Graphs show PI staining over time and for each genotype duplicates are shown. Graphs are representative of three (MEFs and MDFs) and two (BMDMs) biologically independent cell lines per genotype repeated independently.
d, MEFs were treated as in Fig. 3d for 2 hours. e, MDFs and f, MEFs were treated Fig. 3d for the indicated times. d-f, results are representative of 2 independent experiments. β-Actin loading control performed after cleaved caspase-8.
g, BMDMs were treated with TNF (T; 100 ng/ml) combined with Smac-mimetic (S; 500 nM) with or without caspase inhibitor (I; 5 μM), for 90 minutes, lysates were immunoprecipitated with anti-FADD. Results are representative of 2 independent experiments.
d-g, For gel source data, see Supplementary Figure 2.
Extended Data Figure 5. Alternative cleavage of RIPK1.
a, MEFs were treated with TNF (T; 10 ng/ml) combined with Smac-mimetic (S; 500 nM) for 2 hours.
b, Inducible doxycycline caspase-8-gyrase41, mouse RIPK1 wild type and mutants constructs or GFP were co-expressed in 293T. Cells were treated for 2 hours with 1 μg/ml doxycycline to induce caspase-8-gyrase expression and then for 2 hours with 700 nM coumermycin to dimerize caspase-8-gyrase. Antibody recognising the N-terminal end of RIPK1 was used. Results are representative of 2 a, b, Results are representative of 4 (a) and 2 (b) independent experiments. For gel source data, see Supplementary Figure 2.
Extended Data Figure 6. RIPK1 cleavage limits inflammation in an NF-κB independent manner.
a, Serum cytokine levels in wild type and Ripk1D325A/+ mice treated for 3 hours with 50 μg of poly(I:C). Each dot represents a mouse. Graph shows mean ± SEM, n = 3 mice. Unpaired, two-tailed t-test.
b, TNF levels in the supernatant (S/N) of 2 unrelated adolescent controls (Ctl RIPK1+/+) and P7 RIPK1D324Y/+ PBMCs treated for 3 hours with 5 μg/ml of poly(I:C). Graph shows mean of triplicates.
c, Body temperature of mice of the indicated genotypes after injection of 2 mg/kg of LPS. Each line represent a mouse, n = 5 mice genotype.
d, BMDMs of the indicated genotypes were treated for 24 hours with 25 ng/ml of LPS or with 2.5 μg/ml of poly(I:C). Cell death was quantified with PI staining and flow cytometry. Each dot represents a biological repeat. Graph shows mean, n = 1 for Ripk1+/+ and n = 2 for Ripk1D325A/+.
e, BMDMs and f, MDFs were treated with 100 ng/ml of TNF for the indicated times. Results are representative of 2 independent experiments. β-Actin loading control performed after p-ERK1/2. For gel source data, see Supplementary Figure 2.
g, NF-κB activation in patient skin biopsy-derived fibroblasts was assessed by measuring nuclear translocation of subunit p65. Each dot represents the median of > 1000 single cell measurements of nuclear mean p65 fluorescent intensities for one individual subject. Graph shows mean ± SD n = 4 patients and 4 controls. Unpaired, one-tailed, t-test.
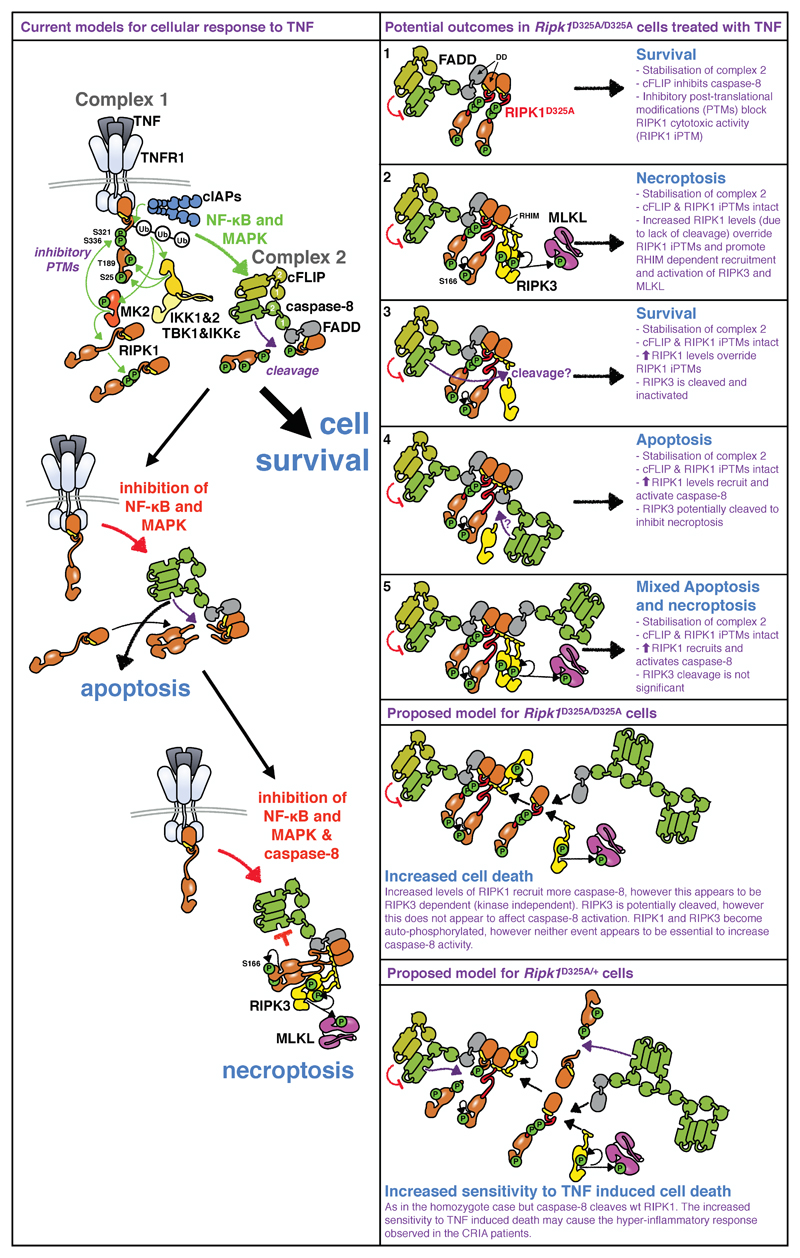
Extended Data Figure 7. Proposed model for RIPK1 D325A-induced cell death.
TNF binding to TNFR1 triggers complex I formation, in which RIPK1 is ubiquitylated and phosphorylated. These post-translational modifications (PTMs) inhibit RIPK1's cytotoxic activity. Complex I formation activates NF-κB and MAPK-dependent survival genes including cFlar encoding cFLIP. Subsequently, a cytosolic Complex II containing FADD, caspase-8, RIPK1, and cFLIP is formed. In this complex cFLIP, inhibits caspase-8 activity so that a restricted number of substrates, such as RIPK1, are cleaved, but others, such as pro-caspase-3 are not. Cleavage of RIPK1 dismantles Complex II. Activation of NF-κB and MAPK signalling pathways and PTM of RIPK1 combined prevent TNF inducing cell death (left panel top part). Inhibition of NF-κB or MAPK signalling pathways reduces cFLIP levels and accelerates formation of Complex II, and cells die through apoptosis (left panel middle part). When NF-κB/MAPK signalling is disrupted in caspase-8 deficient conditions, RIPK1 is not cleaved and auto-phosphorylates triggering the recruitment of RIPK3 and its auto-phosphorylation. RIPK3 phosphorylates MLKL and necroptosis occurs (left panel bottom part).
According to this model, lack of RIPK1 cleavage could result in several distinct outcomes. 1. it stabilises Complex II, however, the presence of cFLIP and RIPK1’s inhibitory PTMs prevent caspase-8 from killing. 2. The accumulation of ‘uncleavable’ RIPK1 recruited to Complex II overrides the inhibitory RIPK1 PTMs. RIPK1 auto-phosphorylates and recruits RIPK3 leading to necroptosis. 3. Alternatively, RIPK1 accumulation results in activated caspase-8 that cleaves RIPK3 and cells survive. 4. Or, stabilisation of Complex II results in recruitment and activation of caspase-8 that induces apoptosis and possibly prevents necroptosis by cleaving RIPK3. 5. Finally, the accumulation of RIPK1 results in activation of both RIPK3 and caspase-8 and therefore induces both an apoptotic and necroptotic cell death.
How do these potential outcomes match with our data? In homozygote Ripk1D325A cells, both caspase-8 and RIPK3 are activated upon TNF suggesting that apoptosis and necroptosis occur at the same time (Fig. 2d and Fig. 3a, b). However, surprisingly, according to these models, loss of RIPK3 limits caspase-8 activation (Fig. 3a, b). This suggests that recruitment of RIPK3 into complex II increases the recruitment and activation of caspase-8. A precedent for this observation comes from experiments utilising RIPK3 inhibitors, that were shown to promote RIPK1 dependent caspase-8 activation42,43, in a mode that we would term "reverse activation". In our experiments however RIPK3 activation occurs downstream of TNF signalling, suggesting that reverse activation might represent a physiological amplification loop that increases caspase-8 activation. Yet, this requirement for RIPK3 is not present in all cells as embryonic lethality of the RIPK1 cleavage mutant is only partially rescued by loss of Ripk3. In the heterozygote Ripk1D325A cells, caspase-8 cleaves wild type RIPK1 limiting TNF induced cell death when compared to homozygote cells. However, reduction of cFLIP and/or RIPK1’s PTM by treatment with IAP, TAK1, IKK or translational inhibitors decreases the threshold of TNF sensitivity (Extended Data Fig. 4). This may cause the hyper-inflammatory response observed in the CRIA patients (Fig. 1).
Extended Data Table 1. Leukocyte surface markers in CRIA syndrome patients.
Percentages prior to tocilizumab treatment are shown. Values above or below reference ranges are marked by carets (∧) or asterisks (*), respectively. NA, not applicable; TEMRA, T effector memory re-expressing CD45RA.
| Controls | Affected subjects | |||||||||
| Family 2 | Family 2 | Family 3 | ||||||||
| P4 spouse | P4 son | P2 | P3 | P4 | P5 | P6 | P7 | |||
| Gender | M | M | F | M | F | M | F | M | ||
| Age at evaluation | 57 | 22 | 82 | 55 | 54 | 22 | 20 | 12 | ||
| Percentage of leukocytes | range | |||||||||
| Neutrophils | [34.0-67.9] | 53.1 | 49.7 | 54.3 | 56.2 | 74.2∧ | 61.9 | 71.5∧ | 61.9 | |
| Monocytes | [5.3-12.2] | 9 | 4.5* | 10.3 | 8.1 | 6.8 | 7.9 | 10.8 | 11.6 | |
| Eosinophils | [0.8-7.0] | 3.1 | 4 | 4.5 | 4.5 | 2.2 | 4 | 2.3 | 2.7 | |
| Basophils | [0.2-1.2] | 0.4 | 0.5 | 1.2 | 1 | 0.8 | 0.6 | 0.3 | 0.06 | |
| Immature granulocytes | [0.0-0.4] | 0.4 | NA | 0.4 | 0.3 | 0.3 | 0.7∧ | 0.9∧ | 0.3 | |
| Total lymphocytes | [21.8-53.1] | 34 | 41.2 | 29.3 | 29.9 | 15.7* | 24.9 | 14.2* | 22.9 | |
| Percentage of lymphocytes | Surface markers | |||||||||
| Total T | CD3+ | [60.0-83.7] | 79.5 | 81.3 | 83.3 | 62.6 | 82.3 | 83.9∧ | 67 | 70 |
| Total helper T | CD3+CD4+ | [31.9-62.2] | 44.6 | 34.5 | 24.2* | 36.3 | 48.7 | 31.2* | 30* | 34.9 |
| Helper T, naïve | CD3+CD4+CD62L+CD45RA+ | [7.6-37.7] | 18 | 22.4 | 2.4* | 2.2* | 10.2 | 6.7* | 7.5* | 18.1 |
| Helper T, central memory | CD3+CD4+CD62L+CD45RA- | [10.4-30.7] | 18.8 | 9.2* | 17 | 25.1 | 28.4 | 17.6 | 16.7 | 13.2 |
| Helper T, effector memory | CD3+CD4+CD62L-CD45RA- | [2.3-15.6] | 7.1 | 2.8 | 4.8 | 9 | 7.4 | 6.9 | 5.8 | 3.5 |
| Helper T, TEMRA | CD3+CD4+CD62L-CD45RA+ | [0.0-1.5] | 0.7 | 0.1 | 0 | 0 | 2.6∧ | 0 | 0.1 | 3∧ |
| Total cytotoxic T | CD3+CD8+ | [11.2-34.8] | 32 | 37.5∧ | 56.9∧ | 20 | 30.2 | 37.9∧ | 31.8 | 25.9 |
| Cytotoxic T, naïve | CD3+CD8+CD62L+CD45RA+ | [5.7-19.7] | 14 | 26.6∧ | 8.3 | 4.7* | 8.5 | 14.2 | 11.4 | 15.8 |
| Cytotoxic T, central memory | CD3+CD8+CD62L+CD45RA- | [1.5-10.3] | 4.2 | 2.9 | 17.2∧ | 7.9 | 4.6 | 13.8∧ | 2.8 | 3.8 |
| Cytotoxic T, effector memory | CD3+CD8+CD62L-CD45RA- | [1.1-9.2] | 2.4 | 3.1 | 8.6 | 5.9 | 3.6 | 8.1 | 4.1 | 3.3 |
| Cytotoxic T, TEMRA | CD3+CD8+CD62L-CD45RA+ | [0.7-7.8] | 11.4∧ | 5 | 22.8∧ | 1.5 | 13.4∧ | 1.7 | 13.6∧ | 3 |
| Total double negative T | CD3+CD4-CD8- | [1.3-9.2] | 1.6 | 9.2 | 1.8 | 5.5 | 2.1 | 13.9∧ | 5 | 8.8 |
| Double negative T, αβ | CD3+CD4-CD8- | [0.3-1.3] | 0.3 | 1.4∧ | 0.3 | 0.7 | 0.6 | 2.3∧ | 1 | NA |
| Double negative T, γβ | CD3+CD4-CD8- | [0.3-7.6] | 0.9 | 7 | 0.8 | 4.1 | 1.1 | 10.7∧ | 3.3 | NA |
| Total B | CD20+ | [3.0-19.0] | 6.6 | 12.1 | 1.8* | 10.8 | 11.4 | 3.3 | 12.6 | 12.9 |
| Total B | CD19+ | [3.3-19.3] | 6.6 | 12.1 | 1.8* | 10.8 | 11.4 | 3.3 | 12.6 | 12.9 |
| Total NK | CD16+ or CD56+CD3- | [6.2-34.6] | 13.6 | 7 | 15.3 | 26.3 | 6.6 | 13 | 20 | 17.1 |
| Total NKT | CD16+ or CD56+CD3+ | [2.2-12.4] | 9.3 | 9 | 14.6∧ | 5.8 | 8.4 | 26.7∧ | 3.6 | 9.8 |
Extended Data Table 2. Effect of Tocilizumab treatment and RIPK1 caspase cleavage site mutations is absent in known auto-inflammatory diseases.
a, Inflammatory markers in subjects treated with Tocilizumab. The first time point for each subject is from three days prior to the first tocilizumab injection. P3 had two measurements from the same week at his 10-month post-tocilizumab evaluation. Reference ranges are given in brackets. ESR, Erythrocyte Sedimentation Rate; CRP, C-Reactive Protein.
b, Variant databases in which RIPK1 caspase cleavage site mutations are absent. Variant databases are not independent. NHLBI, National Heart, Lung, and Blood Institute; NHGRI, National Human Genome Research Institute; NIEHS, National Institute of Environmental Health Sciences.
c, Result of additional screening for RIPK1 caspase cleavage site mutations. ALPS, Autoimmune Lymphoproliferative Syndrome.
| a | |||
|---|---|---|---|
| Affected subject | Months on tocilizumab | ESR (mm/hr) [0-42] | CRP (mg/L) [0-4.99] |
| P2 | 0 | 50 | 30.4 |
| P2 | 12 | 7 | 0.6 |
| P3 | 0 | 8 | 3.9 |
| P3 | 10 | 2 | <0.15 |
| P3 | 10 | 1 | <0.15 |
| P3 | 34 | 2 | <0.15 |
| b |
|---|
| dbSNP v151 |
| 141,456 exomes and genomes from the Genome Aggregation Database (v2.1) |
| 77,238 exomes and genomes from the Kaviar database (September 2015 release) |
| 60,706 exomes from the Exome Aggregation Consortium (vO.3.1) |
| 32,488 exomes from the Haplotype Reference Consortium |
| 6,503 exomes from the NHLBI Exome Sequencing Project |
| 2,577 genomes from the 1000 Genomes Project (August 2015 release) |
| 662 exomes from the NHGRI ClinSeq project |
| 95 exomes from the NIEHS Environmental Genome Project |
| 69 genomes sequenced at Complete Genomics, Inc. |
| c | ||
|---|---|---|
| Phenotype | Number of subjects | RIPK1 cleavage site mutations |
| Unexplained recurrent fever | 168 | 0 |
| Lymphadenopathy | 332 | 0 |
| ALPS or ALPS-lik | 52 | 0 |
| Idiopathic Castleman disease | 2 | 0 |
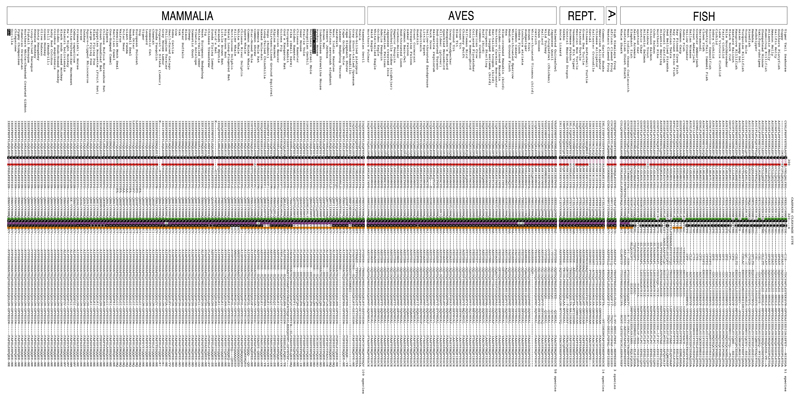
Extended Data Table 3. Conservation of RIPK1 caspase-8 cleavage site.
Protein sequences orthologous to human RIPK1 were aligned in 235 vertebrate species, using Multiz alignment in the UCSC Genome Browser. These include representative species from the major classes: 51 fish, 3 amphibians (A.), 14 reptiles (Rept.), 58 birds (Aves) and 109 mammals (Mammalia). Most species within these classes, except fish (7/51), contain the very highly conserved D324 (human numbering) caspase cleavage site within this region. Remarkably, nearly all species (223) have a potential caspase cleavage site, D300, however it is noteworthy that this Asp is in most cases succeeded by a large hydrophobic amino acid which is less favourable for caspase cleavage.
Supplementary Material
Acknowledgements
This study was funded by the Intramural Research Programs of the National Human Genome Research Institute, National Institute of Arthritis and Musculoskeletal and Skin Diseases, National Institute of Allergy and Infectious Diseases, and National Heart, Lung, and Blood Institute, by European Research Council Advanced Grant 787826 and by NHMRC grants 1025594, 1046984, 1145788 and 1162765, NHMRC fellowships 1081421 and 1107149 and was made possible through Victorian State Government Operational Infrastructure Support and Australian Government NHMRC IRIISS (9000433). NL is supported by Project grant 1145588 from the Cancer Australia and Cure Cancer Australia Foundation and the Victorian Cancer Agency Mid-career Fellowship 17030. This work utilized the sequencing resources at the NIH Intramural Sequencing Center and the computational resources of the Biowulf Linux cluster at NIH (http://biowulf.nih.gov). We thank the families for their participation, Dean Follmann for statistical advice, Thomas Uldrick and David Fajgenbaum for assistance procuring samples, and David Adams, Alejandra Negro, Avram Walts, and Yanqin Yang for clinical and technical assistance. The generation of Ripk1D325A and Ripk1D138N.D325A mice used in this study was supported by the Australian Phenomics Network (APN) and the Australian Government through the National Collaborative Research Infrastructure Strategy (NCRIS) program.
Footnotes
Authors contributions
N.L., S.E.B., and H.O. designed, performed experiments and interpreted data. G.M.W, D.C., L.L., M.S., T.K., K.E.L., K.J.MZ, N.E., K.S., C.B., W.L.T., M.D.B, H.S.K., D.Y., H.A., N.S., L.W., L.Z., N.S.P, G.G., C.H., H.W., J.J. C., N.I.D, M.M., A.L, Q.Z., I.A., J. C.M. and A.K.V. performed experiments. A.J. K., M.J. H. and M.P. generated the CRISPR mice. D.LS., P.M.H., A K. O., G.P.P., B.K. B, A.J., T.M.R., A.J.G and A.K.S. provided the clinical data. E.D.H., S.L.M., M.J.L., M.B., S.D.R. and M.G. contributed reagents, analysis and interpretation. N.L., S.E.B., D.L.K. and J.S. conceived the project and wrote the paper with input from all authors.
Competing Interests. All authors declare no competing interests
References
- 1.Bertrand MJM, et al. cIAP1 and cIAP2 facilitate cancer cell survival by functioning as E3 ligases that promote RIP1 ubiquitination. Mol Cell. 2008;30:689–700. doi: 10.1016/j.molcel.2008.05.014. [DOI] [PubMed] [Google Scholar]
- 2.Dondelinger Y, et al. MK2 phosphorylation of RIPK1 regulates TNF-mediated cell death. Nat Cell Biol. 2017;19:1237–1247. doi: 10.1038/ncb3608. [DOI] [PubMed] [Google Scholar]
- 3.Dondelinger Y, et al. NF-kappaB-Independent Role of IKKalpha/IKKbeta in Preventing RIPK1 Kinase-Dependent Apoptotic and Necroptotic Cell Death during TNF Signaling. Mol Cell. 2015;60:63–76. doi: 10.1016/j.molcel.2015.07.032. [DOI] [PubMed] [Google Scholar]
- 4.Jaco I, et al. MK2 Phosphorylates RIPK1 to Prevent TNF-Induced Cell Death. Mol Cell. 2017;66:698–710. doi: 10.1016/j.molcel.2017.05.003. [DOI] [PMC free article] [PubMed] [Google Scholar]
- 5.Feltham R, et al. Mind Bomb Regulates Cell Death during TNF Signaling by Suppressing RIPK1's Cytotoxic Potential. Cell Rep. 2018;23:470–484. doi: 10.1016/j.celrep.2018.03.054. [DOI] [PMC free article] [PubMed] [Google Scholar]
- 6.Menon MB, et al. p38(MAPK)/MK2-dependent phosphorylation controls cytotoxic RIPK1 signalling in inflammation and infection. Nat Cell Biol. 2017;19:1248–1259. doi: 10.1038/ncb3614. [DOI] [PubMed] [Google Scholar]
- 7.Lafont E, et al. TBK1 and IKKepsilon prevent TNF-induced cell death by RIPK1 phosphorylation. Nat Cell Biol. 2018;20:1389–1399. doi: 10.1038/s41556-018-0229-6. [DOI] [PMC free article] [PubMed] [Google Scholar]
- 8.Oberst A, et al. Catalytic activity of the caspase-8-FLIP(L) complex inhibits RIPK3-dependent necrosis. Nature. 2011;471:363–367. doi: 10.1038/nature09852. [DOI] [PMC free article] [PubMed] [Google Scholar]
- 9.Kim JW, Choi EJ, Joe CO. Activation of death-inducing signaling complex (DISC) by pro-apoptotic C-terminal fragment of RIP. Oncogene. 2000;19:4491–4499. doi: 10.1038/sj.onc.1203796. [DOI] [PubMed] [Google Scholar]
- 10.Lin Y, Devin A, Rodriguez Y, Liu ZG. Cleavage of the death domain kinase RIP by caspase-8 prompts TNF-induced apoptosis. Genes Dev. 1999;13:2514–2526. doi: 10.1101/gad.13.19.2514. [DOI] [PMC free article] [PubMed] [Google Scholar]
- 11.van Raam BJ, Ehrnhoefer DE, Hayden MR, Salvesen GS. Intrinsic cleavage of receptor-interacting protein kinase-1 by caspase-6. Cell Death Differ. 2013;20:86–96. doi: 10.1038/cdd.2012.98. [DOI] [PMC free article] [PubMed] [Google Scholar]
- 12.Dillon CP, et al. RIPK1 blocks early postnatal lethality mediated by caspase-8 and RIPK3. Cell. 2014;157:1189–1202. doi: 10.1016/j.cell.2014.04.018. [DOI] [PMC free article] [PubMed] [Google Scholar]
- 13.Kaiser WJ, et al. RIP1 suppresses innate immune necrotic as well as apoptotic cell death during mammalian parturition. Proc Natl Acad Sci U S A. 2014;111:7753–7758. doi: 10.1073/pnas.1401857111. [DOI] [PMC free article] [PubMed] [Google Scholar]
- 14.Kelliher MA, et al. The death domain kinase RIP mediates the TNF-induced NF-kappaB signal. Immunity. 1998;8:297–303. doi: 10.1016/s1074-7613(00)80535-x. [DOI] [PubMed] [Google Scholar]
- 15.Rickard JA, et al. RIPK1 regulates RIPK3-MLKL-driven systemic inflammation and emergency hematopoiesis. Cell. 2014;157:1175–1188. doi: 10.1016/j.cell.2014.04.019. [DOI] [PubMed] [Google Scholar]
- 16.Moulin M, et al. IAPs limit activation of RIP kinases by TNF receptor 1 during development. EMBO J. 2012;31:1679–1691. doi: 10.1038/emboj.2012.18. [DOI] [PMC free article] [PubMed] [Google Scholar]
- 17.Peltzer N, et al. LUBAC is essential for embryogenesis by preventing cell death and enabling haematopoiesis. Nature. 2018;557:112–117. doi: 10.1038/s41586-018-0064-8. [DOI] [PMC free article] [PubMed] [Google Scholar]
- 18.Peltzer N, et al. HOIP Deficiency Causes Embryonic Lethality by Aberrant TNFR1-Mediated Endothelial Cell Death. Cell Rep. 2014;9:153–165. doi: 10.1016/j.celrep.2014.08.066. [DOI] [PubMed] [Google Scholar]
- 19.Varfolomeev EE, et al. Targeted disruption of the mouse Caspase 8 gene ablates cell death induction by the TNF receptors, Fas/Apo1, and DR3 and is lethal prenatally. Immunity. 1998;9:267–276. doi: 10.1016/s1074-7613(00)80609-3. [DOI] [PubMed] [Google Scholar]
- 20.Yeh WC, et al. FADD: essential for embryo development and signaling from some, but not all, inducers of apoptosis. Science. 1998;279:1954–1958. doi: 10.1126/science.279.5358.1954. [DOI] [PubMed] [Google Scholar]
- 21.Yeh WC, et al. Requirement for Casper (c-FLIP) in regulation of death receptor-induced apoptosis and embryonic development. Immunity. 2000;12:633–642. doi: 10.1016/s1074-7613(00)80214-9. [DOI] [PubMed] [Google Scholar]
- 22.Kaiser WJ, et al. RIP3 mediates the embryonic lethality of caspase-8-deficient mice. Nature. 2011;471:368–372. doi: 10.1038/nature09857. [DOI] [PMC free article] [PubMed] [Google Scholar]
- 23.Alvarez-Diaz S, et al. The Pseudokinase MLKL and the Kinase RIPK3 Have Distinct Roles in Autoimmune Disease Caused by Loss of Death-Receptor-Induced Apoptosis. Immunity. 2016;45:513–526. doi: 10.1016/j.immuni.2016.07.016. [DOI] [PMC free article] [PubMed] [Google Scholar]
- 24.Zhang X, Dowling JP, Zhang J. RIPK1 can mediate apoptosis in addition to necroptosis during embryonic development. Cell Death Dis. 2019;10:245. doi: 10.1038/s41419-019-1490-8. [DOI] [PMC free article] [PubMed] [Google Scholar]
- 25.Dondelinger Y, et al. Serine 25 phosphorylation inhibits RIPK1 kinase-dependent cell death in models of infection and inflammation. Nat Commun. 2019;10:1729. doi: 10.1038/s41467-019-09690-0. [DOI] [PMC free article] [PubMed] [Google Scholar]
- 26.Geng J, et al. Regulation of RIPK1 activation by TAK1-mediated phosphorylation dictates apoptosis and necroptosis. Nat Commun. 2017;8:359. doi: 10.1038/s41467-017-00406-w. [DOI] [PMC free article] [PubMed] [Google Scholar]
- 27.Stennicke HR, Salvesen GS. Catalytic properties of the caspases. Cell Death Differ. 1999;6:1054–1059. doi: 10.1038/sj.cdd.4400599. [DOI] [PubMed] [Google Scholar]
- 28.Wong WW, et al. RIPK1 is not essential for TNFR1-induced activation of NF-kappaB. Cell Death Differ. 2010;17:482–487. doi: 10.1038/cdd.2009.178. [DOI] [PubMed] [Google Scholar]
- 29.Newton K, et al. RIPK1 inhibits ZBP1-driven necroptosis during development. Nature. 2016;540:129–133. doi: 10.1038/nature20559. [DOI] [PubMed] [Google Scholar]
- 30.Cuchet-Lourenco D, et al. Biallelic RIPK1 mutations in humans cause severe immunodeficiency, arthritis, and intestinal inflammation. Science. 2018;361:810–813. doi: 10.1126/science.aar2641. [DOI] [PMC free article] [PubMed] [Google Scholar]
- 31.Micheau O, Lens S, Gaide O, Alevizopoulos K, Tschopp J. NF-kappaB signals induce the expression of c-FLIP. Mol Cell Biol. 2001;21:5299–5305. doi: 10.1128/MCB.21.16.5299-5305.2001. [DOI] [PMC free article] [PubMed] [Google Scholar]
- 32.Croft SN, Walker EJ, Ghildyal R. Human Rhinovirus 3C protease cleaves RIPK1, concurrent with caspase 8 activation. Sci Rep. 2018;8:1569. doi: 10.1038/s41598-018-19839-4. [DOI] [PMC free article] [PubMed] [Google Scholar]
- 33.Pearson JS, et al. EspL is a bacterial cysteine protease effector that cleaves RHIM proteins to block necroptosis and inflammation. Nat Microbiol. 2017;2:16258. doi: 10.1038/nmicrobiol.2016.258. [DOI] [PMC free article] [PubMed] [Google Scholar]
- 34.Kim D, Langmead B, Salzberg SL. HISAT: a fast spliced aligner with low memory requirements. Nat Methods. 2015;12:357–360. doi: 10.1038/nmeth.3317. [DOI] [PMC free article] [PubMed] [Google Scholar]
- 35.Anders S, Pyl PT, Huber W. HTSeq--a Python framework to work with high-throughput sequencing data. Bioinformatics. 2015;31:166–169. doi: 10.1093/bioinformatics/btu638. [DOI] [PMC free article] [PubMed] [Google Scholar]
- 36.Huang da W, Sherman BT, Lempicki RA. Systematic and integrative analysis of large gene lists using DAVID bioinformatics resources. Nat Protoc. 2009;4:44–57. doi: 10.1038/nprot.2008.211. [DOI] [PubMed] [Google Scholar]
- 37.Sun J, Nishiyama T, Shimizu K, Kadota K. TCC: an R package for comparing tag count data with robust normalization strategies. BMC Bioinformatics. 2013;14 doi: 10.1186/1471-2105-14-219. [DOI] [PMC free article] [PubMed] [Google Scholar]
- 38.Robinson MD, McCarthy DJ, Smyth GK. edgeR: a Bioconductor package for differential expression analysis of digital gene expression data. Bioinformatics. 2010;26:139–140. doi: 10.1093/bioinformatics/btp616. [DOI] [PMC free article] [PubMed] [Google Scholar]
- 39.Newton K, Sun X, Dixit VM. Kinase RIP3 is dispensable for normal NF-kappa Bs, signaling by the B-cell and T-cell receptors, tumor necrosis factor receptor 1, and Toll-like receptors 2 and 4. Mol Cell Biol. 2004;24:1464–1469. doi: 10.1128/MCB.24.4.1464-1469.2004. [DOI] [PMC free article] [PubMed] [Google Scholar]
- 40.Murphy JM, et al. The pseudokinase MLKL mediates necroptosis via a molecular switch mechanism. Immunity. 2013;39:443–453. doi: 10.1016/j.immuni.2013.06.018. [DOI] [PubMed] [Google Scholar]
- 41.Conos SA, Lawlor KE, Vaux DL, Vince JE, Lindqvist LM. Cell death is not essential for caspase-1-mediated interleukin-1beta activation and secretion. Cell Death Differ. 2016;23:1827–1838. doi: 10.1038/cdd.2016.69. [DOI] [PMC free article] [PubMed] [Google Scholar]
- 42.Mandal P, et al. RIP3 induces apoptosis independent of pronecrotic kinase activity. Mol Cell. 2014;56:481–495. doi: 10.1016/j.molcel.2014.10.021. [DOI] [PMC free article] [PubMed] [Google Scholar]
- 43.Newton K, et al. Activity of protein kinase RIPK3 determines whether cells die by necroptosis or apoptosis. Science. 2014;343:1357–1360. doi: 10.1126/science.1249361. [DOI] [PubMed] [Google Scholar]
Associated Data
This section collects any data citations, data availability statements, or supplementary materials included in this article.


