Abstract
Patients with acute myeloid leukaemia (AML) often achieve remission after therapy, but sub-sequently die of relapse1 that is driven by chemotherapy-resistant leukaemic stem cells (LSCs)2,3. LSCs are defined by their capacity to initiate leukaemia in immunocompromised mice4. However, this precludes analyses of their interaction with lymphocytes as components of anti-tumour immunity, which LSCs must escape to induce cancer5. Here we demonstrate that stemness and immune evasion are closely intertwined in AML. Using xenografts of human AML as well as syngeneic mouse models of leukaemia, we show that ligands of the danger detector NKG2D—a critical mediator of anti-tumour immunity by cytotoxic lymphocytes, such as NK cells6–9—are generally expressed on bulk AML cells but not on LSCs. AML cells with LSC properties can be isolated by their lack of expression of NKG2D ligands (NKG2DLs) in both CD34-expressing and non-CD34-expressing cases of AML. AML cells that express NKG2DLs are cleared by NK cells, whereas NKG2DL-negative leukaemic cells isolated from the same individual escape cell killing by NK cells. These NKG2DL-negative AML cells show an immature morphology, display molecular and functional stemness characteristics, and can initiate serially re-transplantable leukaemia and survive chemotherapy in patient-derived xenotransplant models. Mechanistically, poly-ADP-ribose polymerase 1 (PARP1) represses expression of NKG2DLs. Genetic or pharmacologic inhibition of PARP1 induces NKG2DLs on the LSC surface but not on healthy or pre-leukaemic cells. Treatment with PARP1 inhibitors, followed by transfer of polyclonal NK cells, suppresses leukaemogenesis in patient-derived xenotransplant models. In summary, our data link the LSC concept to immune escape and provide a strong rationale for targeting therapy-resistant LSCs by PARP1 inhibition, which renders them amenable to control by NK cells in vivo.
Keywords: acute myeloid leukaemia, AML, leukaemia stem cells, leukaemia-initiating cells, NK cells, immune escape, immunosurveillance, NKG2D, PARP
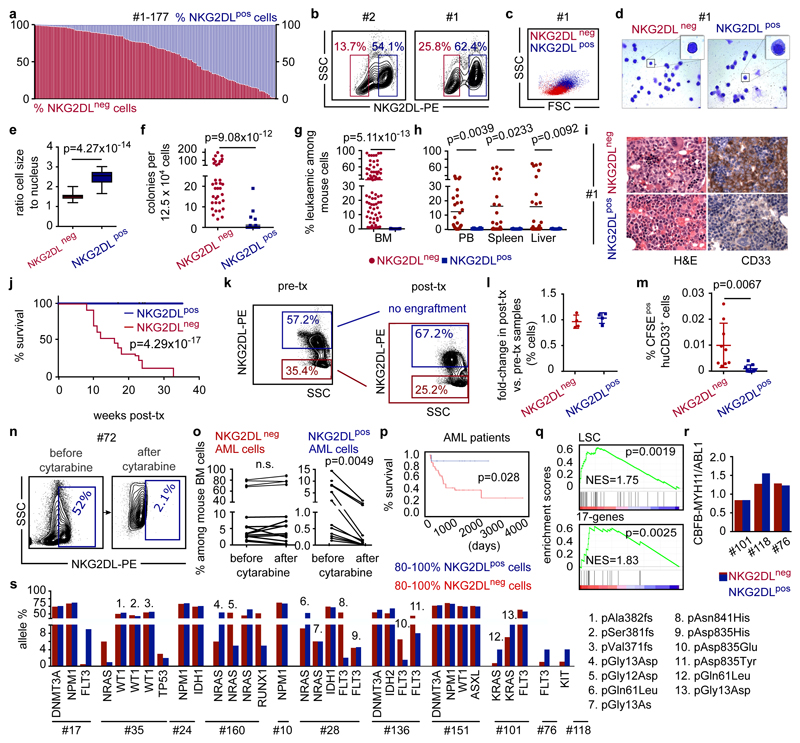
The immunoreceptor NKG2D is expressed by cytotoxic lymphocytes and recognizes stress-induced ligands of the MIC and ULBP families on target cells8,9. We screened 177 patients with AML (Supplementary Table 1) for expression of individual NKG2DLs (MICA, MICB, ULBP1 and ULBP2, ULBP5 or ULBP6), and by using a NKG2D–Fc chimeric protein to simultaneously study these and—potentially—as yet unknown NKG2DLs. Beyond the reported variation in patterns of expression of NKG2DLs among different cases of AML10, we also detected considerable heterogeneity in AML cells derived from individual patients (Fig. 1a, b, Extended Data Fig. 1a). Comparison of intra-patient NKG2DL+ and NKG2DL− subpopulations of AML cells revealed that NKG2DL− AML cells are smaller, with less granularity and lower cell-to-nucleus size ratio (Fig. 1c–e, Extended Data Fig. 1b, c). They show enhanced in vitro clonogenicity (42 ± 39 versus 1 ± 3 colonies; Fig. 1f, Extended Data Fig. 1d) and a highly specific ability to repopulate NOD.Cg-Prkdcscid IL2rgtmWjl/SzJ (NSG) mice in primary and secondary transplantation assays (Fig. 1g–j, Extended Data Fig. 2a–d). Mice transplanted with NKG2DL−, but not with corresponding NKG2DL+, AML cells showed leukaemic infiltration of the bone marrow and other organs (n = 19 AML samples; NKG2DL− cells, 64 engrafted out of 70 transplanted mice (91%); NKG2DL+ cells, 0 engrafted out of 78 transplanted mice (0%)) (Fig. 1g–i, Extended Data Fig. 2a–d) as well as reduced overall survival (Fig. 1j). NKG2D–Fc staining did not bias these results (Extended Data Fig. 2e–g). Notably, NKG2DL− cells generated both NKG2DL− and NKG2DL+ progeny in engrafted mice (Fig. 1k, l), but the latter progeny remained non-leukaemogenic (Extended Data Fig. 2b, c). The ability of NKG2DL+ AML cells to home to the bone marrow was reduced tenfold (0.001 ± 0.002% versus 0.01 ± 0.009% human leukaemic among mouse bone marrow cells; Fig. 1m) and these cells also did not engraft after direct injection into the bone marrow (Extended Data Fig. 2d, Supplementary Table 2).
Figure 1. Absence of immunostimulatory NKG2DLs identifies chemotherapy-resistant LSCs.
a, Flow cytometry analysis using NKG2D– Fc to determine percentages of NKG2DL− (red) and NKG2DL+ (blue) AML cells in 177 cases of AML (Supplementary Table 1). b–m, NKG2DL− and NKG2DL+ subpopulations of AML cells are sorted from the same patients, and analysed side-by-side using equal cell numbers. b, Representative examples of the gating strategy. c, Representative examples of forward and sideward scatter plots. d, Representative examples of May–Grünwald– Giemsa staining. e, f, Quantification of cell-to-nucleus size ratio (e) (n = 50 cells quantified for each subpopulation, n = 5 cases of AML; boxes represent median and 25th–75th percentiles, whiskers are minimum to maximum) and in vitro colony formation (f) (means of technical triplicates, n = 38 cases of AML). g–i, Long-term engraftment in NSG mice. Flow cytometry of mouse bone marrow (BM) (g; n = 18 cases of AML), and peripheral blood (PB) and organs (h; n = 10 cases of AML). Each dot represents one mouse. i, Representative bone marrow histopathology images. Left, haematoxylin and eosin (H&E); right, anti-CD33, 630× magnification, n = 5 cases of AML, n = 3 mice per group). j, Kaplan–Meier survival analyses. Transplanted mice per case of AML for NKG2DL− cells: 5 for no. 1, 6, 7, 8, 12 and 110; 4 for no. 34; 3 for no. 76, 111, 119, 133 and 168; 2 for no. 72. Transplanted mice per case of AML for NKG2DL+ cells: 7 for no. 76; 6 for no. 110; 5 for no. 1, 6, 7, 8 and 12; 3 for no. 72, 111, 133 and 168; 4 for no. 34 and 119. k, l, Quantification of NKG2DL− and NKG2DL+ AML cells from engrafted mice (post-transplantation) compared to corresponding patient-derived samples (pre-transplantation). Representative plots (k) and summarized results (l) (no. 1, 7 and 8, n = 3; no. 6, n = 4 mice per subpopulation). m, Percentage of CFSE-labelled human CD33+ AML cells that home to the bone marrow (each dot represents 1 mouse, n = 3 mice per subpopulation, n = 3 cases of AML). n, o, Mice engrafted with AML cells were treated with cytarabine (1 mg subcutaneously daily, for 2 to 4 days), and percentages of NKG2DL− and NKG2DL+ AML cells analysed in the mouse bone marrow before and after treatment. n, Exemplary results. o, n = 8 cases of AML. Connected dots depict percentages of NKG2DL− (left) and NKG2DL+ (right) AML cells before and after treatment in one mouse. p, Correlation of surface expression of NKG2DLs and overall survival in patients with AML (≤65 years old with ≥ 80 NKG2DL+ (n = 10) versus ≥ 80% NKG2DL− cells (n = 32)). q–s, LSC, 17-gene stemness signatures and leukaemia-specific genetic aberrations in NKG2DL− versus NKG2DL+ cells. q, Gene-expression array and GSEA analyses (no. 1, 6, 7, 8 and 12). r, Quantitative PCR with reverse transcription (qRT–PCR). s, Targeted next-generation sequencing. e–h, m, Mann–Whitney U test. j, p, log-rank (Mantel–Cox) test. o, Wilcoxon test. q, Nominal P value and normalized enrichment score (NES). Except in o, statistical tests were two-sided. Centre values in f–h and l–m represent mean, error bars represent s.d.
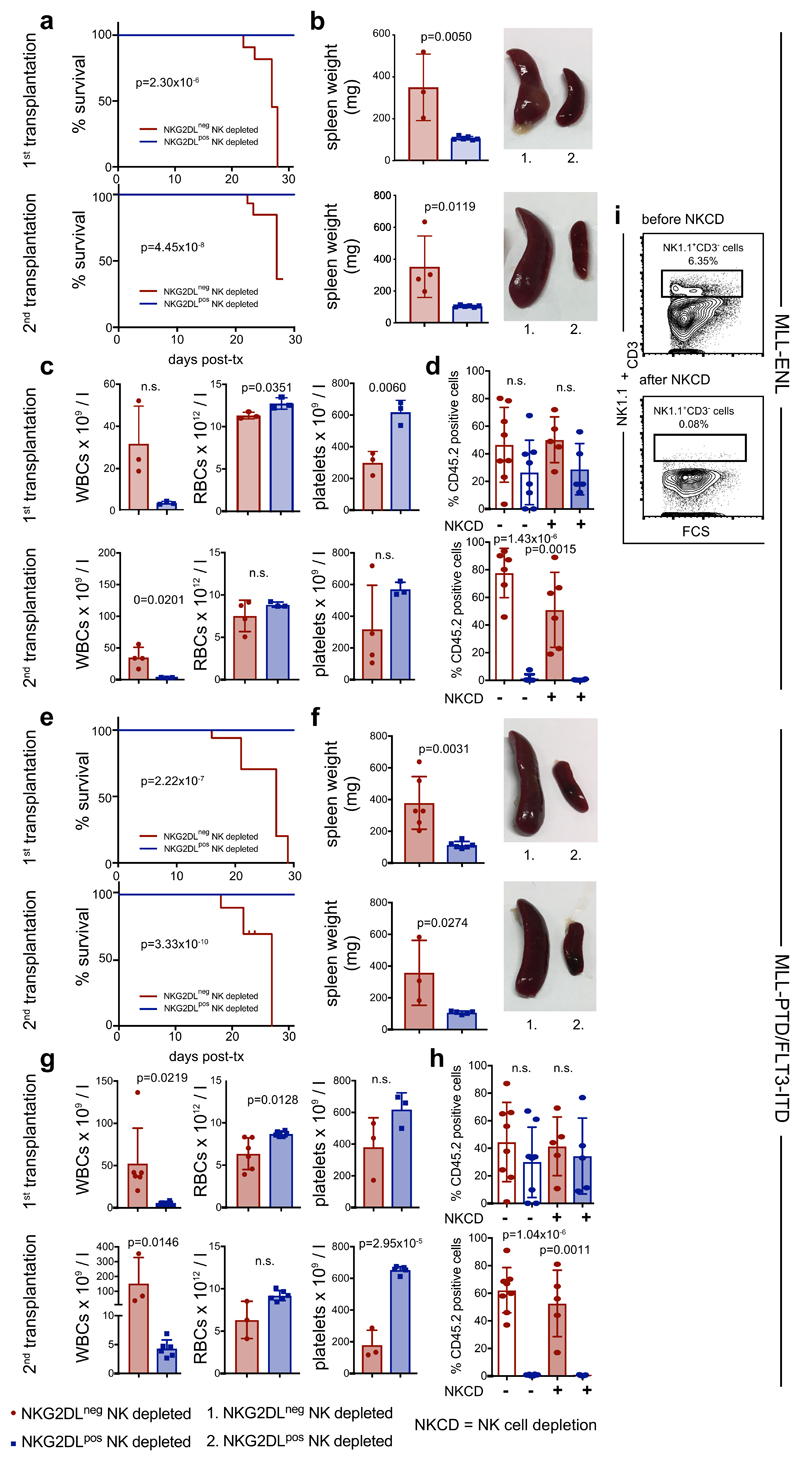
In mice engrafted with AML cells, in vivo treatment with cytarabine reduced infiltration of the bone marrow by NKG2DL+, but not NKG2DL−, AML cells (Fig. 1n, o), which indicates that the latter are more resistant to chemotherapy. Consistently, higher proportions of NKG2DL+ cells in patients with AML associated with favourable molecular risk, better response to induction chemotherapy and improved overall survival (Fig. 1p, Extended Data Fig. 3). Molecular expression analyses revealed enrichment of the established LSC, haematopoietic stem cell and 17-gene stemness signatures (see Methods) in NKG2DL− cells. By contrast, the common lineage-committed progenitor signature was enriched in corresponding NKG2DL+ fractions (Fig. 1q, Extended Data Fig. 1e). Notably, this was not due to differences in leukaemia-specific genetic aberrations in NKG2DL− compared to NKG2DL+ AML cells (Fig. 1r, s). In mice, healthy bone marrow cells lacked expression of NKG2DLs, and pre-leukaemic Dnmt3a or Tet2 mutations were insufficient to induce expression of NKG2DLs (Extended Data Fig. 4a, b). However, the Mll-Enl (Mll is also known as Kmt2a; Enl is also known as Mllt1) and Mll-ptd/Flt3-ITD mouse models of leukaemia (see Methods) contained both NKG2DL− and NKG2DL+ subpopulations of leukaemic cells (Extended Data Fig. 4a, b); in these models, increased colony-forming activity and selective capacity for the induction of leukaemia in vivo were again confined to NKG2DL− cells (Extended Data Fig. 4d–n), despite the fact that both subpopulations express the genetic leukaemic driver (Extended Data Fig. 4c). In vivo depletion experiments of NK cells confirmed that the NKG2DL+ subpopulations are non-leukaemogenic even in the absence of surveillance by NK cells (Extended Data Fig. 5).
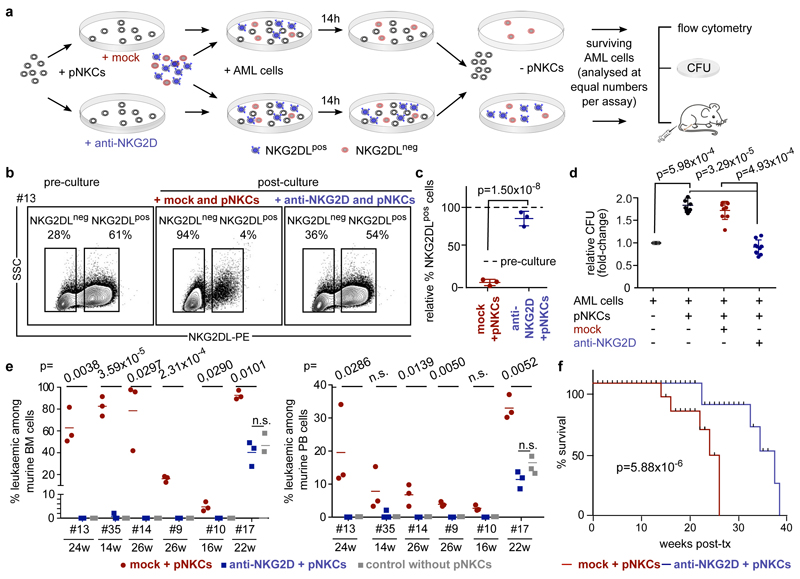
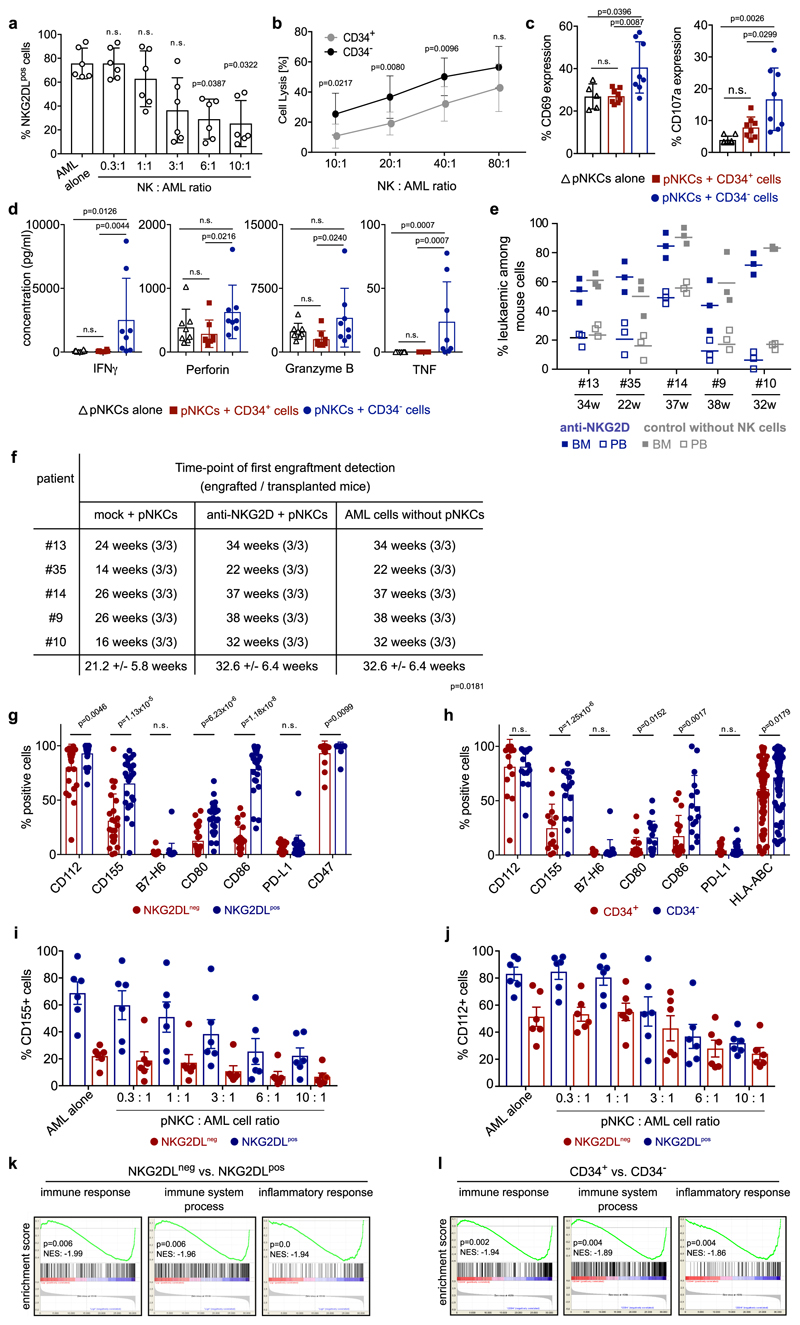
Co-cultivation of bulk AML cells with polyclonal NK cells (pNKCs) preferentially reduced NKG2DL+ cells, and thereby enriched for NKG2DL− leukaemic cells (Fig. 2a–c, Extended Data Fig. 6a). Notably, this effect was abrogated by NKG2D blockade (Fig. 2b, c;7 ± 3% versus 82 ± 9% NKG2DL+ cells, compared to pre-culture conditions). Non-LSCs were preferentially recognized by pNKCs and triggered the respective effector functions of the NK cells (Extended Data Fig. 6b–d). Consistently, in vitro co-culture with pNKCs alone, or pNKCs pretreated with isotype control (mock), enriched for AML cells with increased clonogenicity, as compared to control cultures without pNKCs or with NKG2D-blocked pNKCs (Fig. 2d). When transplanted at identical numbers into NSG mice, AML cells from cultures with unblocked pNKCs engrafted 10 ± 1.5 weeks faster and reduced mouse survival (Fig. 2e, f, Extended Data Fig. 6e, f). These data show that NKG2DL+ AML cells without LSC activity are preferentially targeted by pNKCs. In co-cultures with NKG2D-blocked pNKCs (or without pNKCs), these NKG2DL+ cells dilute NKG2DL− LSCs within the analysed fixed-cell number, and thereby delay engraftment11. LSCs also display reduced expression of ligands (CD112 and CD155) for the activating NK receptor DNAM-1, of the co-stimulatory molecules CD80 and CD86, and of HLA-ABC (Extended Data Fig. 6g, h)12. Co-culture with pNKCs selectively reduced CD155+ and CD112+ sub-populations of AML cells (Extended Data Fig. 6i, j), as observed for NKG2DL+ cells (Fig. 2b, c, Extended Data Fig. 6a). Finally, gene-set enrichment analysis (GSEA) revealed the depletion of immune and inflammatory response-associated gene signatures in LSCs (Extended Data Fig. 6k, l). Together, these results demonstrate that LSCs are immune-privileged (as they evade killing by NK cells) and indicate that mechanisms beyond the absence of expression of NKG2DLs may contribute to the immune evasion abilities of LSCs.
Figure 2. NK cells preferentially lyse non-LSCs.
a–f, AML cells cultured alone or with pNKCs (10/1 pNKC/AML ratio) pre-treated with isotype control (mock + pNKCs, red) or blocking anti-NKG2D F(ab′)2 6H7 (anti-NKG2D + pNKCs, blue) were analysed. a, Schematic overview. b, Representative flow cytometry analysis. c, Quantification showing percentages of NKG2DL+ AML cells in mock- and anti-NKG2D-treated groups relative to corresponding pre-culture cells (n = 3 cases of AML). d, Quantification of colony numbers (means of technical triplicates, n = 9 cases of AML). e, f, In vivo engraftment in NSG mice obtained with AML cells from different conditions (n = 3 mice per patientand condition; n = 6 cases of AML; each dot or square represents one mouse). Leukaemic engraftment at time of first leukaemia detection (e, bone marrow, left; peripheral blood, right) and survival (f, Kaplan– Meier survival analysis) in mice transplanted with AML cells from mock + pNKCs (red) or anti-NKG2D + pNKCs (blue) co-cultures. Centre values represent mean, error bars represent s.d. log-rank (Mantel–Cox) testwithn=18miceperarm(n=3percasesofAMLandgroup) performed in f; two-sided Student’s t-test performed in c–e.
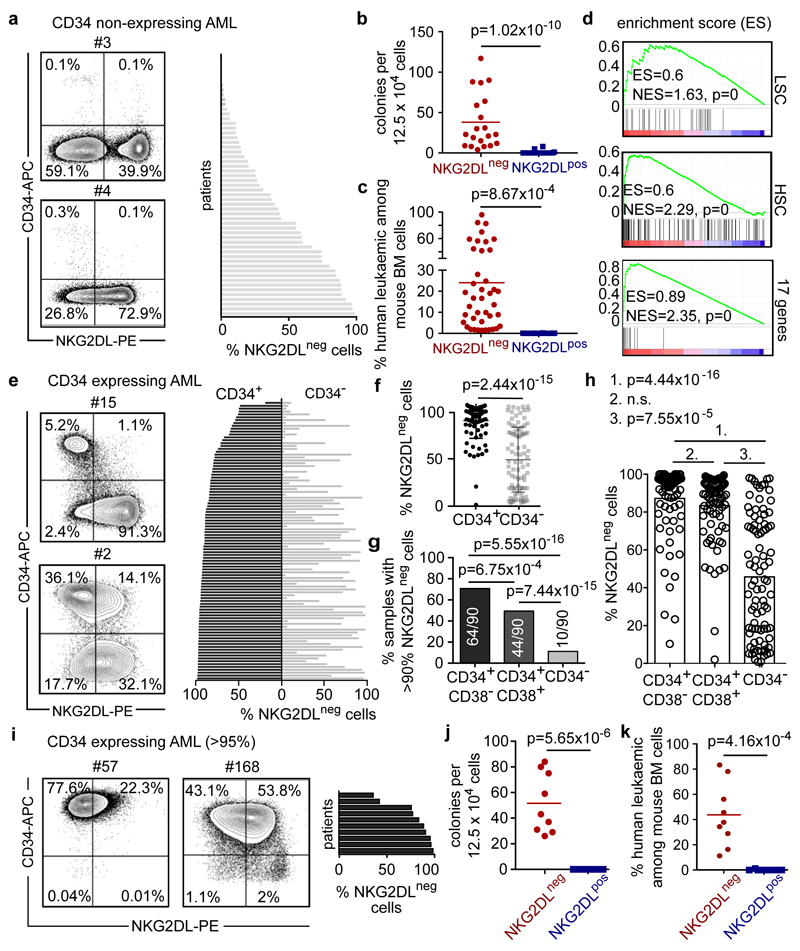
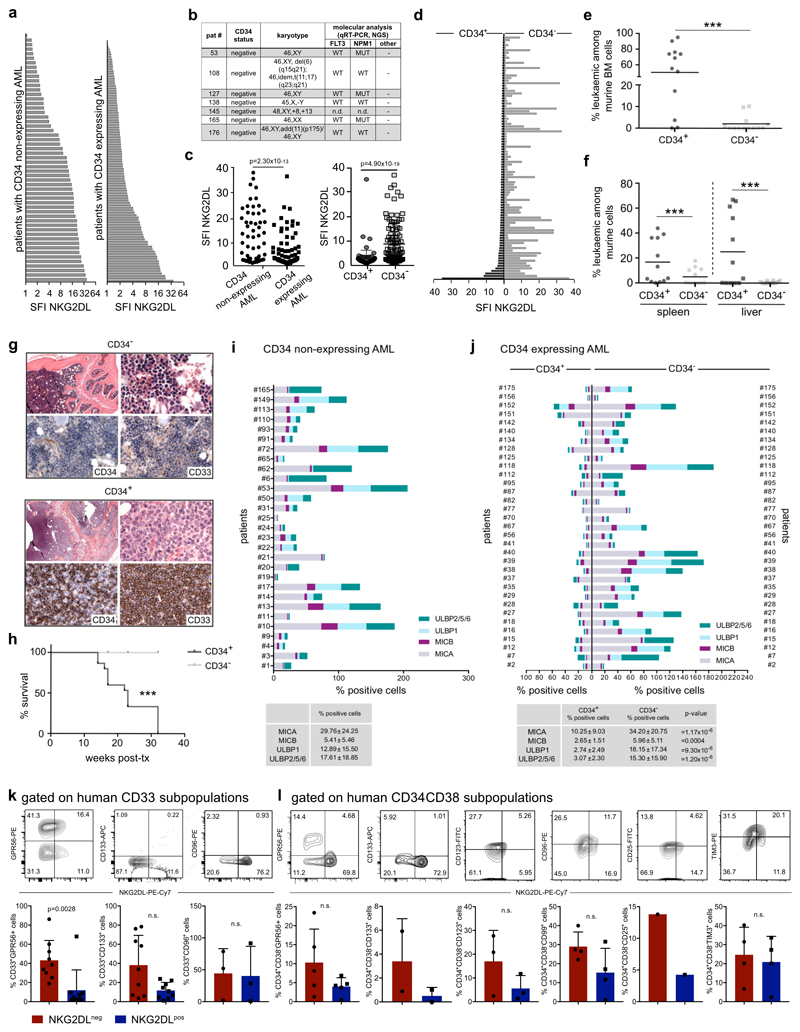
LSCs reside predominantly within CD34 subpopulations of AML cells4, among which they can be further enriched on the basis of CD38 negativity and other surface markers13. LSCs are particularly under-studied in the approximately 30% of cases of AML in which CD34 expression is low or absent (termed non-CD34-expressing AML)14,15. We analysed 57 of these cases and observed a heterogeneous intra-patient distribution of NKG2DLs, with overall higher expression levels compared to CD34-expressing AML (Fig. 3a, Extended Data Fig. 7a–j). CD34−NKG2DL− AML cells showed higher clonogenicity (42 ± 31 colonies versus 0.4 ± 1.1; Fig. 3b), selective in vivo engraftment (35 engrafted out of 40 transplanted mice for CD34−NKG2DL− subpopulations, versus 0 engrafted out of 43 transplanted mice for CD34−NKG2DL+ subpopulations; n = 11 cases of AML) (Fig. 3c) and enriched stemness signatures (Fig. 3d) compared to counter-parts that express NKG2DLs. In CD34-expressing AML, CD34+ (CD38−) subpopulations that contain LSCs (Extended Data Fig. 7d–h, Supplementary Fig. 4) displayed lower levels of NKG2DLs as compared to CD34+CD38+ or CD34− (non-stem) subpopulations of AML cells (Fig. 3e–h, Extended Data Fig. 7c, d, j). Similar associations were observed for GPR56 (ref. 16) and other markers that have previously been reported to enrich LSCs (Extended Data Fig. 7k, l)13. In AML samples that display ubiquitous expression of CD34 (Fig. 3i), being positive for NKG2DLs identified non-clonogenic, non-leukaemogenic CD34+NKG2DL+ cells (Fig. 3j, k), consistent with the notion that not all CD34+ AML cells are LSCs. By contrast, some cases of AML contained >99% NKG2DL+ leukaemic cells (Extended Data Fig. 7b), and we cannot exclude that NKG2DL+ LSCs exist. These data highlight NKG2D–Fc staining as a method to prospectively enrich LSCs in AML, irrespective of whether CD34 is expressed.
Figure 3. Absence of NKG2DLs identifies LSCs in both non-CD34-expressing and CD34- expressing cases of AML.
a–d, Non-CD34- expressing cases of AML. a, Representative flow cytometry plots and percentages of NKG2DL− cells among total AML cells in 57 patients (Supplementary Table 1). b, Comparison of NKG2DL− and corresponding NKG2DL+ AML cells with respect to colony formation (mean of technical triplicates for each patient and subpopulation, n = 11 cases of AML). c, Engraftment in NSG mice (percentages of leukaemic cells among bone marrow cells; each dot represents one mouse; NKG2DL−, n = 5 for no. 110;n=4forno.13and34;n=3forno.9,10,11,33and133;NKG2DL, n = 6 for no. 110; n = 4 for no. 10, 13 and 34; n = 3 for no. 9, 11, 33, 72 and 133). d, LSC, haematopoietic stem cell (HSC) and 17-gene signatures (GSEA, biological triplicates for each subpopulation; no. 9, 10, 11, 33 and 34). e–h, CD34-expressing cases of AML. e, Representative flow cytometry plots. f, Percentages of NKG2DL− cells among CD34− and corresponding CD34+ subpopulations of AML cells in 107 patients (see Extended Data Fig. 7b, c, f, Supplementary Table 1). g, h, Quantification of AML samples containing >90% NKG2DL− cells within CD34+CD38−, CD34+CD38+ and CD34− subpopulations (g) and of NKG2DL− cells within these same subpopulations (h). i–k, Cases of AML with ubiquitous CD34 expression: CD34+NKG2DL− and CD34+NKG2DL+ subpopulations of AML cells are analysed as in a–c. i, Expression of NKG2DLs. Representative flow cytometry plots and results for n = 10 cases of AML. j, Colony assays. n = 3 biological replicates in technical triplicates each, n = 3 cases of AML, statistics performed on summarized replicates. k, In vivo leukaemogenesis. Each dot represents 1 mouse, n = 3 mice per subpopulation, n = 3 cases of AML. b, c, k, Two-sided Mann–Whitney U test. j, Two-sided Student’s t-test. f–h, Two-sided Wilcoxon test. d, Nominal P value and NES. Centre values represent mean, error bars represent s.d.
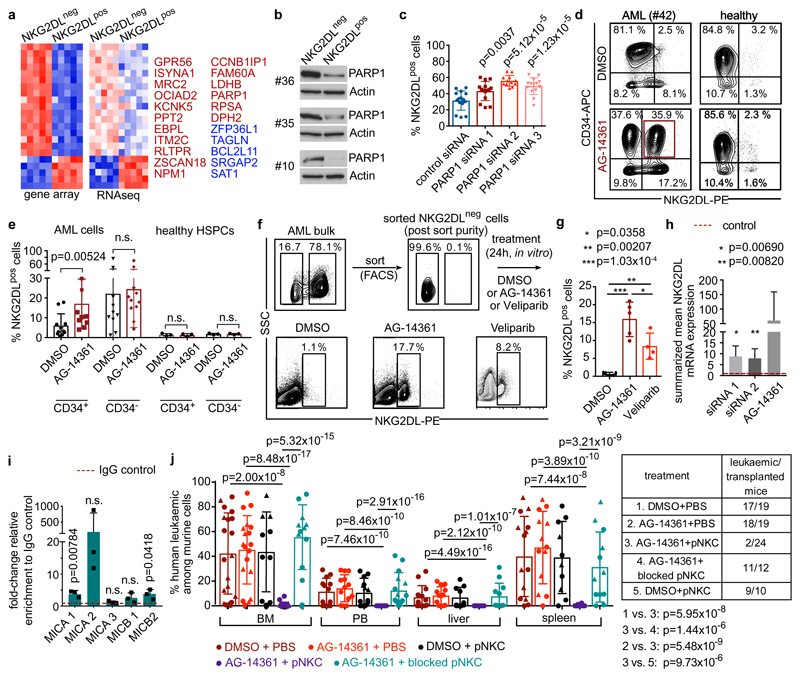
Comparison of NKG2DL− and corresponding NKG2DL+ sub-populations by gene-expression arrays and RNA sequencing (RNA-seq) revealed 22 commonly differentially regulated genes. Among these was the gene that encodes the PARP1 enzyme, which was expressed at higher levels in the NKG2DL− subpopulation (Fig. 4a, Supplementary Tables 3–5). We analysed PARP1 further because of its role in the DNA damage response17, a process that is linked to the induction of NKG2DL18, and because of its involvement in the regulation of apoptosis, senescence, the cell cycle and differentiation in AML cells19–21. Moreover, we found that the high expression of PARP1 was associated with poor outcome in patients with AML (Extended Data Fig. 8a).
Figure 4. PARP1 expression represses NKG2DLs in LSCs and contributes to their selective escape from immune surveillance by NK cells.
a, Differentially regulated genes in NKG2DL− versus NKG2DL+ cells (gene-expression arrays, no. 1, 6, 7, 8 and 12; RNA-seq, no. 9, 10, 11, 33 and 34; colour-coded z-score). FAM60A is also known as SINHCAF; GPR56 is also known as ADGRG1; RLTPR is also known as CARMIL2. b, Immunoblots showing expression of PARP1 protein and loading control in NKG2DL− and corresponding NKG2DL+ subpopulations of AML cells. Cropped images; for additional patients and full images see Extended Data Fig. 8b, c, Supplementary Fig. 1. c–e, In vitro PARP1 inhibition. Quantifications of NKG2DL+ percentages after treatment with PARP1 siRNAs versus control siRNAs (c, n = 4 cases of AML), and AG-14361 (20 μM) versus DMSO (0.2%) treatment (d, representative staining, no. 42; e, summarized quantification, bulk cells from n = 18 cases of AML, n = 3 healthy CD34+ cord blood cells; mean of technical triplicates). HSPCs, haematopoietic stem and progenitor cells. f, g, Analysis of induction of NKG2DLs on sorted NKG2DL− AML cells after treatment with AG-14361 (20 μM), the PARP inhibitor veliparib (1 μM) or DMSO control (0.2%). Representative results (f, no. 35) and quantification (g, each dot represents the average of technical replicates; n = 5 cases of AML). h, Summarized relative NKG2DL mRNAs in PARP1-inhibited versus control-treated bulk AML cells (PARP1 versus control siRNAs: no. 4 and 151; AG-14361 (20 μM) versus DMSO (0.2%), 3 cases of AML). See Extended Data Fig. 9f for analyses of single NKG2DLs. i, Chromatin immunoprecipitation analysis illustrating direct recruitment of PARP1 to the MICA and MICB promoter (biological triplicates, n = 3 cases of AML). j, NSG mice transplanted with bulk AML cells (1.5 × 10⁶ cells per mouse) were treated with AG-14361 or DMSO (days 1–5) ± pNKCs (1.5 × 10⁷ cells per mouse on day 6) and investigated for long-term induction of leukaemia. Summarized flow cytometry data in bone marrow, peripheral blood and organs are shown. Each dot represents one mouse; n = 5 biological experiments with AML cells from no. 35 (triangles) and no. 42 (circles) and NK cells from n = 5 donors. For numbers, see table on the right. Centre values represent mean, error bars represent s.d. c, One-way analysis of variance (ANOVA). e, i, Two-sided Mann–Whitney U test. g, Two-sided Student’s t-test. j, Left, two-way ANOVA; right, Fisher’s exact test.
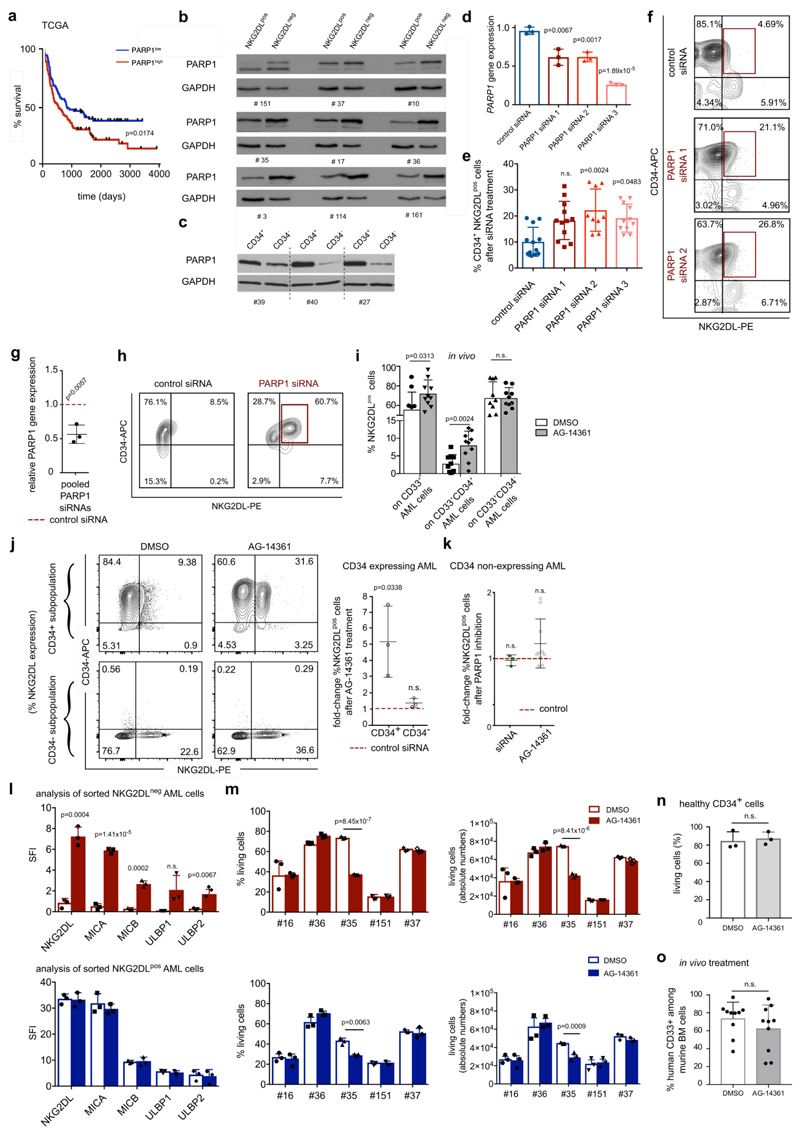
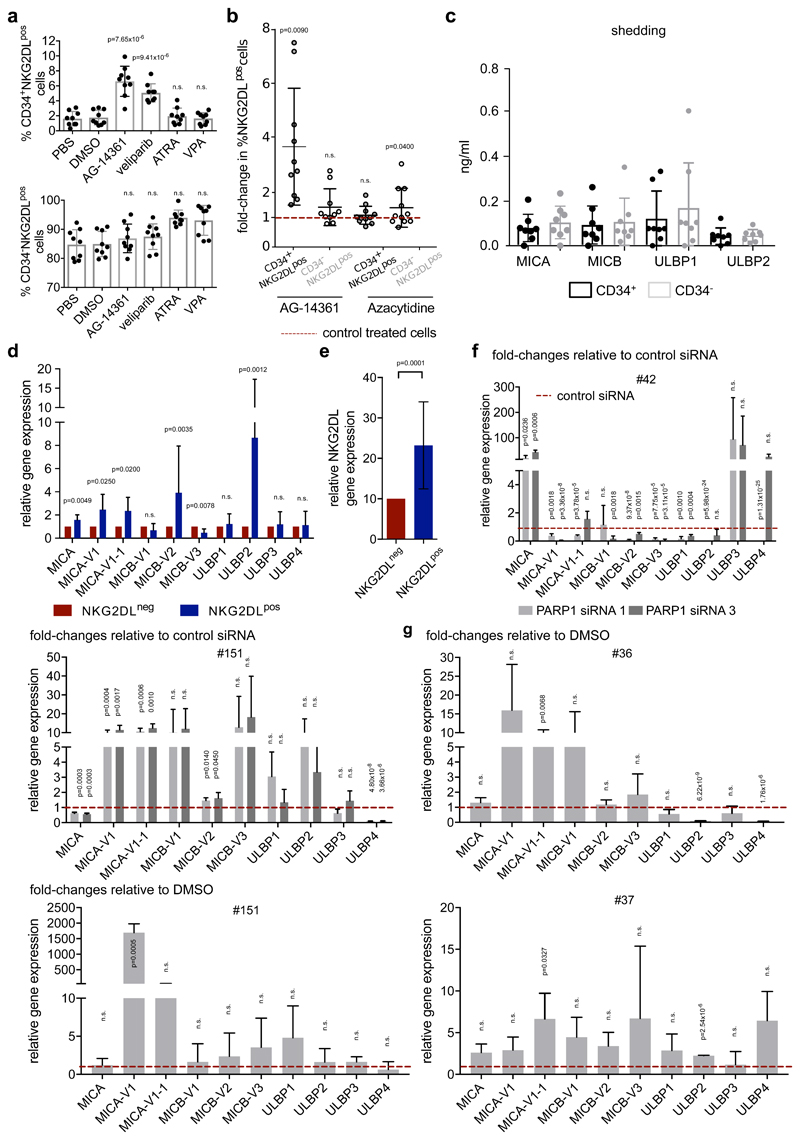
Immunoblotting confirmed increased expression of the PARP1 protein in NKG2DL− and CD34+ subpopulations of AML cells (Fig. 4b, Extended Data Fig. 8b, c, Supplementary Table 6). Genetic or pharmacological inhibition of PARP1 induced expression of NKG2DLs on the surface of CD34+ AML cells, but not healthy haematopoietic stem and progenitor cells (Fig. 4d–g, Extended Data Fig. 8d–l). PARP1 inhibition specifically promoted the emergence of CD34+NKG2DL+ AML cells in treated bulk—as well as pre-sorted CD34+ (Extended Data Fig. 8j) or NKG2DL− (Fig. 4f, g, Extended Data Fig. 8l)—AML cells. This apparently did not affect cell viability or in vivo leukaemic burden (Extended Data Fig. 8m–o). By contrast, other compounds that have previously been reported to induce NKG2DLs8,22, such as retinoic acid, valproic acid or 5-azacytidine, did not promote the emergence of CD34+NKG2DL+ cells (Extended Data Fig. 9a, b).
NKG2DLs are regulated both transcriptionally and post-transcriptionally (for example, by shedding from the cell surface23). We did not observe a difference in release of NKG2DLs between CD34+ LSC enriched cells and corresponding CD34− non-LSCs (Extended Data Fig. 9c), but NKG2DL AML cells showed higher levels of expression of NKG2DL mRNAs than NKG2DL− counterparts (Extended Data Fig. 9d, e). Treatment with small interfering (si) RNAs targeting PARP1, or treatment with the PARP1 inhibitor AG-14361, robustly induced NKG2DL transcripts between 6- and more than 50-fold (Fig. 4h, Extended Data Fig. 9f, g). PARP1-binding sites were identified by in silico analysis in NKG2DL promoters (Supplementary Fig. 5), and binding was confirmed by chromatin immunoprecipitation (Fig. 4i). Together, these data suggest that increased expression of PARP1 in LSCs selectively represses transcription of NKG2DLs, which can be reverted by PARP inhibition.
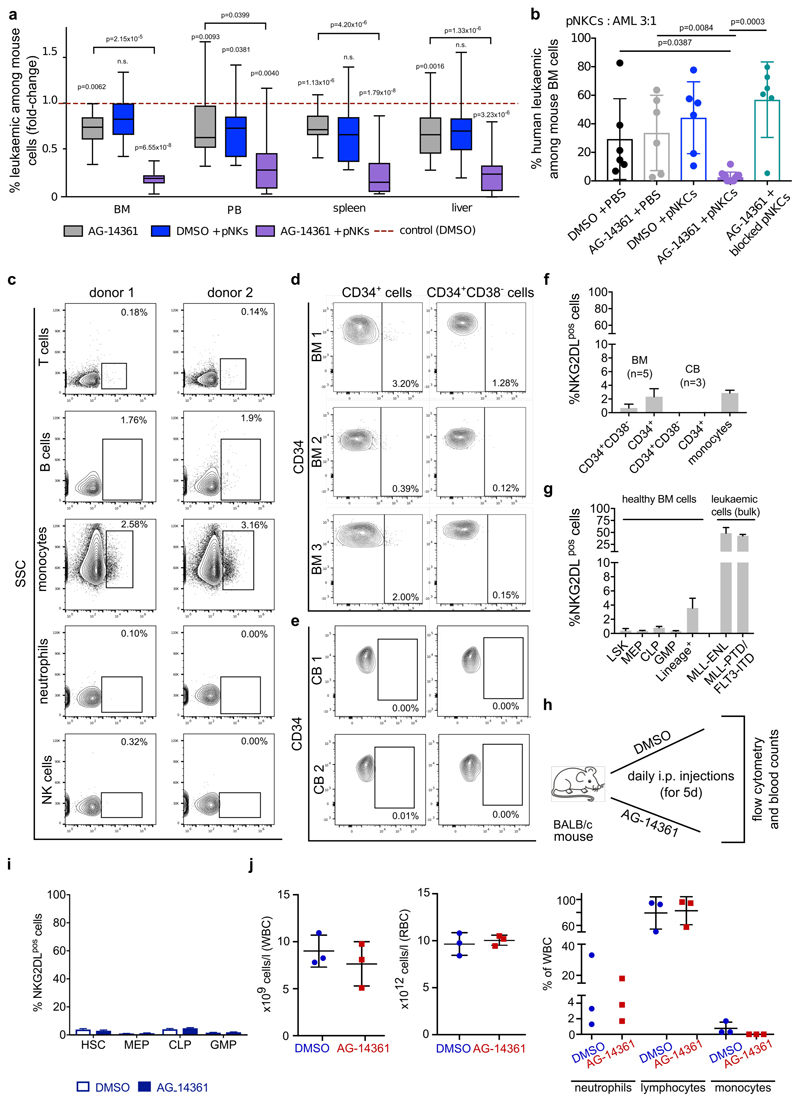
When AML cells pre-treated with AG-14361 were injected into NSG mice that were co-transplanted with pNKCs, a considerable reduction of leukaemic cell burden was observed compared to control settings (Extended Data Fig. 10a), which indicates that PARP inhibition sensitizes AML cells to control by NK cells in vivo. Consistently, the in vivo treatment of NSG mice transplanted with human AML cells with AG-14361, followed by administration of pNKCs, inhibited long-term in vivo leukaemogenesis, which was not observed in mice that were treated with the PARP1 inhibitor or with pNKCs alone (Fig. 4j, Extended Data Fig. 10b). Notably, the anti-leukaemic effect of the co-treatment was abrogated by NKG2D blockade (AG-14361 combined with blocked pNKCs), which demonstrates that the combination of PARP inhibition and control by NK cells mediates synergistic anti-leukaemic effects that involve induction of NKG2DLs.
Our studies provide molecular, cellular and functional in vivo evidence that LSC activity is linked to immune evasion. The absence of expression of NKG2DLs may constitute a universal LSC marker, because it takes advantage of a general functional property of LSCs—namely, their capacity to evade immune surveillance by NK cells. The selective suppression of NKG2DLs on LSCs may reflect a resemblance to their cells of origin (healthy haematopoietic stem and progenitor cells), which also maintain these ligands in a repressed state (Extended Data Fig. 10c–g). Stemness-associated immune evasion in AML probably involves mechanisms beyond NKG2D (Extended Data Fig. 6k, l) and possibly extends to other forms of cancer 24–27.
Our finding that PARP1 inhibition installs NKG2DLs on the surface of LSCs is of particular interest because PARP1 inhibitors are well-tolerated, not only in our experimental model (Extended Data Fig. 10h–j) but also in patients with cancer28,29. At advanced stages of cancer, immune surveillance is disturbed by multiple mechanisms beyond those that affect the expression of NKG2DLs30. Thus, the immune-sensitizing effect of PARP inhibition on LSCs may be particularly exploitable when applied in the context of a functionally restored immune system (for example, at minimal residual disease stage and/or in settings with immune stimulatory drugs, allogeneic stem-cell transplant or NK cell therapies), in which combinatorial treatment may allow for the specific targeting of LSCs with the aim of achieving an immune-mediated, long-term cure for AML.
Methods
Primary AML cells and samples of healthy donors
Peripheral blood or bone marrow samples were obtained at diagnosis from patients with AML after informed consent in accordance with the Helsinki protocol. For the correlations with clinical and molecular characteristics shown in Fig. 1p and Extended Data Fig. 3, all patients admitted to the University Hospital Tuebingen between 2005 and 2017, that agreed to participate in the study after informed consent, were included if technically feasible. Patient samples were anonymised by the PIs (C.L., H.R.S., A.T.) using continuous case numbers. Human cord blood samples of healthy newborn babies of both sexes were collected at the University Hospital Basel upon availability. All relevant ethical regulations were taken into account and the study was conducted according to the guidelines of the local Ethics committees (vote 13/2007V, S-112/2010, EKNZ2015/335). Cells were processed by density gradient centrifugation, viably frozen and freshly thawed for each experiment11.
Flow cytometry
Human cells
Fluorescence conjugates targeting human CD33, CD34, CD38, CD133, CD117, CD45, CD44, CD123, CD99, CD96, CD25, TIM3, PD-L1 (BD Biosciences, Franklin Lakes, NJ, USA), CD14, CD13 (eBiosciences, San Diego, CA, USA), CD3, GPR56, CD19, CD80, CD86, CD112, CD155 (Biolegend, San Diego, CA, USA), B7-H6 (R&D) were used. For specific NKG2DL stainings, human MICA, MICB, ULBP1, ULBP2/5/6 antibodies were used as previously described10. NKG2D-Fc or corresponding isotype control (R&D, Minneapolis, MN, USA) were biotinylated using one-step biotinylation kit (MACS Miltenyi) according to manufacturer’s instructions and, after blocking of cells with human IgG (Sigma Aldrich) detected with streptavidin-PE (LifeTechnologies, Carlsbad, CA, USA) as secondary reagent. In some cases, binding of NKG2D-Fc was detected by PE-anti-human IgG1 (SouthernBiotech, Birmingham, AL, USA). SytoxBlue or 7-AAD was used for live and dead cell discrimination. Gating strategies can be found in Supplementary Figure 2. Murine cells. NKG2DL expression was determined using FITC-labeled murine NKG2D tetramers with HLA-A*0201 as control tetramer as described before31 HSCs and progenitors were identified as previously described and antibodies against lineage cocktail (Biolegend), Ly6A/E (Sca-1), CD117 (c-kit), CD48, CD150, CD16/32 (all Biolegend) and CD34 (eBiosciences) used32. Flow cytometric analyses were performed on either a FACS CantoII, LSR II Fortessa (both BD Biosciences) or Cytoflex (Beckman Coulter, Brea, CA, USA). Human and murine NKG2DLpos and NKG2DLneg subpopulations were isolated by FACS using a FACS Aria III or FACSFusion (BD Biosciences). CD34+ and CD34- cell cellls were isolated by MACS (Miltenyi). Post-sort purity was routinely >95%.
Mice
NOD.Cg-Prkdcscid IL2rgtmWjl/Sz (NSG, Jackson Laboratory, Bar Harbor, ME, USA), BALB/c mice (Charles River, Wilmington, MA, USA) and established genetic mouse models (MLL-ENL33, MLL-PTD/FLT3-ITD34, MLL-AF935, TET236 and DNMT3A37) were maintained under pathogen-free conditions according to the Swiss and German federal and state regulations. All animal experiments were approved by the Regierungspräsidium Karlsruhe (G108/12, G243/16), Tuebingen (M12/12) and the Veterinäramt Basel-Stadt (24981, 28218). For xenotransplantation assays, primary human AML cells were transplanted via tail vein or intrafemoral injection into 6-10 weeks old gender-matched NSG mice (see Supplementary Table 2, both female and male mice were used as available). In samples with <95% blasts count, AML cells were employed after enrichment by FACS/MACS using pan-leukaemic antigens or CD3 depletion. Engraftment was monitored as previously described11 and defined as ≥1% human leukaemic cells in murine PB or BM as assessed by multi-color flow cytometry using antibodies against human leukaemic antigens. All mice underwent final BM, PB and organ assessment by multi-color flow cytometry. Whole body histopathology with H&E and anti human CD33 (Ventana, Tucson, Arizona, USA, Mouse monoclonal, Clone: QBEnd 10, RTU) and CD34 (Ventana, Mouse monoclonal, Clone: QBEnd 10, RTU) antibody staining was performed to verify engraftment. Homing assays were performed as described11 using sorted CFSE (CellTrace CFSE Cell Proliferation Kit, ThermoFisher Scientific, Waltham, MA, USA) labeled NKG2DLneg and NKG2DLpos AML cells. To investigate PARP1 inhibition in vivo, NSG mice engrafted with human AML cells or healthy BALB/c mice were injected intraperitoneally with 10 mg/kg AG-14361 or DMSO control for 5 consecutive days as described38 and pNKC transplanted 24h later if indicated. For in vivo analysis of chemotherapy resistance, NSG mice engrafted with human AML cells were treated with 1 mg/day cytarabine (Cytostar, Pfizer) for 2 to 4 consecutive days via subcutaneous injections; leukaemic infiltration and NKG2DL expression were measured cells by analyzing BM cells collected before (by intrafemoral punction) and 48h after completion of cytarabine treatment. For experiments with syngeneic leukaemic models, sorted NKG2DLneg or NKG2DLpos Ly5.2 cells isolated from the BM (MLL-ENL)33 or spleen (MLL-PTD/FLT3-ITD)34 of leukaemic mice were transplanted (1x10⁵ cells/animal for primary and 5x10⁴ for secondary assays) via the tail vein into sublethally irradiated Ly5.1 mice pre-treated or not with InVivoMAb anti-mouse NK1.1 antibody (BioXcell, West-Lebanon, NH, USA, 250 μg every 8-10 days, intraperitoneal injection). Animals were euthanized at signs of disease such as splenomegaly, weight loss or apathy, and analyzed for spleen size and weight, BM Ly5.2 donor chimaerism, blood counts (Advia120 Hematology Analyzer, Multispecies version 5.9.0-MS software, Bayer) and whole body histopathology.
May-Grünwald-Giemsa staining and colony formation (CFU) assays
Sorted NKG2DLneg and NKG2DLpos cells were analysed by May-Grünwald staining according to standard procedures and scored in CFU methylcellulose assays (human: Methocult H4434, StemCell Technologies, Vancouver, Canada; mouse: Methocult M3434, StemCell Technologies) according to the manufacturer’s protocol.
In vitro treatments of primary human AML and cord blood cells, apoptosis assays
Primary human AML cells were cultured in RPMI1640 supplemented with 10% FCS and cord blood cells in X-Vivo 20 (Lonza, Basel, Switzerland) supplemented with 100 ng/ml SCF, 100 ng/ml TPO, 100 ng/ml Flt3-L and 60 ng/ml IL-3 (all Peprotech, Rocky Hill, NJ, USA). AG-14361 (20 μM, Selleckchem, Munich, Germany), DMSO (0.2%), veliparib (10 μM, Selleckchem, Munich, Germany), azacytidine (5μM, Sigma-Aldrich), all-trans retinoic acid (ATRA, 1 μM, Sigma-Aldrich), valproic acid (VPA, 2 μM, Sigma-Aldrich), or NKG2D-Fc or isotype control (10μg/ml) (AML cells: 24h, cord blood cells: 48h) was added. Transfection with individual or scrambled PARP1, or with scrambled non-coding control Silencer Select small interfering (siRNAs) (LifeTechnologies, Carlsbad, CA, USA) using Lipofectamine RNAiMAX reagent (LifeTechnologies) was perfomed. Following siRNAs were used: s1097 sense: GGUGAUCGGUAGCAACAAATT; antisense: UUUGUUGCUACCGAUCACCGT; s1098 sense: CCAUCGAUGUCAACUAUGATT; antisense: UCAUAGUUGACAUCGAUGGGA; s1099 sense: GCAGCUUCAUAACCGAAGATT; antisense: UCUUCGGUUAUGAAGCUGCTT. Annexin V/7-AAD (BD Biosciences, used according manufacturer’s protocol) was used to distinguish live and apoptotic cells.
NK cell assays
Polyclonal NK cells (pNKC) were generated using K562-41BBL-IL15 feeder cells obtained from St. Jude's Children's Research Hospital as described previously39. To explore LSC enrichment, AML cells were cultured with or without pNKC for 16h in the presence or absence of F(ab’)2 fragments of a blocking anti-NKG2D mAb (clone 6H7 kindly provided by Amgen Inc.) or isotype control (SouthernBiotech, Clone 15H6, 5μg/ml each) and then retrieved by a ficoll gradient followed by MACS (Miltenyi) selection for leukaemic antigens. After coculture, CD69/CD107a expression on NK cells and NKG2DL, CD155 and CD112 expresssion on AML cells were determined by flow cytometry; IFNγ, Perforin, Granzyme B and TNF levels were analyzed by LEGENDplex™ (Biolegend) according to the manufacturer’s instructions, and cytotoxicity of pNKCs determined by 2h BATDA Europium assays as described39. For in vivo analysis, human AML cells were transferred to NSG mice with or without pNKCs.
Immunoblot, shedding, chromatin immunoprecipitation, RNA isolation, real-time PCR and targeted next sequencing
Immunoblots were performed according to standard procedures using anti-human PARP1 (#9542S) and anti β-actin (#3700S) or anti GAPDH (#5174P) antibodies and HRP-linked secondary reagents (#7074S, anti-rabbit IgG and #7076S, anti-mouse IgG, all from Cell Signaling Technology), and quantified by Fiji software. Uncropped images are presented in Supplementary Figure 1. sMICA, sMICb, sULBP1 and sULBP2 were analysed in supernatants of sorted AML cells by ELISA10. ChIP was performed as described40 using PARP1 antibody (Cell signaling, #S9542) and primers as indicated in Supplementary Table 8. Non-immunoprecipitated chromatin was used as input control. For CBFB-MYH11 real-time PCR, RNA was isolated using ZR-Duet DNA/RNA MiniPrep kit (ZymoResearch, Irvine, CA, USA) and expression quantified in duplicates on a 7900HT Fast Real-Time PCR System as well as the expression of ABL1, and calculated as reported41. For all other analyses, RNA was isolated using either the Promega ReliaPrep™ RNA Miniprep Systems (Promega, Madison, WI, USA) or the RNeasy Plus Micro Kit (Qiagen) and transcribed into cDNA using the High-Capacity cDNA Archive Kit (Applied Biosystems, Foster City, CA, USA) or the FastStart Universal SYBR Green Master (ROX) (Roche). The QuantiTect Whole Transcriptome Kit (Qiagen) was used for pre-amplification and reverse transcription of limited amounts of RNA to obtain high yields of cDNA. Gene transcripts were detected using an Applied Biosystems® Real-Time PCR 7500 Fast System instrument and Fast Start Universal SYBR Green Master with Rox (Roche) and gene-specific primers. A PBGD control was used for normalization. Fold change values of gene expression by averages from triplicate measurements were calculated using the ΔΔCT method as described42. A primer list is provided in the Supplementary Table 8. Targeted next generation sequencing (NGS) was performed as previously described11 using the AML community panel from Thermo Fisher (see ampliseq.com).
Microarray, RNAseq and GSEA analyses
Microarray gene expression analyses were performed as described in Wang et al40. The log2-normalized data were linearized and used as input for Gene set enrichment analysis (GSEA, Broadinstitute.org). One gene matrix transposed file was generated containing the transcripts from up- and down-regulated genes in the comparison of NKG2DLneg and NKG2DLpos blasts (CD34-expressing and non-expressing AMLs separately), and the transcripts of the LSC signature, the HSC signature, the progenitor signature and the 17-genes stemness score published previously43,44. GSEA computes if the gene set is enriched in the generated gene expression data. For RNA-sequencing, total RNA from 50,000 cell was isolated using an Arcturus PicoPure RNA isolation kit (Life Technologies, Invitrogen). cDNA libraries were generated with 10 ng of total RNA using the SMARTer Ultra Low RNA kit for Illumina sequencing (Clontech Laboratories) and sequenced with a HiSeq2000 device (Illumina). Sequences were aligned to hg19 reference genome using the STAR alignment software. DESeq245 was used to calculate differentially expressed genes between NKG2DLneg and NKG2DLpos samples. GSEA was performed using default settings.
Biometrical analysis of patient data sets
Patient data were analyzed using IBM SPSS Statistics Version 25. Overall survival (OS) was calculated from primary diagnosis until death from any cause. Patients alive at the end of the observation period were censored. OS rates and median survival times were estimated using the Kaplan–Meier method. Not normally distributed data were analyzed applying a Mann-Whitney U test. Kruskal-Wallis tests were used for comparing three independent samples. Differences were considered significant when the P value was <0.05. Molecular risk assessment was conducted according to the ELN2017 classification.46
Analysis of external datasets
RSEM normalised RNA-sequencing expression data of 179 primary AML samples from The Cancer Genome Atlas (TCGA)47 were downloaded from the Broad Institute. Clinical data and mutational status were downloaded from the TCGA website. Samples were stratified according to PARP1 expression (RPKM, high=above the median, low=below the median). Survival analysis was performed by using the Mantel-Cox log-rank test in GraphPad Prism 7 software.
Statements to sample size, randomization and blinding
No statistical methods were used to predetermine sample size. For all in vitro experiments, at least three biological replicates were used or grouped analyses were carried out. For the in vivo experiments three or more mice per sorted fraction were used unless otherwise indicated; the number of injected cells and mice were chosen according to availability of cells therefore grouped analyses were carried out. AML samples were chosen according to availability of cellular material and blast percentage (with a preference for samples with higher blast counts). Patients carrying active infections (hepatitis, HIV) were excluded to protect experimentators. Cells from individual AML samples were then distributed to all experimental groups for every sample. Mouse experiments were not randomised. Blinding was not routinely performed. Results including data from blinded experiments are shown in Fig. 1f-h, Fig. 3c-d, Fig. 4j and Extended Data Fig. 4e-g and j-l. Experiments with blinding have in all cases reproduced the data generated without blinding. Importantly, key experiments were independently replicated by different co-authors and in the three different involved laboratories.
Extended Data
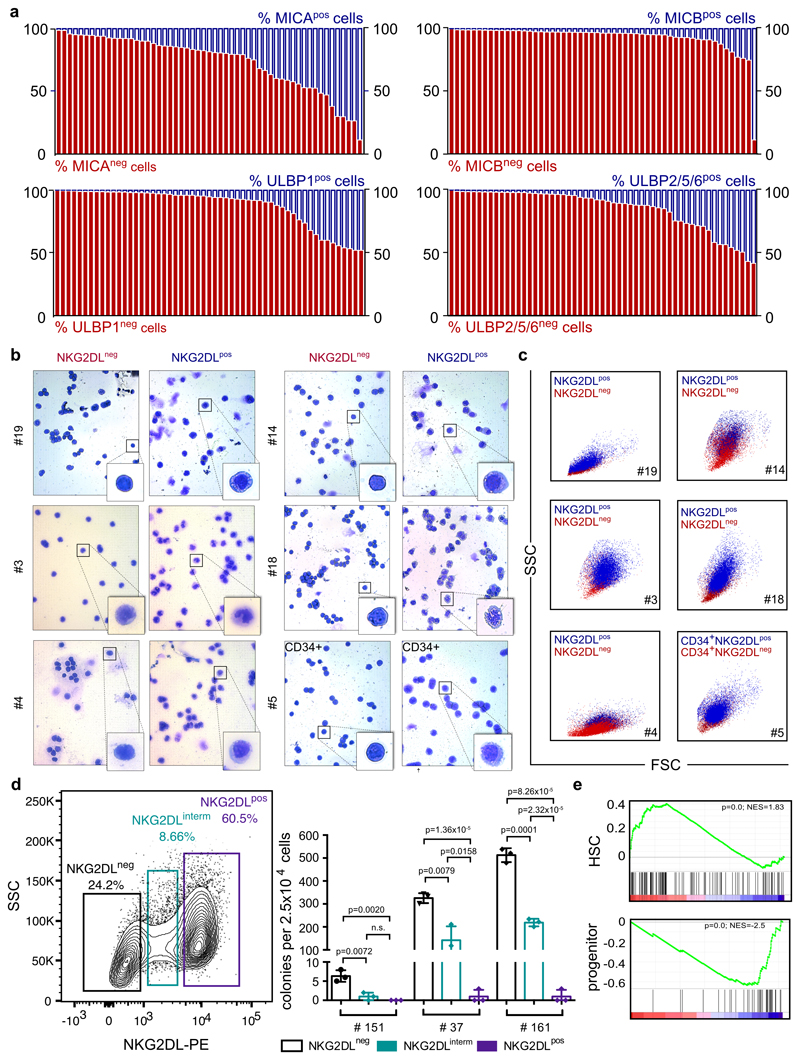
Extended Data Fig. 1. Surface expression of NKG2DLs and associated features of cell morphology, clonogenicity and gene expression.
a, Human AML cells show heterogeneous surface expression of the NKG2D ligands MICA, MICB, ULBP1 and ULBP2, ULBP5 or ULBP6. Flow cytometry analysis with antibodies against human MICA, MICB, ULBP1 or ULBP2, ULBP5 or ULBP6 in primary AML samples from n = 62 patients. b–e, Surface expression of NKG2DLs distinguishes leukaemic subpopulations with different morphology, clonogenic capacity and molecular characteristics. AML cells stained with conjugated NKG2D–Fc chimeric protein were sorted according to expression of NKG2DLs and analysed by May–Grünwald–Giemsa stainings (b) and forward and sideward flow cytometry plots (c). When compared to corresponding NKG2DL− (NKG2DLneg) AML cells isolated from the same patient, NKG2DL+ (NKG2DLpos) AML subpopulations display more-mature morphology, irrespective of CD34 expression. d, Furthermore, colony-forming assays indicate intermediate clonogenicity in AML cells with intermediate surface expression of NKG2DLs (NKG2DLinterm AML cells; left, representative plot depicting sorting strategy, no. 37; right, summarized results from technical triplicate analyses performed with n = 3 cases of AML). Centre values represent mean, error bars represent s.d.; one-way ANOVA was used for statistical analysis. e, GSEA analyses reveal enriched haematopoietic stem cell and suppressed progenitor signatures in NKG2DL− compared to NKG2DL+ AML cells (no. 1, 6, 7, 8 and 12).
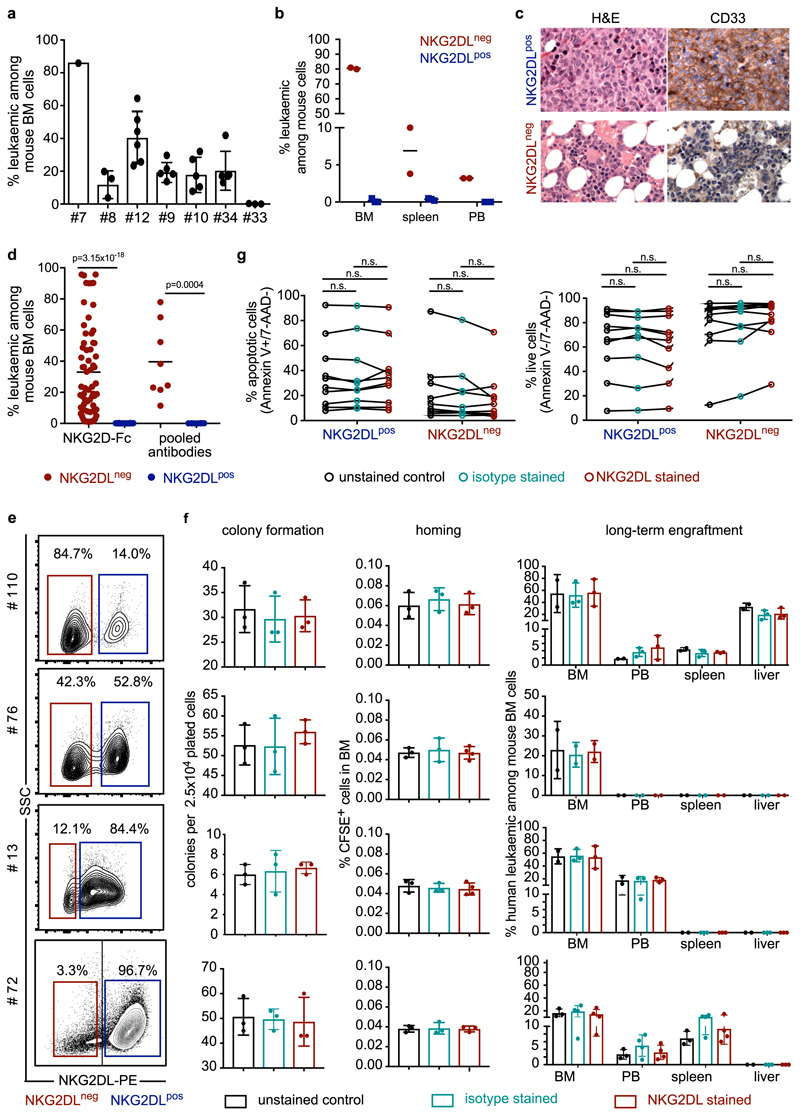
Extended Data Fig. 2. Only NKG2DL− subpopulations of AML cells are serially re-transplantable and selectively engraft NSG mice after intrafemoral injection.
a–c, Bone marrow cells isolated from mice transplanted with NKG2DL− AML cells were re-transplanted into sublethally irradiated secondary recipient mice, either unsorted (a, n = 7 cases of AML) or after sorting into NKG2DL− and NKG2DL+ AML cells (b, c, no. 1) (see Supplementary Table 2). Flow cytometric analyses in secondary recipients are shown, indicating percentages of engrafted human AML cells among total bone marrow cells at 12 (a) or 15 (b) weeks after transplantation. Each dot represents one transplanted mouse; n = 2 mice for NKG2DL−; n = 3 mice for NKG2DL+. c, Histological analyses of mice (H&E and anti-CD33 show exemplary data, no. 1; two analysed mice for NKG2DL− and three for NKG2DL+ cells). The NKG2DL staining procedures do not affect the results. d, NKG2DL− and corresponding NKG2DL+ cells were sorted either using NKG2D–Fc (n = 65 mice for NKG2DL−; n = 79 mice for NKG2DL+; n = 12 cases of AML) or using pooled antibodies against individual NKG2DLs (MICA, MICB, ULBP1 and ULBP2, ULBP5 or ULBP6; n = 3 cases of AML; n = 8 mice per group) and then transplanted at equal numbers for each case of AML intrafemorally in pre-irradiated NSG mice. For detailed mouse numbers per patient and subpopulation, see Supp lementary Table 2. Human leukaemic engraftment in mouse bone marrow was assessed 12–16 weeks after transplantation; percentages are shown of human leukaemic among mouse bone marrow cells in mice transplanted with NKG2DL− or NKG2DL+ subpopulations for each case of AML. Centre values represent means; each dot represents one mouse; a Student’s t-test was used for statistical analysis. Note that these samples are also included in the summarized analysis shown in Fig. 1g. e, AML cells with variable expression of NKG2DLs were stained with NKG2D–Fc, isotype or empty control and analysed side-by-side without prior sorting. f, Quantifications of results obtained in colony formation (left), homing (middle) (n = 3 mice per group and patient sample, except for n = 4 mice in NKG2D–Fc-stained group with patients no. 13 and 76) and in vivo long-term engraftment assays in NSG mice (right). Mice per patient sample and condition: no. 110, 3 NKG2D–Fc, 3 isotype and 2 empty control; no. 76, 2 NKG2D–Fc, 2 isotype and 2 empty control; no. 13, 3 NKG2D–Fc, 3 isotype and 2 empty control; and no. 72, 4 NKG2D–Fc, 4 isotype and 3 empty control. g, Annexin V and 7-AAD stainings indicating apoptotic (left) and live (right) cells among AML cells incubated for 24 h with NKG2D–Fc, isotype or control medium (n = 10 cases of AML). f, Two-sided Kruskal–Wallis test was used for statistical analysis. Centre values represent mean, error bars represent s.d.
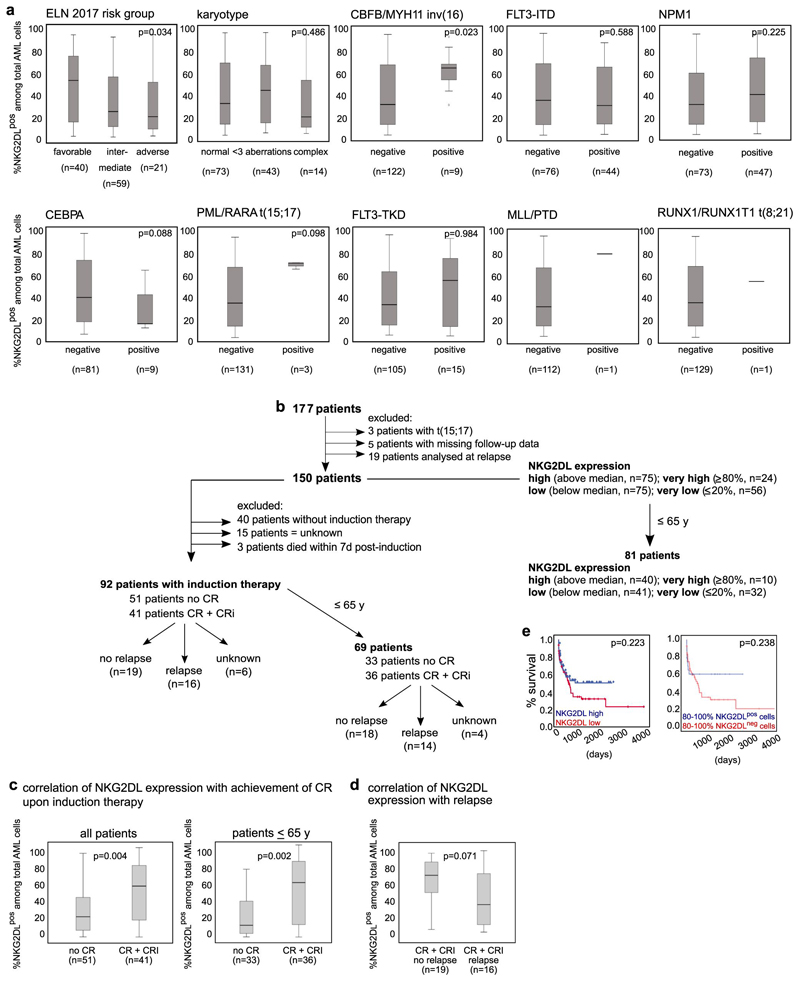
Extended Data Fig. 3. Association between surface expression of NKG2DLs and molecular and clinical parameters in patients with AML.
a, Cells from patients with known genetic and molecular profiles were stained with conjugated NKG2D–Fc chimeric protein and included in the analyses. Numbers of patients with positive or negative results for the respective mutation are shown below each analysis; patients with an unknown result for the particular analysis are not shown. Note that cases of AML that belong to the favourable molecular European LeukaemiaNet (ELN) risk group or with detectable inv(16) showed higher expression of NKG2DLs when compared to AML of other risk groups or without inv(16). For statistical analyses, a Kruskal–Wallis test was used for karyotype and ELN 2017 risk group, and a Mann–Whitney U test for all other data. b–e, Surface expression of NKG2DLs assessed at diagnosis (b) was compared between patients who achieved or did not achieve complete remission (CR) or complete remission with incomplete haematologic recovery (CRi) after induction chemotherapy (c), as well as between those patients who—after achieving complete remission (both with and without incomplete haematologic recovery)—did or did not experience subsequent relapse (d). Patients with initial high percentages of NKG2DL+ cells among total AML cells more often achieve—and, by trend, also sustain—remission. A Mann–Whitney U test was used for statistical analysis. a, c, d, Boxes indicate the median and interquartile range, and whiskers represent data up to 1.5 × the interquartile range; outliers that range from 1.5–3 × the interquartile range are depicted as circles. In e, patients with high (n = 75) versus low (n = 75) expression of NKG2DLs (left), and patients with ≥80% NKG2DL+ (n = 24) versus ≥ 80% NKG2DL−(n = 56) cells among total AML cells (right) were compared with respect to overall survival. Note that when only patients younger than 65 years are included, improved survival is observed in cases with ≥80% NKG2DL+ compared to ≥80% NKG2DL− cells among total AML cells (as shown in Fig. 1p). For survival analyses, the log-rank (Mantel–Cox) test was used for statistical analyses. For all other tests, two-sided statistical tests were used.
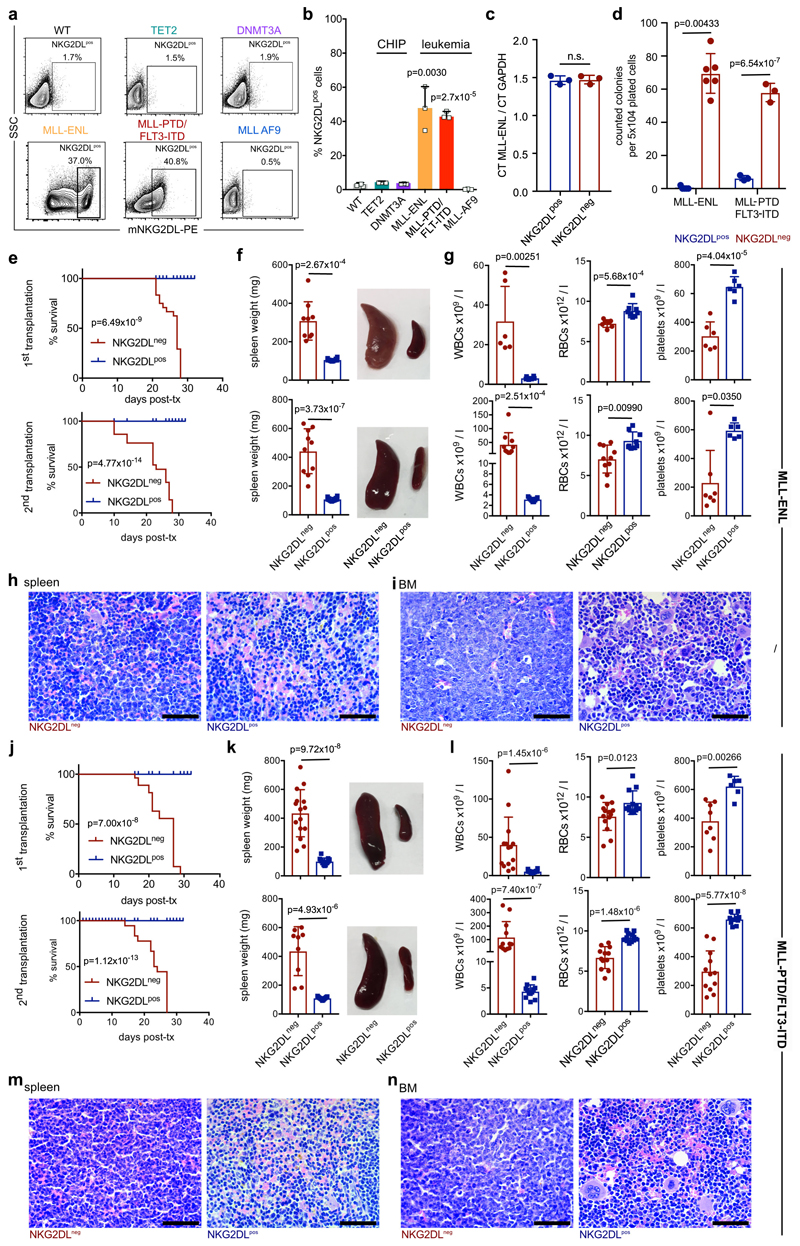
Extended Data Fig. 4. Expression of NKG2DLs on mouse leukaemic cells and association with a lack of leukaemogenicity in syngeneic mouse models.
a, b, Staining of whole bone marrow cells derived from healthy wild-type (WT), pre-leukaemic (chromatin immunoprecipitation, Dnmt3a or Tet2 mutated) or leukaemic (Mll-Enl, Mll-ptd/Flt3-ITD and Mll-Af9) mice using a mouse NKG2D tetramer. Representative flow cytometric plots (a) and summarized quantifications of NKG2DL+ cells among total mouse bone marrow cells (b) (n = 3 mice per model and condition; a two-sided Student’s t-test was used for statistical analysis). c–m, NKG2DL− and corresponding NKG2DL+ cells were sorted from leukaemic Mll-Enl and Mll-ptd/Flt3-ITD mice and analysed by qRT–PCR for the genetic leukaemic driver (c) (Mll-Enl mice, n = 3), and at equal numbers in colony-forming assays (d) (n = 6 for Mll-Enl mice; n = 3 for Mll-ptd/Flt3-ITD mice). e–n, In vivo primary and secondary transplantation (tx) assays. e, j, Kaplan–Meier-survival analyses (n = 24 mice for primary transplantations; n = 18 mice for secondary transplantations; log-rank Mantel–Cox test was used for statistical analysis). f, k, Spleen assessment with representative images and weight quantification (f, Mll-Enlmice, primary transplantation, n = 9 NKG2DL− and n = 12 NKG2DL+; secondary transplantation, n = 10 NKG2DL− and n = 12 NKG2DL+; k, Mll-ptd/Flt3-ITD mice, primary transplantation, n = 15 NKG2DL− and n = 13 NKG2DL+; secondary transplantation, n = 9 NKG2DL− and n = 11 NKG2DL+). g, l, Peripheral blood counts (g, Mll-Enl mice, primary transplantation, n = 6 NKG2DL− and n = 6 NKG2DL+; secondary transplantation, n = 10 NKG2DL− and n = 9 NKG2DL+; l, Mll-ptd/Flt3-ITDmice, primary transplantation, n = 14 NKG2DL− and n = 12 NKG2DL+; secondary transplantation, n = 11 NKG2DL− and n = 11 NKG2DL+). RBCs, red blood cells; WBCs, white blood cells. h, m, i, n, Representative histopathological analyses: spleen (h, m), bone marrow (i, n). H&E. Scale bars, 50 μm. A two-sided Mann–Whitney U test (g, l, WBCs, primary transplantation; g, platelets, secondary transplantation) or a two-sided Student’s t-test (all other analyses) were used for statistical analysis. Centre values represent mean, error bars represent s.d. for all plots.
Extended Data Fig. 5. Leukaemogenicity of mouse NKG2DL− and NKG2DL+ subpopulations after transplantation in syngeneic recipients depleted or not of endogenous NK cells.
Sorted NKG2DL− and NKG2DL+ leukaemic cells isolated from Mll-Enl and Mll-ptd/Flt3-ITD genetic models were transplanted into syngeneic mice with or without in vivo depletion of NK cells (NKCD). Engraftment (Ly5.2 chimerism), leukaemia induction and survival were assessed in primary and secondary transplantation assays. a, e, Kaplan–Meier survival analyses. b, f, Quantification of spleen weights and representative spleen pictures. c, g, Peripheral blood counts. a–h, Donor-derived Ly5.2 chimerism among Ly5.1 bone marrow recipient cells for Mll-Enl (a–d) and Mll-ptd/Flt3-ITD (e–h) cells. Exact numbers of mice transplanted and analysed for each genetic leukaemia model, subpopulation, condition and analysis type are indicated below. i, Representative flow cytometry plots showing successful NKCD by treatment with InvivoMab anti-Nk1.1 antibody (250 μg per mouse per week, first application 24 h before transplantation); a two-sided Student’s t-test and a log-rank Mantel–Cox test (for Kaplan–Meier survival analyses) were used for statistical analysis. Centre values represent mean, error bars represent s.d. for all plots. a, Primary transplantation, n = 11 NKG2DL−, n = 12 NKG2DL+; secondary transplantation, n = 6 per group; b, primary transplantation, n = 3 NKG2DL−, n = 6 NKG2DL+; secondary transplantation, n = 4 NKG2DL−, n = 6 NKG2DL+; c, primary transplantation, n = 3 per group; secondary transplantation, n = 4 NKG2DL−, n = 3 NKG2DL+; d, primary transplantation, n = 5 per group (for controls without NKCD, n = 8 mice per group); secondary transplantation, n = 6 per group; e, primary transplantation, n = 3 NKG2DL−, n = 6 NKG2DL+; secondary transplantation, n = 4 NKG2DL−, n = 6 NKG2DL+; f, primary transplantation, n = 6 per group; secondary transplantation, n = 3 NKG2DL−, n = 5 NKG2DL+; g, primary transplantation, n = 6 NKG2DL−, n = 6 NKG2DL+; secondary transplantation, n = 3 NKG2DL−, n = 6 NKG2DL+; h, primary and secondary transplantation, n = 5 mice per group or, respectively, for controls without NKCD: primary transplantation, n = 7 per group; secondary transplantation, n = 8 for NKG2DL−, n = 6 for NKG2DL+.
Extended Data Fig. 6. Differential recognition of NKG2DL+ versus NKG2DL− and CD34+ and CD34− subpopulations of AML cells by NK cells, and effects of NK cell co-culture on leukaemogenic capacity and expression of immunomodulatory markers in human AML cells.
Leukaemic engraftment after pre-culture with NK cells and expression. a, Depletion of NKG2DL+ AML cells after in vitro co-culture with pNKCs. Flow cytometric quantification of NKG2DL+ AML cells (no. 10, 13, 15, 17, 35 and 36) after co-culture with pNKCs for 16 h at the indicated effector/target ratios. A Kruskal–Wallis test was used to test for statistical significance. b–d, Differential recognition of CD34+ (LSC-enriched) versus CD34− (non-LSC) subpopulations of AML cells. pNKCs were cultured with sorted CD34+ or corresponding CD34− AML cells (one dot represents one patient sample, n = 7 cases of AML). Analyses of pNKC-mediated cytotoxicity (b), percentages of CD69+ and CD107a+ among total pNKCs (c) and IFNγ, perforin, granzyme B and TNF concentrations in supernatants (d). Two-sided unpaired t-tests (b, c), and Kruskal–Wallis tests (d) were used for statistical analyses. e, f, Leukaemic engraftment in mice transplanted with AML cells derived from in vitro cultures with or without NK cells. Mice transplanted with equal numbers of AML cells (n = 3 mice per condition and patient as indicated) derived from control cultures without NK cells and from anti-NKG2D + pNKC co-cultures did not show leukaemic repopulation in peripheral blood and bone marrow at time points at which engraftment was detected in mice transplanted with corresponding AML cells from mock + pNKC conditions (shown in Fig. 2e). As shown here, these mice engrafted later. Leukaemic burden as quantified by flow cytometry (e) at the delayed time points when leukaemia was detected in these control groups (f). The time points of engraftment of AML cells cultured with unblocked pNKCs (mock + pNKCs) are shown side-by-side to illustrate that, for each patient sample, this condition showed the fastest engraftment. A two-sided Student’s t-test was used for statistical analysis. g–l, Expression of additional immunomodulatory molecules in LSCs compared to non-LSCs, before and after co-culture with NK cells. Analyses of surface expression of CD112, CD155 and B7-H6 (each in n = 23 cases of AML), CD80, CD86 and PD-L1 (each in n = 25 cases of AML), CD47 (n = 14 cases of AML), and HLA-ABC (n = 75 cases of AML) after co-staining of bulk AML cells for NKG2DLs (g), CD34 (h), CD155 (i) and CD112 (j) on NKG2DL− and NKG2DL+ AML cells after co-culture with the indicated ratios of pNKCs compared to cultures without pNKCs (‘AML alone’), and indicated GSEA analyses of gene-expression datasets from sorted LSCs and non-LSCs isolated as indicated (k, no. 1, 6, 7, 8 and 12; l, no. 7, 8 and 12). Statistical analyses in g–j were performed using a two-sided Mann–Whitney U test. Centre values represent mean, error bars represent s.d. (a–e) or s.e.m. (g–j). One dot represents one patient sanple (a–d, g–j) or one mouse (e). Nominal P value and normalized enrichment score (k, l).
Extended Data Fig. 7. Surface expression of NKG2DLs in non-CD34-expressing versus CD34-expressing AML, analysis of in vivo leukaemogenicity in CD34+ versus CD34− subpopulations of AML cells and co-staining for NKG2DL and LSC markers.
a, Comparison of expression of NKG2DLs (SFI, specific fluorescence intensity indices) as measured by NKG2D–Fc in non-CD34-expressing (n = 57, left) and CD34-expressing (n = 107, right) cases of AML. b, Characteristics of patients with >99% NKG2DL+ cells among AML cells within our cohort (comprising n = 175 cases of AML; note that all cases are non-CD34-expressing cases of AMLs. c, Quantification of individual patient data shown in a, and of expression of NKG2DLs in CD34+versus CD34− subpopulations within CD34-expressing cases of AML for which individual data are shown in d. A two-sided Mann–Whitney test was used for statistical analysis. e–h, Analysis of sorted CD34+ and CD34− subpopulations of AML cells in in vivo xenotransplantation assays in NSG mice (no. 7, 8 and 12; n = 5 mice per AML and subpopulation). e, f, Flow cytometric analysis of summarized percentages of human leukaemic among mouse bone marrow (e), and spleen and liver cells (f). g, Histopathological bone marrow analysis using antibodies that recognize human, but not mouse, CD33 and CD34; 630× magnification. h, Kaplan–Meier analysis indicating mouse survival. A Mann–Whitney U test was used for statistical analysis. Note that CD34+ subpopulations with lower percentages of NKG2DL+ cells have increased stemness properties. i, j, Analysis of the percentage of positive cells with MICA, MICB, ULBP1 or ULBP2, ULBP5 or ULBP6 surface expression in non-CD34-expressing cases of AML (n = 29) (i) and in CD34+ and CD34− subpopulations of CD34-expressing cases of AML (n = 33) (j). In some cases the sum of the percentage of positive cells exceeds 100%, which reflects the fact that individual AML cells can express more than one NKG2DL. A two-sided Mann–Whitney U test was used for statistical analysis. k, l, Co-staining of NKG2DLs and LSC markers in CD33+ AML cells (k, n = 9 cases of AML, of which 9 out of 9 cases expressed GPR56 and CD133, and only 3 out of 9 cases expressed CD96) and within CD34+CD38− subpopulations of AML cells (l, n = 5 cases of AML; notably, in the other 7 cases of AML we analysed, all CD34+CD38− cells were found to lack expression of NKG2DLs). A two-sided Student’s t-test was used in k, l. Centre values represent mean, error bars represent s.d.
Extended Data Fig. 8. PARP1 in human AML: expression, association with clinical outcome and induction of NKG2DLs after PARP1 inhibition.
a, Survival analysis of patients with AML with high (above median, red line) versus low (below median, blue line) expression of PARP1 mRNA (TCGA, n = 179 patients). b, c, Immunoblot analyses of expression of PARP1 protein in NKG2DL− compared to NKG2DL+ AML cells (b) and CD34+ compared to CD34− AML cells (c), sorted from the same patient samples. n = 9 for b, n = 3 for c; experiments were repeated twice independently with similar results. GAPDH and actin were used as loading controls. Quantifications are shown in Supplementary Table 6. d–h, Treatment with individual (d, n = 3; e, n = 12; f, no. 42) or pooled (g, h, n = 3) PARP1 siRNAs for 24 h inhibits expression of the PARP1 gene (d, g; qRT–PCR, GAPDH used as housekeeping control) and induces surface expression of NKG2DLs on human CD34+ AML cells (e, f, h, no. 38) (control, scrambled non-coding PARP1 siRNAs). Each dot represents a different patient analysed in technical triplicates. i, Analysis of expression of NKG2DLs on engrafted human AML subpopulations (percentage of NKG2DL+ within CD33+, CD33+CD34+ and CD33+CD34−subpopulations derived from mouse bone marrow) after five days of in vivo treatment with AG-14361 or DMSO (n = 10 mice per group, n = 3 cases of AML). j, k, Analysis of surface expression of NKG2DLs after in vitro treatment with AG-14361 (20 μM, 24 h) or DMSO in sorted CD34+ and corresponding CD34− AML cells (j, left, representative results; right, summarized fold changes of NKG2DL+ cells in AG-14361 versus DMSO cultured cells; n = 3 cases of AML) or in bulk AML cells from non-CD34-expressing cases of AML (k, n = 10 cases of AML). Summarized fold changes in NKG2DL+ AML cells in PARP inhibition versus corresponding control conditions are shown. l, m, Sorted NKG2DL− (top panels) and corresponding NKG2DL+ (bottom panels) AML subpopulations were treated for 24 h with AG-14361 (20 μM) or DMSO (0.2%) and analysed by flow cytometry for MICA, MICB, ULBP1 or ULBP2, ULBP5 or ULBP6 surface expression (l, SFI; no 16, 35 and 151) and using DAPI (m) to determine viability (left) and absolute cell numbers (right) (n = 5 cases of AML). Mean values of technical triplicate analyses are shown. n, Corresponding analyses with healthy CD34+ cells from n = 3 samples of cord blood. o, Leukaemic bone marrow infiltration after in vivo treatment with AG-14361 (days 1 to 5, 10–15 mg kg−1 day−1) or DMSO (days 1 to 5, 20%) in n = 10 mice for each group. Statistical analyses were performed using a log-rank (Mantel–Cox) test (a), a two-sided Mann–Whitney U test (k, o) or a two-sided Student’s t-test (all other plots). Each dot represents the mean of technical triplicates per patient sample. Centre values represent mean, error bars represent s.d.
Extended Data Fig. 9. Modulation of NKG2DLs.
a, b, Expression of NKG2DLs after treatment of bulk AML cells with retinoic acid (ATRA, 1 μM), valproic acid (VPA, 2 μM), 5-azacytidine (5 μM), AG-14361 (20 μM) or veliparib (10 μM). Quantified summarized fold-changes in CD34+NKG2DL+ and CD34−NKG2DL+ populations after 24 h of in vitro treatment (a, n = 3 cases of AML; b, n = 11 cases of AML). All analysed in technical triplicates; DMSO 0.2% or PBS were used as carrier controls. c, Release of soluble NKG2DLs from sorted CD34+and corresponding CD34− AML subpopulations (‘shedding assays’). n = 8 cases of AML; mean results with s.d. are shown. d–g, Baseline mRNA expression of different individual NKG2DLs and their variants. d, Relative expression of single ligands; e, relative summarized ligand expression. n = 10 patients with AML. f, g, Induction of NKG2DL mRNAs after PARP1 inhibition using PARP1 siRNAs (f, 24 h in vitro treatment; control, scrambled non-coding siRNAs) or AG-14361 (g, 20 μM, 24 h in vitro treatment; control, DMSO carrier (0.2%)). Fold changes in relative expression levels of mRNA of individual ligands compared to control treatments in individual patients are shown, as indicated. Note that heterogeneous NKG2DLs are upregulated upon PARP inhibition in different cases of AML. Statistical analyses were performed using a two-sided Mann–Whitney U test (c) or a two-sided Student’s t-test (a, b, d–g). Centre values represent mean, error bars represent s.d.
Extended Data Fig. 10. Treatment with a PARP1 inhibitor suppresses in vivo induction of leukaemia in mice co-transplanted with NK cells, but does not affect expression of NKG2DLs in healthy haematopoietic cells and baseline haematopoiesis.
a, b, Treatment with AG-14361 in vitro (pre-transplantation) or in vivo (post-transplantation) inhibits the capacity for the in vivo initiation of leukaemia of human AML cells in NSG mice co-transplanted with NK cells. a, In vitro pre-treatment: AML cells were cultured in vitro with AG-14361 (20 μM) or DMSO (0.2%) for 24 h and then transplanted via tail vein injection into NSG mice (1.5 × 10⁶ AML cells per mouse), which afterwards were co-transplanted (or not) with pNKCs (1.5 × 10⁷ pNKCs per mouse) (n = 3 mice per condition and patient, n = 5 cases of AML). Mice were analysed for the presence of leukaemic cells in bone marrow, peripheral blood, liver and spleen at 16 h after transplantation. Summarized results of n = 5 independent biological experiments are shown, after normalization to ‘DMSO control without NK cells’ (which was set to 1). Statistical analysis was performed using a two-sided Mann–Whitney U test. b, In vivo treatment: mice transplanted with human AML cells (no. 35, 1.5 × 10⁶ AML cells per mouse, transplanted intrafemorally, n = 6 mice per group) were treated with AG-14361 (10 mg kg-1 intraperitoneally, on days 1 to 5 after transplantation) or DMSO control, and afterwards co-transplanted (or not) with pNKCs (4.5 × 10⁶ pNKCs per mouse administered once intravenously on day 6 after transplantation, pre-treated or not with anti-NKG2D or isotype control, 5 μg ml-1). Mice were analysed at week nine after transplantation for leukaemic engraftment. Note that between day 6 after transplantation and the final analysis time point, no further treatment was applied. See schematic of the experiment and further data with higher (10:1) pNKC:AML cell ratio in Fig. 4j, k. Statistical analyses were performed using a two-sided Student’s t-test. c–i, Surface expression of NKG2DLs on healthy human (c–f) and mouse (g–i) haematopoietic cells at baseline and after PARP1 inhibition. Representative flow cytometry data of the indicated human haematopoietic cells derived from peripheral blood (c) and bone marrow and cord blood (d–f) of healthy donors, and quantification (f). In g, expression of NKG2DLs is quantified on different subpopulations of healthy mouse haematopoietic bone marrow cells (n = 3 mice; bulk leukaemic cells from Mll-Enl and Mll-ptd/Flt3-ITD mice are shown as positive controls). h–j, Treatment of mice with AG-14361 (10 mg kg-1, intraperitoneally) or DMSO vehicle control, and subsequent quantification of expression of NKG2DLs on haematopoietic cells. Schematic of the experiment (h) and quantification of percentages of NKG2DL+ cells among total mouse haematopoietic cells of specific compartments (i) (haematopoietic stem cells (HSCs): KIT+Lin−SCA1+CD150+CD48; MEP, megakaryocyte–erythroid progenitor; CLP, common lymphoid progenitor; GMP, granulocyte–macrophage progenitor) and absolute numbers of white blood cell counts (j) (with distribution of neutrophils, lymphocytes and monocytes) and red blood cell counts (n = 3 mice per group). Centre values represent mean, error bars represent s.d. Two-sided statistical tests were performed using Mann–Whitney U test (a) or Student’s t-test (b, f–j). Centre values represent mean, error bars represent s.d. for all plots.
Supplementary Material
Acknowledgements
This study was supported by grants from the Deutsche Forschungsgemeinschaft (LE 2483/7-1 to C.L.; SA1360/9-1, SA1360/7-3 to H.R.S.; SFB873, FOR2674, FOR2033 to A.T.), the Swiss National Science Foundation (179239) and the Foundation for Fight Against Cancer (Zürich) to C.L., Germany´s Excellence Strategy (EXC 2180/1), the Wilhelm Sander-Stiftung (2007.115.3) and the Deutsche Krebshilfe (111828, 70112914) to H.R.S., the SyTASC consortium (Deutsche Krebshilfe), the Swiss Bridge Foundation and the Dietmar Hopp Foundation to A.T. We thank Amgen for the NKG2D antibody clone 6H7, Dr. Ursula Kohlhofer, Annaïse Jauch, Mergim Maraj Martinez, Z. Gu for experimental assistance, the Animal and Flow Cytometry Facilities in Basel, Heidelberg, Tübingen and the Genomics & Proteomics Core Facility (DKFZ) for support.
Footnotes
Data availability statement. All data generated are included in the published article and in the Supplementary Information. Gene expression data that support the findings of this study have been deposited in the Gene Expression Omnibus under accession numbers GSE127200 and 127959. All data are also available from the authors on reasonable request.
Author Contributions:
A.M.P., K.R., S.R., M.K., J.S. (Tübingen) designed and performed experiments, analysed data and generated figures and tables (A.M.P.: mouse studies, flow cytometry, NKG2DL expression, sorts, in vitro treatments, colony/apoptosis assays, qRT-PCRs, cord blood samples; K.R.: NKG2DL expression, sorts, pNKC generation, in vitro NK cell/CFU assays, AML samples, biometrical analysis, contribution to mouse experiments; S.R.: PDX models, RNAseq, figures on bioinformatics data; M.K.: NKG2DL expression, sorts, in vitro treatments/CFU, gene expression arrays, qRT-PCRs, bioinformatic analysis; J.S: AML samples, NKG2DL expression, in vitro NK cell/CFU assays). H.W., C.T., M.M., P.H., T.S., M.F., E.N., P.L., L.Q.M., S.D. performed experiments and analysed resulting data (H.W.: immunoblots, CHIP, qRT-PCR; C.T.: NKG2DL expression, in vitro NK cell assays, AML samples; M.M., P.H.: mouse assays, cord blood samples; T.S.: immunoblots; M.F.:: bioinformatic analyses; E.N.: PARPi in healthy mice; P.L.: NGS, qRT-PCR; L.Q.:M, S.D: mouse histopathology). L.K., D.D: patient samples and clinical data. J.R.P. interpreted data. C.L. (Heidelberg), J.S. (Basel), R.Z., B.B., M.C.: critical reagents (C.L.: AML cells, J.S., R.Z., B.B., M.C.: mouse leukaemia cells). A.S.: NKG2DL reagents and contribution to experimental design. A.T. contributed to the study design, performed data analysis, wrote the manuscript and supervised the study. H.R.S. conceived the study, analysed data, wrote the manuscript and supervised the study. C.L. (Basel) conceived the study, analysed the data, and supervised the study and wrote the manuscript as lead author. All authors critically reviewed the manuscript.
The authors declare no competing financial and or non-financial interests.
References
- 1.Ferrara F, Schiffer CA. Acute myeloid leukaemia in adults. Lancet. 2013;381:484–495. doi: 10.1016/S0140-6736(12)61727-9. [DOI] [PubMed] [Google Scholar]
- 2.Shlush LI, et al. Tracing the origins of relapse in acute myeloid leukaemia to stem cells. Nature. 2017;547:104–108. doi: 10.1038/nature22993. [DOI] [PubMed] [Google Scholar]
- 3.Bahr C, Correia NC, Trumpp A. Stem cells make leukemia grow again. EMBO J. 2017 doi: 10.15252/embj.201797773. [DOI] [PMC free article] [PubMed] [Google Scholar]
- 4.Lapidot T, et al. A cell initiating human acute myeloid leukaemia after transplantation into SCID mice. Nature. 1994;367:645–648. doi: 10.1038/367645a0. [DOI] [PubMed] [Google Scholar]
- 5.Hanahan D, Weinberg RA. Hallmarks of cancer: the next generation. Cell. 2011;144:646–674. doi: 10.1016/j.cell.2011.02.013. doi:S0092-8674(11)00127-9 [pii] [DOI] [PubMed] [Google Scholar]
- 6.Bauer S, et al. Activation of NK cells and T cells by NKG2D, a receptor for stress-inducible MICA. Science. 1999;285:727–729. [PubMed] [Google Scholar]
- 7.Guerra N, et al. NKG2D-deficient mice are defective in tumor surveillance in models of spontaneous malignancy. Immunity. 2008;28:571–580. doi: 10.1016/j.immuni.2008.02.016. [DOI] [PMC free article] [PubMed] [Google Scholar]
- 8.Lazarova M, Steinle A. The NKG2D axis: an emerging target in cancer immunotherapy. Expert Opin Ther Targets. 2019:1–14. doi: 10.1080/14728222.2019.1580693. [DOI] [PubMed] [Google Scholar]
- 9.Raulet DH, Gasser S, Gowen BG, Deng W, Jung H. Regulation of ligands for the NKG2D activating receptor. Annu Rev Immunol. 2013;31:413–441. doi: 10.1146/annurev-immunol-032712-095951. [DOI] [PMC free article] [PubMed] [Google Scholar]
- 10.Hilpert J, et al. Comprehensive analysis of NKG2D ligand expression and release in leukemia: implications for NKG2D-mediated NK cell responses. J Immunol. 2012;189:1360–1371. doi: 10.4049/jimmunol.1200796. [DOI] [PubMed] [Google Scholar]
- 11.Paczulla AM, et al. Long-term observation reveals high-frequency engraftment of human acute myeloid leukemia in immunodeficient mice. Haematologica. 2017 doi: 10.3324/haematol.2016.153528. [DOI] [PMC free article] [PubMed] [Google Scholar]
- 12.Vivier E, Ugolini S, Blaise D, Chabannon C, Brossay L. Targeting natural killer cells and natural killer T cells in cancer. Nat Rev Immunol. 2012;12:239–252. doi: 10.1038/nri3174. [DOI] [PMC free article] [PubMed] [Google Scholar]
- 13.Reinisch A, Chan SM, Thomas D, Majeti R. Biology and Clinical Relevance of Acute Myeloid Leukemia Stem Cells. Semin Hematol. 2015;52:150–164. doi: 10.1053/j.seminhematol.2015.03.008. [DOI] [PMC free article] [PubMed] [Google Scholar]
- 14.Taussig DC, et al. Leukemia-initiating cells from some acute myeloid leukemia patients with mutated nucleophosmin reside in the CD34(-) fraction. Blood. 2010;115:1976–1984. doi: 10.1182/blood-2009-02-206565. doi:blood-2009-02-206565 [pii] [DOI] [PMC free article] [PubMed] [Google Scholar]
- 15.Quek L, et al. Genetically distinct leukemic stem cells in human CD34-acute myeloid leukemia are arrested at a hemopoietic precursor-like stage. J Exp Med. 2016;213:1513–1535. doi: 10.1084/jem.20151775. [DOI] [PMC free article] [PubMed] [Google Scholar]
- 16.Pabst C, et al. GPR56 identifies primary human acute myeloid leukemia cells with high repopulating potential in vivo. Blood. 2016 doi: 10.1182/blood-2015-11-683649. [DOI] [PubMed] [Google Scholar]
- 17.Krishnakumar R, Kraus WL. The PARP side of the nucleus: molecular actions, physiological outcomes, and clinical targets. Mol Cell. 2010;39:8–24. doi: 10.1016/j.molcel.2010.06.017. [DOI] [PMC free article] [PubMed] [Google Scholar]
- 18.Gasser S, Orsulic S, Brown EJ, Raulet DH. The DNA damage pathway regulates innate immune system ligands of the NKG2D receptor. Nature. 2005;436:1186–1190. doi: 10.1038/nature03884. [DOI] [PMC free article] [PubMed] [Google Scholar]
- 19.Esposito MT, et al. Synthetic lethal targeting of oncogenic transcription factors in acute leukemia by PARP inhibitors. Nat Med. 2015;21:1481–1490. doi: 10.1038/nm.3993. [DOI] [PubMed] [Google Scholar]
- 20.Muvarak NE, et al. Enhancing the Cytotoxic Effects of PARP Inhibitors with DNA Demethylating Agents - A Potential Therapy for Cancer. Cancer Cell. 2016;30:637–650. doi: 10.1016/j.ccell.2016.09.002. [DOI] [PMC free article] [PubMed] [Google Scholar]
- 21.Cimmino L, et al. Restoration of TET2 Function Blocks Aberrant Self-Renewal and Leukemia Progression. Cell. 2017;170:1079–1095.e1020. doi: 10.1016/j.cell.2017.07.032. [DOI] [PMC free article] [PubMed] [Google Scholar]
- 22.Poggi A, et al. Effective in vivo induction of NKG2D ligands in acute myeloid leukaemias by all-trans-retinoic acid or sodium valproate. Leukemia. 2009;23:641–648. doi: 10.1038/leu.2008.354. [DOI] [PubMed] [Google Scholar]
- 23.Salih HR, Rammensee HG, Steinle A. Cutting edge: down-regulation of MICA on human tumors by proteolytic shedding. J Immunol. 2002;169:4098–4102. doi: 10.4049/jimmunol.169.8.4098. [DOI] [PubMed] [Google Scholar]
- 24.Reim F, et al. Immunoselection of breast and ovarian cancer cells with trastuzumab and natural killer cells: selective escape of CD44high/CD24low/HER2low breast cancer stem cells. Cancer Res. 2009;69:8058–8066. doi: 10.1158/0008-5472.CAN-09-0834. [DOI] [PubMed] [Google Scholar]
- 25.Wang B, et al. Metastatic consequences of immune escape from NK cell cytotoxicity by human breast cancer stem cells. Cancer Res. 2014;74:5746–5757. doi: 10.1158/0008-5472.CAN-13-2563. [DOI] [PubMed] [Google Scholar]
- 26.Malladi S, et al. Metastatic Latency and Immune Evasion through Autocrine Inhibition of WNT. Cell. 2016;165:45–60. doi: 10.1016/j.cell.2016.02.025. [DOI] [PMC free article] [PubMed] [Google Scholar]
- 27.Zhang X, et al. IDH mutant gliomas escape natural killer cell immune surveillance by downregulation of NKG2D ligand expression. Neuro Oncol. 2016;18:1402–1412. doi: 10.1093/neuonc/now061. [DOI] [PMC free article] [PubMed] [Google Scholar]
- 28.Gojo I, et al. A Phase 1 Study of the PARP Inhibitor Veliparib in Combination with Temozolomide in Acute Myeloid Leukemia. Clin Cancer Res. 2017;23:697–706. doi: 10.1158/1078-0432.CCR-16-0984. [DOI] [PMC free article] [PubMed] [Google Scholar]
- 29.Audeh MW, et al. Oral poly(ADP-ribose) polymerase inhibitor olaparib in patients with BRCA1 or BRCA2 mutations and recurrent ovarian cancer: a proof-of-concept trial. Lancet. 2010;376:245–251. doi: 10.1016/S0140-6736(10)60893-8. [DOI] [PubMed] [Google Scholar]
- 30.Zitvogel L, Tesniere A, Kroemer G. Cancer despite immunosurveillance: immunoselection and immunosubversion. Nat Rev Immunol. 2006;6:715–727. doi: 10.1038/nri1936. [DOI] [PubMed] [Google Scholar]
- 31.André MC, et al. Impaired tumor rejection by memory CD8 T cells in mice with NKG2D dysfunction. Int J Cancer. 2012;131:1601–1610. doi: 10.1002/ijc.26191. [DOI] [PubMed] [Google Scholar]
- 32.Hilpert M, et al. p19 INK4d controls hematopoietic stem cells in a cell-autonomous manner during genotoxic stress and through the microenvironment during aging. Stem Cell Reports. 2014;3:1085–1102. doi: 10.1016/j.stemcr.2014.10.005. [DOI] [PMC free article] [PubMed] [Google Scholar]
- 33.Stavropoulou V, et al. HemaSphere. 2018 Aug;2(4):e51. doi: 10.1097/HS9.0000000000000051. Vol. 2018. [DOI] [PMC free article] [PubMed] [Google Scholar]
- 34.Zorko NA, et al. Mll partial tandem duplication and Flt3 internal tandem duplication in a double knock-in mouse recapitulates features of counterpart human acute myeloid leukemias. Blood. 2012;120:1130–1136. doi: 10.1182/blood-2012-03-415067. [DOI] [PMC free article] [PubMed] [Google Scholar]
- 35.Stavropoulou V, et al. MLL-AF9 Expression in Hematopoietic Stem Cells Drives a Highly Invasive AML Expressing EMT-Related Genes Linked to Poor Outcome. Cancer Cell. 2016;30:43–58. doi: 10.1016/j.ccell.2016.05.011. [DOI] [PubMed] [Google Scholar]
- 36.Ko M, et al. Ten-Eleven-Translocation 2 (TET2) negatively regulates homeostasis and differentiation of hematopoietic stem cells in mice. Proc Natl Acad Sci U S A. 2011;108:14566–14571. doi: 10.1073/pnas.1112317108. [DOI] [PMC free article] [PubMed] [Google Scholar]
- 37.Guryanova OA, et al. DNMT3A mutations promote anthracycline resistance in acute myeloid leukemia via impaired nucleosome remodeling. Nat Med. 2016;22:1488–1495. doi: 10.1038/nm.4210. [DOI] [PMC free article] [PubMed] [Google Scholar]
- 38.Calabrese CR, et al. Anticancer chemosensitization and radiosensitization by the novel poly(ADP-ribose) polymerase-1 inhibitor AG14361. J Natl Cancer Inst. 2004;96:56–67. doi: 10.1093/jnci/djh005. [DOI] [PubMed] [Google Scholar]
- 39.Koerner SP, et al. An Fc-optimized CD133 antibody for induction of NK cell reactivity against myeloid leukemia. Leukemia. 2016 doi: 10.1038/leu.2016.194. [DOI] [PubMed] [Google Scholar]
- 40.Wang H, et al. Prominent oncogenic roles of EVI1 in breast carcinoma. Cancer Res. 2017 doi: 10.1158/0008-5472.CAN-16-0593. [DOI] [PubMed] [Google Scholar]
- 41.Schnittger S, et al. New score predicting for prognosis in PML-RARA+, AML1-ETO+, or CBFBMYH11+ acute myeloid leukemia based on quantification of fusion transcripts. Blood. 2003;102:2746–2755. doi: 10.1182/blood-2003-03-0880. [DOI] [PubMed] [Google Scholar]
- 42.Livak KJ, Schmittgen TD. Analysis of relative gene expression data using real-time quantitative PCR and the 2(-Delta Delta C(T)) Method. Methods. 2001;25:402–408. doi: 10.1006/meth.2001.1262. [DOI] [PubMed] [Google Scholar]
- 43.Eppert K, et al. Stem cell gene expression programs influence clinical outcome in human leukemia. Nat Med. 2011;17:1086–1093. doi: 10.1038/nm.2415. [DOI] [PubMed] [Google Scholar]
- 44.Ng SW, et al. A 17-gene stemness score for rapid determination of risk in acute leukaemia. Nature. 2016;540:433–437. doi: 10.1038/nature20598. [DOI] [PubMed] [Google Scholar]
- 45.Love MI, Huber W, Anders S. Moderated estimation of fold change and dispersion for RNA-seq data with DESeq2. Genome Biol. 2014;15:550. doi: 10.1186/s13059-014-0550-8. [DOI] [PMC free article] [PubMed] [Google Scholar]
- 46.Döhner H, et al. Diagnosis and management of AML in adults: 2017 ELN recommendations from an international expert panel. Blood. 2017;129:424–447. doi: 10.1182/blood-2016-08-733196. [DOI] [PMC free article] [PubMed] [Google Scholar]
- 47.Ley TJ, et al. Genomic and epigenomic landscapes of adult de novo acute myeloid leukemia. N Engl J Med. 2013;368:2059–2074. doi: 10.1056/NEJMoa1301689. [DOI] [PMC free article] [PubMed] [Google Scholar]
Associated Data
This section collects any data citations, data availability statements, or supplementary materials included in this article.


