

Abstract
Asthma is the most common chronic lung disease in children and young adults worldwide. Airway remodelling (including increased fibroblasts and myofibroblasts in airway walls due to chronic inflammation) differentiates asthmatic from non-asthmatic airways. The increase in airway fibroblasts and myofibroblasts occurs via epithelial to mesenchymal transition (EMT) where epithelial cells lose their tight junctions and are transdifferentiated to mesenchymal cells, with further increases in myofibroblasts occurring via fibroblast-myofibroblast transition (FMT). Transforming growth factor (TGF)-β is the central EMT- and FMT-inducing cytokine. In this study, we have used next generation sequencing to delineate the changes in the transcriptome induced by TGF-β treatment of WI-38 airway fibroblasts in both the short term and after differentiation into myofibroblasts, to gain an understanding of the contribution of TGF-β induced transdifferentiation to the asthmatic phenotype. The data obtained from RNAseq analysis was confirmed by quantitative PCR (qPCR) and protein expression investigated by western blotting. As expected, we found that genes coding for intermediates in the TGF-β signalling pathways (SMADs) were differentially expressed after TGF-β treatment, SMAD2 being upregulated and SMAD3 being downregulated as expected. Further, genes involved in cytoskeletal pathways (FN1, LAMA, ITGB1) were upregulated in myofibroblasts compared to fibroblasts. Importantly, genes that were previously shown to be changed in asthmatic lungs (ADAMTS1, DSP, TIMPs, MMPs) were similarly differentially expressed in myofibroblasts, strongly suggesting that TGF-β mediated differentiation of fibroblasts to myofibroblasts may underlie important changes in the asthmatic airway. We also identified new intermediates of signalling pathways (PKB, PTEN) that are changed in myofibroblasts compared to fibroblasts. We have found a significant number of genes that are altered after TGF-β induced transdifferentiation of WI-38 fibroblasts into myofibroblasts, many of which were expected or predicted. We also identified novel genes and pathways that were affected after TGF-β treatment, suggesting additional pathways are activated during the transition between fibroblasts and myofibroblasts and may contribute to the asthma phenotype.
Subject terms: Cellular signalling networks, Experimental models of disease
Introduction
Asthma is the most common chronic lung disease in children and young adults worldwide and causes a significant burden on health systems as well as loss of productivity1. Asthma is a complex disease which is categorised and treated based on clinical characteristics2; the variability and lack of treatment response in steroid-resistant allergic asthma suggests this process is suboptimal. A deeper understanding of the molecular/cellular changes in asthma that underpin severity/refractoriness of disease are required to progress toward effective treatment strategies3.
Airway structural cells play a crucial role in asthma3, expressing inflammatory proteins and releasing mediators4,5 that lead to airway remodelling and aberrant responses to external stimuli. Airway remodelling (including increased fibroblasts, myofibroblasts and smooth muscle fibres in airway wall as a result of chronic inflammation) differentiates asthmatic from non-asthmatic airways6. The increase in airway fibroblasts and myofibroblasts occurs via epithelial to mesenchymal transition (EMT) wherein epithelial cells lose their tight junctions and are transdifferentiated to mesenchymal cells7,8 and via fibroblast to myofibroblast transition (FMT)9, with transforming growth factor (TGF)-β being the central EMT/FMT-inducing cytokine8,9. TGF-β is increased in asthmatic airways and further enhanced by infection-induced cytokines (e.g. tumour necrosis factor alpha (TNFα)10,11). We have shown that primary airway fibroblasts transdifferentiated to myofibroblasts in the presence of TGF-β have reduced ability to produce type-I interferons (IFNs)12. Importantly, glucocorticosteroids (GCS), the mainstay of current asthma treatment, have markedly reduced anti-inflammatory effects on myofibroblasts13, which may be at least in part, due to the increased levels of the inactive isoform of glucocorticoid receptor (GRβ) in myofibroblasts14. Together, this suggests that increased myofibroblasts that may have differentiated from fibroblasts due to the high levels of TGF-β in the asthmatic airways, may contribute to impaired innate responses that characterise severe, steroid resistant asthma.
In this study we have used the power of unbiased next generation sequencing to delineate the changes in the fibroblast transcriptome induced by TGF-β treatment in the short term and after differentiation into myofibroblasts. As expected, we found that genes that code for intermediates in the TGF-β signalling pathways were differentially expressed after treatment. Also, as expected, genes involved in cytoskeletal pathways were differentially expressed in myofibroblasts compared to fibroblasts. Importantly, several genes that were previously shown to be changed in asthmatic lungs were also differentially expressed in myofibroblasts, strongly suggesting that TGF-β mediated differentiation of fibroblasts to myofibroblasts may underlie important changes in the asthmatic airway. Importantly, our work builds on our previous work and provides further confirmation that the human lung fibroblast WI-38 cell line used in this study represents a good cell culture model to study aspects of asthma after myofibroblast transdifferentiation.
Methods
Cells and treatment
WI-38 normal lung fibroblast cells (ATCC) were grown in low-glucose Dulbecco’s Modified Eagle Medium (DMEM) (Sigma) supplemented with 10% foetal bovine serum (FBS) and antibiotics (penicillin, streptomycin, neomycin; Gibco), at 37 °C in an atmosphere of 5% CO2. Cells were seeded into T25 flasks and grown to confluence. When confluent, six flasks were treated with TGF-β (2 ng/mL) and the media changed in the remaining flasks (day 0). The following day (day 1) RNA was extracted from 5 treated and 5 untreated flasks. The cells in the remaining flasks (one each of treated and untreated) were used to seed 5 fresh flasks and maintained for 20 days, changing media +/− TGF-β every two days. The number of cells seeded on day 1 was carefully optimised to ensure that flasks would be ~90% confluent on day 20. On day 20 after treatment, RNA was extracted from 5 treated and 5 untreated flasks of cells.
Our previous work14 has shown that one day after treatment with TGF-β, WI-38 cells retain their fibroblast phenotype. Clear myofibroblast phenotype (>95% cells) is observed after 20 days of treatment, hence this endpoint (day 20) was used to study changes after transdifferentiation to myofibroblasts.
Transdifferentiation of WI-38 cells
Transdifferentiation of fibroblasts to myofibroblasts was determined by immunofluorescence assays and western blotting for α-smooth muscle actin (αSMA) and vimentin, as previously demonstrated14. Cell expression of αSMA is a specific marker of fibroblast to myofibroblast transdifferentiation, while vimentin is a non-specific fibroblast and myofibroblast marker15.
WI-38 cells treated with TGF-β or left untreated were fixed in 4% formaldehyde at days 0, 1, 10 or 20 for 10 min and permeabilized with 0.5% Triton X-100 for 10 min. Cells were then incubated with antibodies to vimentin and αSMA (1:100) for 30 min at room temperature and bound antibodies detected by Alexa Fluor conjugated secondary antibodies (1:1000, 30 min; Life Technologies). Coverslips were mounted on slides in ProLong Gold reagent with DAPI (Life Technologies). Samples were examined under a Nikon Ti Eclipse confocal laser-scanning microscope (CLSM) with Nikon 60×/1.40 oil immersion lens (Plan Apo VC OFN25 DIC N2; optical section of 0.5 µm) and the NIS Elements AR software (Nikon Corporation, Japan).
WI-38 cells treated with TGF-β or left untreated, were lysed in RIPA lysis buffer (150 mM NaCl, 1% Triton X-100, 0.5% sodium deoxycholate, 0.1% SDS, 50 mM Tris, with protease and phosphatase inhibitors) at day 1 or day 20. Lysates were electrophoresed on 10% SDS-PAGE and proteins transferred to nitrocellulose membranes. Cell lysates were subjected to SDS-polyacrylamide electrophoresis followed by transfer to nitrocellulose membranes in Tris-glycine-ethanol buffer (25 mM Tris HCl, 192 mM glycine, 20% ethanol). Blots were blocked for 1 h in Odyssey Blocking Buffer containing 0.1% Tween 20, prior to overnight incubation with primary antibodies (αSMA, ab7817, Abcam and vimentin, sc-5565, Santa Cruz Biotechnology) diluted in Odyssey Blocking Buffer containing 0.1% Tween 20 at 4 °C. Primary antibodies were detected using LI-COR IRDye Infrared Dye (1:15000) secondary antibodies. Blots were visualized using the Odyssey Fc Infrared Imager (LI-COR Biotechnology, NE, USA). Blots were also probed for expression of vinculin, ADAMTS1, SMAD7, RHEB, with tubulin being used as loading control.
RNA extraction
RNA samples were collected on day 1 and day 20 after TGF-β treatment and 5 replicates were collected for treated/untreated samples at both time points. Media was removed from the flasks and cells washed with cold PBS. 1 mL of TRIzol was added to each flask to cover the cell monolayer, cells were scraped from the flask, transferred to a microcentrifuge tube and incubated at room temperature for 5 min. Next, 200 µL of chloroform was added and the samples vortexed for 15 sec, followed by incubation on ice for 2–3 min and centrifugation at 10,000 rpm for 15 min at 4 °C. The aqueous phase was removed into a new tube and an equal volume (~500 µL) of isopropanol was added. Samples were vortexed briefly then placed at −20 °C to allow RNA to precipitate overnight. The following day, samples were centrifuged at 10,000 rpm for 10 min at 4 °C. The supernatant was removed, and the RNA pellet was washed in 1 mL of 75% ethanol in DEPC water by centrifugation at 7500 rpm for 5 min at 4 °C. The pellet was air dried to remove residual ethanol and 30–50 µL of DEPC water was added, depending on pellet size. RNA quality was assessed using a Nanodrop instrument and Bioanalyzer 2100 (Agilent) and samples stored at −80 °C until required.
RNA sequencing
Three RNA samples for each timepoint and treatment (12 samples in total) were selected based on quantity and quality of the collected RNA (RIN >9.5). The libraries were generated using the New England Biolabs Ultra Directional RNA library Prep Kit for Illumina following the manufacturer’s recommended protocol using 1 µg of total RNA. Library size distributions and concentrations were assessed using the Bioanalyzer 2100. Libraries were pooled in equimolar amounts to a final concentration of 2 ng/µL and stored at −20 °C until required. Sequencing was performed on an Illumina NextSeq. 500 using a Mid Output paired end format kit at the Ramaciotti Centre for Genomics, University of New South Wales.
cDNA synthesis and real-time PCR
cDNA was synthesised using the High Capacity cDNA reverse transcription kit (Applied Biosystems) following the manufacturer’s instructions. Briefly, a 2x master mix was prepared containing 2x reverse transcription buffer, 8 mM dNTPs, 2x RT random primers and 50U MultiScribe reverse transcriptase. 10 µL of the 2x master mix was pipetted into each well. 1 µg of RNA was diluted to a final volume of 10 µL in DEPC water, then added to the master mix, to give a final volume of 20 µL. The reverse transcription reaction was performed using the following conditions: 25 °C for 10 min, 37 °C for 120 min, 85 °C for 5 min then hold at 4 °C. After cycling, 30 µL of DEPC water was added to each sample, and cDNA was stored at −20 °C until required.
To generate a standard curve for real-time PCR analysis, an equal volume from each sample was pooled. Standard 1 was generated by diluting the initial pool 1:10. The cDNA was then serially diluted 1:5 to generate standards 2–5. Samples for testing were diluted 1:50 prior to analysis. Real-time PCR reactions were performed using SsoAdvanced SYBR green supermix (Biorad). Mastermix containing SsoAdvanced SYBR green, forward and reverse primers to a final concentration of 300 nM and water to 16 µL was pipetted into each well. 4 µL of standard, sample or water was added to the appropriate wells. Plates were sealed, centrifuged at 1000 rpm for 1 min then cycled on a Biorad CFX96 using the following conditions: 98 °C for 30 sec, 40 cycles of 95 °C for 10 sec, 60 °C for 30 sec followed by a plate read, then one cycle of 95 °C for 10 sec followed by a melt curve from 60 °C to 95 °C at 0.5 °C increments with 0.5 sec dwell time and plate read.
All samples were amplified in duplicate and GAPDH was included as a loading control. Data were analysed using CFX Manager v3.1 (Bio-Rad), and are presented in arbitrary units relative to GAPDH. Primers were purchased from Sigma and the sequences are available on request.
Data analysis
The resulting raw sequence data reads from RNA sequencing were trimmed using the Trimmomatic tool16 to ensure the highest quality sequences for mapping and differential expression analysis. The remaining high quality reads were mapped to the human reference genome (hg19) using the R package Rsubread17. Genes having less than 10 count-per-million reads (cpm) in half of the 48 samples were filtered out using the “edgeR” library. The R package limma18,19 was used for differential gene expression analysis, with multiple testing adjustments made using the Benjamini and Hochberg method20. Significant differentially expressed genes for a particular comparison were identified by selecting genes with a p-value < 0.01. Pathway analysis was performed using GeneGo.
GraphPad Prism v7 was used to assess differences in expression in real-time PCR results for different conditions. Statistical analysis was performed using two-way ANOVA followed by correction for multiple comparisons using Tukey’s test. Data were then grouped by treatment and time. Volcano plots of the data were generated with XLStat within Excel. Correlation between the RNASeq data and that obtained from real-time PCR for the same set of genes was assessed by XLStat within Excel and is represented as R2, the square of the Pearson’s correlation coefficient.
Results
TGF-β induced transdifferentiation
As we have shown previously14, TGF-β treatment of WI-38 fibroblast cell line over 20 days resulted in differentiation of the cell line to a myofibroblast phenotype as shown by the increased expression of αSMA (Fig. 1) compared to cells without TGF-β (compare lower band in lanes 3 and 4). Culture of WI-38 cells over 20 days with TGF-β had no effect on vimentin expression (compare higher band in lanes 2 and 4). The image of the full-length blot is provided in Supplementary Information (Fig. S1). Consistent with the western blot analysis and as we have shown previously14, indirect immunofluorescence showed that TGF-β treatment for 20 days induced fibroblast to myofibroblast transdifferentiation in WI-38 cells, indicated by the presence of positive αSMA staining in majority of the treated cells (Fig. S2, images in the middle column). No WI-38 cells were positive for αSMA after treatment for one day (images labelled Day 1) and only rare cells after treatment for 10 days (images labelled Day 10). WI-38 cells were positive for vimentin at all time points analysed (day 0, 1, 10, 20).
Figure 1.
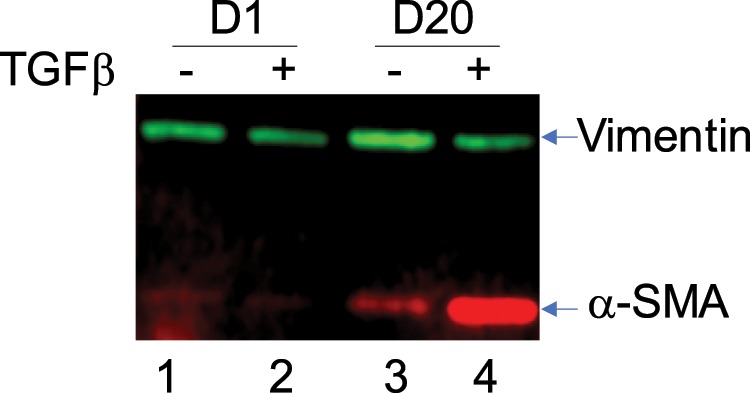
Culture of WI-38 cells in presence of TGF-β for 20 days leads to transdifferentiation. WI-38 cells were cultured in presence of TGF–β (2 ng/ml, indicated by ‘+’ above the lane) or left untreated (−) for 20 days. Cells were lysed on day 1 and day 20 and analysed for expression of vimentin and αSMA by western blotting as described in the Methods section. The specific bands are indicated.
Differential gene expression summary
Following quality control and mapping for all samples and prior to differential gene expression analysis, hierarchical clustering was performed using a matrix of Euclidean distances calculated from the mapped read counts for the 30 most highly expressed genes. The data in Fig. 2 show that the samples cluster primarily according to the time point and treatment, as expected. Volcano plots of the data showed that limited number of genes were significantly up or down regulated, with majority of the changes remaining within ±1 log fold change (Fig. 3).
Figure 2.

RNASeq samples cluster by treatment and timepoint. Hierarchical clustering of each sample was performed using the 30 most highly expressed genes. Samples with and without TGF-β are indicated (TGFβ, no TGFβ). D1 – day one after treatment, D20 – day 20 after treatment. Numbers on the right are gene ID numbers as found in the NCBI Gene database. Gradient from light to dark indicates the gene expression value, where dark blue represents higher expression and light green represents lower expression.
Figure 3.

Volcano plots of RNASeq samples by treatment and timepoint. The negative log10 transformed p-values are plotted against log2 fold change. The comparisons are log fold change in no TGF-β vs TGF-β for day and day 20 of culture (plots on the left) and in day 1 vs day 20 without (no TGF-β) or with TGF-β (plots on the right). Log2 fold change = ±1 is indicated by dashed vertical lines. The horizontal dashed lines indicate p = 0.001. Blue dots indicate genes with p > 0.001, green dots indicate genes with p < 0.001, red dots indicate genes with p < 0.001, log2 fold change larger than ±1.0. Selected differentially expressed genes are labelled.
Differentially expressed genes were determined for the following comparisons: Day 1 with TGF-β versus D1 without TGF-β (D1+ TGF-β vs D1) – to detect gene expression changes that occur early after initial short term TGF-β treatment; Day 20 with TGF-β versus D20 without TGF-β (D20+ TGF-β vs D20) – to detect gene expression changes that occur over long term TGF-β treatment but that are not related to any changes that occur due to the length of time cells are being cultured; Day 20 with TGF-β versus D1 with TGF-β (D20+ TGF-β vs D1+ TGF-β) – to detect gene expression changes that occur after long term TGF-β treatment, above what may occur after short term treatment; Day 20 without TGF-β versus Day 1 without TGF-β (D20 vs D1) – to detect gene expression changes that occur due to cells being in culture long term. Using an adjusted p value (q value) cut off p < 0.01, and log2(fold change) <−2 or >2, 34 genes were identified in the D1+ TGF-β vs D1 comparison; 61 genes were identified in the D20+ TGF-β vs D20 comparison; 49 genes were identified in the D20+ TGF-β vs D1+ TGF-β comparison; and 126 genes were identified in the D20 vs D1 comparison. The top 10 differentially expressed genes (sorted by most upregulated to most downregulated) for each comparison are shown in Table 1.
Table 1.
Top 10 differentially expressed genes for each of the four treatment comparisons.
| D1+ TGFβ vs D1 | logFC | D20+ TGFβ vs D20 | logFC | D20+ TGFβ vs D1+ TGFβ | logFC | D20 vs D1 | logFC |
|---|---|---|---|---|---|---|---|
| IGFBP3 | 4.15 | TXNIP | −5.18 | RASL12 | 3.75 | HJURP | −3.42 |
| TXNIP | −3.57 | A2M | −4.70 | ADAMTS5 | 3.64 | TTK | −3.32 |
| AMIGO2 | 3.53 | ADAMTS19 | −4.13 | ADAMTS9 | 3.62 | SKA1 | −3.30 |
| ADAMTS9 | −2.73 | LZTS1 | −3.53 | RGS4 | −3.32 | AURKB | −3.28 |
| HSD17B2 | −2.59 | SPOCK1 | 3.45 | FAM43A | 3.05 | BMP4 | 3.27 |
| SEMA7A | 2.57 | GPX3 | −3.41 | ALDH1A3 | 2.91 | KIF18B | −3.27 |
| DLL4 | −2.54 | POSTN | 3.33 | MXRA5 | 2.88 | SKA3 | −3.21 |
| NPTX1 | −2.52 | ARRDC4 | −3.04 | SLC40A1 | 2.84 | NEK2 | −3.21 |
| RASL12 | −2.52 | ANKRD33B | −2.92 | SLC7A14 | 2.73 | CDC20 | −3.21 |
| SERPINE2 | 2.42 | WFDC1 | −2.86 | SERPINE1 | −2.72 | MKI67 | −3.17 |
Pathway analysis reveals pathways altered after TGF-β treatment
Specific pathways that were altered by TGF-β treatment were identified by pathway analysis. The top pathway maps for the D20+ TGF-β vs D20 comparison, representing long term TGF-β-initiated changes in gene expression, included cytoskeleton remodelling (including TGF-β and wingless-type mouse mammary tumour virus (WNT) remodelling), cell adhesion pathways (including chemokines and adhesion, and integrin-mediated cell adhesion and migration), the epidermal growth factor receptor (EGFR) signalling pathway and regulation of eukaryotic initiation factor 4 F (EIF4F) activity. The top 10 pathways are shown in Table 2.
Table 2.
Top 10 pathways for D20+ TGFβ vs D20 samples.
| Pathway Maps | Total # genes | # genes in data | pValue | |
|---|---|---|---|---|
| 1 | Cytoskeleton remodeling_TGF, WNT and cytoskeletal remodeling | 111 | 74 | 3.934E-29 |
| 2 | Cytoskeleton remodeling_Cytoskeleton remodeling | 102 | 67 | 6.556E-26 |
| 3 | Cell adhesion_Chemokines and adhesion | 100 | 58 | 9.719E-19 |
| 4 | Immune response_Oncostatin M signaling via MAPK in human cells | 37 | 29 | 3.477E-15 |
| 5 | Immune response_Oncostatin M signaling via MAPK in mouse cells | 35 | 27 | 6.413E-14 |
| 6 | Development_EGFR signaling pathway | 71 | 41 | 1.523E-13 |
| 7 | Cell cycle_The metaphase checkpoint | 36 | 27 | 2.115E-13 |
| 8 | Cell adhesion_Integrin-mediated cell adhesion and migration | 48 | 32 | 2.588E-13 |
| 9 | Cell adhesion_Role of tetraspanins in the integrin-mediated cell adhesion | 37 | 27 | 6.455E-13 |
| 10 | Translation_Regulation of EIF4F activity | 53 | 33 | 1.942E-12 |
The top pathway maps for D20+ TGF-β vs D1+ TGF-β comparison, to detect long term changes in response to TGF-β treatment, above what is seen after the initial 24 hours of treatment, included cytoskeleton remodelling (including TGF-β and WNT remodelling), cell adhesion pathways (including chemokines and adhesion, and integrin-mediated cell adhesion and migration) regulation of EIF4F activity and intermediates in the signalling pathways for protein kinase B (PKB) and phosphatase and tensin homolog (PTEN). The top 10 pathways are shown in Table 3.
Table 3.
Top 10 pathways for D20+ TGFβ vs D1+ TGFβ samples.
| Pathway Maps | Total # genes | # genes in data | pValue | |
|---|---|---|---|---|
| 1 | Cytoskeleton remodeling_TGF, WNT and cytoskeletal remodelling | 111 | 81 | 6.586E-31 |
| 2 | Cytoskeleton remodeling_Cytoskeleton remodeling | 102 | 74 | 4.251E-28 |
| 3 | Cell adhesion_Chemokines and adhesion | 100 | 62 | 7.474E-18 |
| 4 | Transport_Clathrin-coated vesicle cycle | 71 | 45 | 2.746E-13 |
| 5 | Cell adhesion_Integrin-mediated cell adhesion and migration | 48 | 35 | 4.660E-13 |
| 6 | Translation_Regulation of EIF4F activity | 53 | 37 | 5.199E-13 |
| 7 | Cell cycle_Influence of Ras and Rho proteins on G1/S Transition | 53 | 37 | 5.199E-13 |
| 8 | Signal transduction_AKT signaling | 43 | 32 | 1.766E-12 |
| 9 | Signal transduction_PTEN pathway | 46 | 33 | 3.282E-12 |
| 10 | Development_WNT signaling pathway. Part 2 | 53 | 36 | 3.282E-12 |
RNASeq analysis is confirmed by real-time PCR
We next chose a series of targets within the identified pathways for confirmation testing. A number of genes were identified in multiple pathways, and details of the genes found in each pathway as identified in the initial RNASeq analysis are shown in Table 4. The target list included genes that showed significant differences in expression between D20 and D20+ TGF-β, as the main focus of this study was to identify changes that occur after TGF-β induced transdifferentiation. Details of the log fold change and adjusted p-values of comparisons between D20 +TGF-β vs D20 for genes included in the confirmation testing are shown in Table 5. Details of the log fold change and adjusted p-values of comparisons between D20+ TGF-β vs D1+ TGF-β for genes included in the confirmation testing are shown in Table 6.
Table 4.
Biological pathways in which gene expression is significantly altered with TGF-β treatment.
| Biological pathway | Genes from this study in pathway |
|---|---|
| Translation_Regulation of EIF4F activity | RHEB |
| Cytoskeleton remodeling_TGF, WNT and cytoskeletal remodeling | FN1, VCL, RHEB, LAMA1, CSNK2B, CDKN2B, SMAD2, SMAD3 |
| Cell adhesion_Chemokines and adhesion | ITGB1, FN1, VCL, LAMA1, LAMA4, MMP1 |
| Cell adhesion_Integrin-mediated cell adhesion and migration | ITGB1, FN1, VCL, LAMA1 |
| Cell adhesion_Role of tetraspanins in the integrin-mediated cell adhesion | ITGB1, FN1, VCL |
| Immune response_Oncostatin M signaling via MAPK in human cells | LDLR, TIMP1 |
| Signal transduction_AKT signaling | RHEB |
| Signal transduction_PTEN pathway | ITGB1, RHEB |
Table 5.
Data summary from RNASeq analysis – D20+ TGFβ vs D20.
| Gene Symbol | Gene Name | LogFC | Adjusted p value |
|---|---|---|---|
| Up-regulated genes | |||
| CDKN2B | cyclin-dependent kinase inhibitor 2B (p15, inhibits CDK4) | 2.424 | 5.22E-26 |
| FN1 | fibronectin 1 | 1.956 | 6.05E-36 |
| LAMA1 | laminin, alpha 1 | 1.117 | 2.50E-24 |
| MMP1 | matrix metallopeptidase 1 | 2.436 | 3.49E-27 |
| Down-regulated genes | |||
| LAMA4 | laminin, alpha 4 | −1.698 | 4.33E-31 |
| SMAD3 | SMAD family member 3 | −1.849 | 6.41E-28 |
Table 6.
Data summary from RNASeq analysis – D20+ TGFβ vs D1+ TGFβ.
| Gene Symbol | Gene Name | LogFC | Adjusted p value |
|---|---|---|---|
| CDKN2B | cyclin-dependent kinase inhibitor 2B (p15, inhibits CDK4) | 1.009 | 8.38E-15 |
| FN1 | fibronectin 1 | 0.203 | 0.001 |
| LAMA1 | laminin, alpha 1 | 0.398 | 7.28E-09 |
| MMP1 | matrix metallopeptidase 1 | 1.443 | 6.15E-18 |
| LAMA4 | laminin, alpha 4 | −0.554 | 5.63E-11 |
| SMAD3 | SMAD family member 3 | — | — |
For each target gene shown in Table 4, all 5 replicate RNA samples were included in the real-time PCR analysis and samples were analysed in duplicate. Data for each gene are shown in Fig. 4 and represented relative to GAPDH. GAPDH was chosen as reference as analysis of RNASeq data showed that GAPDH was stably expressed across replicates and at different time points (Fig. S3). We analysed the genes for differences in expression between D20+ TGF-β and D1+ TGF-β and compared the real-time PCR results (Fig. 4) to the RNASeq results (Table 5).
Figure 4.

Real-time PCR confirmation of RNASeq results. Real-time PCR was performed on 5 samples for each of the treatment times, Day 1 (D1), D1+ TGFβ, D20 and D20+ TGFβ for a series of genes. Graphs show the number of arbitrary units relative to GAPDH expression for: (A) CDKN2B, (B) FN1, (C) LAMA1, (D) LAMA4, (E) MMP1, (F) SMAD3, (G) VCL, (H) LDLR, (I) TIMP1, (J) CSNK2B, (K) ITGB1, (L) RHEB. Mean ± SEM are shown for each set, *p < 0.05, **p < 0.01, ***p < 0.001.
The first seven genes (cyclin-dependent kinase 4 inhibitor B (CDKN2B), fibronectin 1 (FN1), laminin subunit alpha 1 (LAMA1), laminin subunit alpha 4 (LAMA4), matrix metalloproteinase 1 (MMP1), SMAD3 (Smad proteins are homologues of the Drosophila protein, mothers against decapentaplegic (Mad) and the Caenorhabditis elegans protein Sma), vinculin (VCL)) showed highly significant differences (p < 1 × 10⁻²⁰) in gene expression between D20+ TGF-β and D20 samples, as detected by RNASeq analysis. CDKN2B, FN1, LAMA1 and MMP1 were upregulated, while LAMA4, SMAD3 and VCL were downregulated in D20+ TGF-β vs D20 samples. The real-time PCR results confirmed a significant difference (p < 0.005) in gene expression between D20+ TGF-β and D20 samples for CDKN2B, FN1, LAMA1, LAMA4, MMP1 and SMAD3 (Fig. 4A–F); the direction of the fold change was maintained. No significant difference in VCL gene expression was detected in the confirmation real-time PCR (Fig. 4G), however the direction of the fold change (D20+ TGF-β had lower levels of RNA compared to D20) was maintained.
The next 2 genes (low density lipoprotein receptor (LDLR) and tissue inhibitor of metalloproteinases metallopeptidase inhibitor 1 (TIMP1) showed moderately significant upregulation (p < 1 × 10⁻⁵) in gene expression between D20+ TGF-β and D20 samples, as detected by RNASeq analysis and a significant upregulation at D20+ TGF-β vs D20 by real-time PCR (Fig. 4H,I).
The next 3 genes (casein kinase II subunit beta (CSNK2B), integrin beta 1 (ITGB1) and Ras homolog enriched in brain (RHEB)) were included as they were identified in pathways of interest. All three genes showed low levels of significant differences (p < 1 × 10⁻³) in gene expression between D20+ TGF-β and D20 samples, as detected by RNASeq analysis. CSNK2B was downregulated, while ITGB1 and RHEB were upregulated in D20+ TGF-β vs D20 samples. No significant difference in gene expression between D20+ TGF-β and D20 samples was identified for CSNK2B, however a significant upregulation was seen for RHEB and ITGB1 (Fig. 4J–L).
We next analysed the same cohort of genes for any differences in expression between D20+ TGF-β and D1+ TGF-β and compared the real-time PCR results (Fig. 4) to the RNASeq results (Table 6). There was only one gene, VCL, that showed a highly significant difference (p < 1 × 10⁻²⁰) in gene expression between D20+ TGF-β and D1+ TGF-β samples in the RNASeq data, though the logFC detected by RNASeq was small at −0.483. The real-time PCR results show no significant difference in expression between these samples for VCL (Fig. 4G).
Of the genes demonstrating moderately significant differences (p < 1 × 10⁻⁵) in gene expression between D20+ TGF-β and D1+ TGF-β in the RNASeq data, namely CDKN2B, LAMA1, LAMA4, MMP1, LDLR, CSNK2B and ITGB1, only CDKN2B, LAMA1, MMP1 and LDLR showed a significant difference in these samples by real-time PCR (Fig. 4A,C,E,H). The remaining genes, LAMA4, CSNK2B, and ITGB1, showed no significant difference between D20+ TGF-β and D1+ TGF-β samples. There were two genes that showed a low level of significance (p < 1 × 10⁻³) between D20+ TGF-β and D1+ TGF-β samples in the RNASeq analysis, FN1 and RHEB. Of these genes the real-time PCR detected a significant difference in gene expression only for FN1 (Fig. 4B).
There were two genes included in the real-time PCR analysis that were not identified as having any level of significant difference in expression between D20+ TGF-β and D1+ TGF-β in the RNASeq analysis, SMAD3 and TIMP1, and no difference in expression was detected for SMAD3 by real-time PCR (Fig. 4F,I). However, a highly significant upregulation in expression was detected at D20+ TGF-β compared to D1+ TGF-β for TIMP1.
We then selected a number of genes that were of interest based on the literature for relevance to asthma (A disintegrin and metalloproteinase with thrombospondin motifs 1 (ADAMTS1)21, desmoplakin (DSP)22 and glucocorticoid receptor (GR)23) or for relevance in TGF-β pathways (SMAD2 and SMAD7)24 and analysed the samples by real-time PCR (Fig. 5). We found a significant difference in gene expression between D20+ TGF-β and D20 samples for all genes except for SMAD7 (Fig. 5A–E). A targeted search for these genes in the RNASeq data found that ADAMTS1 was significantly downregulated, while DSP and GR were significantly upregulated in D20+ TGF-β vs D20, and SMAD2 was significantly upregulated in D20+ TGF-β versus D1+ TGF-β samples (Table 7); this data correlated well with the real-time PCR results as shown by correlation analysis (Fig. S4, R2 = 0.7534).
Figure 5.

Real-time PCR of asthma and TGF-β pathway genes. (A–E) Realtime PCR was performed on as per the legend to Fig. 4 for a series of genes identified from literature to be important in asthma. Graphs show the number of arbitrary units relative to GAPDH expression for: (A) GR-alpha, (B) SMAD2, (C) SMAD7, (D) DSP, (E) ADAMTS1. (F–H) Real-time PCR was performed as in (A–E) above for treatment times D1, D1+ TGFβ, D10, D10+ TGFβ, D15, D15+ TGFβ, D20 and D20+ TGFβ for (F) ADAMTS1, (G) DSP, (H) GR-alpha. Mean ± SEM are shown for each set, *p < 0.05, **p < 0.01, ***p < 0.001.
Table 7.
RNASeq results for genes selected based on literature.
| Dataset | Gene Symbol | Gene Name | LogFC | Adjusted p value |
|---|---|---|---|---|
| D20+ TGFβ vs D20 | ADAMTS1 | ADAM metallopeptidase with thrombospondin type 1 motif, 1 | −2.210 | 1.42E-27 |
| DSP | desmoplakin | 1.413 | 3.29E-13 | |
| SMAD2 | SMAD family member 2 | — | — | |
| SMAD7 | SMAD family member 7 | — | — | |
| NR3C1/GR | nuclear receptor subfamily 3, group C, member 1 (glucocorticoid receptor) | 0.423 | 1.43E-08 | |
| D20+ TGFβ vs D1+ TGFβ | ADAMTS1 | ADAM metallopeptidase with thrombospondin type 1 motif, 1 | — | — |
| DSP | desmoplakin | — | — | |
| SMAD2 | SMAD family member 2 | 0.115 | 0.006 | |
| SMAD7 | SMAD family member 7 | |||
| NR3C1/GR | nuclear receptor subfamily 3, group C, member 1 (glucocorticoid receptor) | — | — |
We extended our real-time PCR analysis for ADAMTS1, DSP and GR to determine at which point in the transdifferentiation the observed change in gene expression became evident (Fig. 5F–H). We found that ADAMTS1 was upregulated after 10 days in culture (D10); this change was suppressed in TGF-β treated samples (Fig. 5F, compare TGF-β treated with untreated samples at D1, D10, D15 and D20). DSP was upregulated on D1 in TGF-β treated versus untreated samples and this trend continued through the experiment, with a significant change observed at D20 (Fig. 5G). The data strongly suggests that TGF-β induced pathways suppress the expression of ADAMTS1 with or without transdifferentiation, while the upregulation of DSP is directly associated with the myofibroblast phenotype. The expression of GR (specifically GR-alpha) was increased at D20 with TGF-β treatment compared to the untreated samples at D20, with no significant change in intermediate days, indicating that changes in GR-alpha expression are a characteristic of the myofibroblast phenotype.
Overall, these data demonstrate the different pathways involved in the transdifferentiation of fibroblasts to myofibroblasts, highlighting known intermediates in well studied pathways such as cytoskeleton remodelling via TGF-β pathways as well as identifying new intermediates in the PKB and PTEN signal transduction pathways that are gaining importance in transdifferentiation. Of the genes selected for real-time PCR confirmation, majority demonstrated the same significant changes in gene expression between the different samples, or if no significant differences were observed, the shift in gene expression was always in the same direction.
TGF-β treatment leads to reduced SMAD7 and increased RHEB protein
We chose four gene products to study whether the observed gene expression changes by RNASeq and real-time PCR resulted in changes in the expression levels of the proteins encoded by these genes; tubulin was used as a loading control (Fig. 6A,B). A TGF-β associated reduction in SMAD7 was observed both at D1 and after transdifferentiation at D20, while a trend towards increased RHEB in the presence of TGF-β compared to its absence, was observed both at D1 and at D20; no change was observed in VCL levels. These data are in agreement with the RNASeq and real-time PCR data. Culture over 20 days resulted in increased ADAMTS1, which was not changed in the presence of TGF-β. ADAMTS1 is a secretory protein and we may not be able to assess total changes in protein expression in the current experimental design. We have previously shown14 that SMAD3 is reduced in TGF-β treated WI-38 cells, correlating with our current RNASeq and real-time PCR data. A trend towards increase of SMAD2 was observed in myofibroblasts14 while short term treatment with TGF-β resulted in reduced expression, completely in agreement with our current real-time PCR and RNASeq data.
Figure 6.

Western blot analysis of selected proteins. Western blot analysis was performed on whole cell lysates for each of the treatment times, D1, D1+ TGFβ, D20 and D20+ TGFβ for VCL, ADAMTS1, RHEB, SMAD7 with tubulin used as loading control. Data represent two independent experiments. (A) blots showing the staining for individual proteins indicated on the left, time and treatment are indicated below the blots. (B) histogram showing the densitometric intensity of each band for the indicated proteins normalised to its cognate tubulin band; data are mean ± SEM. D1 – day 1 without treatment, D1T – day 1 with treatment, D20 – day 20 without treatment, D20T – day 20 with treatment.
Discussion
In the current study, we show that a large number of genes are modulated in an airway fibroblast cell line in response to TGF-β treatment and on transdifferentiation to myofibroblasts25. As expected, expression of intermediates in pathways that regulate cytoskeleton and focal adhesions was changed as well as expression of intermediates in TGF-β signalling pathways. Importantly, expression of several genes known to have a role in asthma was changed, directly corresponding to the changes observed in asthma. The data presented here builds on our previous work14 and strongly suggests the feasibility of using TGF-β treated WI-38 cell line as a cell culture model to study the role of myofibroblasts in asthma.
In the context of the asthmatic airway, TGF-β released by the destruction of epithelial cells26 can lead to transdifferentiation of fibroblasts to myofibroblasts that can contribute to airway remodelling via production of specific growth factors, extracellular matrix (ECM) modulating proteins and cytokines27,28. Fibroblasts and myofibroblasts are known to be increased in the remodelled airways in severe asthma6,29, and increasing evidence supports an important role for these cells in the clinical symptoms of asthma.
We have previously shown that TGF-β treatment of an airway fibroblast cell line induces fibroblast to myofibroblast transdifferentiation accompanied by an altered TGF-β signalling pathway, with decreased Smad3 expression, and impact on glucocorticoid responses due to changes in the expression of the GR isoforms14.
The main focus of our current study was to investigate the role that myofibroblasts may play in the clinical symptoms of asthma, thus extending and adding to our previous study14. Our data confirm our previous finding that prolonged, heightened TGF-β levels can cause transdifferentiation of fibroblasts. Additionally, the resultant myofibroblasts have a gene expression profile that closely matches the observed expression profile from asthmatic airways.
Of the top 10 differentially expressed genes for each of the four comparisons, 50% had been identified as altered in asthma or airway inflammation previously30–40. Most of the genes differentially altered in D1+ TGF-β vs D1 (6/1030–35) and D20+ TGF-β vs D20 (7/1036–38,40) have been described previously, while half of those altered in D20+ TGF-β vs D1+ TGF-β32,38,39 and only 2 in D20 vs D1 comparison41,42 had been previously described in asthma, airway remodelling or airway inflammation.
CDKN2B (cyclin-dependent kinase inhibitor 2B) was significantly increased in myofibroblasts compared to fibroblasts. This was expected as the expression of CDKN2B is known to be significantly induced by TGF-β in other tissue systems43. A major characteristic of airway remodelling is the increase in ECM components, leading to ‘stiffening’ of airways44,45. We found that major factors known to be involved in increased ECM thickness were upregulated in response to TGF-β along with factors that breakdown excess ECM. FN1 (fibronectin 1) was significantly increased in myofibroblasts compared to fibroblasts. Fibronectin is important in cell adhesion and migration processes including embryogenesis, wound healing, and metastasis. Importantly, fibronectin deposition in the airway wall is increased in asthma46–48 and our data suggest that myofibroblasts can contribute to this effect49.
The expression of LAMA1 and LAMA4 was changed, with the former being upregulated and the latter being downregulated in myofibroblasts. The laminins are a major component of the basement membrane and implicated in a wide variety of biological processes including cell adhesion, differentiation, migration, signalling, neurite outgrowth and metastasis50. The increase in LAMA1 expression was expected given its known functions in the ECM. Importantly, LAMA1 expression is increased in animal models of airway remodelling51 and bronchial biopsies from patients with severe asthma52. Our data suggests that increased myofibroblasts may, at least in part, be responsible for this increase. At this time, we do not know the significance of the downregulation of LAMA4, which could suggest either that laminins self-regulate each other or that different laminins have opposing roles in airway remodelling.
Myofibroblasts are known to contribute to the contractile behaviour of the airways via their expression of molecules that directly interact with and impact on the ECM and the cytoskeletal network53. We found that focal adhesion molecule ITGB1 was upregulated in myofibroblasts as expected54–56. ITGB1 encodes an integrin beta subunit that functions as receptor for fibronectin; along with the increased expression of fibronectin, this would result in enhanced functional consequences for the airway. Interestingly, a recent study in a guinea pig model found that ITGB1 expression was increased in asthma57. Vinculin (VCL), that has a role in regulating cell–matrix adhesion, including the assembly, turnover, and strength of focal adhesions, as well as the transmission of force by these cellular structures, was downregulated in myofibroblasts. This finding is in contrast to findings of increased VCL in asthma models58, and suggests that TGF-β transdifferentiated myofibroblasts do not contribute to this aspect of the asthma phenotype.
Expression of matrix metalloproteases (MMPs) is increased in asthmatic airways and these enzymes play a central role in the pathology of asthma59,60. MMP1 was upregulated in myofibroblasts, suggesting a potential source of the increased enzyme in the airway. A recent study has shown that MMP1 is associated with bronchial hyperresponsiveness and asthma exacerbation severity59.
TIMP1, a member of the family of natural inhibitors of the MMPs, was increased in fibroblasts after treatment with TGF-β (D1+ TGFb). In addition to its inhibitory role against most of the known MMPs, the encoded protein promotes cell proliferation in a wide range of cell types and may also have an anti-apoptotic function. Importantly, MMP1 and TIMP1 levels were increased at the mRNA level in induced sputum from asthmatic subjects compared with non-asthmatics61. Our data suggest that fibroblasts and myofibroblasts, in the context of the increased TGF-β in the asthmatic airway, may contribute to this change.
Of the genes identified in literature as being relevant to asthma or TGF-β pathways, ADAMTS121 and DSP22 were identified in both real-time PCR and RNASeq analysis as showing significant differences in gene expression between D20+ TGF-β and D20 samples. However, there was no difference in the activity of these genes between D20+ TGF-β and D1+ TGF-β samples. Our data strongly suggest that the increased TGF-β in asthmatic airways can induce changes in these genes, in particular an early increase in expression of DSP. Importantly, ADAMTS1 is decreased in myofibroblasts, though it increases over time in fibroblasts in culture. No change was observed in the total cellular ADAMTS1 protein with or without TGF-β in fibroblasts or myofibroblasts; probably as ADAMTS1 is secreted.
We found three genes whose expression was altered in myofibroblasts and fibroblasts treated with TGF-β that were not previously described to be modulated in airway structural cells or in asthma. The LDLR gene was upregulated in myofibroblasts. This family consists of cell surface proteins involved in receptor-mediated endocytosis of specific ligands. Recent work in animal models suggests a role for LDLR in modulation of allergic asthma severity via its recognition of apolipoproteins62. Of note, LDLR serves as receptor for a group of rhinoviruses63; whether the observed upregulation leads to increased susceptibility of myofibroblasts to these viruses remains to be confirmed. RHEB was upregulated in myofibroblasts. RHEB is a key intermediate in the PTEN pathway on which it has an inhibitory effect, and is overexpressed in many cancers where it has been variously associated with increased cell proliferation, hyperplasia and fibrosis64. Furthermore, in the current study the increased gene expression of RHEB correlated with increased protein expression of RHEB in the presence of TGF-β.
Pathway analysis of the D20+ TGF-β vs D20 samples or D20+ TGF-β vs D1+ TGF-β samples showed that cytoskeleton remodelling (including TGF-β and PKB driven changes) and cell adhesion pathways were altered, as expected. PKB and PTEN signalling pathways were altered in D20+ TGF-β vs D1+ TGF-β samples only. PKB and other intermediates of the mitogen-activated protein kinase (MAPK) signalling pathway are components of the non-canonical pathways induced by TGF-β65. TGF-β downregulates PTEN, while activating PKB and extracellular signal-regulated kinase (ERK) pathways in non-small cell lung cancer patients66. Importantly, decreased PTEN expression and activity is associated with allergen exposure in a mouse model of bronchial asthma67, and increased GRβ suppresses PTEN in cell culture, leading to PKB stimulation68. GRβ is increased in transdifferentiated WI-38 cells14 and may be responsible for the observed changes in PTEN pathway; however this remains to be confirmed.
Additionally, EGFR signalling and regulation of EIF4F activity were also altered with this treatment as has been described previously69. EGFR has an important role in the proliferation of the airway mesenchymal cells. EGFR ligands are released from the damaged epithelium, and act via EGFR on fibroblast cell surface to induce cellular proliferation28. Our data showing induction of the EGFR pathway strongly suggests that myofibroblasts proliferation may also be induced by EGF ligand in the airways.
Conclusion
In conclusion, we have found a significant number of genes that are altered after differentiation of fibroblasts into myofibroblasts by TGF-β treatment, many of which were expected or predicted. We also identified genes that were unexpectedly altered, including LDLR, CSNK2B and RHEB, which suggests different pathways that are activated during the transition between fibroblasts and myofibroblasts, and thus may contribute to the asthma phenotype. We further identified novel intermediates in pathways that were affected after treatment of fibroblasts with TGF-β, including PKB and PTEN signalling pathways. PKB and PTEN pathways are known to be impacted in asthma70 and our data suggests that myofibroblasts may contribute to this effect.
The human lung fibroblast WI-38 cell line used in this study represents a promising model to study lung disease and more particularly asthma, in providing better understanding of the contribution of myofibroblast cells to disease phenotype.
Supplementary information
Acknowledgements
The authors wish to thank staff at the Ramaciotti Centre for Genomics, University of New South Wales for the RNA sequencing, staff at the Queensland Facility for Advanced Bioinformatics for the bioinformatics analysis, staff at the Australian Cancer Research Foundation Biomolecular Resource Facility, John Curtin School of Medical Research for their assistance with the bioanalyzer. E.J.W. and D.H. were supported by a University of Canberra Deputy Vice-Chancellor Research Post-doctoral fellowship.
Author contributions
E.J.W. performed most of the experiments and wrote the manuscript. D.H. performed the immunofluorescence assay. T.V. performed western blots. R.G. conceived of the study, performed experiments and wrote the manuscript.
Data availability
The datasets generated during the current study are available in the Gene Expression Omnibus repository, http://www.ncbi.nlm.nih.gov/geo/query/acc.cgi?acc=GSE110021.
Competing interests
The authors declare no competing interests.
Footnotes
Publisher’s note Springer Nature remains neutral with regard to jurisdictional claims in published maps and institutional affiliations.
Supplementary information
is available for this paper at 10.1038/s41598-019-56955-1.
References
- 1.To T, et al. Global asthma prevalence in adults: findings from the cross-sectional world health survey. BMC Public Health. 2012;12:204. doi: 10.1186/1471-2458-12-204. [DOI] [PMC free article] [PubMed] [Google Scholar]
- 2.Boulet Louis-Philippe, FitzGerald J. Mark, Levy Mark L., Cruz Alvaro A., Pedersen Soren, Haahtela Tari, Bateman Eric D. A guide to the translation of the Global Initiative for Asthma (GINA) strategy into improved care. European Respiratory Journal. 2012;39(5):1220–1229. doi: 10.1183/09031936.00184511. [DOI] [PubMed] [Google Scholar]
- 3.Holgate ST. Mechanisms of Asthma and Implications for Its Prevention and Treatment: A Personal Journey. Allergy Asthma Immunol Res. 2013;5:343–347. doi: 10.4168/aair.2013.5.6.343. [DOI] [PMC free article] [PubMed] [Google Scholar]
- 4.De Silva D, et al. Vascular endothelial growth factor induction by rhinovirus infection. J Med Virol. 2006;78:666–672. doi: 10.1002/jmv.20591. [DOI] [PMC free article] [PubMed] [Google Scholar]
- 5.Ghildyal R, et al. Rhinovirus infects primary human airway fibroblasts and induces a neutrophil chemokine and a permeability factor. J Med Virol. 2005;75:608–615. doi: 10.1002/jmv.20315. [DOI] [PubMed] [Google Scholar]
- 6.Al-Muhsen, S., Johnson, J. R. & Hamid, Q. Remodeling in asthma. J Allergy Clin Immunol128, 451–462; quiz 463–454, S0091-6749(11)00748-2 (2011). [DOI] [PubMed]
- 7.Ijaz T, et al. Systems biology approaches to understanding Epithelial Mesenchymal Transition (EMT) in mucosal remodeling and signaling in asthma. The World Allergy Organization journal. 2014;7:13. doi: 10.1186/1939-4551-7-13. [DOI] [PMC free article] [PubMed] [Google Scholar]
- 8.Yang ZC, et al. Transforming growth factor-beta1 induces bronchial epithelial cells to mesenchymal transition by activating the Snail pathway and promotes airway remodeling in asthma. Mol Med Rep. 2013;8:1663–1668. doi: 10.3892/mmr.2013.1728. [DOI] [PubMed] [Google Scholar]
- 9.Michalik M, et al. Fibroblast-to-myofibroblast transition in bronchial asthma. Cell Mol Life Sci. 2018;75:3943–3961. doi: 10.1007/s00018-018-2899-4. [DOI] [PMC free article] [PubMed] [Google Scholar]
- 10.Essilfie, A. T. et al. Macrolide therapy suppresses key features of experimental steroid-sensitive and steroid-insensitive asthma. Thorax In Press (2015). [DOI] [PubMed]
- 11.Sullivan DE, Ferris M, Nguyen H, Abboud E, Brody AR. TNF-alpha induces TGF-beta1 expression in lung fibroblasts at the transcriptional level via AP-1 activation. Journal of cellular and molecular medicine. 2009;13:1866–1876. doi: 10.1111/j.1582-4934.2009.00647.x. [DOI] [PMC free article] [PubMed] [Google Scholar]
- 12.Thomas BJ, et al. Transforming growth factor-beta enhances rhinovirus infection by diminishing early innate responses. Am J Respir Cell Mol Biol. 2009;41:339–347. doi: 10.1165/rcmb.2008-0316OC. [DOI] [PubMed] [Google Scholar]
- 13.Cazes E, et al. Novel anti-inflammatory effects of the inhaled corticosteroid fluticasone propionate during lung myofibroblastic differentiation. J Immunol. 2001;167:5329–5337. doi: 10.4049/jimmunol.167.9.5329. [DOI] [PubMed] [Google Scholar]
- 14.Breton JD, Heydet D, Starrs LM, Veldre T, Ghildyal R. Molecular changes during TGFbeta-mediated lung fibroblast-myofibroblast differentiation: implication for glucocorticoid resistance. Physiol Rep. 2018;6:e13669. doi: 10.14814/phy2.13669. [DOI] [PMC free article] [PubMed] [Google Scholar]
- 15.McAnulty RJ. Fibroblasts and myofibroblasts: their source, function and role in disease. Int J Biochem Cell Biol. 2007;39:666–671. doi: 10.1016/j.biocel.2006.11.005. [DOI] [PubMed] [Google Scholar]
- 16.Lohse M, et al. RobiNA: a user-friendly, integrated software solution for RNA-Seq-based transcriptomics. Nucleic Acids Res. 2012;40:W622–627. doi: 10.1093/nar/gks540. [DOI] [PMC free article] [PubMed] [Google Scholar]
- 17.Liao Y, Smyth GK, Shi W. The Subread aligner: fast, accurate and scalable read mapping by seed-and-vote. Nucleic Acids Res. 2013;41:e108. doi: 10.1093/nar/gkt214. [DOI] [PMC free article] [PubMed] [Google Scholar]
- 18.Law CW, Chen Y, Shi W, Smyth GK. voom: Precision weights unlock linear model analysis tools for RNA-seq read counts. Genome Biol. 2014;15:R29. doi: 10.1186/gb-2014-15-2-r29. [DOI] [PMC free article] [PubMed] [Google Scholar]
- 19.Smyth GK. Linear models and empirical bayes methods for assessing differential expression in microarray experiments. Stat Appl Genet Mol Biol. 2004;3:Article3. doi: 10.2202/1544-6115.1027. [DOI] [PubMed] [Google Scholar]
- 20.Benjamini, Y. & Hochberg, Y. Controlling the false discovery rate: a practical and powerful approach to multiple testing. Journal of the Royal Statistical Society. Series B (Methodological), 289–300 (1995).
- 21.Paulissen G, et al. Expression of ADAMs and their inhibitors in sputum from patients with asthma. Mol Med. 2006;12:171–179. doi: 10.2119/2006-00028.Paulissen. [DOI] [PMC free article] [PubMed] [Google Scholar]
- 22.Shahana S, et al. Ultrastructure of bronchial biopsies from patients with allergic and non-allergic asthma. Respir Med. 2005;99:429–443. doi: 10.1016/j.rmed.2004.08.013. [DOI] [PubMed] [Google Scholar]
- 23.Kadmiel M, Cidlowski JA. Glucocorticoid receptor signaling in health and disease. Trends Pharmacol Sci. 2013;34:518–530. doi: 10.1016/j.tips.2013.07.003. [DOI] [PMC free article] [PubMed] [Google Scholar]
- 24.Groneberg DA, Witt H, Adcock IM, Hansen G, Springer J. Smads as intracellular mediators of airway inflammation. Exp Lung Res. 2004;30:223–250. doi: 10.1080/01902140490276320. [DOI] [PubMed] [Google Scholar]
- 25.Ojiaku CA, Yoo EJ, Panettieri RA., Jr. Transforming Growth Factor beta1 Function in Airway Remodeling and Hyperresponsiveness. The Missing Link? Am J Respir Cell Mol Biol. 2017;56:432–442. doi: 10.1165/rcmb.2016-0307TR. [DOI] [PMC free article] [PubMed] [Google Scholar]
- 26.Zhang S, Smartt H, Holgate ST, Roche WR. Growth factors secreted by bronchial epithelial cells control myofibroblast proliferation: an in vitro co-culture model of airway remodeling in asthma. Lab Invest. 1999;79:395–405. [PubMed] [Google Scholar]
- 27.Broide David H. Immunologic and inflammatory mechanisms that drive asthma progression to remodeling. Journal of Allergy and Clinical Immunology. 2008;121(3):560–570. doi: 10.1016/j.jaci.2008.01.031. [DOI] [PMC free article] [PubMed] [Google Scholar]
- 28.Royce SG, Cheng V, Samuel CS, Tang ML. The regulation of fibrosis in airway remodeling in asthma. Mol Cell Endocrinol. 2012;351:167–175. doi: 10.1016/j.mce.2012.01.007. [DOI] [PubMed] [Google Scholar]
- 29.Boser SR, et al. Myofibroblasts are increased in the lung parenchyma in asthma. PLoS One. 2017;12:e0182378. doi: 10.1371/journal.pone.0182378. [DOI] [PMC free article] [PubMed] [Google Scholar]
- 30.Veraldi KL, et al. Role of insulin-like growth factor binding protein-3 in allergic airway remodeling. Am J Respir Crit Care Med. 2009;180:611–617. doi: 10.1164/rccm.200810-1555OC. [DOI] [PMC free article] [PubMed] [Google Scholar]
- 31.Liao Shu-Yi, Linderholm Angela L., Yoneda Ken Y., Kenyon Nicholas J., Harper Richart W. Airway transcriptomic profiling after bronchial thermoplasty. ERJ Open Research. 2019;5(1):00123–2018. doi: 10.1183/23120541.00123-2018. [DOI] [PMC free article] [PubMed] [Google Scholar]
- 32.Barreto-Luis A, et al. Genome-wide association study in Spanish identifies ADAM metallopeptidase with thrombospondin type 1 motif, 9 (ADAMTS9), as a novel asthma susceptibility gene. J Allergy Clin Immunol. 2016;137:964–966. doi: 10.1016/j.jaci.2015.09.051. [DOI] [PubMed] [Google Scholar]
- 33.Esnault S, et al. Semaphorin 7A is expressed on airway eosinophils and upregulated by IL-5 family cytokines. Clin Immunol. 2014;150:90–100. doi: 10.1016/j.clim.2013.11.009. [DOI] [PMC free article] [PubMed] [Google Scholar]
- 34.Huang MT, et al. Notch Ligand DLL4 Alleviates Allergic Airway Inflammation via Induction of a Homeostatic Regulatory Pathway. Sci Rep. 2017;7:43535. doi: 10.1038/srep43535. [DOI] [PMC free article] [PubMed] [Google Scholar]
- 35.Himes BE, et al. Association of SERPINE2 with asthma. Chest. 2011;140:667–674. doi: 10.1378/chest.10-2973. [DOI] [PMC free article] [PubMed] [Google Scholar]
- 36.Bazan-Socha S, et al. Impaired fibrinolysis and lower levels of plasma alpha2-macroglobulin are associated with an increased risk of severe asthma exacerbations. Sci Rep. 2017;7:11014. doi: 10.1038/s41598-017-11467-8. [DOI] [PMC free article] [PubMed] [Google Scholar]
- 37.Matsumoto H. Roles of Periostin in Asthma. Adv Exp Med Biol. 2019;1132:145–159. doi: 10.1007/978-981-13-6657-4_15. [DOI] [PubMed] [Google Scholar]
- 38.Fuerst E, et al. Sphingosine-1-phosphate induces pro-remodelling response in airway smooth muscle cells. Allergy. 2014;69:1531–1539. doi: 10.1111/all.12489. [DOI] [PMC free article] [PubMed] [Google Scholar]
- 39.Dijkstra A, et al. SERPINE1 -675 4G/5G polymorphism is associated with asthma severity and inhaled corticosteroid response. Eur Respir J. 2011;38:1036–1043. doi: 10.1183/09031936.00182410. [DOI] [PubMed] [Google Scholar]
- 40.Youness, E. R., Shady, M., Nassar, M. S., Mostafa, R. & Abuelhamd, W. The role of serum nuclear factor erythroid 2-related factor 2 in childhood bronchial asthma. J Asthma, 1–6, 10.1080/02770903.2019.1571081 (2019). [DOI] [PubMed]
- 41.Pegorier S, Campbell GA, Kay AB, Lloyd CM. Bone morphogenetic protein (BMP)-4 and BMP-7 regulate differentially transforming growth factor (TGF)-beta1 in normal human lung fibroblasts (NHLF) Respir Res. 2010;11:85. doi: 10.1186/1465-9921-11-85. [DOI] [PMC free article] [PubMed] [Google Scholar]
- 42.Cohen L, et al. Epithelial cell proliferation contributes to airway remodeling in severe asthma. Am J Respir Crit Care Med. 2007;176:138–145. doi: 10.1164/rccm.200607-1062OC. [DOI] [PMC free article] [PubMed] [Google Scholar]
- 43.Hannon GJ, Beach D. p15INK4B is a potential effector of TGF-beta-induced cell cycle arrest. Nature. 1994;371:257–261. doi: 10.1038/371257a0. [DOI] [PubMed] [Google Scholar]
- 44.Boxall C, Holgate ST, Davies DE. The contribution of transforming growth factor-beta and epidermal growth factor signalling to airway remodelling in chronic asthma. Eur Respir J. 2006;27:208–229. doi: 10.1183/09031936.06.00130004. [DOI] [PubMed] [Google Scholar]
- 45.Mauad Thais, Bel Elisabeth H., Sterk Peter J. Asthma therapy and airway remodeling. Journal of Allergy and Clinical Immunology. 2007;120(5):997–1009. doi: 10.1016/j.jaci.2007.06.031. [DOI] [PubMed] [Google Scholar]
- 46.Jeffery PK. Remodeling in asthma and chronic obstructive lung disease. Am J Respir Crit Care Med. 2001;164:S28–38. doi: 10.1164/ajrccm.164.supplement_2.2106061. [DOI] [PubMed] [Google Scholar]
- 47.Jeffery P. Inflammation and remodeling in the adult and child with asthma. Pediatr Pulmonol Suppl. 2001;21:3–16. doi: 10.1002/ppul.2001. [DOI] [PubMed] [Google Scholar]
- 48.Postma DS, Timens W. Remodeling in asthma and chronic obstructive pulmonary disease. Proc Am Thorac Soc. 2006;3:434–439. doi: 10.1513/pats.200601-006AW. [DOI] [PubMed] [Google Scholar]
- 49.Ge Q, et al. Differential deposition of fibronectin by asthmatic bronchial epithelial cells. Am J Physiol Lung Cell Mol Physiol. 2015;309:L1093–1102. doi: 10.1152/ajplung.00019.2015. [DOI] [PubMed] [Google Scholar]
- 50.Durbeej M. Laminins. Cell Tissue Res. 2010;339:259–268. doi: 10.1007/s00441-009-0838-2. [DOI] [PubMed] [Google Scholar]
- 51.Christie PE, Jonas M, Tsai CH, Chi EY, Henderson WR., Jr. Increase in laminin expression in allergic airway remodelling and decrease by dexamethasone. Eur Respir J. 2004;24:107–115. doi: 10.1183/09031936.04.00013303. [DOI] [PubMed] [Google Scholar]
- 52.Altraja A, et al. Expression of laminins in the airways in various types of asthmatic patients: a morphometric study. Am J Respir Cell Mol Biol. 1996;15:482–488. doi: 10.1165/ajrcmb.15.4.8879182. [DOI] [PubMed] [Google Scholar]
- 53.Lin YC, Sung YK, Jiang X, Peters-Golden M, Nicolls MR. Simultaneously Targeting Myofibroblast Contractility and Extracellular Matrix Cross-Linking as a Therapeutic Concept in Airway Fibrosis. Am J Transplant. 2017;17:1229–1241. doi: 10.1111/ajt.14103. [DOI] [PMC free article] [PubMed] [Google Scholar]
- 54.Hinz B, Gabbiani G. Cell-matrix and cell-cell contacts of myofibroblasts: role in connective tissue remodeling. Thromb Haemost. 2003;90:993–1002. doi: 10.1160/TH03-05-0328. [DOI] [PubMed] [Google Scholar]
- 55.Hinz B, Gabbiani G. Mechanisms of force generation and transmission by myofibroblasts. Curr Opin Biotechnol. 2003;14:538–546. doi: 10.1016/j.copbio.2003.08.006. [DOI] [PubMed] [Google Scholar]
- 56.Sen N, Weingarten M, Peter Y. Very late antigen-5 facilitates stromal progenitor cell differentiation into myofibroblast. Stem Cells Transl Med. 2014;3:1342–1353. doi: 10.5966/sctm.2014-0014. [DOI] [PMC free article] [PubMed] [Google Scholar]
- 57.Alvarez-Santos M, et al. Airway Hyperresponsiveness in Asthma Model Occurs Independently of Secretion of beta1 Integrins in Airway Wall and Focal Adhesions Proteins Down Regulation. J Cell Biochem. 2016;117:2385–2396. doi: 10.1002/jcb.25536. [DOI] [PubMed] [Google Scholar]
- 58.Houtman R, et al. Lung proteome alterations in a mouse model for nonallergic asthma. Proteomics. 2003;3:2008–2018. doi: 10.1002/pmic.200300469. [DOI] [PubMed] [Google Scholar]
- 59.Naveed SU, et al. Matrix Metalloproteinase-1 Activation Contributes to Airway Smooth Muscle Growth and Asthma Severity. Am J Respir Crit Care Med. 2017;195:1000–1009. doi: 10.1164/rccm.201604-0822OC. [DOI] [PMC free article] [PubMed] [Google Scholar]
- 60.Freishtat RJ, et al. Delineation of a gene network underlying the pulmonary response to oxidative stress in asthma. J Investig Med. 2009;57:756–764. doi: 10.2310/JIM.0b013e3181b91a83. [DOI] [PMC free article] [PubMed] [Google Scholar]
- 61.Cataldo DD, et al. Matrix metalloproteinases and tissue inhibitors of matrix metalloproteinases mRNA transcripts in the bronchial secretions of asthmatics. Lab Invest. 2004;84:418–424. doi: 10.1038/labinvest.3700063. [DOI] [PubMed] [Google Scholar]
- 62.Yao X, Remaley AT, Levine SJ. New kids on the block: the emerging role of apolipoproteins in the pathogenesis and treatment of asthma. Chest. 2011;140:1048–1054. doi: 10.1378/chest.11-0158. [DOI] [PMC free article] [PubMed] [Google Scholar]
- 63.Basnet S, Palmenberg AC, Gern JE. Rhinoviruses and Their Receptors. Chest. 2019;155:1018–1025. doi: 10.1016/j.chest.2018.12.012. [DOI] [PMC free article] [PubMed] [Google Scholar]
- 64.Lu ZH, et al. Mammalian target of rapamycin activator RHEB is frequently overexpressed in human carcinomas and is critical and sufficient for skin epithelial carcinogenesis. Cancer Res. 2010;70:3287–3298. doi: 10.1158/0008-5472.CAN-09-3467. [DOI] [PMC free article] [PubMed] [Google Scholar]
- 65.Yeganeh B, et al. Novel non-canonical TGF-beta signaling networks: emerging roles in airway smooth muscle phenotype and function. Pulm Pharmacol Ther. 2013;26:50–63. doi: 10.1016/j.pupt.2012.07.006. [DOI] [PubMed] [Google Scholar]
- 66.Shen H, et al. TGF-beta1 induces erlotinib resistance in non-small cell lung cancer by down-regulating PTEN. Biomed Pharmacother. 2016;77:1–6. doi: 10.1016/j.biopha.2015.10.018. [DOI] [PubMed] [Google Scholar]
- 67.Kwak YG, et al. Involvement of PTEN in airway hyperresponsiveness and inflammation in bronchial asthma. J Clin Invest. 2003;111:1083–1092. doi: 10.1172/JCI16440. [DOI] [PMC free article] [PubMed] [Google Scholar]
- 68.Stechschulte LA, et al. Glucocorticoid receptor beta stimulates Akt1 growth pathway by attenuation of PTEN. J Biol Chem. 2014;289:17885–17894. doi: 10.1074/jbc.M113.544072. [DOI] [PMC free article] [PubMed] [Google Scholar]
- 69.Sturrock A, et al. Nox4 mediates TGF-beta1-induced retinoblastoma protein phosphorylation, proliferation, and hypertrophy in human airway smooth muscle cells. Am J Physiol Lung Cell Mol Physiol. 2007;292:L1543–1555. doi: 10.1152/ajplung.00430.2006. [DOI] [PubMed] [Google Scholar]
- 70.Yoo EJ, Ojiaku CA, Sunder K, Panettieri RA., Jr. Phosphoinositide 3-Kinase in Asthma: Novel Roles and Therapeutic Approaches. Am J Respir Cell Mol Biol. 2017;56:700–707. doi: 10.1165/rcmb.2016-0308TR. [DOI] [PMC free article] [PubMed] [Google Scholar]
Associated Data
This section collects any data citations, data availability statements, or supplementary materials included in this article.
Supplementary Materials
Data Availability Statement
The datasets generated during the current study are available in the Gene Expression Omnibus repository, http://www.ncbi.nlm.nih.gov/geo/query/acc.cgi?acc=GSE110021.