Abstract
Oxygen quenching of perylene fluorescence was used to vary its fluorescence lifetime. Steady-state fluorescence anisotropy measurements under these quenching conditions were used to investigate the diffusive motions of perylene in the isotropic solvent propylene glycol and in lipid bilayers. These lifetime-resolved anisotropy measurements indicate that the anisotropy of perylene in propylene glycol decays to zero at times long compared to its fluorescence lifetime. In contrast, the asymptotic or “limiting” anisotropy values at these long times (r∞) are nonzero in vesicles of dimyristoylphosphatidylcholine (DMPC). r∞ values are largest at temperatures below the DMPC phase transition temperature of 23 °C. Representative values of r∞ for perylene in DMPC vesicles are 0.16 and 0.02 at 5 and 47 °C, respectively. Thus, in contrast to the free rotations observed for perylene in propylene glycol, perylene rotations are hindered in lipid bilayers. Less marked, yet significant, rotational hindrance was observed in dioleoylphosphatidylcholine (DOPC) vesicles. Representative values for r∞ in this unsaturated lipid are 0.05 and 0.01 at 2 and 45 °C, respectively. Steady-state anisotropy measurements with short-wavelength excitations were used to investigate whether the in-plane or out-of-plane rotations of perylene were responsible for the observed r∞ values. In DMPC vesicles we conclude that both rotations are partially hindered. In DOPC vesicles we can only conclude that one or both of these rotations are partially hindered, but both are not free. Most importantly, the existence of fundamentally different diffusive behavior for perylene in solvents and in lipids calls into question the meaning of membrane microviscosities which are derived via such comparisons.
Measurements of the steady-state fluorescence anisotropies of membrane-bound fluorophores have become widely used in estimating the “microviscosity” of the acyl side chain region of lipid bilayers (Shinitzky et al., 1971; Cogan et al., 1973; Lentz et al., 1976; Brashford et al., 1976; Jacobson & Wobschall, 1974) and of biological membranes (Moore et al., 1976; Helgerson et al., 1974). In the extrapolation from an observed fluorescence anisotropy to a microviscosity value for the membrane, one assumes that the nature of the depolarizing rotations of the fluorophore in the membrane and in the reference solvent is identical. By nature we mean the freedom and isotropy of these rotations. Recently this assumption was shown to be in error for the widely used microviscosity probe diphenylhexatriene (DPH)1 (Kawato et al., 1977; Veatch & Stryer, 1977; Dale et al., 1977; Lakowicz & Prendergast, 1978; Lakowicz et al., 1979a,b), for 2-anilinonaphthalene (Badea et al., 1978), and for 1-anilino-8-naphthalenesulfonic acid (Kinosita et al., 1976). For each of these probes the diffusive motions in membranes were found to be hindered, as evidenced by the existence of nonzero anisotropy values at times long compared to the fluorescence lifetimes (r∞). We now present evidence that another widely used microviscosity probe, perylene, is also a hindered rotator when bound to lipid bilayers. In fact, it is the degree to which its rotations are hindered, and not its rotational rates, which determines the conventionally measured steady-state anisotropy. These observations illustrate the need for caution in the literal interpretation of membrane microviscosities derived from anisotropy measurements.
Perylene is a disklike molecule, and the in-plane rotations of the fluorophore are about 10-fold faster than the out-of-plane rotations (Shinitzky et al., 1971). We questioned whether the in-plane or out-of-plane rotations were hindered. As a fluorophore, perylene is somewhat unique in that one can potentially observe each of these rotation rates by selection of excitation wavelength. Using steady-state anisotropy measurements at these selected wavelengths, we determined that in lipid vesicles neither rotation is completely hindered. In DOPC vesicles at least one of these diffusive motions is partially hindered, and in DMPC vesicles, below their phase transition temperature, both motions are partially hindered. However, quantitation of these individual rotational rates is precluded by the rapid average rate of perylene rotation in bilayers and the subsequent large angular displacements which occur during the lifetime of the excited state. Under these conditions, the simple equations which relate the excitation to a determination of the in-plane and out-of-plane rotational rates are no longer applicable (Weber, 1971).
Theory
Fluorescence anisotropy, r, is a measure of the mean alignment between axes of excitation and emission. In the time period between excitation and emission (≃10−9 s), both electronic and molecular reorientations can rotate the emission axis away from the initial (excitation) direction. When neither reorientation process is active, r equals 0.4. If, however, electronic reorientation occurs, within ≃10−11 s the axis will have rotated in the molecule to yield an r value less than 0.4, called r0. If the probes are immobile, one will observe the value r0 in the emission at all subsequent times. Molecular reorientation, however, can also occur within the fluorescence lifetime, further reducing the r value observed in the emission. This time-dependent molecular reorientation may be resolved by observing r at different times in the emission history of the probe. If one excites the sample with a sharp pulse, the anisotropy will subsequently decay with
| (1) |
where t is the time of observation (after the pulse) and is the mean molecular rotation rate. If one observes emission anisotropy with steady-state excitation, however, the r value is an average of the time-resolved decay over all time, weighted by the decay of intensity:
| (2) |
where τ is the fluorescence lifetime.
Carrying out the transform for the isotropic case (eq 1), we obtain the Perrin equation
| (3a) |
or
| (3b) |
To this juncture, the Brownian rotations of the probes have been considered free and unhindered; if, however, the molecular rotations encounter barriers, then r will not decay toward zero. Instead, it will tend toward an asymptotic or limiting value, r∞, that is characteristic of the angular width of the barrier-free region (Kinosita et al., 1976):
| (4) |
The corresponding steady-state anisotropy is obtained by using eq 2 and 4 followed by rearrangement to yield
| (5) |
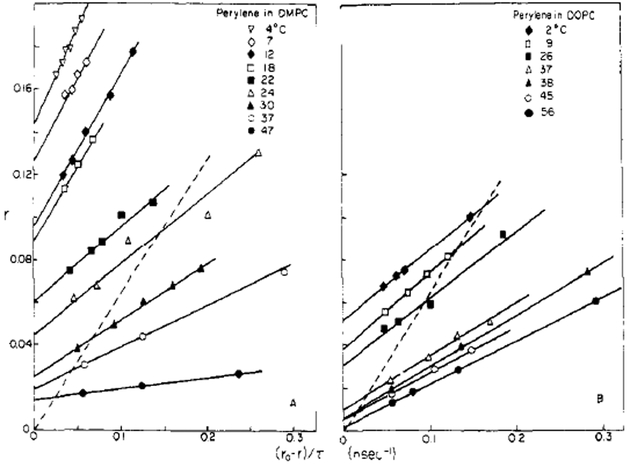
Examining eq 5, it is apparent that a plot of r vs. (r0−r)/τ for a series of ri(τi) values will yield a straight line whose slope is and whose r intercept is r∞ For an unhindered rotator, the intercept (r∞) is zero. The systematic reduction of the fluorescence lifetime by oxygen quenching to obtain a series of ri(τi) will be discussed shortly. First, however, it is instructive to consider the behavior of r when probe rotations are not isotropic.
Since perylene is nearly disk-shaped with oscillators in the plane, one may approximately characterize its motion by two rotation rates, Rip and Rop, for in- and out-of-plane, respectively. If excitation provides nearly collinear oscillators (r0≃ 0.4), the free anisotropic rotor model (Tao, 1969) applies:
| (6) |
This transforms (by using eq 2) to
| (7) |
In the case , eq 7 reduces to eq 3.
If eq 7 is used to generate a plot of r vs. (r0−r)/τ, straight lines do not result. Instead, one observes a curve of transition between two straight lines, as is shown for a family of Rip/Rop ratios in Figure 1. Note that, true to the freedom of rotation, all of the curves pass through the origin, since r tends to zero at long times. Actual measurements, of course, will occupy only a portion of the curve, since useful lifetimes are bracketed from above (left) by the natural lifetime and from below (right) by the smallest quenched lifetime with an adequate signal to noise ratio. Thus, we questioned whether the data we obtain might lead us to observe one of the slopes selectively and if we might thereby extrapolate to false apparent r∞ values. Apparent r∞ values are illustrated by the dotted lines in Figure 1, and the dashed lines represent lifetimes in excess of those we can observe. Note that no matter how large the ratio Rip/Rop, an apparent r∞ in excess of 0.1 cannot result. In addition, only unreasonably large ratios lead to significant values of apparent r∞; more reasonable ratios derived from alternative measurements of perylene (Shinitzky et al., 1971) are less than 20, implying small apparent r∞ values. In addition, the two rotation rates may be large, which leads to observations that lie on the line segment that passes through zero. Thus, apparent r∞ values which might confuse interpretation of the data only result from a “worst case”, when rotation is both slow and highly anisotropic.
FIGURE 1:
Effect of rotational anisotropy on the apparent limiting anisotropies. The solid lines represent the lifetimes and anisotropies which may be obtained by using oxygen quenching of perylene fluorescence, i.e., a range in τ from 8 to ~0.2 ns. The dashed lines illustrate the inaccessible lifetime range from 500 to 8 ns. The dotted lines illustrate how anisotropic rotations can yield apparent nonzero anisotropy values.
Perylene has a special feature, in that interesting angles between oscillators (and therefore useful r0) are obtainable by selection of excitation wavelength. If one selects collinear oscillators (r0 near 0.4), the aforementioned anisotropic rotor model applies, and the mean rotation rate observed is a blend of in- and out-of-plane rates. This blend becomes a strict average when only small angles of molecular rotation have occurred; this holds at short times for r(t) or short lifetimes for r(τ).
When oscillators are selected at right angles (r0 = −0.2), strict out-of-plane rotation does not act to displace the emission oscillator any further from excitation. Thus, for small molecular rotations, only in-plane depolarization is observed. (After a sizable in-plane rotation occurs, out-of-plane motion becomes effective again.) Similarly, selection of oscillators at 45° (r0 = 0.1) leads to early time observation of only the out-of-plane rate.
The strict separation of rates is valid only for very early times, especially if angular barriers are present. At this time, a simple analytic solution for the hindered anisotropic rotor has not been presented. For the analysis of perylene anisotropy, a combination of the hindered isotropic theory with some facets of free anisotropic theory provides insight into the freedom and isotropy of the probe in solvents and bilayers.
The depolarizing motions of the probe may be observed by using either time- or lifetime-resolved methods. We used oxygen quenching to decrease the fluorescence lifetime of perylene and thereby obtained lifetime-resolved anisotropies. In the presence of quencher, the fluorescence intensity is described by
| (8) |
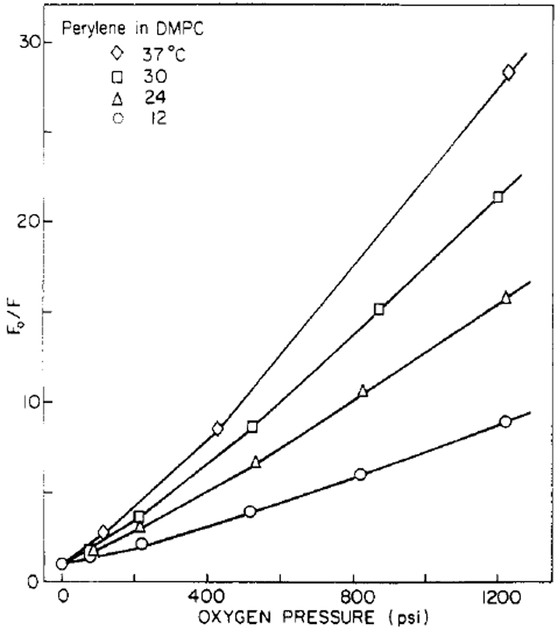
where F0 and F are the fluorescence intensities in the absence and presence of quencher, respectively, [Q] is the quencher concentration, and KS and KD are the static and dynamic quenching constants, respectively (Vaughan & Weber, 1970). Equation 8 predicts a quadratic dependence of F0/F upon [Q], as we observed experimentally (Figure 3). We note that such a quadratic dependence does not demonstrate the existence of a complex between fluorophore and quencher (Frank & Vavilov, 1931).
FIGURE 3:
Stern–Volmer plots for oxygen quenching of perylene in DMPC vesicles.
For lifetime-resolved measurements, we require the lifetime of the quenched samples. These lifetimes are given by the dynamic component of the observed quenching (Lakowicz & Weber, 1973):
| (9) |
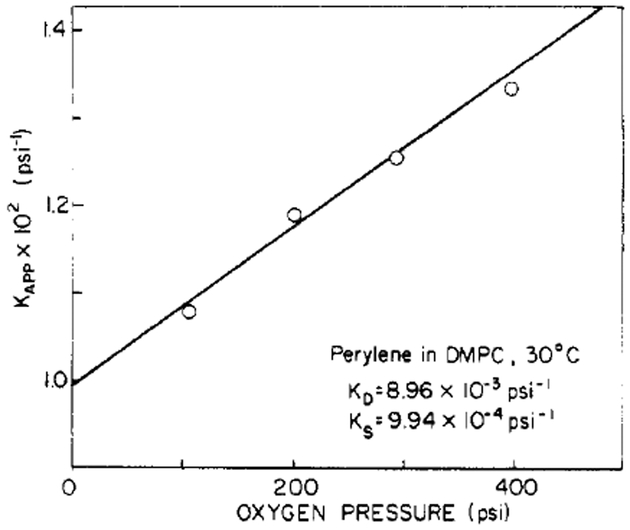
This component is obtained by plotting the apparent quenching constant (Kapp) vs. [Q], as is illustrated in Figure 4.
| (10) |
KS and KD are calculated from the slope (KSKD) and intercept (KS + KD).
FIGURE 4:
Separation of the static and dynamic oxygen quenching constants for perylene in DMPC vesicles.
Materials and Methods
DMPC and DOPC were obtained from Sigma Chemical Co. and used without further purification. These lipids migrated as a single spot on silica by using CHCl3-MeOH-H2O, 65/25/5. Perylene was obtained from Aldrich (Gold Label), Lot No. 61677. Its spectral properties were identical with those of a zone-refined sample obtained from Aremco Products, Inc., and the Aldrich sample was thereby judged to be fluorometrically pure. Phospholipid vesicles were prepared by sonication as described previously (Lakowicz et al., 1979a). The probe to lipid molar ratio was 1:500, and the buffer was 0.01 M Tris and 0.05 M KC1, pH 7.5.
Fluorescence lifetimes of the unquenched samples were measured by the phase shift and modulation methods (Spencer & Weber, 1969) using a modulation frequency of 30 MHz. The values derived from both methods were in agreement. The excitation wavelength was 410 nm. Emission was observed through NaNO2 (2 mm of 1 M) and Corning 3–73 filters. Emission spectra taken through this filter demonstrated that the scattered exciting light was completely removed. Polarizers were used in the excitation and emission channels to eliminate the effect of Brownian rotation on the observed lifetimes (Spencer & Weber, 1970).
Fluorescence emission spectra and anisotropies were obtained with a photon counting spectrofluorometer (SLM Instruments, Inc.) which was equipped with a double grating excitation monochromator and Glan-Thompson polarizers. Optical conditions were as described for the lifetime measurements except that a monochromator was used in place of the emission filters. Intensities and anisotropies were measured by using an emission wavelength of 446 nm. In propylene glycol at −60 °C the emission anisotropies obtained by using an excitation wavelength of 410 nm were found to be 0.335 ± 0.015. The band-passes of the exciting and emission monochromators were 8 and 2 nm, respectively. Fluorescence anisotropies (r) and total fluorescence intensities (F) were calculated from the intensities of the polarized components as previously described (Lakowicz et a!., 1979b). By use of our instrumental conditions the r0 values for perylene in propylene glycol at −60 °C were 0.335, 0.100, and −0.165 at 410-, 314-, and 252-nm excitation, respectively.
Oxygen quenching was achieved as described previously (Lakowicz et al., 1979b; Lakowicz & Weber, 1973). At 410-nm excitation, the fluorescence spectra obtained from even highly quenched samples indicated no significant background due to impurities or scattered light. However, these backgrounds were significant when using 314- and 252-nm excitation, since background-induced errors in the measured anisotropy exceeded our estimates of error in the measurement process.
Results
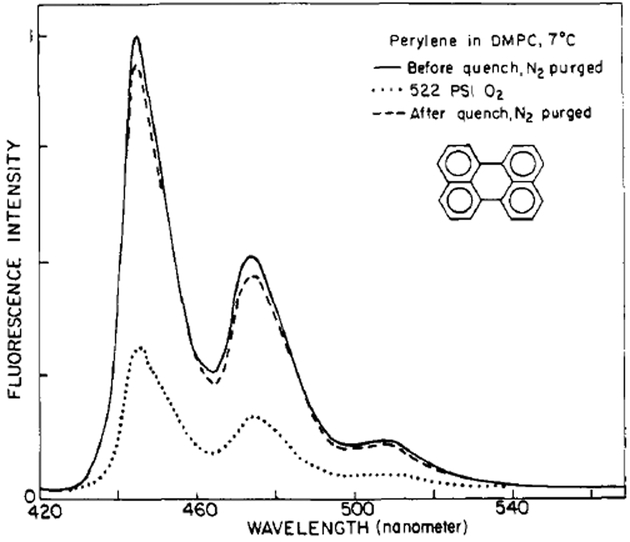
The fluorescence intensity of perylene in propylene glycol and in lipid bilayers (Figure 2) decreases upon equilibration with increased pressures of oxygen. These intensity changes are completely reversible. Release of the oxygen pressure, followed by purging with an inert gas to remove dissolved oxygen, restored the original intensity. In addition, increased pressures of the inert gas argon had no effect on the observed fluorescence intensities or anisotropies. Hence, the effects of pressure per se are not responsible for the observed spectral changes. Oxygen is known to be an efficient collisional quencher of fluorescence. As a result, the observed intensity changes primarily reflect the decrease in the fluorescence lifetime. Moreover, oxygen is transparent at wavelengths longer than 280 nm (Lakowicz & Weber, 1973). As a result, oxygen quenching provides a convenient means to vary the lifetime of membrane-bound probes without otherwise perturbing the lipid bilayers.
FIGURE 2:
Fluorescence emission spectra of perylene in DMPC vesicles.
It is important to note that even in our most highly quenched samples the fluorescence spectral distribution remains unchanged and characteristic of perylene. Representative spectra taken prior to and after quenching and at 522 psi O2 are shown (Figure 2). At the long excitation wavelength (410 nm) used in these studies, the background fluorescence was not significant when compared to that of perylene. Unfortunately, background fluorescence was a problem when we used 314 and 252 nm as excitation wavelengths. At 314-nm excitation the extinction coefficient of perylene is low. At 252-nm excitation the xenon lamp output is low, light absorption by impurities in the sample is more pronounced, and dissolved oxygen absorbs the exciting light. As a result it was necessary to correct the observed anisotropies for background signals. These corrections require interchange of the sample and an unlabeled reference. Such interchange of samples is difficult when using the pressurized fluorescence cell. As a result, lifetime-resolved anisotropy measurements were only obtained at 410-nm excitation, while unquenched steady-state anisotropies were obtained at all three wavelengths.
Figure 3 shows typical Stern–Volmer plots for oxygen quenching of perylene. A small degree of upward curvature is clearly evident. This nonideal behavior at high oxygen concentrations results from the presence of oxygen molecules in the solvent shell surrounding perylene at the moment of excitation (Frank & Vavilov, 1931), resulting in immediate quenching of this small percentage of perylene molecules. To obtain lifetime-resolved anisotropy measurements, we require knowledge of the fluorescence lifetime in the quenched samples. Clearly, calculation of from the decrease in fluorescence intensity (i.e., τ = τ0F/F0) will result in errors due to the “static” quenching component described above. We calculated τ from the dynamic component of the observed quenching (Lakowicz & Weber, 1973), which is obtained from a plot of Kapp vs. oxygen pressure, as shown in Figure 4. These static and dynamic quenching constants are summarized in Table I. Although the magnitude of the static component KS is small relative to that of the dynamic quenching constant KD, correction for this component is necessary. Under highly quenched conditions, such as F0/F = 20, even the presence of a small static component can result in a substantial change in the calculated lifetime. For example, for perylene in DMPC at 30 °C equilibrated with 1500 psi O2, the fluorescence lifetime calculated from the dynamic component KD is 0.43 ns, whereas the lifetime calculated from the decrease in fluorescence intensity, without correction for the static component of the quenching, is 0.17 ns. However, the magnitudes of these static components are small relative to the dynamic components, and the errors in their determination are substantial. Hence, we make no attempt to interpret these KS values or their dependence on temperature.
Table I:
Oxygen Quenching Constants for Perylene in Solvents and in Lipid Bilayers
| sample | temp (°C) | τ0 (ns)a | KD × 103 (psi−1) | KS × 104 (psi−1) |
|---|---|---|---|---|
| propylene glycol | 26 | 5.39 | 1.67 | 7.18 |
| DMPC | 4 | 6.75 | 2.71 | 4.80 |
| 7 | 6.67 | 3.74 | 1.47 | |
| 12 | 6.56 | 4.34 | 3.71 | |
| 18 | 6.45 | 5.37 | 0.44 | |
| 22 | 6.33 | 5.73 | 12.50 | |
| 24 | 6.31 | 8.36 | 4.22 | |
| 30 | 6.18 | 8.96 | 9.94 | |
| 37 | 6.03 | 13.19 | 5.5 | |
| 47 | 5.78 | 13.20 | 9.01 | |
| DOPC | 2 | 5.90 | 4.45 | 4.06 |
| 9 | 5.93 | 5.47 | 5.12 | |
| 26 | 5.92 | 8.19 | 4.84 | |
| 37 | 5.87 | 8.19 | 10.38 | |
| 38 | 5.87 | 10.50 | 5.02 | |
| 45 | 5.82 | 10.40 | 10.10 | |
| 56 | 5.75 | 11.10 | 7.71 |
Samples were purged with argon to remove dissolved oxygen, and polarizers were used in the excitation and emission light paths to eliminate the effect of Brownian rotation on the observed lifetimes. The lifetimes shown were measured by the phase shift method and are thought to contain errors of ±0.2 ns.
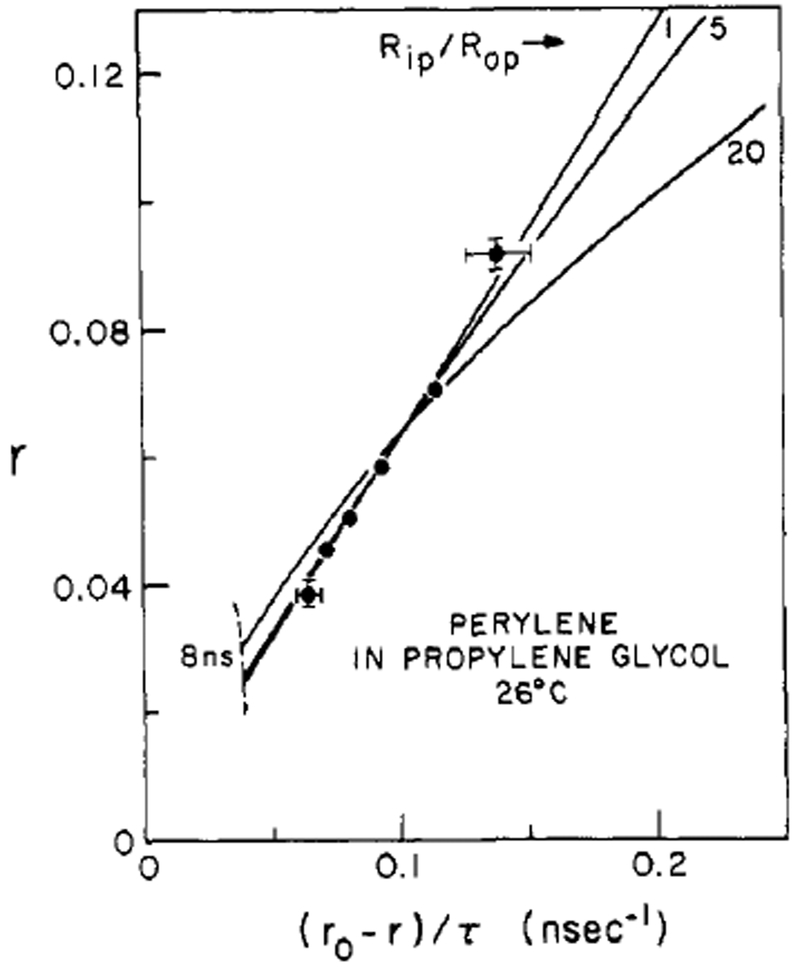
We used oxygen quenching of perylene to lifetime resolve its fluorescence anisotropy in propylene glycol and lipid bilayers. In propylene glycol, the isotropic unhindered theory (straight line, Rip/Rop = 1 in Figure 5) provides the best model in a least-squares sense, but Rip/Rop ratios up to 10 fit within our estimates for error in the data. As the location of the “knee” of the curves for larger ratios indicates, the data are probably in the later stages of depolarization. Thus, only large disparity between rotation rates would cause perceptible curvature in the data. Of prime importance, however, is the demonstration that r∞ = 0 in the solvent environment, so perylene is a free rotor in propylene glycol.
FIGURE 5:
Effect of rotational anisotropy on the lifetime-resolved fluorescence anisotropy of perylene in propylene glycol. The anisotropic rotor model was used to fit this solvent data in a least-squares sense. The error bars indicate the effect of a ±0.2-ns error in τ and a ±0.005 error in anisotropy. Although the best fit was isotropic (Rip/Rop = 1), ratios of Rip/Rop up to about 10 are within error estimates.
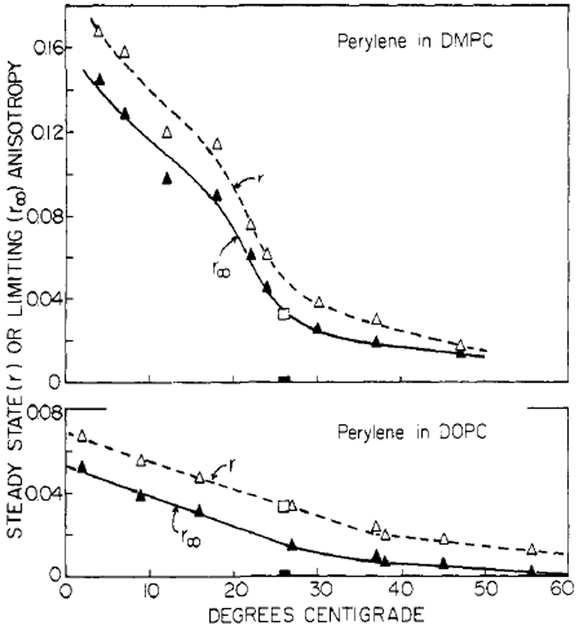
Lifetime-resolved anisotropy measurements for perylene in lipid bilayers revealed substantially different rotational behavior (Figure 6). In contrast to the results obtained in propylene glycol, the depolarizing rotations of perylene in bilayers appear to be hindered (i.e., the anisotropy values do not appear to decay to zero at times long compared to the fluorescence lifetime). Extrapolation to the intercept on the r axis reveals these limiting anisotropy (r∞) values, which are summarized on Figure 7. Clearly, the rotations of perylene are most hindered in DMPC vesicles at temperatures below their phase transition temperature of 23 °C. In addition, significant hindrance is also observed in DOPC vesicles at low temperatures. Perylene rotations in both lipids at temperatures above 30 °Care less hindered. These data clearly demonstrate that the depolarizing rotations of perylene are different in lipid bilayers from those in isotropic solvents and illustrate the weakness of free rotator modeling in this case.
FIGURE 6:
Lifetime-resolved anisotropies for perylene in DMPC and in DOPC vesicles. The dashed line represents similar data for perylene in propylene glycol. Note that the r-axis intercepts are clearly nonzero in the bilayers and especially at temperatures below the phase transition temperature of DMPC. These intercepts indicate hindered depolarizing rotations.
FIGURE 7:
Limiting (r∞) and steady-state (r) anisotropies for perylene in lipid vesicles. The open squares are the observed r values and the solid squares are the r∞ values for perylene in propylene glycol.
It is interesting to compare the r∞ values for perylene with those observed previously for DPH. At temperatures below Tc the r∞ values for DPH are constant and comparable to r0. In contrast, the r∞ values for perylene continue to increase at temperatures below Tc (Figure 7) and are considerably less than its r0 value. These differences may reflect differences in either probe location or probe geometry. If one presumes that both probes occupy the center of the bilayer, it is likely that DPH r∞ values reflect the mobility further up the acyl side chain than perylene. Such a “fluidity gradient” concept, however, requires precise knowledge of the locations that the probes occupy. It may also be possible that the r∞ differences result from fundamental differences in the probe shape (rodlike vs. disklike). Without further information, the source of the r∞ differences must remain an open question.
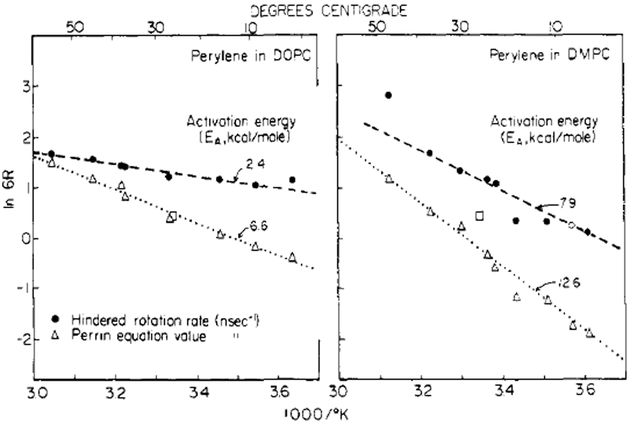
We note that even the small r∞ values evident at elevated temperatures may result in large differences between the actual rotational rate and the rate derived from free rotation modeling. For example, in Figure 6A, a line drawn through the origin and the nearest 47 °C r value (which is the unquenched steady-state anisotropy at 47 °C for perylene in DMPC vesicles) will have a markedly different slope from the actual line through all the data. This leads to underestimation of the probe rotational rate by a factor of about 4, which is typical for DMPC at different temperatures. This point is illustrated more extensively in Figure 8 which shows the rotational rates for perylene which were derived by using the free and the hindered model. In addition to yielding faster rotational rates, the hindered model also reveals activation energies for probe rotation which are two- to threefold smaller than those indicated from the free rotation model. Clearly, the presence of hindered rotation can dramatically affect the derived values for probe rotation and the temperature dependence of these rotational rates.
FIGURE 8:
Arrhenius plots for the perylene rotational rates derived from the free and hindered models. The open square is for perylene in propylene glycol at 26 °C. In this case, r∞ = 0, and the same rotational rate is obtained with either model.
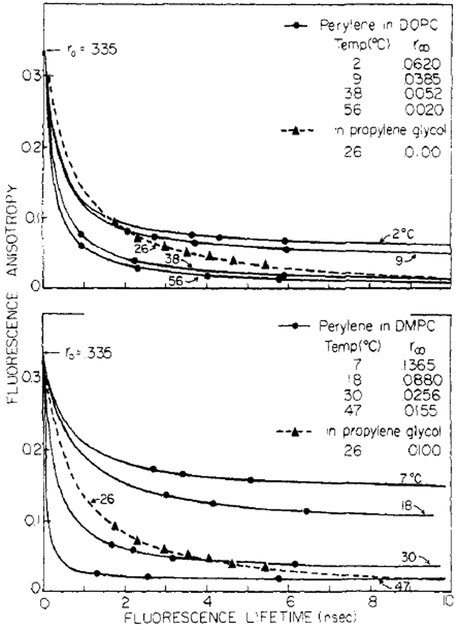
The large extent to which the limiting anisotropy values (r∞) affect the steady-state values is shown in Figure 9. We fit our lifetime-resolved anisotropy values to the. formula for a hindered rotator, which may be derived from eq 2 and 4:
| (11) |
r0 was fixed at 0.335, and r∞ and were chosen for least-squares deviations. The fluorescence anisotropy values shown with the longest lifetimes (about 6 ns) are for the unquenched solutions and thus are representative of the steady-state anisotropy value. Clearly, the steady state anisotropies are governed primarily by r∞ Since the rotational rates of perylene in the bilayers are rapid at all temperatures, the depolarization resulting from rotational diffusion is essentially complete. Hence, for perylene, steady-state anisotropy values in lipid bilayers are representative of r∞ and not the Brownian rotational rate. Note that for perylene in propylene glycol r∞ ≃ 0 and that the rotational rate determines the steady-state anisotropy values. In summary, these data clearly demonstrate that the depolarizing rotations of perylene in lipid bilayers are different from those in isotropic solvents and illustrate the need for careful interpretation of steady-state anisotropy data.
FIGURE 9:
Lifetime-resolved fluorescence anisotropies of perylene. These data, for perylene in propylene glycol and in lipid bilayers, were fit to that expected for a hindered rotator (eq 11). The symbols represent actual data, and the solid lines are the theoretical curves.
Discussion
We have shown that molecular rotations of perylene in lipid bilayers are not the same as in solvent. In propylene glycol, the rotation of perylene is unhindered, and anisotropy tends to zero at long times. In bilayers, however, the rotation is hindered, leading to nonzero limiting anisotropies (r∞). Most significantly, for perylene in bilayers, the steady-state anisotropy is determined by r∞ and not by the mean rotation rate (Figure 9). Thus, “microviscosity” derived from such data is actually a function of the angle between barriers and not the frictional retardation forces in the bilayer. Other microviscosity probes have also been found to behave as hindered rotators, including diphenylhexatriene, 2-anilinonaphthalene, and 1-anilino-8-naphthalenesulfonic acid. These observations, taken together, indicate that steady-state anisotropies for membrane-bound fluorophores are not solely a function of the viscous drag on molecular rotation. In an earlier discussion, we emphasized the strong dependence of the derived microviscosity on the type of diffusive process used in its estimation (Lakowicz et al., 1979b). Microviscosities deduced from different physical processes (such as probe rotation and oxygen diffusion) can differ by a factor of 150. It appears that a single microviscosity is inadequate to describe the diffusive motions of molecules of widely differing sizes and shapes in lipid bilayers.
Having established the existence and importance of barriers to perylene rotation in the bilayers, we chose to investigate the relative contribution of in- and out-of-plane rotations to the observed emission anisotropy. Further, we questioned which of these diffusive motions is hindered in bilayers. For short lifetimes and correspondingly small rotations, determination of these motions can be obtained by excitation at wavelengths where r0 = −0.2, 0.1, and 0.4. Under these conditions initial depolarization results from in-plane rotations (Rip), the out-of-plane rotations (Rop), and an average of rotational rates (Rip + Rop)/2, respectively. An unambiguous determination of Rip and Rop is complicated by several factors. First, the above simple separation of rotation rates is strictly valid only under conditions where the angles through which the perylene has rotated are small. Second, one cannot find suitable excitation conditions for each of the required r0 values. Moreover, r0 values are obtained in vitrified solutions of propylene glycol, and the precise wavelengths required may be temperature dependent. Finally, instrumental sensitivity, the weakness of the absorption moments, and background fluorescence from the sample become limiting factors at excitation wavelengths where r0 is near −0.2 and 0.1. These factors prevent a complete determination of the distinct levels of hindrance in each direction. It should be noted that even if one obtains time-resolved or lifetime-resolved anisotropies at each wavelength, one may not be able to quantify the hindrance levels in each direction. In general, angular hindrance becomes apparent only after the probe rotates 40° or more, and at that point the small angle approximations surely fail. At present we do not know how hindrance of the in-plane and out-of-plane rotations are reflected in r∞.
Fortunately, one may still make qualitative estimates of the relative angular freedom in each direction by coupling the lifetime-resolved anisotropy data with unquenched steady-state measurements at r0 = 0.1 and r0 = −0.2. While nearly collinear oscillators were obtained at long-wavelength (410-nm) excitation, r0 = 0.1 was achieved at 314 nm and r0 = −0.165 was available (as a minimum r0) at 252 nm. Absolute values of r less than the corresponding r0 values are indicative of rotation out-of-plane and in-plane, respectively. We measured these steady-state anisotropy values (Figure 10), making careful corrections for background fluorescence by observing unlabeled vesicle suspensions under precisely the same instrumental conditions.
FIGURE 10:
Steady-state fluorescence anisotropies obtained at short-wavelength excitation. r0 = 0.1 and r0 = −0.165 were obtained by using 314- and 252-nm excitation, respectively.
In DMPC vesicles, the short-wavelength unquenched anisotropy values, when coupled with our lifetime-resolved anisotropy measurements (410-nm), indicate that both in-plane and out-of-plane rotations are partly hindered, while neither motion is completely hindered. Our reasoning is as follows: the observed r∞ values (410 nm), in excess of 0.1 (at temperatures below Tc), indicate that one of the rotations may be completely hindered. If the out-of-plane rotation is completely hindered, then no depolarization is expected, and the observed fluorescence anisotropy at 314-nm excitation should equal r0 = 0.1 (Kinosita et al, 1977). However, the anisotropy is about 0.04 at temperatures below Tc, indicating considerable depolarization. Hence, the out-of-plane rotations are not completely hindered.
At 252-nm excitation, complete hindrance of the in-plane rotation would (approximately) yield r = r0 = −0.165 (assuming the out-of-plane rotation is reasonably slow). However, the observed anisotropy at 10 °C is near −0.03 (Figure 10), indicating incomplete hindrance of the in-plane rotation. We conclude, subject to the caveats mentioned above, that both in-plane and out-of-plane rotations of perylene are partially hindered in DMPC bilayers, and limitation to the extent of both rotations contributes to the observed r∞ values (Figure 7).
Similar reasoning for perylene in DOPC vesicles allows us to conclude that one or both of the rotations are partially hindered, but neither is completely free. The fact that neither motion is completely hindered is demonstrated by observed r∞ values (410 nm) which are less than 0.1. Complete hindrance of either Rip or Rop would result in r∞ (410 nm) ≥0.1 (Kinosita et al., 1977). In addition, the observation of depolarization at 252- and 314-nm excitation (Figure 10) demonstrates that both rotations are active. Thus, the nonzero limiting anisotropy values (Figure 7) demonstrate that at least one of the motions is partially hindered on the nanosecond time scale.
We have shown that both the in- and out-of-plane rotations of perylene may be hindered in bilayer vesicles. In addition, we have shown that the mean rotation rate is rapid on the nanosecond time scale and that the anisotropic nature of the rotations is thus hidden from our steady-state observations. These considerations also affect time-resolved measurements of anisotropy, since the finite, width of an excitation pulse places a lower time limit on r observations. With current techniques (widths ≃ 0.5 ns), the rapid rotations of perylene will make observation of small-angle initial depolarization difficult, since even at 5 °C in DMPC, perylene rotates an average of 40° in 1 ns.
Invisibility of a major portion of the decay is certainly a complication in extracting two decay rates. More serious, however, is the presence of angular barriers (possibly heterogeneous) to molecular rotation. Since at this time we have no clear method for separating hindrance into its components, we cannot be certain how early in the rotation history angular barriers can alter the decay. The reflection of probes (or stoppage) by angular barriers appears to occur very early (see Figure 9) in the lifetime development in bilayers, and a mixing of rotation rates quite unlike the free anisotropic model may result. In fact, an important result of this investigation is the demonstration of these angular barriers that take the problem into theoretically unmapped ground. Until suitable predictions can be made with a model of differentially hindered anisotropic rotors, we will be limited to the discussion of “average” barriers (r∞) and corresponding average rotation rates.
Acknowledgments
We thank the Freshwater Biological Research Foundation and especially its founder, Richard Gray, Sr., without whose assistance this work would not have been possible.
This work was done during the tenure of an Established Investigatorship (to J.R.L.) of the American Heart Association (78-151), and with funds contributed in part by the Minnesota Affiliate, and of a postdoctoral fellowship (to J.R.K.) of the American Heart Association, Minnesota Affiliate (MN 79-F-6). These studies were supported by grants from the National Science Foundation (PCM 78-16706), the National Institutes of Health (ES 01283), and the American Heart Association (76-706).
Footnotes
Abbreviations used: DMPC and DOPC, dimyristoyl- and dioleoyl-L-α-phosphatidylcholine, respectively; DPH, diphenylhexatriene.
References
- Badea MG, DeToma RP, & Brand L (1978) Biophys. J 24, 197–212. [DOI] [PMC free article] [PubMed] [Google Scholar]
- Brashford CL, Morgan CG, & Radda GK (1976) Biochim. Biophys. Acta 426, 157. [DOI] [PubMed] [Google Scholar]
- Cogan U, Shinitzky M, Weber G, & Nishida T (1973) Biochemistry 12, 521–528. [DOI] [PubMed] [Google Scholar]
- Dale RE, Chen LA, & Brand L (1977) J. Biol. Chem 252, 7500–7510. [PubMed] [Google Scholar]
- Frank IM, & Vavilov SI (1931) Z. Phys 69, 100. [Google Scholar]
- Helgerson WA, Cramer WA, Harris JM, & Lytle FE (1974) Biochemistry 13, 3057–3061. [DOI] [PubMed] [Google Scholar]
- Jacobsen K, & Wobschall D (1974) Chem. Phys. Lipids 12, 117–131. [DOI] [PubMed] [Google Scholar]
- Kawato S, Kinosita K Jr., & Ikegami A (1977) Biochemistry 16, 2319–2324. [DOI] [PubMed] [Google Scholar]
- Kinosita K Jr., Mitaku S, Ikegami A, Ohbo N, & Kunii TL (1976) Jpn. J. Appl. Phys 15, 2433–2440. [Google Scholar]
- Kinosita K Jr., Kawato S, & Ikegami A (1977) Biophys. J 20, 289–305. [DOI] [PMC free article] [PubMed] [Google Scholar]
- Lakowicz JR, & Weber G (1973) Biochemistry 12, 4161–4170. [DOI] [PMC free article] [PubMed] [Google Scholar]
- Lakowicz JR, & Prendergast FG (1978) Science 200, 1399–1401. [DOI] [PMC free article] [PubMed] [Google Scholar]
- Lakowicz JR, Prendergast FG, & Hogen D (1979a) Biochemistry 18, 508–519. [DOI] [PMC free article] [PubMed] [Google Scholar]
- Lakowicz JR, Prendergast FG, & Hogen D (1979b) Biochemistry 18, 520–527. [DOI] [PMC free article] [PubMed] [Google Scholar]
- Lentz B, Barenholz Y, & Thompson TE (1976) Biochemistry 15, 4521–4528. [DOI] [PubMed] [Google Scholar]
- Moore NF, Barenholz Y, & Wagner RR (1976) J. Virol 19, 126–135. [DOI] [PMC free article] [PubMed] [Google Scholar]
- Shinitzky M, Dianoux AC, Gitler C, & Weber G (1971) Biochemistry 10, 2106–2113. [DOI] [PubMed] [Google Scholar]
- Spencer RD, & Weber G (1969) Ann. N.Y. Acad. Sci 158, 361–376. [Google Scholar]
- Spencer RD, & Weber G (1970) J. Chem. Phys 52, 1654–1663. [Google Scholar]
- Tao T (1969) Biopolymers 8, 609–362. [Google Scholar]
- Vaughan WM, & Weber G (1970) Biochemistry 9, 464–473. [DOI] [PubMed] [Google Scholar]
- Veatch WR, & Stryer L (1977) J. Mol. Biol 117, 1109–1113. [DOI] [PubMed] [Google Scholar]
- Weber G (1971) J. Chem. Phys 55, 2399–2407. [Google Scholar]


