Abstract
Low vitamin D status is associated with progression in patients with renal cell carcinoma (RCC). The present study found that vimentin, a mesenchymal marker, was accordingly upregulated, and E‐cadherin, an epithelial marker, was downregulated in RCC patients with low vitamin D status. Thus, we investigated the effects of calcitriol or vitamin D3, an active form of vitamin D, on epithelial‐mesenchymal transition (EMT) in RCC cells. RCC cells were treated by two models. In model 1, three RCC cell lines, ACHN, 786‐O and CAKI‐2, were incubated with either LPS (2.0 μg/mL) or transforming growth factor (TGF)‐β1 (10 ng/mL) in the presence or absence of calcitriol (200 nmol/L). In model 2, two RCC cell lines, ACHN and CAKI‐2, were incubated with calcitriol (200 nmol/L) only. Calcitriol inhibited migration and invasion not only in TGF‐β1‐stimulated but also in TGF‐β1‐unstimulated RCC cells. Moreover, calcitriol suppressed E‐cadherin downregulation and vimentin upregulation not only in TGF‐β1‐stimulated but also in TGF‐β1‐unstimulated ACHN and CAKI‐2 cells. Calcitriol attenuated LPS‐induced upregulation of MMP‐2, MMP‐7, MMP‐9, MMP‐26 and urokinase‐type plasminogen activator (u‐PA) in ACHN cells. In addition, calcitriol blocked TGF‐β1‐induced nuclear translocation of ZEB1, Snail and Twist1 in ACHN and CAKI‐2 cells. Mechanistically, calcitriol suppressed EMT through different signaling pathways: (i) calcitriol suppressed Smad2/3 phosphorylation by reinforcing physical interaction between vitamin D receptor (VDR) and Smad3 in TGF‐β1‐stimulated RCC cells; (ii) calcitriol inhibited signal transducer and activator of transcription (STAT)3 activation in LPS‐stimulated RCC cells; (iii) calcitriol inhibited β‐catenin/TCF‐4 activation by promoting integration of VDR with β‐catenin in TGF‐β1‐unstimulated RCC cells. Taken together, calcitriol inhibits migration and invasion of RCC cells partially by suppressing Smad2/3‐, STAT3‐ and β‐catenin‐mediated EMT.
Keywords: calcitriol, epithelial‐mesenchymal transition, migration, renal cell carcinoma, vitamin D receptor
Calcitriol suppressed EMT through two different signaling pathways: (i) calcitriol suppressed Smad2/3 phosphorylation by reinforcing physical interaction between vitamin D receptor (VDR) and Smad3 in TGF‐β1‐stimulated RCC cells; (ii) calcitriol inhibited β‐catenin/TCF‐4 activation by promoting integration of VDR with β‐catenin in TGF‐β1‐unstimulated RCC cells. Taken together, calcitriol inhibits migration and invasion of RCC cells by suppressing Smad2/3‐ and β‐catenin‐mediated EMT.
1. INTRODUCTION
Renal cell carcinoma (RCC) is the sixth most frequently diagnosed cancer in men and the 10th in women, accounting for 5% and 3% of all oncological diagnoses, respectively.1, 2 Clear cell RCC (ccRCC), the most common subtype of RCC, comprises approximately 70%‐80% of all RCC patients.3 As localized and metastatic RCC differ in prognosis,4 unravelling the mechanism underlying cancer metastasis will provide important insights into novel treatment strategies to improve survival. Epithelial‐mesenchymal transition (EMT) is a cellular process during which cancer cells lose their epithelial characteristics, such as epithelial marker E‐cadherin, and acquire mesenchymal features, such as mesenchymal marker vimentin.5 Increasing evidence has shown that EMT is a possible mechanism of cancer migration, invasion and subsequent metastasis.6 Several signaling pathways, such as transforming growth factor (TGF)‐β1/Smad2/3, signal transducer and activator of transcription (STAT)3 and WNT/β‐catenin, are involved in the process of EMT in cancer cells.7, 8
Vitamin D is well known for the maintenance of calcium uptake and bone metabolism.9, 10 Recently, vitamin D has been recognized for its non‐classical actions, such as cell proliferation, synaptic plasticity, anticancer and anti‐inflammatory activities.11, 12, 13, 14, 15 Accumulating data show that low vitamin D status is associated with an increased cancer risk and poor prognosis.16, 17, 18, 19 Vitamin D itself is devoid of biological activity. Vitamin D3 is converted to 25(OH)D3 by cytochrome P450 (CYP)2R1 and is then converted into 1,25(OH)2D3 by CYP27B1.20 The actions of vitamin D3 are mediated by vitamin D receptor (VDR).21 Several studies found that 1,25(OH)2D3 suppressed migration and invasion of breast, prostate, colorectal, ovarian, thyroid and pancreatic cancer cells.22, 23, 24, 25, 26, 27 Although CYP27B1 and VDR, two key components for vitamin D3 activity, are highly expressed in human kidney,28 it is unclear whether 1,25(OH)2D3 inhibits invasion and migration in RCC cells.
The objective of the present study was to analyze the association between low vitamin D status and EMT in RCC patients. Moreover, we investigated the effects of calcitriol, an active form of vitamin D3, on migration and invasion of RCC cells. In addition, we explored whether calcitriol inhibits EMT in TGF‐β1‐stimulated and ‐unstimulated RCC cells. Our results showed that there was an association between low vitamin D status and EMT in RCC patients. We found that calcitriol suppressed EMT not only in TGF‐β1‐stimulated but also in TGF‐β1‐unstimulated RCC cells. We provide evidence that calcitriol inhibits migration and invasion of RCC cells by suppressing Smad2/3‐, STAT3‐ and β‐catenin‐mediated EMT.
2. MATERIALS AND METHODS
2.1. Study participants
A total of 40 newly diagnosed RCC patients with ages ranging from 40 to 75 years were recruited from the Second Affiliated Hospital of Anhui Medical University. All patients were diagnosed with RCC for the first time between January 2013 and December 2014. Total of 40 controls were selected from physical examination at the Second Affiliated Hospital of Anhui Medical University. Controls were matched with RCC patients regarding age (within 2 years), gender and season of blood sample. Individuals with a history of cystic nephropathy, tuberous sclerosis, and severe kidney disease were excluded from this study. All slides were re‐examined by two pathologists to ensure correct diagnosis. For measurement of 25(OH)D and TGF‐β, serum samples were collected and stored at −80°C. Serum collection and research procedure were approved by the ethics committee of Anhui Medical University. Oral and written consents were obtained from all subjects. All population characteristics are listed in Table S1.
2.2. Reagents
Lipopolysaccharide (Escherichia coli LPS, serotype 0127: B8) and calcitriol were purchased from Sigma Chemical Co. TGF‐β1 was purchased from Cell Signaling Technology. Antibodies against E‐cadherin, vimentin, p‐Smad2/3, VDR, β‐actin, β‐catenin, phosphorylated β‐catenin (p‐β‐catenin), Snail, Twist1, TCF‐4 and Lamin A/C were from Cell Signaling Technology. Antibody against ZEB1 was from Abcam. Chemiluminescence detection kit was from Pierce Biotechnology. TRI reagent was purchased from the Molecular Research Center Inc. RNase‐free DNase and Avian Myeloma Virus reverse transcriptase (AMV reverse transcriptase) were purchased from Promega Corporation. All other reagents were purchased from Sigma Chemical Co. if not otherwise stated.
2.3. Serum 25(OH)D and TGF‐β measurement
Serum 25(OH)D was measured by RIA using commercial kits following the manufacturer’s instructions. Serum 25(OH)D concentration is expressed as ng/mL. Vitamin D deficiency was defined as <20 ng/mL 25(OH)D. TGF‐β was measured using commercial ELISA kits (R&D Systems) according to the manufacturer’s protocol. TGF‐β level is expressed as pg/mL.
2.4. Cell culture and treatments
Different cell lines were chosen to investigate the effects of calcitriol on migration and invasion of RCC cells. ACHN cell is a papillary RCC cell line that does not harbor Von‐Hippel‐Lindau (VHL) mutations.29 786‐O cell is a VHL‐null clear cell RCC cell line.30 CAKI‐2 cell line was established from a patient with historically diagnosed primary clear cell RCC, but mutational analysis suggests a papillary subtype that is a VHL wild‐type RCC cell.31, 32 ACHN, 786‐O, and CAKI‐2 cells were obtained from the Cell Bank of the Chinese Academy of Sciences. Cells were grown in T25 cell culture flasks (Corning) in medium supplemented with 100 U/mL penicillin, 100 μg/mL streptomycin and 10% FBS (Gibco) at 5% CO2, 37°C. ACHN cells were grown in MEM/EBSS (HyClone), 786‐O in RPMI 1640 Medium (HyClone), CAKI‐2 in McCoy’s 5A Medium (Gibco). At approximately 80% confluence, the medium was replaced with serum‐free medium. Either ACHN cells or 786‐O cells or CAKI‐2 cells were seeded into six‐well culture plates at a density of 5 × 10⁵ cells/well and incubated for at least 12 hours to allow them to adhere to the plates. RCC cells were treated by two models. In model 1, either ACHN cells or 786‐O cells or CAKI‐2 cells were preincubated with calcitriol (200 nmol/L) for 12 hours. Cells were then incubated with LPS (2.0 μg/mL) or TGF‐β1 (10 ng/mL) for another 24 hours in the presence or absence of calcitriol (200 nmol/L). In model 2, either ACHN or CAKI‐2 cells were incubated with calcitriol (200 nmol/L) for 12 hours. The doses of calcitriol used in the present study were as described in a previous study.33 Cells were harvested for wound healing, Transwell, real‐time RT‐PCR, western blot and coimmunoprecipitation (Co‐IP) assays.
2.5. Wound healing migration assay
Wound healing assay was carried out as described by others with minor modifications.34 Briefly, ACHN cells (5.0 × 10⁵ cells/well) were cultured in six‐well plates until 80% confluent. The confluent monolayer cells were carefully scratched using a 200‐μL tip and washed twice with PBS after collecting the medium of each well. The mediums were added back to corresponding wells. Cells were photographed at low magnification for time intervals of 0 and 12 hours. The wounded area was calculated according to the formula: (mean wounded width – mean remaining width)/mean wounded width × 100 (%).
2.6. Cell migration and invasion assays
Cell migration and invasion were evaluated using 5‐μm Transwell filters (Costar Corning) as described by others with minor modifications.35 For migration assay, 5 × 10⁴ cells in 0.2 mL complete medium were seeded in the upper compartment. Plates were incubated for 24 hours at 37°C, 5% CO2. After incubation for 24 hours, complete medium in the upper chamber was replaced with serum‐free medium (supplemented with 0.5% BSA). The lower compartment was filled with 0.6 mL basal medium containing 10% FBS as chemoattractant and then incubated for 24 hours. For invasion assay, 5 × 10⁴ cells in 0.2 mL complete medium were seeded in the upper compartment precoated with 50 μL Matrigel solution (100 μg/mL; BD Biosciences). After incubation for 24 hours, the complete medium in the upper chamber was replaced with serum‐free medium (supplemented with 0.5% BSA). The lower compartment was filled with 0.6 mL basal medium containing 10% FBS as chemoattractant and then incubated for 48 hours. Non‐migratory cells on the upper side of the chamber and medium of the lower chamber were removed. The membranes were fixed with methanol for 20 minutes and stained with 0.1% crystal violet solution for 20 minutes. The numbers of cells that had migrated to the bottom of the filter were evaluated by detecting the absorbance of decolorization solution of 30% acetic acid at 570 nm.
2.7. Immunohistochemistry
Human cancerous tissues from RCC patients were fixed in 4% formalin and embedded in paraffin according to the standard procedure. Paraffin‐embedded renal sections were deparaffinized and rehydrated in a graded ethanol series. After antigen retrieval and quenching of endogenous peroxidase, sections were incubated at 4°C overnight with the following antibodies: E‐cadherin, vimentin, p‐Smad2/3 and VDR. The color reaction was developed with HRP‐linked polymer detection system and counterstaining with hematoxylin. E‐cadherin‐, vimentin‐, p‐Smad2/3‐ and VDR‐positive cells were compared between the two groups.
2.8. Real‐time RT‐PCR
TRI reagent was used to extract total RNA in RCC cells. Total RNA (1.0 µg) treated with RNase‐free DNase was reverse‐transcribed with AMV. The primers used in the RT‐PCR experiments were designed by PubMed’s online Primer software and synthesized by Life Technologies. All primers are listed in Table S2. The PCR amplification reaction was cyclically amplified with 50 cycles in a three‐step process of denaturation, annealing, and extension. Relative ratio of the target gene was calculated using Light cycler 480 software (Roche version 1.5.0).
2.9. Western blot
Renal cell carcinoma cells were used to fabricate lysate in 300 μL lysis buffer (50 mmol/L Tris‐HCl, pH 7.4, 150 mmol/L NaCl, 1 mmol/L EDTA, 1% Triton X‐100, 1% sodium deoxycholate, 0.1% SDS, 1 mmol/L phenylmethylsulfonyl fluoride) supplemented with a cocktail of protease inhibitors (Roche). The homogenates were centrifuged at 15 000 g for 15 minutes. Supernatant was added to a gel loading buffer (100 mmol/L Tris, pH 6.8, 20% glycerol, 200 mmol/L DTT, 4% SDS, 0.03% bromophenol blue) and boiled for 10 minutes. Approximately 20 μg protein in loading buffer was subjected to electrophoresis in 12.5% SDS‐polyacrylamide gel for 3 hours. The gel was transferred electrophoretically onto a PVDF membrane. The membranes were blocked by non‐fat milk for 2 hours at room temperature. For total protein, the membrane was incubated at room temperature for 2 hours using the following antibodies: E‐cadherin, vimentin, p‐Smad2/3, β‐catenin, p‐β‐catenin, p‐STAT3, STAT3 and β‐actin. For nuclear protein, the membrane was incubated at room temperature for 2 hours using the following antibodies: ZEB1, Snail, Twist1, VDR and Lamin A/C. After washing in Dulbecco’s PBS containing 0.05% Tween‐20 four times for 10 minutes and PBS for 10 minutes, the membrane was incubated with goat antirabbit or horse antigoat IgG antibody for 90 minutes at room temperature. The membrane was then washed four times in Dulbecco’s PBS containing 0.05% Tween‐20 for 10 minutes and PBS for 10 minutes, followed by signal development using an ECL detection kit.
2.10. Coimmunoprecipitation
Total proteins were prepared in a lysis buffer (0.6% Nonidet P‐40, 0.5% sodium deoxycholate, 150 mmol/L NaCl and 50 mmol/L Tris‐HCl, pH 7.5) containing 0.1 mmol/L vanadyl sulfate and protease inhibitors (0.5 mg/mL aprotinin, 0.5 mg/mL trans‐epoxy succinyl‐L‐leucylamido‐(4‐guanidino) butane (E‐64), 0.5 mg/mL pepstatin, 0.5 mg/mL bestatin, 10 mg/mL chymostatin, and 0.1 ng/mL leupeptin. For interaction between VDR and p‐Smad3, cell lysates (300 μg) were precleared with protein A/G‐agarose and then incubated with agarose‐conjugated VDR antibody (Cell Signaling Technology) at 4°C overnight. Precipitates were washed with cold RIPA buffer before immunoblotting using a murine monoclonal p‐Smad3 antibody (Cascade Bioscience). For interaction among VDR, TCF‐4 and β‐catenin, cell lysates (300 μg) were precleared with protein A/G‐agarose and then incubated with agarose‐conjugated VDR antibody (Cell Signaling Technology) at 4°C overnight. The precipitates were washed with cold RIPA buffer before immunoblotting using a murine monoclonal antibody for either TCF‐4 or β‐catenin.
2.11. Statistical analysis
Normally distributed data are expressed as means ± SEM Discrepancy between different groups were determined by using ANOVA and the Student‐Newman‐Keuls post‐hoc method. The difference between two independent groups was compared using two independent sampling t tests or the Mann‐Whitney U test. P < .05 was considered statistically significant.
3. RESULTS
3.1. Renal EMT is activated in RCC patients with low levels of 25(OH)D3
As shown in Figure 1A, More than 50% of RCC patients had serum 25(OH)D3 levels below 20 ng/ml, significantly higher than that of controls, which is 20%. Serum TGF‐β was analyzed in RCC patients. As shown in Figure 1B, serum TGF‐β was elevated among RCC patients (Figure 1B). Serum TGF‐β level was then compared between RCC patients with low 25(OH)D and high 25(OH)D. As shown in Figure 1C, serum TGF‐β was slightly higher in RCC patients with low 25(OH)D than in RCC patients with high 25(OH)D. Renal VDR and p‐Smad2/3 were analyzed among RCC patients. VDR‐positive cells were lower in RCC patients with low 25(OH)D than in RCC patients with high 25(OH)D (Figure 1D,1). By contrast, p‐Smad2/3‐positive cells were greater in RCC patients with low 25(OH)D than in RCC patients with high 25(OH)D (Figure 1D,1). Finally, renal EMT markers were compared between RCC patients with low 25(OH)D and high 25(OH)D. E‐cadherin‐positive cells were lower in RCC patients with low 25(OH)D than in RCC patients with high 25(OH)D (Figure 1G,H). By contrast, vimentin‐positive cells were greater in RCC patients with low 25(OH)D than in RCC patients with high 25(OH)D (Figure 1G,I).
Figure 1.
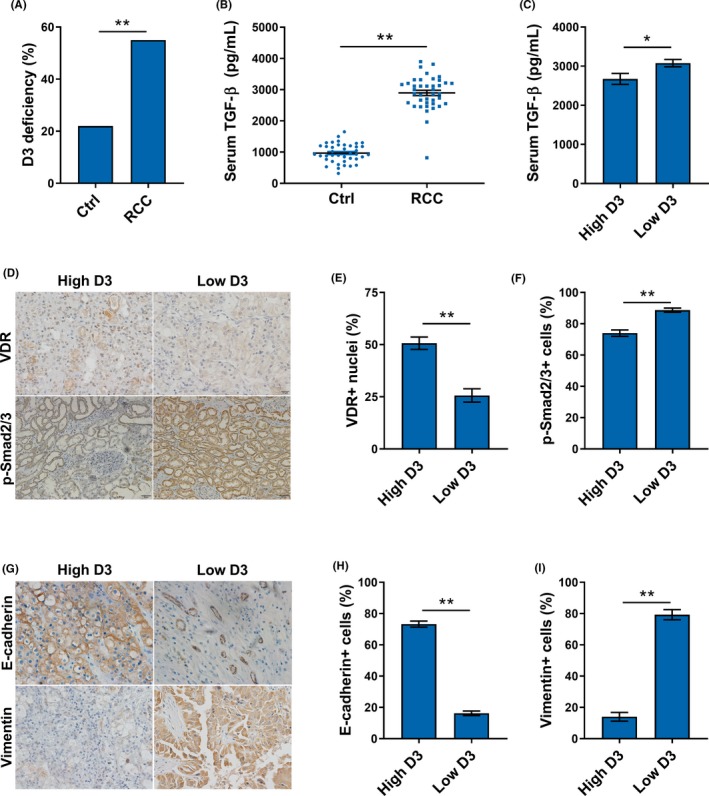
Concentrations of serum 25(OH)D and transforming growth factor (TGF)‐β, expressions of vitamin D receptor (VDR) and phosphorylated (p)‐Smad2/3, and distributions of E‐cadherin and vimentin among renal cell carcinoma (RCC) patients. A, Percentage of vitamin D3 deficiency among RCC patients and controls. B, Serum TGF‐β levels in RCC patients and controls. C, Serum TGF‐β levels in RCC patients with low and high levels of 25(OH)D. D‐F, Expressions of VDR and p‐Smad2/3 in RCC patients with low and high levels of 25(OH)D. G‐I, Distributions of E‐cadherin and vimentin in RCC patients with low and high levels of 25(OH)D. All data are expressed as means ± SEM (N = 50). **P < .01
3.2. Calcitriol inhibits migration and invasion in RCC cells
Effects of calcitriol on migration of RCC cells were analyzed. As expected, the percentage of wound closing was elevated in LPS‐ and TGF‐β1‐stimulated ACHN cells (Figure 2A,2). Of interest, calcitriol suppressed wound closing in LPS‐ and TGF‐β1‐stimulated RCC cells (Figure 1A,1). The effects of calcitriol on migration of RCC cells were determined. As expected, LPS and TGF‐β1 stimulated migration of ACHN and 786‐O cells (Figure 2C‐F). Interestingly, calcitriol inhibited migration in LPS‐ and TGF‐β1‐ stimulated ACHN and 786‐O cells (Figure 2C‐F). The effects of calcitriol on invasion of RCC cells are presented in Figure 3. As expected, cell invasion was elevated in LPS‐ and TGF‐β1‐stimulated ACHN cells (Figure 3A,3). Moreover, cell invasion was elevated in LPS‐ and TGF‐β1‐stimulated 786‐O cells (Figure 3C,3). MMP‐2, MMP‐7, MMP‐9 and MMP‐26 mRNAs were upregulated in LPS‐stimulated ACHN cells (Figure 3E‐H). Level of urokinase‐type plasminogen activator (u‐PA) mRNA was elevated in LPS‐stimulated invasion in ACHN cells (Figure 3I). Of interest, calcitriol suppressed invasion in LPS‐ and TGF‐β1‐stimulated ACHN and 786‐O cells (Figure 3A‐D). In addition, calcitriol attenuated LPS‐induced upregulation of MMP‐2, MMP‐7, MMP‐9, MMP‐26 and u‐PA in ACHN cells (Figure 3E‐I).
Figure 2.
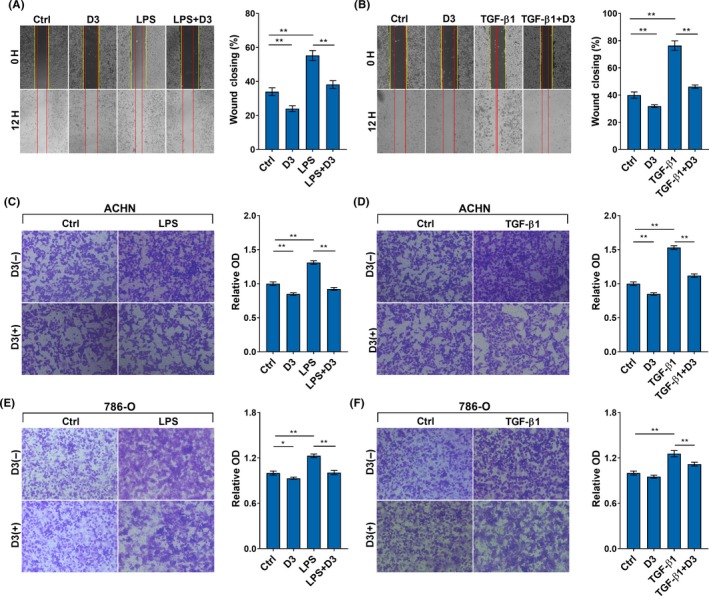
Calcitriol inhibits migration of renal cell carcinoma (RCC) cells. Either ACHN or 786‐O cells were incubated with LPS (2.0 μg/mL) or transforming growth factor (TGF)‐β1 (10 ng/mL) in the absence or presence of calcitriol (200 nmol/L). A and B, Cell migration was measured using wound healing assay. After 12‐h migration, the scratches were photographed in (A) LPS‐ and (B) TGF‐β1‐ stimulated ACHN cells. Wounded areas after 12‐h incubation were calculated. C‐F, Cell migration was measured using Transwell migration assay. Migrated cells were counted in (C) LPS‐ and (D) TGF‐β1‐stimulated ACHN cells. Migrated cells were counted in (E) LPS‐ and (F) TGF‐β1‐stimulated 786‐O cells. All experiments were repeated three times. Data are expressed as means ± SEM (N = 3), *P < .05; **P < .01
Figure 3.
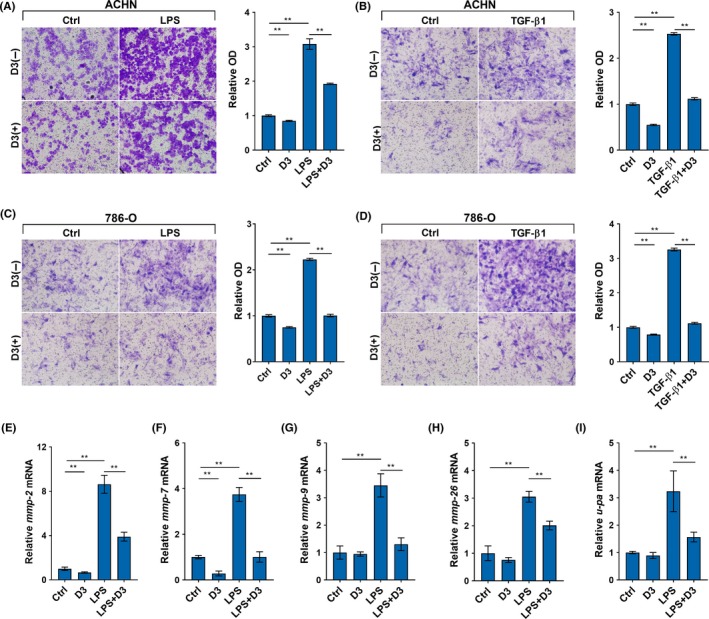
Calcitriol inhibits invasion of renal cell carcinoma (RCC) cells. ACHN and 786‐O cells were incubated with LPS (2.0 μg/mL) or transforming growth factor (TGF)‐β1 (10 ng/mL) in the absence or presence of calcitriol (200 nmol/L). A and B, Invasion of ACHN cells was measured using Transwell invasion assay. Migrated cells were counted in (A) LPS‐ and (B) TGF‐β1‐stimulated ACHN cells. C and D, Invasion of 786‐O cells was measured using Transwell invasion assay. Migrated cells were counted in (C) LPS‐ and (D) TGF‐β1‐stimulated 786‐O cells. E‐I, ACHN cells were collected 6 h after LPS. (E) MMP‐2, (F) MMP‐7, (G) MMP‐9, (H) MMP‐26 and (I) urokinase‐type plasminogen activator (u‐PA) mRNAs were determined using RT‐PCR. All experiments were repeated three times. Data are expressed as means ± SEM (N = 4), **P < .01
3.3. Calcitriol inhibits EMT in TGF‐β1‐stimulated RCC cells
Effects of calcitriol on TGF‐β1‐stimulated EMT were analyzed. As expected, E‐cadherin was downregulated in TGF‐β1‐stimulated ACHN cells (Figure 4A). In addition, E‐cadherin level was reduced in TGF‐β1‐stimulated CAKI‐2 cells (Figure 4B). By contrast, vimentin was upregulated in TGF‐β1‐stimulated ACHN and CAKI‐2 cells (Figure 4A,4). Of interest, TGF‐β1‐induced downregulation of E‐cadherin was attenuated in calcitriol‐treated ACHN and CAKI‐2 cells (Figure 4A,4). Moreover, TGF‐β1‐induced upregulation of vimentin was suppressed in calcitriol‐treated ACHN and CAKI‐2 cells (Figure 4A,4). The effects of calcitriol on Snail and ZEB1, two transcription factors, are presented in Figure 4C. As expected, nuclear Snail and ZEB1 levels were obviously elevated in TGF‐β1‐stimulated ACHN cells. Interestingly, calcitriol inhibited TGF‐β1‐induced elevation of nuclear Snail and ZEB1 in ACHN cells (Figure 4C).
Figure 4.
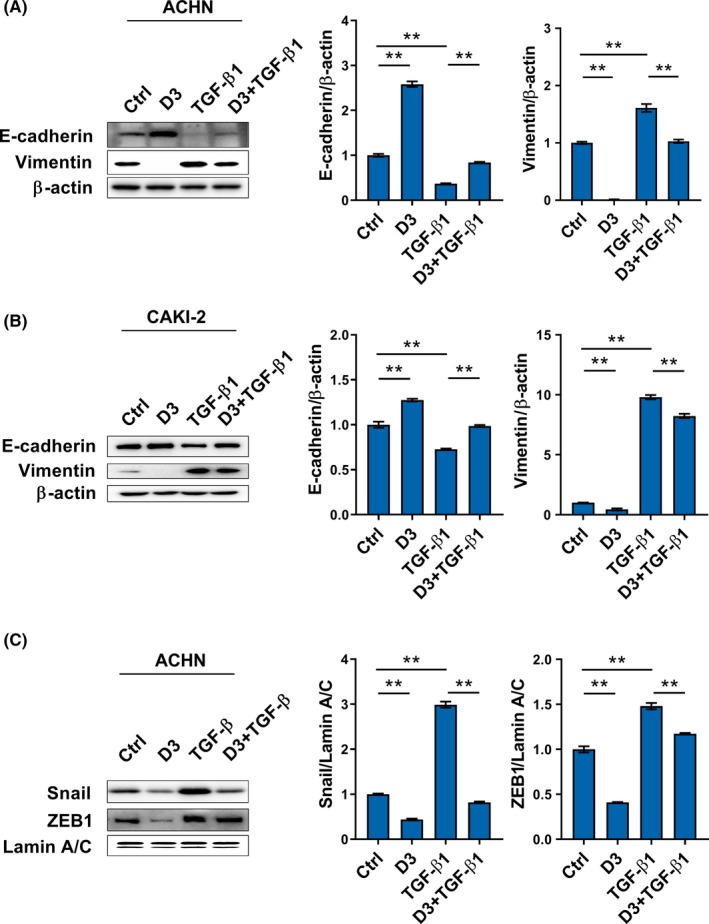
Calcitriol inhibits transforming growth factor (TGF)‐β1‐stimulated epithelial‐mesenchymal transition (EMT) in renal cell carcinoma cells. A and B, Either ACHN or CAKI‐2 cells were incubated with TGF‐β1(10 ng/mL) in the absence or presence of calcitriol (200 nmol/L). A, E‐cadherin and vimentin were measured in TGF‐β1‐stimulated ACHN cells using western blotting. B, E‐cadherin and vimentin were measured in TGF‐β1‐stimulated CAKI‐2 cells using western blotting. C, ACHN cells were incubated with TGF‐β1 (10 ng/mL) in the absence or presence of calcitriol (200 nmol/L). Snail and ZEB1, two transcription factors for EMT, were measured. All experiments were repeated three times. Data are expressed as means ± SEM (N = 3), **P < .01
3.4. Calcitriol inhibits Smad2/3 activation by promoting interaction between VDR and Smad3 in TGF‐β1‐stimulated RCC cells
Effects of calcitriol on TGF‐β1/Smad2/3 signaling were then analyzed. As shown in Figure 5A, the expression of TGF‐β1 was upregulated in LPS‐stimulated ACHN cells. Moreover, p‐Smad2/3 was elevated in TGF‐β1‐stimulated CAKI‐2 cells (Figure 5B). Interestingly, calcitriol inhibited LPS‐induced upregulation of TGF‐β1 in ACHN cells (Figure 5A). In addition, calcitriol attenuated TGF‐β1‐induced Smad2/3 phosphorylation in CAKI‐2 cells (Figure 5B). Interaction between VDR and p‐Smad3 in CAKI cells was determined by Co‐IP. As shown in Figure 5C, calcitriol plus TGF‐β1 elevated p‐Smad3 level in the immunocomplexes precipitated by anti‐VDR antibody. The effects of calcitriol on LPS‐induced STAT3 activation were analyzed. Although no significant difference in the expression of STAT3 was observed among the different groups, the level of p‐STAT3 was elevated in LPS‐stimulated ACHN cells (Figure 5D). Of interest, calcitriol almost completely suppressed LPS‐induced STAT3 phosphorylation in ACHN cells (Figure 5D).
Figure 5.
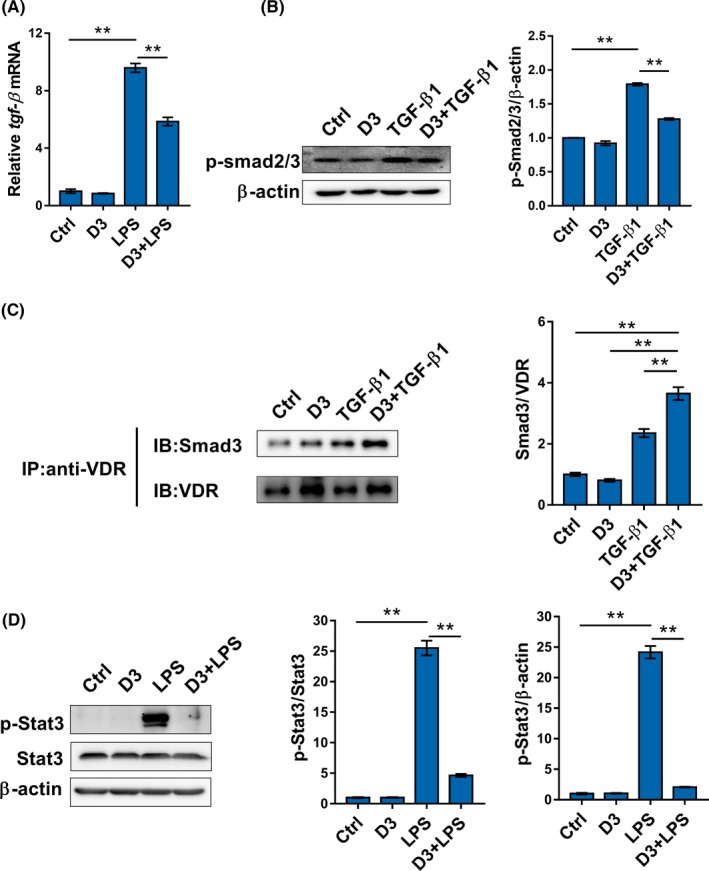
Calcitriol inhibits Smad2/3 activation in transforming growth factor (TGF)‐β1‐stimulated renal cell carcinoma cells. A, ACHN cells were incubated with LPS (2.0 μg/mL) in the absence or presence of calcitriol (200 nmol/L). TGF‐β1 mRNA was measured using real‐time RT‐PCR. B, ACHN cells were incubated with TGF‐β1 (10 ng/mL) in the absence or presence of calcitriol (200 nmol/L). Phosphorylated (p)‐Smad2/3 was measured using western blotting. C, ACHN cells were incubated with TGF‐β1 (10 ng/mL) in the absence or presence of calcitriol (200 nmol/L). Interaction between vitamin D receptor (VDR) and p‐Smad3 was measured using coimmunoprecipitation. D, ACHN cells were incubated with LPS (2.0 μg/mL) in the absence or presence of calcitriol (200 nmol/L). p‐Stat3 and Stat3 were measured using western blotting. Data are expressed as means ± SEM (N = 3), **P < .01
3.5. Calcitriol inhibits EMT in TGF‐β1‐unstimulated RCC cells
Effects of calcitriol on EMT of TGF‐β1‐unstimulated RCC cells were analyzed. As shown in Figure 6A, calcitriol upregulated E‐cadherin, an epithelial marker, in TGF‐β1‐unstimulated CAKI‐2 cells. By contrast, calcitriol downregulated vimentin, a mesothelial marker, in TGF‐β1‐unstimulated CAKI‐2 cells (Figure 6A). The effects of calcitriol on several transcription factors for EMT was analyzed in TGF‐β1‐unstimulated CAKI cells. Interestingly, the levels of nuclear Snail, Twist1 and ZEB1 were reduced in calcitriol‐treated CAKI‐2 cells (Figure 6B).
Figure 6.
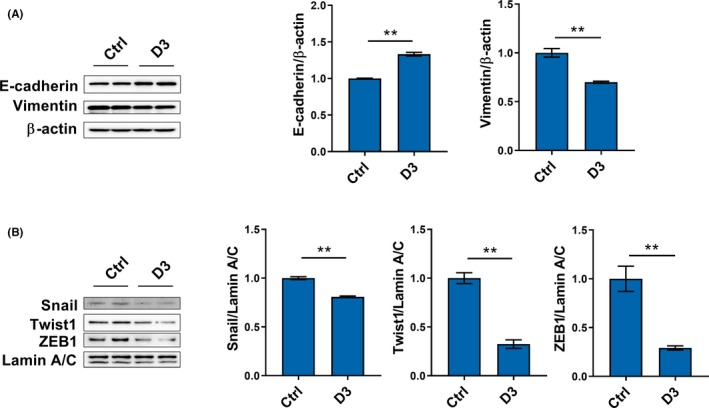
Calcitriol inhibits epithelial‐mesenchymal transition of renal cell carcinoma cells in a transforming growth factor β1‐independent method. CAKI‐2 cells were incubated with calcitriol (200 nmol/L). A, E‐cadherin and vimentin were measured using western blotting. B, Nuclear Snail, Twist1 and ZEB1 were measured using western blotting. All experiments were repeated three times. Data are expressed as means ± SEM (N = 6), **P < .01
3.6. Calcitriol inhibits β‐catenin/TCF‐4 activation by promoting integration of VDR with β‐catenin in TGF‐β1‐unstimulated RCC cells
Effects of calcitriol on β‐catenin protein in ACHN cells were analyzed. As shown in Figure 7A‐D, the levels of β‐catenin in both cytoplasm and nucleus were markedly elevated in calcitriol‐treated ACHN cells. Moreover, the level of β‐catenin in total protein was elevated in calcitriol‐treated ACHN cells (Figure 7E,7). By contrast, the level of p‐β‐catenin in total protein was reduced in calcitriol‐treated ACHN cells (Figure 7G‐H). The effects of calcitriol on interaction among β‐catenin, VDR and TCF‐4 in ACHN cells were then determined using Co‐IP. As shown in Figure 7I, calcitriol elevated VDR level in the immunocomplexes precipitated by anti‐β‐catenin antibody. By contrast, calcitriol reduced TCF‐4 level in the immunocomplexes precipitated by anti‐β‐catenin antibody (Figure 7I). Finally, the effects of calcitriol on several downstream target genes, cyclin D1, axin2 and cef1, were measured. As shown in (Figure 7J, calcitriol downregulated the expression of cyclin D1 and axin2 in ACHN cells, whereas calcitriol had little effect on cef1 expression.
Figure 7.
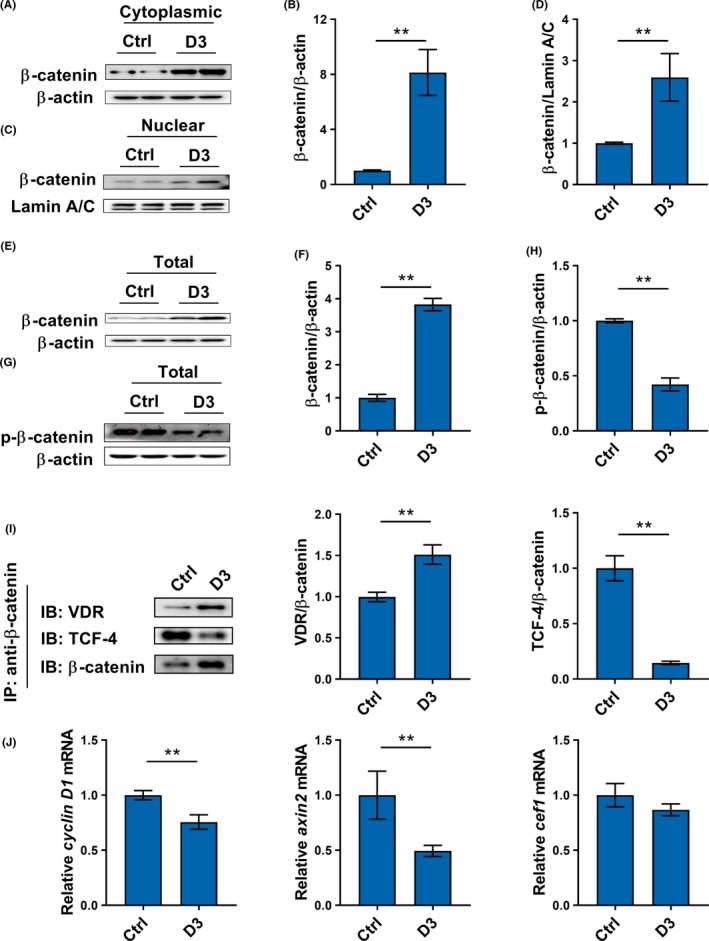
Calcitriol inhibits interaction between β‐catenin and TCF‐4 by promoting integration of vitamin D receptor (VDR) with β‐catenin in renal cell carcinoma cells. A‐D, CAKI‐2 cells were incubated with calcitriol (200 nmol/L). A and B, Level of β‐catenin in cytoplasmic protein was measured using western blotting. C and D, Level of β‐catenin in nuclear protein was measured using western blotting. E‐H, CAKI‐2 cells were incubated with calcitriol (200 nmol/L). E and F, Level of β‐catenin in total protein were measured using Western blotting. G and H, Level of phosphorylated (p)‐β‐catenin in total protein was measured using western blotting. I, ACHN cells were incubated with calcitriol (200 nmol/L). Interaction among β‐catenin, VDR and TCF‐4 was measured using coimmunoprecipitation (Co‐IP). J, ACHN cells were incubated with calcitriol (200 nmol/L). Cyclin D1, axin2 and cef1 were measured using real‐time RT‐PCR. All experiments were repeated three times. Data are expressed as means ± SEM (N = 3‐6), **P < .01
4. DISCUSSION
Several epidemiological investigations have shown that circulating 25(OH)D concentration is inversely associated with the incidence of RCC.36, 37 In the present study, we investigated the effects of calcitriol, an active form of vitamin D3, on invasion and migration of RCC cells using different cell models. Our results showed that calcitriol inhibited migration, as determined by wound healing migration assay and Transwell migration assay, in LPS/TGF‐β1‐stimulated ACHN and 786‐O cells. Moreover, calcitriol inhibited invasion, as determined by Transwell invasion assay, in LPS‐ and TGF‐β1‐stimulated ACHN cells. In addition, we found that calcitriol inhibited migration and invasion of TGF‐β1‐unstimulated ACHN and 786‐O cells. The present study provides evidence for the first time that calcitriol inhibits migration and invasion of RCC cells in TGF‐β1‐dependent and ‐independent methods.
Epithelial‐mesenchymal transition is a crucial process for cancer metastasis, during which cancer cells acquire migration and invasive phenotypes by activating several specific signaling pathways and their downstream transcription factors.5, 38 TGF‐β1/Smad2/3 is one of the crucial pathways that activates cancer‐associated EMT.39 Indeed, the present study showed that E‐cadherin, an epithelial marker, was downregulated in TGF‐β1‐stimulated ACHN and CAKI‐2 cells. By contrast, vimentin, a mesenchymal marker, was upregulated in TGF‐β1‐stimulated ACHN and CAKI‐2 cells. Nuclear Snail and ZEB1,40 two transcription factors for EMT, were elevated in TGF‐β1‐stimulated ACHN cells. A recent report found that calcitriol inhibited TGF‐β1‐induced EMT in colorectal cancer cells.41 This study showed that calcitriol obviously attenuated reduction of E‐cadherin in TGF‐β1‐stimulated ACHN and CAKI‐2 cells. Moreover, calcitriol alleviated TGF‐β1‐induced upregulation of vimentin in ACHN and CAKI‐2 cells. In addition, calcitriol inhibited nuclear Snail and ZEB1 translocation in TGF‐β1‐stimulated ACHN cells, indicating that calcitriol suppresses TGF‐β1‐induced EMT in RCC cells. The mechanism by which calcitriol inhibits TGF‐β1‐induced EMT remains obscure. According to a recent report, calcitriol repressed transcriptional induction of the respiratory complex, limited enhanced mitochondrial membrane potential, restrained increased levels of mitochondrial ATP, and reduced reactive oxygen species in TGF‐β1‐stimulated human bronchial epithelial cells.42 The present study found that LPS‐induced upregulation of TGF‐β1 was suppressed in calcitriol‐pretreated ACHN cells. Moreover, TGF‐β1‐induced Smad2/3 phosphorylation was attenuated in calcitriol‐pretreated ACHN cells. Importantly, an interaction between VDR and Smad3 was observed in calcitriol‐pretreated and TGF‐β1‐stimulated ACHN cells. These results provide a novel mechanistic explanation of how calcitriol inhibits TGF‐β1‐induced EMT in RCC cells.
Accumulating data have shown that cancer‐associated EMT is regulated by the STAT3 pathway.43, 44 A recent study indicated that interleukin (IL)‐6 elicited RCC migration and metastasis by activating STAT3 signaling in RCC cells and orthotopic tumor xenografts.45 A report from our laboratory found an association between low vitamin D status and renal IL‐6/STAT3 hyperactivation in RCC patients.46 In the present study, we analyzed the effects of calcitriol on STAT3 signaling in RCC cells. As expected, phosphorylated STAT3 was obviously elevated in LPS‐stimulated RCC cells. Of interest, calcitriol almost completely suppressed STAT3 phosphorylation in LPS‐stimulated RCC cells. These results suggest that calcitriol might inhibit cancer‐associated EMT, at least partially, by suppressing STAT3 activation in RCC cells.
The present study observed that E‐cadherin, an epithelial marker, was upregulated in calcitriol‐pretreated and TGF‐β1‐unstimulated CAKI‐2 cells. In contrast, vimentin, a mesothelial marker, was upregulated in calcitriol‐pretreated and TGF‐β1‐unstimulated CAKI‐2 cells. Nuclear Snail and Twist1, two transcription factors for regulating EMT, were reduced in calcitriol‐pretreated and TGF‐β1‐unstimulated ACHN cells, indicating that calcitriol inhibits RCC EMT in a TGF‐β1‐independent method. Accumulating data show that the β‐catenin/TCF‐4 complex is another important regulator for cancer‐associated EMT.47, 48 Indeed, β‐catenin functions as a transcription factor together with TCF‐4 to regulate downstream target genes for cancer‐associated EMT.49 Thus, we hypothesize that calcitriol inhibits EMT by blocking β‐catenin/TCF‐4 activation in RCC cells. The following data show that the β‐catenin/TCF‐4 pathway was suppressed in calcitriol‐pretreated RCC cells. First, ZEB1, a direct target gene of β‐catenin/TCF4 and a key inducer of EMT,50 was downregulated in calcitriol‐pretreated ACHN and CAKI‐2 cells. Second, nuclear ZEB1 level was reduced in calcitriol‐pretreated ACHN cells. Third, MMP‐2, MMP‐7, and two downstream target genes of β‐catenin/TCF4 signaling,51, 52 cyclin D1 and axin2, were downregulated in calcitriol‐pretreated ACHN cells. Once it is inactivated, β‐catenin is phosphorylated, subsequently ubiquitinated, and eventually degraded.53 Unexpectedly, this study found that the level of total β‐catenin was elevated and the level of phosphorylated β‐catenin was reduced in calcitriol‐treated ACHN cells. Moreover, the levels of β‐catenin in both cytoplasm and nucleus were elevated, indicating that less β‐catenin is phosphorylated and degraded in calcitriol‐pretreated ACHN cells. To further elucidate the mechanism through which calcitriol inhibits β‐catenin/TCF‐4 signaling in RCC cells, Co‐IP was used to test the physical association among VDR, β‐catenin and TCF‐4. We showed that calcitriol reinforced interaction between VDR and β‐catenin in ACHN cells. By contrast, calcitriol obviously attenuated interaction between β‐catenin and TCF‐4 in ACHN cells. Taken together, these results suggest that calcitriol inhibits β‐catenin/TCF‐4 signaling by reinforcing integration of VDR with β‐catenin in RCC cells.
Two epidemiological reports show that circulating 25(OH)D concentration is positively associated with survival after diagnosis with RCC.54 In contrast, TGF‐β1 is involved in the process of RCC EMT and bone metastasis.55, 56 However, there exists no validated study to prove the link of low vitamin D status with TGF‐β1 and EMT in RCC patients. In the present study, we showed that serum TGF‐β level was elevated and renal Smad3 was activated in RCC patients with low 25(OH)D status. In addition, a mesenchymal marker was accordingly upregulated and E‐cadherin, an epithelial marker, was downregulated in RCC patients with low vitamin D status. Moreover, calcitriol suppressed EMT in LPS‐ and TGF‐β1‐stimulated and unstimulated RCC cells by blocking different signaling pathways. These results suggest an association among low vitamin D status, increased TGF‐β1 and RCC EMT. Thus, vitamin D3 may be used as a potential preventive agent for cancer metastasis especially in RCC patients with low vitamin D status.
In summary, the present study investigated the effects of calcitriol on migration and invasion of different RCC cells. Our results showed that calcitriol inhibited migration and invasion of in LPS/TGF‐β1‐stimulated ACHN and 786‐O cells. Mechanistically, calcitriol suppressed RCC EMT through two different pathways: (i) calcitriol inhibited Smad2/3 phosphorylation by promoting interaction between VDR and Smad3 in TGF‐β1‐stimulated RCC cells; (ii) calcitriol inhibited STAT3 activation in LPS‐stimulated RCC cells; (iii) calcitriol inhibited activation of the β‐catenin/TCF‐4 pathway by promoting integration of VDR with β‐catenin in TGF‐β1‐unstimulated RCC cells. Overall, the present study provides evidence for the role of VDR as an important regulator of EMT in RCC cells. Further in vivo experiment is required to determine whether supplementation with vitamin D3 inhibits RCC metastasis.
CONFLICTS OF INTEREST
Authors declare no conflicts of interest for this article.
Supporting information
ACKNOWLEDGMENTS
The authors would like to thank Dr Mi‐Zhen Xia and Prof. Yuan‐Hua Chen for their excellent technical support. This study was supported by a key project of the National Natural Science Foundation of China (no. 81630084).
Xu S, Zhang Z‐H, Fu L, et al. Calcitriol inhibits migration and invasion of renal cell carcinoma cells by suppressing Smad2/3‐, STAT3‐ and β‐catenin‐mediated epithelial‐mesenchymal transition . Cancer Sci. 2020;111:59–71. 10.1111/cas.14237
Contributor Information
De‐Xin Yu, Email: xudex@126.com.
Guo‐Ping Sun, Email: sungp@ahmu.edu.cn.
REFERENCES
- 1. Siegel RL, Miller KD, Jemal A. Cancer statistics. CA Cancer J Clin. 2018;68:7‐30. [DOI] [PubMed] [Google Scholar]
- 2. Capitanio U, Bensalah K, Bex A, et al. Epidemiology of renal cell carcinoma. Eur Urol. 2019;75:74‐84. [DOI] [PMC free article] [PubMed] [Google Scholar]
- 3. Znaor A, Lortet‐Tieulent J, Laversanne M, Jemal A, Bray F. International variations and trends in renal cell carcinoma incidence and mortality. Eur Urol. 2015;67:519‐530. [DOI] [PubMed] [Google Scholar]
- 4. Novara G, Ficarra V, Antonelli A, et al. Validation of the 2009 TNM version in a large multi‐institutional cohort of patients treated for renal cell carcinoma: are further improvements needed? Eur Urol. 2010;58:588‐595. [DOI] [PubMed] [Google Scholar]
- 5. Pastushenko I, Blanpain C. EMT transition states during tumor progression and metastasis. Trends Cell Biol. 2019;29:212‐226. [DOI] [PubMed] [Google Scholar]
- 6. Chaffer CL, Weinberg RA. A perspective on cancer cell metastasis. Science. 2011;331:1559‐1564. [DOI] [PubMed] [Google Scholar]
- 7. Das V, Bhattacharya S, Chikkaputtaiah C, Hazra S, Pal M. The basics of epithelial–mesenchymal transition (EMT): A study from a structure, dynamics, and functional perspective. J Cell Physiol. 2019;234:14535–14555 [DOI] [PubMed] [Google Scholar]
- 8. Bharti R, Dey G, Mandal M. Cancer development, chemoresistance, epithelial to mesenchymal transition and stem cells: A snapshot of IL‐6 mediated involvement. Cancer Lett. 2016;375:51‐61. [DOI] [PubMed] [Google Scholar]
- 9. Veldurthy V, Wei R, Oz L, Dhawan P, Jeon YH, Christakos S. Vitamin D, calcium homeostasis and aging. Bone Res. 2016;4:16041. [DOI] [PMC free article] [PubMed] [Google Scholar]
- 10. Bouillon R, Marcocci C, Carmeliet G, et al. Skeletal and extraskeletal actions of vitamin D: Current evidence and outstanding questions. Endocr Rev. 2019;40:1109‐1151. [DOI] [PMC free article] [PubMed] [Google Scholar]
- 11. Feldman D, Krishnan AV, Swami S, Giovannucci E, Feldman BJ. The role of vitamin D in reducing cancer risk and progression. Nat Rev Cancer. 2014;14:342‐357. [DOI] [PubMed] [Google Scholar]
- 12. Ali A, Cui X, Eyles D. Developmental vitamin D deficiency and autism: Putative pathogenic mechanisms. J Steroid Biochem Mol Biol. 2018;175:108‐118. [DOI] [PubMed] [Google Scholar]
- 13. Welsh J. Vitamin D and breast cancer: past and present. J Steroid Biochem Mol Biol. 2018;177:15‐20. [DOI] [PMC free article] [PubMed] [Google Scholar]
- 14. Mayne PE, Burne THJ. Vitamin D in synaptic plasticity, cognitive function, and neuropsychiatric illness. Trends Neurosci. 2019;42:293‐306. [DOI] [PubMed] [Google Scholar]
- 15. Murdaca G, Tonacci A, Negrini S, et al. Emerging role of vitamin D in autoimmune diseases: an update on evidence and therapeutic implications. Autoimmunity Reviews. 2019;18:102350 [DOI] [PubMed] [Google Scholar]
- 16. Kelly JL, Salles G, Goldman B, et al. Low serum vitamin D levels are associated with inferior survival in follicular lymphoma: a prospective evaluation in SWOG and LYSA studies. J Clin Oncol. 2015;33:1482‐1490. [DOI] [PMC free article] [PubMed] [Google Scholar]
- 17. de Sousa A‐F, De Luca VH, Pessoa EC, et al. Vitamin D deficiency is associated with poor breast cancer prognostic features in postmenopausal women. J Steroid Biochem Mol Biol. 2017;174:284‐289. [DOI] [PubMed] [Google Scholar]
- 18. Mondul AM, Weinstein SJ, Layne TM, Albanes D. Vitamin D and cancer risk and mortality: state of the science, gaps, and challenges. Epidemiol Rev. 2017;39:28‐48. [DOI] [PMC free article] [PubMed] [Google Scholar]
- 19. Maalmi H, Walter V, Jansen L, et al. Relationship of very low serum 25‐hydroxyvitamin D3 levels with long‐term survival in a large cohort of colorectal cancer patients from Germany. Eur J Epidemiol. 2017;32:961‐971. [DOI] [PubMed] [Google Scholar]
- 20. Jones G, Prosser DE, Kaufmann M. Cytochrome P450‐mediated metabolism of vitamin D. J Lipid Res. 2014;55:13‐31. [DOI] [PMC free article] [PubMed] [Google Scholar]
- 21. Christakos S, Dhawan P, Verstuyf A, Verlinden L, Carmeliet G. Vitamin D: metabolism, molecular mechanism of action, and pleiotropic effects. Physiol Rev. 2016;96:365‐408. [DOI] [PMC free article] [PubMed] [Google Scholar]
- 22. Leyssens C, Verlinden L, Verstuyf A. Antineoplastic effects of 1,25(OH)2D3 and its analogs in breast, prostate and colorectal cancer. Endocr Relat Cancer. 2013;20:R31‐47. [DOI] [PubMed] [Google Scholar]
- 23. Upadhyay SK, Verone A, Shoemaker S, et al. 1,25‐Dihydroxyvitamin D3 (1,25(OH)2D3) signaling capacity and the epithelial‐mesenchymal transition in non‐small cell lung cancer (NSCLC): implications for use of 1,25(OH)2D3 in NSCLC treatment. Cancers. 2013;5:1504‐1521. [DOI] [PMC free article] [PubMed] [Google Scholar]
- 24. Chiang KC, Yeh CN, Hsu JT, et al. The vitamin D analog, MART‐10, represses metastasis potential via downregulation of epithelial‐mesenchymal transition in pancreatic cancer cells. Cancer Lett. 2014;354:235‐244. [DOI] [PubMed] [Google Scholar]
- 25. Chiang KC, Kuo SF, Chen CH, et al. MART‐10, the vitamin D analog, is a potent drug to inhibit anaplastic thyroid cancer cell metastatic potential. Cancer Lett. 2015;369:76‐85. [DOI] [PubMed] [Google Scholar]
- 26. Chiang KC, Yeh TS, Chen SC, et al. The vitamin D analog, MART‐10, attenuates triple negative breast cancer cells metastatic potential. Int J Mol Sci. 2016;17:606. [DOI] [PMC free article] [PubMed] [Google Scholar]
- 27. Hou YF, Gao SH, Wang P, et al. 1α,25(OH)₂D₃ suppresses the migration of ovarian cancer SKOV‐3 cells through the inhibition of epithelial‐mesenchymal transition. Int J Mol Sci. 2016;17:1285. [DOI] [PMC free article] [PubMed] [Google Scholar]
- 28. Blomberg Jensen M, Andersen CB, Nielsen JE, et al. Expression of the vitamin D receptor, 25‐hydroxylases, 1α‐hydroxylase and 24‐hydroxylase in the human kidney and renal clear cell cancer. J Steroid Biochem Mol Biol. 2010;121:376‐382. [DOI] [PubMed] [Google Scholar]
- 29. Hakimi AA, Chevinsky M, Hsieh JJ, Sander C, Sinha R. MP23‐11 genomic comparison of renal cell carcinoma cell lines to human tumors. J. Urol. 2014;191:e247. [Google Scholar]
- 30. Struckmann K, Mertz KD, Steu S, et al. pVHL co‐ordinately regulates CXCR4/CXCL12 and MMP2/MMP9 expression in human clear‐cell renal cell carcinoma. J Pathol. 2008;214:464‐471. [DOI] [PubMed] [Google Scholar]
- 31. Brodaczewska KK, Szczylik C, Fiedorowicz M, et al. Choosing the right cell line for renal cell cancer research. Mol. Cancer. 2016;15:83. [DOI] [PMC free article] [PubMed] [Google Scholar]
- 32. Brodziak A, Sobczuk P, Bartnik E, et al. Drug resistance in papillary RCC: from putative mechanisms to clinical practicalities. Nat. Rev. Urol. 2019;16(11):655–673. [DOI] [PubMed] [Google Scholar]
- 33. Chen YH, Yu Z, Fu L, et al. Vitamin D3 inhibits lipopolysaccharide‐induced placental inflammation through reinforcing interaction between vitamin D receptor and nuclear factor kappa B p65 subunit. Sci Rep. 2015;5:10871. [DOI] [PMC free article] [PubMed] [Google Scholar]
- 34. Zou S, Yang J, Guo J, et al. RAD18 promotes the migration and invasion of esophageal squamous cell cancer via the JNK‐MMPs pathway. Cancer Lett. 2018;417:65‐74. [DOI] [PubMed] [Google Scholar]
- 35. Wang Y, Fu L, Cui M, et al. Amino acid transporter SLC38A3 promotes metastasis of non‐small cell lung cancer cells by activating PDK1. Cancer Lett. 2017;393:8‐15. [DOI] [PubMed] [Google Scholar]
- 36. Joh HK, Giovannucci EL, Bertrand KA, Lim S, Cho E. Predicted plasma 25‐hydroxyvitamin D and risk of renal cell cancer. J Natl Cancer Inst. 2013;105:726‐732. [DOI] [PMC free article] [PubMed] [Google Scholar]
- 37. Muller DC, Fanidi A, Midttun O, et al. Circulating 25‐hydroxyvitamin D3 in relation to renal cell carcinoma incidence and survival in the EPIC cohort. Am J Epidemiol. 2014;180:810‐820. [DOI] [PubMed] [Google Scholar]
- 38. Mittal V. Epithelial mesenchymal transition in tumor metastasis. Annu Rev Pathol. 2018;13:395‐412. [DOI] [PubMed] [Google Scholar]
- 39. Dongre A, Weinberg RA. New insights into the mechanisms of epithelial‐mesenchymal transition and implications for cancer. Nat Rev Mol Cell Biol. 2019;20:69‐84. [DOI] [PubMed] [Google Scholar]
- 40. Caramel J, Ligier M, Puisieux A. Pleiotropic roles for ZEB1 in cancer. Cancer Res. 2018;78:30‐35. [DOI] [PubMed] [Google Scholar]
- 41. Chen S, Zhu J, Zuo S, et al. 1,25(OH)2D3 attenuates TGF‐β1/β2‐induced increased migration and invasion via inhibiting epithelial‐mesenchymal transition in colon cancer cells. Biochem Biophys Res Commun. 2015;468:130‐135. [DOI] [PubMed] [Google Scholar]
- 42. Ricca C, Aillon A, Viano M, Bergandi L, Aldieri E, Silvagno F. Vitamin D inhibits the epithelial‐mesenchymal transition by a negative feedback regulation of TGF‐β activity. J Steroid Biochem Mol Biol. 2019;187:97‐105. [DOI] [PubMed] [Google Scholar]
- 43. Yuan J, Zhang F, Niu R. Multiple regulation pathways and pivotal biological functions of STAT3 in cancer. Sci. Rep. 2015;5:17663. [DOI] [PMC free article] [PubMed] [Google Scholar]
- 44. Wendt MK, Balanis N, Carlin CR, Schiemann WP. STAT3 and epithelial‐mesenchymal transitions in carcinomas. JAKSTAT. 2014;3:e28975. [DOI] [PMC free article] [PubMed] [Google Scholar]
- 45. Wang Y, Fu D, Chen Y, et al. G3BP1 promotes tumor progression and metastasis through IL‐6/G3BP1/STAT3 signaling axis in renal cell carcinomas. Cell Death Dis. 2018;9:501. [DOI] [PMC free article] [PubMed] [Google Scholar]
- 46. Song J, Xu S, Zhang ZH, et al. The correlation between low vitamin D status and renal interleukin‐6/STAT3 hyper‐activation in patients with clear cell renal cell carcinoma. Steroids. 2019;150:108445. [DOI] [PubMed] [Google Scholar]
- 47. Chen L, Mai W, Chen M, et al. Arenobufagin inhibits prostate cancer epithelial‐mesenchymal transition and metastasis by down‐regulating β‐catenin. Pharmacol Res. 2017;123:130‐142. [DOI] [PubMed] [Google Scholar]
- 48. Yang S, Liu Y, Li MY, et al. FOXP3 promotes tumor growth and metastasis by activating Wnt/β‐catenin signaling pathway and EMT in non‐small cell lung cancer. Mol Cancer. 2017;16:124. [DOI] [PMC free article] [PubMed] [Google Scholar]
- 49. Gilles C, Polette M, Mestdagt M, et al. Transactivation of vimentin by beta‐catenin in human breast cancer cells. Cancer Res. 2003;63:2658‐2664. [PubMed] [Google Scholar]
- 50. Sánchez‐Tilló E, de Barrios O, Siles L, Cuatrecasas M, Castells A, Postigo A. β‐catenin/TCF4 complex induces the epithelial‐to‐mesenchymal transition (EMT)‐activator ZEB1 to regulate tumor invasiveness. Proc Natl Acad Sci USA. 2011;108:19204‐19209. [DOI] [PMC free article] [PubMed] [Google Scholar]
- 51. Schwartz DR, Wu R, Kardia SL, et al. Novel candidate targets of beta‐catenin/T‐cell factor signaling identified by gene expression profiling of ovarian endometrioid adenocarcinomas. Cancer Res. 2003;63:2913‐2922. [PubMed] [Google Scholar]
- 52. Marchenko ND, Marchenko GN, Weinreb RN et al. Beta‐catenin regulates the gene of MMP‐26, a novel metalloproteinase expressed both in carcinomas and normal epithelial cells. Int J Biochem Cell Biol. 2004;36:942‐956. [DOI] [PubMed] [Google Scholar]
- 53. Aberle H, Bauer A, Stappert J, Kispert A, Kemler R. beta‐catenin is a target for the ubiquitin‐proteasome pathway. EMBO J. 1997;16:3797‐3804. [DOI] [PMC free article] [PubMed] [Google Scholar]
- 54. Muller DC, Scelo G, Zaridze D, et al. Circulating 25‐hydroxyvitamin D3 and survival after diagnosis with kidney cancer. Cancer Epidemiol Biomarkers Prev. 2015;24:1277‐1281. [DOI] [PMC free article] [PubMed] [Google Scholar]
- 55. Kominsky SL, Doucet M, Brady K, Weber KL. TGF‐beta promotes the establishment of renal cell carcinoma bone metastasis. J. Bone Miner Res. 2007;22:37‐44. [DOI] [PubMed] [Google Scholar]
- 56. Feldkoren B, Hutchinson R, Rapoport Y, Mahajan A, Margulis V. Integrin signaling potentiates transforming growth factor‐beta 1 (TGF‐β1) dependent down‐regulation of E‐Cadherin expression – Important implications for epithelial to mesenchymal transition (EMT) in renal cell carcinoma. Exp. Cell Res. 2017;355:57‐66. [DOI] [PubMed] [Google Scholar]
Associated Data
This section collects any data citations, data availability statements, or supplementary materials included in this article.
Supplementary Materials


