


Executive Summary
Preeclampsia (PE) is a multisystem disorder that typically affects 2%−5% of pregnant women and is one of the leading causes of maternal and perinatal morbidity and mortality, especially when the condition is of early onset. Globally, 76,000 women and 500,000 babies die each year from this disorder. Furthermore, women in low-resource countries are at a higher risk of developing PE compared to those in high-resource countries.
Although a complete understanding of the pathogenesis of PE remains unclear, the current theory suggests a 2-stage process. The first stage is caused by shallow invasion of the trophoblast resulting in inadequate remodelling of the spiral arteries. This is presumed to lead to the second stage, which involves the maternal response to endothelial dysfunction and imbalance between angiogenic and anti-angiogenic factors, resulting in the clinical features of the disorder.
Accurate prediction and uniform prevention continue to elude us. The quest to effectively predict PE in the first trimester of pregnancy is fuelled by the desire to identify women who are at high risk of developing PE, so that necessary measures can be initiated early enough to improve placentation and thus prevent or at least reduce the frequency of its occurrence. Also, identification of an ‘at risk’ group will allow tailored antenatal surveillance to anticipate and recognize the onset of the clinical syndrome and manage it promptly.
PE has been previously defined as the onset of hypertension accompanied by significant proteinuria after 20 weeks’ gestation. Recently, the definition of PE has been broadened. Now the internationally agreed definition of PE is the one proposed by the International Society for the Study of Hypertension in Pregnancy (ISSHP).
According to the ISSHP, PE is defined as systolic blood pressure at ≥140 mmHg and/or the diastolic blood pressure at ≥90 mmHg on at least two occasions measured four hours apart in previously normotensive women and is accompanied by ≥1 of the following new-onset conditions at or after 20 weeks’ gestation:
proteinuria (i.e., ≥30 mg/mol protein:creatinine ratio; ≥300 mg/24hr; or ≥2+ dipstick);
evidence of other maternal organ dysfunction, including: acute kidney injury (creatinine ≥90umol/L; 1 mg/dL), liver involvement (elevated transaminases, e.g., alanine aminotransferase or aspartate aminotransferase >40 IU/L) with or without right upper quadrant or epigastric abdominal pain, neurological complications (e.g., eclampsia, altered mental status, blindness, stroke, clonus, severe headaches, and persistent visual scotomata), or hematological complications (thrombocytopenia–platelet count <150 000/μL, disseminated intravascular coagulation, hemolysis); or
uteroplacental dysfunction (such as fetal growth restriction, abnormal umbilical artery Doppler wave form analysis, or stillbirth).
It is well established that a series of maternal risk factors are associated with the development of PE: advanced maternal age, nulliparity, previous history of PE, short and long inter-pregnancy intervals, use assisted reproductive technologies, family history of PE, obesity, Afro-Caribbean and South Asian racial origin, co-morbid medical conditions including hyperglycemia in pregnancy, pre-existing chronic hypertension, renal disease, autoimmune diseases, such as systemic lupus erythematosus and anti-phospholipid syndrome. These risk factors have been described by various professional organisations for the identification of women at risk of PE, however, this approach to screening is inadequate for effective prediction of PE.
PE can be sub-classified into:
Early-onset PE (with delivery at <34+0 week’s gestation);
Preterm PE (with delivery at <37+0 week’s gestation);
Late-onset PE (with delivery at ≥34+0 week’s gestation);
Term PE (with delivery at ≥37+0 week’s gestation).
These sub-classifications are not mutually exclusive. Early-onset PE is associated with a much higher risk of short- and long-term maternal and perinatal morbidity and mortality.
Obstetricians managing women with preterm PE are faced with the challenge of balancing the need for achieving fetal maturation in utero with the risks to the mother and fetus from continuing the pregnancy longer. These risks include progression to eclampsia, development of placental abruption and HELLP syndrome. On the other hand preterm delivery is associated with higher infant mortality rates and increased morbidity resulting from small-for-gestational age (SGA), thrombocytopenia, bronchopulmonary dysplasia, cerebral palsy and an increased risk of various chronic diseases in adult life, particularly type 2 diabetes, cardiovascular disease and obesity. Women who have experienced PE may also face additional health problems in later life, as the condition is associated with an increased risk of death from future cardiovascular disease, hypertension, stroke, renal impairment, metabolic syndrome and diabetes. Life expectancy of women who developed preterm PE is reduced on average by 10 years.
The International Federation of Gynecology and Obstetrics (FIGO) brought together international experts to discuss and evaluate current knowledge on the topic and develop a document to frame the issues and suggest key actions to address the health burden posed by PE.
FIGO’s objective as outlined in this document is 1) To raise awareness of the links between PE and poor maternal and perinatal outcomes as well as to the future health risks to mother and offspring and demand a clearly defined global health agenda to tackle this issue, and 2) To create a consensus document which provides guidance for the first trimester screening and prevention of preterm PE, and to disseminate and encourage its use.
Based on high-quality evidence, the document outlines current global standards for the first-trimester screening and prevention of preterm PE, which is in line with FIGO good clinical practice advice on first trimester screening and prevention of pre-eclampsia in singleton pregnancy.1
It provides both the best and the most pragmatic recommendations according to the level of acceptability, feasibility and ease of implementation that have the potential to produce the most significant impact in different resource settings. Suggestions are provided for a variety of different regional and resource settings based on their financial, human and infrastructure resources; as well as, for research priorities to bridge the current knowledge and evidence gap.
To deal with the issue of PE the FIGO recommends the following:
Public health focus: There should be greater international attention on PE and to the links between maternal health and non-communicable diseases (NCDs) on the Sustainable Developmental Goals agenda. Public health measures to increase awareness, access, affordability and acceptance of preconception counselling, and prenatal and postnatal services for women in the reproductive age should be prioritized. Greater efforts are required to raise awareness of the benefits of early prenatal visits targeted at reproductive-aged women, particularly in the developing countries.
Universal screening: All pregnant women should be screened for preterm PE during early pregnancy by the first-trimester combined test with maternal risk factors and biomarkers as a one-step procedure. The risk calculator is available free of charge at https://fetalmedicine.org/research/assess/preeclampsia. FIGO encourages all countries and its member associations to adopt and promote strategies to ensure this. The best combined test is one that includes maternal risk factors, measurements of mean arterial pressure (MAP), serum placental growth factor (PLGF) and uterine artery pulsatility index (UTPI). Where it is not possible to measure the PLGF and / or UTPI, the baseline screening test should be a combination of maternal risk factors with MAP, and not maternal risk factors alone. If maternal serum pregnancy-associated plasma protein A (PAPP-A) is measured for routine first-trimester screening for fetal aneuploidies, the result can be included for PE risk assessment. Variations to the full combined test would lead to a reduction in the performance screening. A woman is considered high risk when the risk is 1 in 100 based on the first-trimester combined test with maternal risk factors, MAP, PLGF and UTPI.
Contingent screening: Where resources are limited, routine screening for preterm PE by maternal factors and MAP in all pregnancies and reserving measurements of PLGF and UTPI for a subgroup of the population, selected on the basis of the risk derived from screening by maternal factors and MAP, can be considered.
Prophylactic measures: Following first-trimester screening for preterm PE, women identified at high risk should receive aspirin prophylaxis commencing at 11–14+6 weeks of gestation at a dose of ~150mg to be taken every night until 36 weeks of gestation, when delivery occurs, or when PE is diagnosed. Low-dose aspirin should not be prescribed to all pregnant women. In women with low calcium intake (<800mg/day), either calcium replacement (≤1g elemental calcium/day) or calcium supplementation (1.5g-2g elemental calcium/day) may reduce the burden of both early- and late-onset PE.
Keywords: First-trimester, Prediction, Prevention, Non-communicable diseases, Preeclampsia, Mean arterial pressure, Placental growth factor, Uterine artery pulsatility index
Synopsis:
Women identified by first-trimester screening as being at high-risk of preterm preeclampsia, aspirin 150 mg/night should be commenced from 11–14 until 36 weeks of gestation.
The Target Audience of the FIGO Initiative on Preeclampsia
This document is directed at multiple stakeholders with the intention of bringing attention to PE, which is a preventable but common and potentially life-threatening complication of pregnancy with grave consequences for both the mothers and the offspring. This document proposes to create a global framework for action for early screening and prevention of PE.
The intended target audience includes:
Healthcare Providers: All those who are qualified to care for pregnant women and the newborns but, in particular, those responsible for screening for high-risk women (obstetricians, maternal-fetal medicine specialists, internists, pediatricians, neonatologists, general practitioners/family physicians, midwives, nurses, advance practice clinicians, nutritionists, pharmacists, community health workers, laboratory technicians, etc.)
Healthcare delivery organizations and providers: governments, federal and state legislators; healthcare management organizations (HMOs); health insurance organizations; international development agencies; and non-governmental organizations.
Professional organizations: international, regional and national professional organizations of obstetricians and gynecologists; internists; family practitioners; pediatricians; neonatologists; and world-wide national organizations dedicated to the care of pregnant women with PE.
Quality Assessment of Evidence and Grading of Strength of Recommendations
In assessing the quality of evidence and grading of strength of recommendations, the document follows the terminology proposed by the Grading of Recommendations, Assessment, Development and Evaluation (GRADE) working group (http://www.gradeworkinggroup.org/). This system uses consistent language and graphical descriptions for the strength and quality of the recommendations and the evidence on which they are based. Strong recommendations are numbered as 1, and conditional (weak) recommendations are numbered 2. For the quality of evidence, cross-filled circles are used: ⊕OOO denotes very low-quality evidence; ⊕⊕OO low quality; ⊕⊕⊕O moderate quality; and ⊕⊕⊕⊕ high-quality evidence (Tables 1 and 2).
Table 1:
| Implications | Strong recommendation phrased as “we recommend” |
Conditional (weak) recommendation
phrased as “we suggest” |
|---|---|---|
| For patients | Nearly all patients in this situation would accept the recommended course of action. Formal decision aids are not needed to help patients make decisions consistent with their values and preferences. | Most patients in this situation would accept the suggested course of action. |
| For clinicians | According to the guidelines, performance of the recommended action could be used as a quality criterion or performance indicator, unless the patient refuses. | Decision aids may help patients make a management decision consistent with their values and preferences. |
| For policy makers | The recommendation can be adapted as policy in most situations | Stakeholders need to discuss the suggestion. |
Reprinted with permission of the American Thoracic Society. ©2019 American Thoracic Society. Schunemann HJ, Jaeschke R, Cook DJ, et al. An official ATS statement: grading the quality of evidence and strength of recommendations in ATS guidelines and recommendations. Am J Respir Crit Care Med 2006; 174:605–614.
Both caregivers and care recipients need to be involved in the decision-making process before adopting recommendations.
Table 2:
Interpretation of quality of evidence levels according to GRADEa
| Level of evidence | Definition |
|---|---|
| High ⊕⊕⊕⊕ |
We are very confident that the true effect corresponds to that of the estimated effect. |
| Moderate ⊕⊕⊕O |
We are moderately confident in the estimated effect. The true effect is generally close to the estimated effect, but it may be slightly different. |
| Low ⊕⊕OO |
Our confidence in the estimated effect is limited. The true effect could be substantially different from the estimated effect. |
| Very low ⊕OOO |
We have very little confidence in the estimated effect. The true effect is likely to be substantially different from the estimated effect. |
Adapted with permission from Balshem et al. GRADE guidelines: 3. Rating the quality of evidence. J Clin Epidemiol 2011; 64:401–6.
Preeclampsia – Background, Definition, Risk Factors, Maternal and Perinatal Morbidity and Mortality Associated with Preeclampsia
Introduction
Preeclampsia (PE) is a multisystem disorder of pregnancy previously defined by the onset of hypertension accompanied by significant proteinuria after 20 weeks of gestation. Recently, the definition of PE has been broadened.2–5 PE typically affects 2%−5% of pregnant women and is one of the leading causes of maternal and perinatal morbidity and mortality, especially when the condition is of early-onset.6,7 Globally, 76,000 women and 500,000 babies die each year from this disorder.8 Furthermore, women in low-resource countries are at a higher risk of developing PE compared to those in high-resource countries.
PE can be sub-classified into
Early-onset PE (with delivery at <34+0 weeks of gestation);
Preterm PE (with delivery at <37+0 weeks of gestation);
Late-onset PE (with delivery at ≥34+0 weeks of gestation);
Term PE (with delivery at ≥37+0 weeks of gestation).
These sub-classifications are not mutually exclusive. Early-onset PE is associated with a substantial risk of both short- and long-term maternal and perinatal morbidity and mortality.9,10
Although a complete understanding of the pathogenesis remains unclear, the current theory suggests a 2-stage process; the first stage is caused by shallow invasion of the trophoblast resulting in inadequate remodelling of the spiral arteries.11–13 This is presumed to lead to the second stage, which involves the maternal response to endothelial dysfunction and imbalance between angiogenic and anti-angiogenic factors, resulting in the clinical features of the disorder.11–13 In late-onset disease, placentation is usually normal; however, feto-placental demands exceed supply, resulting in a placental response that triggers the clinical phenotype. Whilst the placenta certainly plays an essential role in the development of PE, there is a growing body of evidence that maternal cardiovascular system may have significant contribution to the disorder.14
While knowledge of the complex pathophysiology of PE is improving; accurate prediction and uniform prevention continue to elude us. The quest to effectively predict PE in the first trimester of pregnancy is fuelled by the desire to identify women who are at high risk of developing PE, so that necessary measures can be initiated early to improve placentation and reduce the prevalence of the disease. Also, identification of an ‘at risk’ group will facilitate tailored prenatal surveillance to anticipate and recognize the onset of the clinical syndrome and manage it promptly.
Definition of preeclampsia
PE is broadly defined as development of hypertension and proteinuria in a previously normotensive woman. The difficulty in interpreting epidemiological studies of PE is due to the wide variation in the definitions of the disease. There are several definitions for the diagnosis of PE, which have been reported in published literature and proposed by various professional bodies. Consequently, this has resulted in a number of different guidelines produced by professional bodies worldwide for the diagnosis and management of PE.2,15–17 However, an internationally agreed definition of PE is that of the International Society for the Study of Hypertension in Pregnancy (ISSHP)5 (Box 1), which is endorsed by FIGO.
Box 1. Diagnosis of hypertensive disorders in pregnancy according to ISSHPa.
Gestational hypertension
Persistent de novo hypertension (sBP ≥140 mm Hg and/or dBP ≥90 mm Hg after 20 weeks of gestation in the absence of features of PE
PE de novo
- Gestational hypertension accompanied by ≥1 of the following new-onset conditions at or after 20 weeks of gestation:
- Proteinuria: 24-hour urine protein ≥300 mg/day or spot urine protein/creatinine ratio ≥0.30 mg/day or urine dipstick testing ≥1+
- Other maternal organ dysfunction:
- Acute kidney injury (creatinine ≥90 μmol/L; 1 mg/dL)
- Liver involvement (elevated alanine aminotransferase or aspartate aminotransferase >40 IU/L) with or without right upper quadrant or epigastric pain)
- Neurological complications (including eclampsia, altered mental status, blindness, stroke, or more commonly hyperreflexia when accompanied by clonus, severe headaches, and persistent visual scotomata)
- Hematological complications (thrombocytopenia-platelet count <150,000/μL, disseminated intravascular coagulation, hemolysis)
- Uteroplacental dysfunction (fetal growth restriction, abnormal umbilical artery Doppler waveform or stillbirth)
Superimposed PE on chronic hypertension
Women with chronic essential hypertension develop any of the above maternal organ dysfunctions consistent with PE
Increase in blood pressure per se is not sufficient to diagnose superimposed PE
In the absence of pre-existing proteinuria, new-onset proteinuria in the setting of a rise in blood pressure is sufficient to diagnose superimposed PE
In women with proteinuric renal disease, an increase in proteinuria during pregnancy is not sufficient per se to diagnose superimposed PE
a Source: Brown et al.5
Gestational hypertension is defined as systolic blood pressure (sBP) at ≥140 mm Hg and/or diastolic blood pressure (dBP) at ≥90 mm Hg on at least two occasions measured four hours apart developing after 20 weeks of gestation in previously normotensive women.
PE is defined as gestational hypertension accompanied by ≥1 of the following new-onset conditions at or after 20 weeks of gestation:
proteinuria (i.e., ≥30 mg/mol protein:creatinine ratio; ≥300 mg/24hr; or ≥2+ dipstick);
other maternal organ dysfunction, including: acute kidney injury (creatinine ≥90 μmol/L; 1 mg/dL), liver involvement (elevated transaminases, e.g., alanine aminotransferase or aspartate aminotransferase >40 IU/L) with or without right upper quadrant or epigastric abdominal pain, neurological complications (e.g., eclampsia, altered mental status, blindness, stroke, clonus, severe headaches, and persistent visual scotomata), or hematological complications (thrombocytopenia-platelet count <150,000/μL, disseminated intravascular coagulation, hemolysis); or
uteroplacental dysfunction (such as fetal growth restriction, abnormal umbilical artery [UA] Doppler wave form analysis, or stillbirth).
Risk factors
It is well established that a number of maternal risk factors are associated with the development of PE. These risk factors have been described by various professional organizations for the identification of women at risk of PE.3,4,16,18,19
Maternal age
Advanced maternal age, defined as age ≥35 years at the time of delivery, is associated with 1.2- to 3-fold increased risk of developing PE.19–22 Predictive probability of PE increases when maternal age is >35 years and the probability further increases rapidly when the maternal age is >40 years.19 One study has evaluated the maternal age-associated risk according to the severity of PE. Using multivariate logistic regression analysis, adjusting for confounders, the risk for late-onset PE has been shown to increase by 4% with every one-year increase in maternal age above 32 years.23 However, maternal age is not associated with increased risk of early-onset PE.23
Parity
In nulliparous women, the increased risk of developing PE has been widely reported. One systematic review reported that the risk of PE is increased 3-fold in nulliparous women.24 Another systematic review that included 26 studies reported that this increased risk for PE persists even after adjusting for other risk factors, such as maternal age, race and body mass index (BMI) and the summary adjusted odds ratio (OR) was 2.71 (95% confidence interval [CI]: 1.96–3.74).25 Parous women without prior history of PE have reduced risk of PE; however, this protective effect is lost when the conception partner is different.26
Previous history of PE
A large population-based study, which included 763,795 nulliparous women with first delivery between 1987 and 2004 showed that the risk of PE was 4.1% in the first pregnancy and 1.7% in later pregnancies overall. However, the risk was 14.7% in the second pregnancy for women with history of PE in their first pregnancy and 31.9% for women who had PE in the previous two pregnancies. The risk of PE for parous women without a history of PE was 1.1%. These observations suggest that the risk of PE is greater in nulliparous than parous women without a prior history of PE. Among parous women, the risk of PE in subsequent pregnancies depends on a prior history of PE.27 This relative risk for subsequent PE ranges from 7–10 times higher in a second pregnancy.28–30
A study focusing on PE according to severity of disease has shown that a history of PE doubled the risk of developing early-onset PE (<32 weeks) in a subsequent pregnancy as opposed to late-onset PE.31 Other studies have reported a 5% to 17% recurrence risk of early-onset PE (<34 weeks) in the index pregnancy for those with a prior history of early-onset PE.32,33 A systematic review of 11 studies including 2,377 women has shown that the pooled recurrence risk for early-onset PE is approximately 8% in women who require delivery at <34 weeks following the development of early-onset PE in the first pregnancy.33
Pregnancy interval
Both short and long inter-pregnancy intervals are associated with an increased risk of PE.34–36 A recent large multicentric retrospective study, which included 894,479 women, reported that inter-pregnancy intervals of <12 months or >72 months are associated with higher risk of PE development compared to inter-pregnancy intervals of 12–23 months.37 It has been observed that the longer the interval, the higher is the risk of developing PE. The reasons for the association between short inter-pregnancy interval and PE are unclear, but several hypotheses have been proposed, including factors related to socioeconomic status, postpartum stress, malnutrition, and inadequate access to health care services. Meanwhile, the increased PE risk in women with long inter-pregnancy intervals might be attributed to advanced maternal age, infertility, and underlying maternal medical conditions.38,39
Assisted reproduction
Several studies have reported that the use of assisted reproductive technologies (ART) doubles the risk of PE.40–43 In a cohort study of more than 1 million pregnant women, the risk of having PE was increased in women exposed to hyper-estrogenic ovarian stimulation medications regardless of ART type, as compared to those with spontaneous conception (ORs ranging from 1.32 to 1.83).44 In contrast, the use of non-hyper-estrogenic ovarian stimulation drugs was not associated with an increased risk of PE.44 High estrogen levels during implantation may lead to impaired placentation and reduced uteroplacental circulation as well as decreased number of uterine spiral arteries with vascular invasion.44–46 Women conceiving by intrauterine insemination, in particular by donor sperm, are at a greater risk of developing PE.47–51 Those who have undergone donor ovum in vitro fertilization (IVF) appear to have a higher risk of PE than those who have had autologous ovum IVF.52 Evidence from IVF pregnancies with ovum donation suggests that there are altered extravillous trophoblast and immunological changes in decidua basalis, which may impede the modification of the spiral arteries.53
Family history of PE
Although most cases of PE are sporadic, a familial susceptibility to PE has been documented. Daughters or sisters of women with PE are 3–4 times more likely to develop the condition than women without a family history.54–56 The mode of inheritance seems to be complex, including numerous variants, which individually have small effects, but collectively contribute to an individual’s susceptibility to the disorder. Genome-wide association studies (GWAS) using sib-pair analysis have identified plausible, yet conflicting, positional candidate maternal susceptibility genes for PE. GWAS of PE-affected families have demonstrated significant linkage to chromosomes 2p, 2q, 4p, 7p, 9p, 10q, 11q and 22q.57 However, no other study has reproduced these significant or suggestive loci.
Obesity
There is substantial evidence to show that obesity (BMI ≥30 Kg/m2) confers a 2- to 4-fold higher risk for PE.58–64 The exact mechanisms linking overweight/obesity and PE remain unclear. Obesity is known as a state of chronic, low-grade inflammation, also called “meta-inflammation”.65,66 Low-grade inflammation can induce endothelial dysfunction and placental ischemia by immune-mediated mechanisms, which in turn lead to production of inflammatory mediators resulting in an exaggerated maternal inflammatory response and development of PE.67
Race and ethnicity
There is extensive evidence in the literature demonstrating the association between race and ethnicity and PE. Large population studies suggest that the risk of PE in Afro-Caribbean women is increased by 20%−50%.68–72 The risk of PE is also higher in women of South Asian origin than in those of non-Hispanic white women (adjusted OR 1.3; 95% CI: 1.2–1.4).73 Increased risk of PE reflects the metabolic profiles of non-pregnant women associated with an increased susceptibility to cardiovascular disease.74–76 Both Afro-Caribbean and South Asian women are more susceptible to developing chronic hypertension, diabetes mellitus and cardiovascular disease. In a large prospective observational cohort study of more than 79,000 singleton pregnancies recruited in London, UK, the risk of PE was significantly higher in women of Afro-Caribbean and South Asian racial origin, compared to Caucasian women.77 The increased risk remains significant even after adjusting for other confounding risk factors for PE.
Co-morbidities
There are certain medical conditions that predispose women to developing PE. These include hyperglycemia in pregnancy (pre pregnancy type 1 and type 2 diabetes mellitus; overt diabetes in pregnancy and gestational diabetes requiring insulin treatment), pre-existing chronic hypertension, renal disease, and autoimmune diseases such as systemic lupus erythematosus (SLE) and anti-phospholipid syndrome (APS). Recently, a systematic review and meta-analysis evaluated clinical risk factors at ≤16 weeks of gestation in 25,356,655 pregnant women in 27 countries.78 Patients with a history of chronic hypertension have a higher risk of developing PE than those without this condition (relative risk [RR] 5.4; 95% CI: 4.0–6.5). Pre-existing diabetes mellitus, APS, SLE and chronic kidney disease are also associated with an increased risk of developing PE (RR 3.7; 95% CI: 3.1–4.3, RR 2.8; 95% CI: 1.8–4.3, RR 2.5; 95% CI: 1.0–6.3, and RR 1.8; 95% CI: 1.5–2.1, respectively).78
Interestingly, pre-existing diabetes mellitus and PE share many risk factors including advanced maternal age, nulliparity, pre-pregnancy obesity, non-white racial propensity and multiple pregnancy.79,80 Several common pathological pathways are present in both conditions. These include endothelial dysfunction (e.g. lower flow-mediated dilatation),81,82 imbalance of angiogenic factors,81,83 increased oxidative stress (e.g. low total antioxidant status, high free radicals),84 and dyslipidemia (e.g. increased triglycerides).85,86 PE is a risk factor for future type 2 diabetes.87–90 This relationship is still evident even when women who have PE with gestational diabetes are excluded. Both conditions are associated with insulin resistance91–97 and women with PE have an increased risk of metabolic syndrome after delivery.98–100
Maternal and perinatal morbidity and mortality associated with preeclampsia
Maternal morbidity and mortality
The most common cause of death in women with PE is intracranial hemorrhage.101 Other serious complications include placental abruption, HELLP (hemolysis, elevated liver enzyme, low platelet) syndrome, acute pulmonary edema, respiratory distress syndrome and acute renal failure.102
Chesley et al.103 were the first to propose the concept that pregnancy is a stress test, based on the observation that pregnant women who have never developed PE have a lower risk of cardiovascular disease than the general female population; whereas, women with eclampsia have a similar risk of cardiovascular disease in later life as appropriately matched women with unknown pregnancy history. Therefore, while PE may not directly cause cardiovascular disease in later life, pregnancy itself acts as a challenge test to reveal underlying metabolic risk factors for atherosclerosis and cardiovascular disease.103 Evidence in support of this hypothesis is that PE and cardiovascular disease share many risks factors, including obesity, insulin resistance, diabetes mellitus, underlying hypertension, and dyslipidemia.103–106 A recent meta-analysis demonstrated that women with previous PE have a RR of 3.13 (95% CI: 2.51–3.89) for future development of chronic hypertension, an OR of 2.28 (95% CI: 1.87–2.78) for future cardiovascular disease, and an OR of 1.8 (95% CI: 1.43–2.21) for cardiovascular accident.107 It has been observed that the earlier the onset of PE, the more severe the condition and the higher the risk of developing subsequent cardiovascular disease.108
Compared to normotensive women, women with PE are also more likely to have microalbuminuria, a marker of renal damage, at 3–5 years after delivery.109 PE may adversely impact future kidney function since glomerular endotheliosis, a typical renal lesion in PE that was previously thought to resolve soon after delivery, can be observed long after pregnancy in some women who had PE.110 A prospective cohort study reported an association between PE and subsequent end-stage renal disease (RR: 4.7; 95% CI: 3.6–6.1).111 Patients with a history of PE should be aware of the increased risk of future cardiovascular disease,107,108 metabolic syndrome,112,113 and chronic or end-stage renal disease.111 It remains to be determined whether lifestyle modifications as well as close monitoring for signs and symptoms of metabolic syndromes after delivery among patients with PE can reduce these risks.114
Perinatal morbidity and mortality
PE is associated with a number of short- and long-term perinatal and neonatal complications, including death (Table 3). These are mostly related to birth weight and gestational age at delivery and are therefore mainly attributed to early-onset PE.
Table 3.
Short- and long-term perinatal and neonatal complications related to PE
| Short-term complications | Long-term complications |
|---|---|
| Fetal growth restriction (FGR) | Cerebral palsy |
| Oligohydramnios | Low IQ |
| Intrauterine fetal death (IUFD) | Hearing loss |
| Preterm birth | Visual impairment |
| Low Apgar score | Insulin resistance |
| Non-assuring FHR during labor | Diabetes mellitus |
| Need for NICU admission | Coronary artery disease |
| Hypertension |
PE is commonly associated with placental lesions. The underlying vascular manifestations and the presence of oxidative stress and endothelial damage can lead to fetal growth restriction (FGR) with underlying hypoxia and acidosis. A multicenter prospective study of 30,639 unselected women with singleton pregnancies demonstrated that in 614 (2%) women that developed PE there was an inverse significant association between the gestational age at delivery and prevalence of small for gestational age (SGA) (r = −0.99, P<0.0001). As would be expected, the prevalence of SGA with PE was 82%, 47%, and 30% in those delivered at <34 weeks, between 34–37 weeks, and ≥37 weeks, respectively. The frequency of SGA in pregnancies without PE was 44%, 21%, and 8%, respectively.115
Given the presence of underlying hypoxia in PE, and the frequent associations with FGR, the incidence of fetal distress before or during labor is also increased. This is partly related to the reduced fetal reserves available to withstand the stress of labor. This is supported by several studies in which levels of markers of chronic hypoxia, such as erythropoietin and nucleated red blood cells, in cord blood of fetuses born to women with PE were shown to be elevated.116,117
The most important complication that requires great attention through effective prediction and prevention in PE is intrauterine fetal death (IUFD). The risk of IUFD varies widely depending on the population, severity of PE, and the presence of co-morbid factors.118 For women with PE, infant mortality is 3 times higher in low- and middle-income countries than in high-income countries.119 The underlying causes of IUFDs related to PE include acute and chronic hypoxia, placental insufficiency, FGR, and placental abruption. A prospective study of 113,415 singleton pregnancies in the UK reported 396 (3.5 per 1,000) pre-partum IUFDs, of which 230 (58%) were secondary to impaired placentation (PE, FGR, placental abruption) and 166 (42%) were due to other or unexplained causes.120
Infants born to mothers suffering from PE are at risk of being born prematurely, as delivery is the only cure for PE. In women with early-onset or severe PE, the risk is much higher. About 25% of PE cases require delivery before 37 weeks of gestation. It is estimated that about one-third of preterm births are medically indicated, and that PE is the primary indication for iatrogenic preterm delivery.121,122 Infants born prematurely are at higher risk of neonatal mortality and morbidity, including necrotizing enterocolitis, retinopathy of prematurity, bronchopulmonary dysplasia, intraventricular hemorrhage, and neurodevelopmental impairments, compared to term infants. These tend to be inversely related to gestational age at birth.
In summary, several fetal complications are associated with PE, especially when the disease is severe or has an early onset. These include FGR, oligohydramnios, IUFD, preterm delivery, non-reassuring fetal heart rate (FHR) during labor, low Apgar scores, and need for admission to a neonatal intensive care unit (NICU).118 Poor neonatal outcomes can be either related solely to prematurity or as a direct consequence of PE. More often than not, both are at play, particularly in cases of severe, early-onset PE.
Regarding early childhood and school-age neurodevelopmental impairment, several investigators have reported outcomes of large population-based or geographic cohorts of infants born extremely premature. The Epicure Study examined school-age outcomes of all infants born at <26 weeks of gestation over a 5-year period in England.123 Cerebral palsy affected 6% of the survivors, whereas 41% had IQ tests that were more than two standard deviations (SD) below the mean, compared to schoolmates. Investigators from British Columbia reported provincial outcomes for infants born between 22 and 25 weeks over 17 years (n=341).124 Some 20% of survivors had moderate disability (defined as cerebral palsy, or IQ 2–3 SDs below the mean, or sensorineural hearing loss corrected with aids or visual impairment worse than 20/70), whereas 10% of survivors had severe disability (defined as non-ambulatory cerebral palsy, IQ more than three SDs below the mean, hearing loss not corrected, or legal blindness).
Regarding impact in adult life, the publication by Osmond and Barker125 suggested that the in-utero environment could influence adult health and disease state. Their hypothesis states that suboptimal in-utero nutrient supply, as seen in placental insufficiency, through metabolic and hormonal adaptations and altered organ morphology, leads to increased risks of insulin resistance, diabetes mellitus, coronary artery disease, and hypertension. Thus, both short-term and long-term consequences of PE, in terms of impact on individual health, the financial costs in providing the needed acute intensive care, and the long-term consequences to health and human capital, justify efforts to find effective early prediction and preventive strategies.

First trimester prediction of preeclampsia
Problems with existing methods of screening
The current approach to screening for PE is to identify risk factors from maternal demographic characteristics and medical history (maternal risk factors).2–4,15,16,126,127 There are two key recommendations that have evolved over time. According to the National Institute for Health and Clinical Excellence (NICE) in the UK, women should be considered to be at high risk of developing PE if they have any one high-risk factor (hypertensive disease in previous pregnancy, chronic hypertension, chronic renal disease, diabetes mellitus, or autoimmune disease) or any two moderate-risk factors (nulliparity, age ≥40 years, BMI ≥35 kg/m2, family history of PE, or interpregnancy interval >10 years).16 In the USA, the American College of Obstetricians and Gynecologists (ACOG) issued the Hypertension in Pregnancy Task Force Report recommending daily low-dose aspirin beginning in the late first trimester for women with a history of early-onset PE and preterm delivery at less than 34 weeks of gestation, or for women with more than one prior pregnancy complicated by PE.128 The US Preventive Services Task Force published a similar guideline, although the list of indications for low-dose aspirin use was more expansive.129 An updated version of the US Preventive Services Task Force guideline has now been endorsed by ACOG, the Society for Maternal-Fetal Medicine, and the American Diabetes Association.130 Low-dose aspirin prophylaxis at 81 mg/day from 12 and 28 weeks of gestation (optimally at <16 weeks of gestation), continued daily until delivery, should be considered for women with one or more high-risk factors (history of PE, renal disease, autoimmune disease, type 1 or type 2 diabetes, and chronic hypertension) or more than one of several moderate-risk factors (first pregnancy, age of ≥35 years, BMI >30 kg/m2, family history of PE, sociodemographic characteristics, and personal history factors).128 The approach recommended by NICE and ACOG essentially treats each risk factor as a separate screening test with additive detection rate and screen-positive rate. Although recognition of maternal risk factors might be useful in identifying at-risk women in clinical practice, it is not a sufficient tool for the effective prediction of PE.131 In screening with use of NICE guidelines, the detection rate is 39% for preterm PE and 34% for term PE at 10.3% false-positive rate. The respective detection rates in screening with use of the US Preventive Services Task Force recommendations were 90% and 89%, at 64.3% false-positive rate.132
Screening with biomarkers
An alternative approach to screening for PE, which allows estimation of individual patient-specific risks of PE requiring delivery before a specified gestation, is to use Bayes theorem to combine the a priori risk from maternal characteristics and medical history with the results of various combinations of biophysical and biochemical measurements. Extensive research in the last decade has led to the identification of four potentially useful biomarkers at 11–13 weeks of gestation: mean arterial pressure (MAP), uterine artery pulsatility index (UTPI), serum pregnancy associated plasma protein-A (PAPP-A) and serum placental growth factor (PLGF). The algorithm was originally developed from a study of 58,884 singleton pregnancies at 11–13 weeks of gestation, including 1,426 (2.4%) that subsequently developed PE; the estimated detection rates of preterm PE and all cases of PE, at fixed false-positive rate of 10%, were 77% and 54%.133 Subsequently, data from prospective screening in 35,948 singleton pregnancies, including 1,058 pregnancies (2.9%) that experienced PE, were used to update the original algorithm; the detection rates of preterm PE and term PE were 75% and 47%, respectively, at false positive rate of 10%.134 The predictive performance of this algorithm was examined in a prospective multicenter study of 8,775 pregnancies, including 239 (2.7%) cases that developed PE; the detection rates of preterm PE and term PE were 75% and 43%, respectively, at false-positive rate of 10%.135 In the screened population in the ASPRE trial, involving 26,941 singleton pregnancies from 13 maternity hospitals in six countries (the UK, Spain, Italy, Belgium, Greece, Israel), the detection rates of preterm PE and term PE, after adjustment for the effect of aspirin, were 77% and 43%, respectively, at false-positive rate of 9.2%.136
In the latest National Institute for Health Research (UK) commissioned prospective validation study of the Bayes-based model in 16,747 pregnancies, including 473 (2.8%) women that developed PE, the screen-positive rate by the NICE method was 10.3%, the detection rate for all PE was 30%, and for preterm PE it was 41%. The detection rate of the mini-combined test (maternal factors, MAP and PAPP-A) for all PE was 43%, which was superior to that of the NICE method by 12.1% (95% CI, 7.9–16.2). In screening for preterm PE by a combination of maternal factors, MAP, UTPI and PLGF, the detection rate was 82%, which was higher than that of the NICE method by 41.6% (95% CI, 33.2–49.9).137 The addition of PAPP-A to this combined model did not improve the overall screening performance.
Data from three reported prospective non-intervention screening studies at 11–13 weeks of gestation in a combined total of 61,174 singleton pregnancies, including 1,770 (2.9%) that developed PE, have demonstrated that screening by a combination of maternal risk factors, MAP, PLGF, and UTPI and using a risk cut-off of 1 in 100 for preterm PE in white women, the screen-positive rate was 10% and detection rates for early-onset, preterm, and term PE were 88%, 69% and 40%, respectively. With the same method of screening and risk cut-off in women of Afro-Caribbean racial origin, the screen-positive rate was 34% and detection rates for early-onset, preterm, and term PE were 100%, 92%, and 75%, respectively.138
A secondary analysis of data from the ASPRE trial of a total of 34,573 women with singleton pregnancies that underwent prospective screening for preterm PE, including 239 (0.7%) cases of preterm PE, has shown that in ACOG or NICE screen-positive women who are screen-negative by the Bayes-based method, the risk of preterm PE is reduced to within or below background levels. The study demonstrated that at least one of the ACOG criteria was fulfilled in 22,287 (64.5%) of pregnancies and the incidence of preterm PE was 0.97% (95% CI: 0.85–1.11); in the subgroup that was Bayes-method screen positive, the incidence was 4.80% (95% CI 4.14–5.55), in those that were screen negative it was 0.25% (95% CI 0.18–0.33) and the relative incidence in Bayes-method negative to Bayes-method positive was 0.051 (95% CI 0.037–0.071). In 1,392 (4.0%) pregnancies at least one of the NICE high-risk criteria was fulfilled and in this group the incidence of preterm PE was 5.17% (95% CI: 4.13–6.46); in the subgroups of screen positive and screen negative by the Bayes method, the incidence of preterm PE was 8.71% (95% CI 6.93–10.89) and 0.65% (95% CI 0.25–1.67), respectively, and the relative incidence was 0.075 (95% CI 0.028–0.205). In 2,360 (6.8%) pregnancies with at least two of the NICE moderate-risk criteria, the incidence of preterm PE was 1.74% (95% CI: 1.28–2.35); in the subgroups of screen positive and screen negative by the Bayes method, the incidence was 4.91% (95% CI: 3.54–6.79%) and 0.42% (95% CI 0.20–0.86), respectively, and the relative incidence was 0.085 (95% CI 0.038–0.192).139 These results provide further evidence to support risk-based screening using biomarkers.
There is now a substantial body of evidence to support risk-based screening for preterm PE using various biomarkers. This approach to screening has also been validated prospectively in countries other than Europe.140–143 A checklist-based method for screening using information from the maternal history simply does not perform as well and can no longer be considered sufficient for predicting preterm PE effectively.
Recommendations
FIGO recommends the following first trimester screening procedures for singleton pregnancies.
Maternal characteristics and medical history
Best practice recommendation:
Maternal characteristics, medical history, and obstetric history (as shown in Box 2) must be recorded accurately:
Box 2. Maternal characteristics, medical history, and obstetric history for pre-eclampsia screening in the first trimester.
Maternal age (years)
Maternal weight (kg)
Maternal height (cm)
Maternal ethnicity: White, Afro-Caribbean, South Asian, East Asian, Mixed
Past obstetric history: nulliparous, parous without prior PE, parous with prior PE
Inter-pregnancy interval in years between the birth of the last child
Gestational age at delivery (weeks) and birth weight of previous pregnancy beyond 24 weeks
Family history of PE (mother)
Method of conception: spontaneous, ovulation induction, in vitro fertilization
Smoking habit
History of chronic hypertension
History of diabetes mellitus: type 1, type 2, insulin intake
History of systemic lupus erythematosus or antiphospholipid syndrome
Abbreviation: PE, preeclampsia
| Quality of Evidence | Strength of Recommendation |
|---|---|
| High ⊕⊕⊕⊕ | Strong |
Evidence to support the inclusion of the above-listed maternal risk factors in a multivariate regression algorithm originates from a screening study of 120,492 singleton pregnancies at 11–13 weeks of gestation, including 2,704 (2.2%) pregnancies that experienced PE. A competing risk model has been utilized to produce risks for PE, based on a continuous model for the gestational age at delivery with PE, treating births from causes other than PE as censored observations.144 This approach assumes that, if the pregnancy were to continue indefinitely, all women would experience PE and that whether they do so or not before a specified gestational age depends on competition between delivery before or after development of PE. The effects of variables from maternal characteristics and history is to modify the distribution of gestational age at delivery with PE so that in pregnancies at low risk for PE the gestational age distribution is shifted to the right with the implication that in most pregnancies delivery will actually occur before development of PE (Figure 1). In high-risk pregnancies, the distribution is shifted to the left and the smaller the mean gestational age the higher is the risk for PE (Figure 1).
Figure 1: Competing risk model. Distribution of gestational age at delivery for PE.

In pregnancies at low risk for PE, the gestational-age distribution is shifted to the right and, in most pregnancies, delivery will occur before the development of PE. In pregnancies at high risk for PE, the distribution is shifted to the left. The risk of PE occurring at or before a specified gestational age is given by the area under the distribution curve. As an illustration, in the low-risk group, the risk of PE at <34 weeks of gestation is 0.01 or 1% and in the high-risk group, the risk is 0.6 or 60%. Diagram adopted from Wright et al.144
In this risk factor-based model, increased risk for PE, with a consequent shift in the Gaussian distribution of the gestational age at delivery with PE to the left, is related to advancing maternal age, increasing weight, Afro-Caribbean and South Asian origin, medical history of chronic hypertension, diabetes mellitus and SLE or APS, family history and personal history of PE, and conception by IVF. The risk for PE decreases with increasing maternal height and in parous women with no previous PE; in the latter, the protective effect, which is related inversely to the inter-pregnancy interval, persists beyond 15 years. At a screen-positive rate of 11%, as defined by NICE, the new model predicted 40% and 48% of cases of all PE and preterm PE, respectively.144 The risk factor-based model has been further improved with the inclusion of gestational age at delivery in the previous pregnancy.136

Measurement of blood pressure
Measurement of MAP
MAP is calculated from systolic (sBP) and diastolic blood pressure (dBP) readings. The measured sBP and dBP will be automatically converted to MAP by the risk calculator.
Best practice recommendation:
MAP should be measured as part of the risk assessment for PE and it should be measured by validated automated and semi-automated devices (http://www.dableducational.org/sphygmomanometers/devices_1_clinical.html#ClinTable).
| Quality of Evidence | Strength of Recommendation |
|---|---|
| High ⊕⊕⊕ࣷ | Strong |
Best practice recommendation:
Women should be in sitting position, with their arms well supported at the level of their heart and an appropriate-sized adult cuff [small (<22 cm), normal (22–32 cm), or large (33–42 cm)] used depending on the mid-arm circumference145 (Figure 2). After rest for five minutes, blood pressure is measured in both arms simultaneously and two sets of recordings are made at 1-minute intervals. The four sets of sBP and dBP measurements are needed for input into the risk calculator and the final MAP measurement (average of four sets of measurements) will be automatically calculated for the calculation of patient-specific risk.145
Figure 2:

Correct positioning of a woman for blood pressure measurement.
(Courtesy from PerkinElmer Life and Analytical Sciences)
| Quality of Evidence | Strength of Recommendation |
|---|---|
| High ⊕⊕⊕⊕ | Strong |
Pragmatic practice recommendation:
Women should be in the same position and posture as described above. Blood pressure is measured in one arm and two recordings are made at 1-minute intervals. The final MAP measurement (average of two measurements) will be used for the calculation of patient-specific risk.
| Quality of Evidence | Strength of Recommendation |
|---|---|
| Moderate ⊕⊕⊕O | Conditional |
Several factors can affect the values of MAP in pregnant women. A cohort study of nearly 70,000 pregnancies was conducted to evaluate the relationship between MAP and maternal characteristics.146 Significant independent contributions to MAP are provided by gestational age, maternal weight, height, Afro-Caribbean racial origin, cigarette smoking, family history of PE, history of PE in the previous pregnancy, inter-pregnancy interval, chronic hypertension, and diabetes mellitus. Consequently, the measurement of MAP is converted to a multiple of median (MoM), adjusting for these associated maternal characteristics and gestational age146 (Appendix S1).
Poon et al.147 first reported the value of MAP measured by validated automated blood pressure devices according to a standardized protocol at 11–13 weeks of gestation in the prediction of PE.148 Maternal blood pressure was determined in 5,590 singleton pregnant women by automated devices and appropriately trained doctors. For MAP alone and in combination with maternal history, the detection rates for PE, at 10% false-positive rate, were 38% and 63% respectively. A follow-up study of more than 9,000 pregnancies at 11–13 weeks of gestation compared the screening performance of sBP, dBP and MAP.149 Although sBP, dBP, and MAP were all found to be raised in women who subsequently developed PE, MAP performed best as a marker, with a detection rate for early-onset PE, increasing from 47% (based on maternal factors alone) to 76% (based on a combination of maternal factors and MAP) at a false-positive rate of 10%.149
Methodologically, based on the protocol by National Heart Foundation of Australia (NHFA),148 blood pressure is measured in both arms and a minimum of two recordings are made at 1-minite intervals until variations between consecutive readings fall to within 10 mm Hg in sBP and 6 mm Hg in dBP in both arms.148 When this point of stability is achieved, the average of the last two stable measurements of the left and right arms is calculated and the higher of these two measurements of the left and right arms is used. However, in order to achieve the necessary point of blood pressure stability according to the NHFA protocol, it has been shown that it is necessary to perform two measurements in both arms in about 50% of cases, three measurements in 25% of cases, and four measurements or more in 25%.145 In addition, whether blood pressure should be taken on the left or right arm remains controversial. The evidence supporting simultaneous measurement of both arms is derived from the study published by Poon et al.150 In this study, the prevalence of blood pressure inter-arm difference (IAD), defined as IAD of >10 mm Hg of sBP and dBP was determined in 5,435 women during the first trimester of pregnancy. The IAD of sBP and dBP was found in 8.3% and 2.3% of normal pregnant women, respectively.150 A simplified protocol for blood pressure measurement (as described above) has been developed through a study of 25,505 singleton pregnancies where blood pressure measurements are made by using a validated automatic device at 11–13 weeks of gestation.145 The results have demonstrated that performance of screening for PE by taking the average of two measurements from both arms is comparable to the NHFA protocol.
Measurement of biochemical markers
Best practice recommendation:
In first-trimester screening, the best biochemical marker is PLGF. PAPP-A is useful if measurements of PLGF and UTPI are not available.
| Quality of Evidence | Strength of Recommendation |
|---|---|
| High ⊕⊕⊕⊕ | Strong |
Maternal serum concentrations of PLGF and PAPP-A are measured by one of three commercially available automated devices. Quality control should be applied to achieve consistency of measurement of biomarkers.
Placental growth factor
PLGF is a glycosylated dimeric glycoprotein secreted by trophoblastic cells and is part of the angiogenic vascular endothelial growth factor (VEGF) family. It binds to VEGF receptor 1 (VEGFR-1), which has been shown to increase during pregnancy. PLGF is synthesized in villous and extravillous cytotrophoblasts and has both vasculogenic and angiogenetic functions. Its angiogenetic abilities have been speculated to play a role in normal pregnancy, and changes in the levels of PLGF or its inhibitory receptors have been implicated in the development of PE.151–153 Several studies have shown that women who subsequently develop PE have significantly lower maternal PLGF concentrations in the first trimester than those with normal pregnancies.154–157 This biomarker alone has a detection rate of 55% and 33%, respectively, at 10% false-positive rate, for the identification of both early- and late-onset PE.158 A systematic review and meta-analysis have demonstrated that PLGF is superior to the other biomarkers for predicting PE.159 Specifically, maternal PLGF concentrations alone achieve a detection rate of 56% at 9% false-positive rate for the prediction of early-onset PE.159
Several factors affect the values of PLGF in pregnant women. A cohort study of more than 42,000 pregnancies, including 33,147 measured by DELFIA Xpress system (PerkinElmer Life and Analytical Sciences), 7,065 measured by Cobas e411 system (Roche Diagnostics), and 2,143 measured by B·R·A·H·M·S KRYPTOR compact PLUS (Thermo Fisher Scientific), was conducted to evaluate the relationship of PLGF with analyzers and maternal characteristics.138 Significant independent contributions to PLGF values are provided by the three analyzers as listed above as well as by the gestational age, maternal age, weight, racial origin, cigarette smoking, a history of PE in the previous pregnancy, diabetes mellitus, and IVF.
Pregnancy associated plasma protein-A
PAPP-A is a metalloproteinase insulin-like growth factor (IGF) binding protein secreted by the syncytiotrophoblast that plays an important role in placental growth and development. It enhances the mitogenic function of the IGFs. PE has been shown to be associated with a low level of circulating PAPP-A, which is presumably due to the reduced availability of unbound IGFs to fulfill their functional role on a cellular level. PAPP-A is a well-established biochemical marker in the screening of trisomies 21, 18, and 13. In euploid pregnancies, a PAPP-A MoM value at <5th percentile (0.4 MoM) is present in 8%−23% of women with PE. Therefore, as a single marker, it is not an accurate predictive test for PE.160–162 A recent systematic review and meta-analysis, including eight studies involving 132,076 pregnant women in the first-trimester, has demonstrated that the maternal PAPP-A concentration of <5th percentile is associated with the risk of developing PE with an OR of 1.94 (95% CI: 1.63–2.30). It has a detection rate of 16% (9–28%) at 8% false-positive rate to predict PE.163
In a cohort study of more than 94,000 pregnancies the relationship between PAPP-A, measured by DELFIA Xpress system (PerkinElmer Life and Analytical Sciences), and maternal characteristics was evaluated.164 Significant independent contributions to PAPP-A are provided by gestational age, maternal weight, height, racial origin, cigarette smoking, diabetes mellitus, method of conception, previous pregnancy with or without PE, and birth weight Z-score of the neonate in the previous pregnancy. The measurements of PLGF and PAPP-A should be converted to MoMs, adjusting for these associated maternal characteristics, analyzers, and gestational age138 (Appendix S1).
Measurement of uterine artery pulsatility index
Best practice recommendation:
Where feasible, the UTPI should be measured. A transabdominal ultrasound scan should be done at 11+0 to 13+6 weeks of gestation (corresponding to fetal crown-rump length (CRL) of 42–84 mm). Gestational age must be determined from the measurement of the fetal CRL. The same scan is utilized for the measurement of fetal translucency thickness and diagnosis of any major fetal defects. For the measurement of UTPI, a sagittal section of the uterus is obtained and the cervical canal and internal cervical os are identified. Subsequently, keeping the transducer in the midline, it is gently tilted to the side and color flow mapping is used to identify each uterine artery along the side of the cervix and uterus at the level of the internal os (Figure 3). Pulsed-wave Doppler is used with the sampling gate set at 2 mm to cover the whole vessel and care is taken to ensure that the angle of insonation is less than 30°. When three similar consecutive waveforms are obtained (Figure 3), the UTPI is measured and the mean UTPI of the left and right arteries is calculated.165 The measurement of UTPI must be carried out by sonographers who have received the appropriate Certificate of Competence from The Fetal Medicine Foundation (FMF) (www.fetalmedicine.org).
Figure 3:

Identification of the uterine artery at the level of internal os (left) and typical waveforms of the uterine artery Doppler in the first trimester of pregnancy. Courtesy from the Fetal Medicine Foundation.
| Quality of Evidence | Strength of Recommendation |
|---|---|
| High ⊕⊕⊕⊕ | Strong |
The Doppler ultrasound assessing the resistance to blood flow in the uterine arteries correlates with both histological studies and clinical severity of PE. This biophysical marker provides a useful non-invasive method for the assessment of the utero-placental circulation. Studies have shown that a significant decrease of resistance in the spiral arteries occurs with advancing gestation, which is in keeping with physiological changes throughout pregnancy.166,167 Persistent high impedance to flow in the uterine arteries is evidence of poor placentation that manifests itself in the form of abnormal utero placental flow velocity waveforms. Histological examination of placental bed biopsies of pregnancies affected by PE has shown that absence of physiological changes of the spiral arteries is found more commonly in cases with high UTPI.168
Methodologically, the measurement of UTPI at the level of internal os during the first trimester is more reproducible than those obtained at the level of external iliac vessels crossover.169 In addition, UTPI can be achieved at the level of the internal cervical os in a greater proportion of women than at the level of external iliac vessel crossover.169
Several factors can affect the values of UTPI in pregnant women. A cohort study of more than 83,000 pregnancies was conducted to evaluate the relationship of UTPI and maternal characteristics.138 Significant independent contributions to UTPI are provided by gestational age, maternal age, weight, racial origin, a history of PE in the previous pregnancy, and type 1 diabetes. Hence, before comparing the values between affected and unaffected groups, the UTPI value needs to be adjusted for these associated maternal characteristics and gestational age by converting it to a MoM (Appendix S1).
A large meta-analysis of first-trimester UTPI measurement for the prediction of PE included eight studies in the prediction of early-onset PE (n=41,692 women) and eleven studies in the prediction of PE of any gestations (n=39,179 women).170 The first-trimester abnormal UTPI is defined as less than the 90th percentile, achieving a detection rate of 48%, at an 8% false-positive rate, for the identification of early-onset PE. The detection rate for predicting late-onset PE reduces to 26% at a 7% false-positive rate.
The International Society of Ultrasound in Obstetrics and Gynecology (ISUOG) has recently published its practice guideline on the role of ultrasound in screening for and follow-up of PE.165
(https://www.isuog.org/uploads/assets/uploaded/14e78edc-7c46-4e3f-a13d6f563be6a9cb.pdf)
FIGO acknowledges and endorses the guidance from ISUOG with regard to UTPI measurement methodology.
Combined risk assessment
Best practice recommendation:
Published algorithms should be used for converting the measured values of MAP, PLGF, and UTPI, with or without PAPP-A, into MoMs as detailed above. Patient-specific risk for preterm PE is calculated using the Bayes-based method. The risk calculator is available free of charge on the webpage https://fetalmedicine.org/research/assess/preeclampsia and on the FMF mobile app. It is also available on medical records software. A woman is considered high risk when the risk is ≥1 in 100 based on the first-trimester combined test with maternal risk factors, MAP, PLGF, and UTPI.1,136,171
| Quality of Evidence | Strength of Recommendation |
|---|---|
| High ⊕⊕⊕⊕ | Strong |
Best practice recommendation:
Based on existing evidence, the first-trimester combined test is most predictive of preterm PE but not term PE. The best model is the one that combines maternal risk factors with MAP, PLGF, and UTPI. The performance of screening for preterm PE of various combinations of the first-trimester test, based on data from three previously reported prospective non-intervention screening studies, including a combined total of 61,174 singleton pregnancies, including 1,770 (2.9%) that developed PE, is illustrated in Table 4.
Table 4.
Detection rates, at screen-positive rate of 10%, of preterm PE and term PE by maternal factors, biomarkers, and their combination (adopted from Tan et al.a)
| Method of screening | Risk cut-off for PE <37 w | Preterm PE | Term PE | ||
|---|---|---|---|---|---|
| AUC | DR % (95% CI) | AUC | DR % (95% CI) | ||
| Maternal risk factors | 1 in 62 | 0.788 | 44.8 (40.5–49.2) | 0.735 | 33.5 (31.0–36.2) |
| Maternal risk factors plus | |||||
| MAP (baseline) | 1 in 61 | 0.841 | 50.5 (46.1–54.9) | 0.776 | 38.2 (35.6–40.9) |
| UTPI | 1 in 60 | 0.853 | 58.4 (54.0–62.7) | 0.733 | 35.2 (32.6–37.8) |
| PAPP-A | 1 in 61 | 0.810 | 48.5 (44.1–52.9) | 0.734 | 35.2 (32.7–37.9) |
| PLGF | 1 in 62 | 0.868 | 60.6 (56.3–64.9) | 0.745 | 34.5 (32.0–37.2) |
| MAP, UTPI | 1 in 61 | 0.891 | 68.4 (64.1–72.3) | 0.772 | 41.4 (38.8–44.2) |
| MAP, PAPP-A | 1 in 60 | 0.855 | 55.8 (51.4–60.1) | 0.774 | 39.1 (36.4–41.8) |
| MAP, PLGF | 1 in 65 | 0.895 | 66.1 (61.8–70.2) | 0.777 | 39.3 (36.7–42.0) |
| UTPI, PAPP-A | 1 in 60 | 0.861 | 59.2 (54.8–63.5) | 0.735 | 36.3 (33.7–39.0) |
| UTPI, PLGF | 1 in 62 | 0.892 | 66.9 (62.7–70.9) | 0.744 | 36.9 (34.3–39.6) |
| PLGF, PAPP-A | 1 in 62 | 0.869 | 63.5 (59.2–67.6) | 0.745 | 35.7 (33.1–38.4) |
| MAP, UTPI, PAPP-A | 1 in 61 | 0.896 | 68.2 (63.9–72.1) | 0.773 | 40.6 (37.9–43.3) |
| MAP, PAPP-A, PLGF | 1 in 65 | 0.896 | 67.3 (63.1–71.3) | 0.777 | 39.3 (36.7–42.0) |
| MAP, UTPI, PLGF | 1 in 66 | 0.915 | 74.8 (70.8–78.5) | 0.776 | 41.0 (38.3–43.7) |
| UTPI, PAPP-A, PLGF | 1 in 63 | 0.892 | 68.2 (63.9–72.1) | 0.745 | 36.9 (34.3–39.6) |
| MAP, UTPI, PAPP-A, PLGF | 1 in 66 | 0.916 | 74.8 (70.8–78.5) | 0.777 | 41.3 (38.7–44.1) |
Abbreviations: PE, pre-eclampsia; AUC, area under curve; DR, detection rate; MAP, mean arterial pressure; UTPI, uterine artery pulsatility index; PAPP-A, pregnancy-associated plasma protein A; PLGF, placental growth factor.
Adapted with permission granted by Wiley, from Tan et al.138
| Quality of Evidence | Strength of Recommendation |
|---|---|
| High ⊕⊕⊕⊕ | Strong |
Pragmatic practice recommendation:
Where it is not possible to measure the biochemical markers and/or UTPI, the baseline screening test should be a combination of maternal risk factors with MAP, and not maternal risk factors alone. PAPP-A is useful if measurements of PLGF and UTPI are not available. These variations to the combined test would lead to a reduction in the performance screening.
| Quality of Evidence | Strength of Recommendation |
|---|---|
| Moderate ⊕⊕⊕O | Conditional |
As demonstrated above, biomarkers are best used in the combination strategy for the prediction of PE. A recent systematic review has been conducted to evaluate the performance of simple risk models (maternal characteristics only) versus specialized models which include specialized tests such as the measurement of MAP, UTPI, and/or maternal biochemical markers for the prediction of PE. Seventy models from 29 studies have been identified (17 models to predict PE; 31 models to predict early-onset PE; and 22 models to predict late-onset PE). Among them, 22 were simple models while 48 were classified as specialized models. Comparing the simple and specialized models, the latter performed better than the simple models in predicting early- and late-onset PE, achieving an additional 18% (95% CI 0–56) in detection rate for the prediction of PE at a fixed false-positive rate of 5% or 10%.172 Therefore, a combination of various tests rather than a single test is recommended for the prediction of PE.
Contingent screening
Pragmatic practice recommendation:
Where resources are limited, routine screening for preterm PE by maternal factors and MAP in all pregnancies and reserving measurements of PLGF and UTPI for a subgroup of the population, selected on the basis of the risk derived from screening by maternal factors and MAP alone, can be considered (Figure 4).
Figure 4:

Two-stage screening strategy for preterm PE in which the whole population undergoes first-stage screening by maternal factors and MAP and a selected proportion of those considered to be at intermediate risk undergoes second-stage screening by PLGF and UTPI. Adopted from Wright et al.173
| Quality of Evidence | Strength of Recommendation |
|---|---|
| Moderate ⊕⊕⊕O | Conditional |
In a prospective screening study including more than 120,000 singleton pregnancies, the performance of screening for preterm PE by this two-stage strategy was examined. At a fixed screen-positive rate of 10%, a detection rate of 71% was achieved by this two-stage screening, with screening by maternal factors and MAP, based on the above-described combined algorithm, at 11+0-13+6 weeks of gestation in the first stage and reserving measurement of PLGF and UTPI for the second stage and for 30% of the population.173
Multiple pregnancies
Pragmatic practice recommendation:
The same first-trimester combined test for PE in singleton pregnancies can be adapted for screening in twin pregnancies. It leads to the detection of nearly all affected cases of PE but at a high screen-positive rate.
| Quality of Evidence | Strength of Recommendation |
|---|---|
| Moderate ⊕⊕⊕O | Conditional |
In a prospective screening study for PE in 2,219 twin pregnancies undergoing routine first-trimester combined screening for aneuploidy and subsequently delivering two phenotypically normal live or stillborn babies at ≥24 weeks of gestation, the incidence of PE in dichorionic and monochorionic twin pregnancies was shown to be increased by 4-fold and 3-fold, respectively.174 In twin pregnancies that developed PE, the values of MAP and UTPI were increased and the values of PLGF and PAPP-A were decreased. The distributions of log10 MoM values of biomarkers with gestational age at delivery were similar to those that were previously reported in singleton pregnancies and it was therefore decided that the same first-trimester combined test for singleton pregnancies could be applicable to twin pregnancies. In a mixed population of singleton and twin pregnancies, combined screening by maternal factors, MAP, UTPL, and PLGF and at a risk cut-off of 1 in 75 for preterm PE, the detection rates of preterm PE and all PE in singleton pregnancies were 77% and 57%, respectively, at a screen-positive rate of 13%; the respective rates for twin pregnancies were 99% and 97%, at a screen-positive rate of 75%.174 The addition of PAPP-A did not improve the performance of screening.
First trimester prevention of preterm preeclampsia
The current approach to prevention of PE is to commence low-dose aspirin at 75 mg or 81 mg daily in high-risk women as locally defined.2–4,16,128 Low-dose aspirin treatment in pregnancy is thought to prevent the development of PE by inhibiting the biosynthesis of placental thromboxane A2 with minimal effects on vascular prostacyclin levels.175 The enzyme cyclo-oxygenase plays a pivotal role in the production of both prostacyclin and thromboxane A2. Aspirin inhibits endothelial cyclo-oxygenase176 and this process is irreversible in platelets, where the enzyme is inhibited for their entire life-span. In contrast, when the enzyme is re-synthesised in endothelial cells, the prostacyclin production is re-established relatively rapidly. This selective inhibition of cyclo-oxygenase and the resulting alteration in the prostacyclin to thromboxane A2 ratio in the placenta forms the basis of using aspirin to prevent or delay the onset of PE.
Crandon and Isherwood177 demonstrated that nulliparous women who had taken aspirin for more than once a fortnight throughout pregnancy had a lower risk of PE than those who had no reported history of aspirin consumption. In 1985, an open-label randomized trial showed that among women at risk for PE or FGR, based on obstetric history, pregnancies in women who received 300 mg of dipyridamole and 150 mg of aspirin beginning at 12 weeks of gestation until delivery were not complicated by PE, fetal loss, and severe FGR, compared to those in the non-intervention group.178 A landmark meta-analysis, including 31 randomized trials of PE prevention, including 32,217 pregnancies, showed that patients who received anti-platelet agents, especially aspirin, for the prevention of PE, had a 10% reduction of PE (RR 0.90; 95% CI: 0.84–0.97), preterm birth before 34 weeks of gestation, and serious adverse pregnancy outcomes (PE, delivery <34 weeks of gestation, SGA babies, fetal or maternal death).179 Bujold et al.180 showed that low-dose aspirin started at ≤16 weeks of gestation in women at risk of PE had a substantial reduction in the rate of PE (RR 0.47; 95% CI: 0.34–0.65). However, aspirin started after 16 weeks of gestation did not decrease the rate of PE (RR 0.81; 95% CI: 0.87–1.10).180 Subsequent meta-analyses consistently showed that the administration of low-dose aspirin (50–150 mg/day) at ≤16 weeks of gestation to women at risk of PE had a significant reduction in PE, in particular, preterm PE (RR 0.22; 95% CI: 0.080–0.567).181 Additionally, these meta-analyses highlighted that additional benefits from early aspirin prophylaxis include a 50% reduction in the risk of FGR and a 60% reduction in the risk of perinatal death.180 These results have stimulated the need of a prospective randomized trial to evaluate the potential benefit of aspirin in preventing PE.
This evidence has been provided by the ASPRE trial (Project #601852; EudraCT number 2013-003778-29; ISRCTN13633058; www.aspre.eu). The ASPRE trial shows that the rate of delivery with preterm PE can be reduced by 62% by aspirin started at 11–14 weeks of gestation in high-risk women.182 The ASPRE trial was designed to test the hypothesis that aspirin at a dose of 150 mg per night from 11 to 14 weeks until 36 weeks of gestation, as compared with placebo, would result in halving the incidence of preterm PE. In this multicenter, double-blind, placebo-controlled trial, women with singleton pregnancies identified as being at high-risk of preterm PE, by means of the first-trimester combined test were randomized to receive aspirin (150 mg per night) vs. placebo from 11–14 weeks until 36 weeks of gestation. Preterm PE occurred in 1.6% (13/798) participants in the aspirin group, as compared with 4.3% (35/822) in the placebo group (OR in the aspirin group, 0.38; 95% CI, 0.20–0.74). However, there was no significant reduction in the rate of term PE with the use of aspirin prophylaxis (OR in the aspirin group, 0.95; 95% CI, 0.57–1.57). The proportion of prescribed tablets taken was used as an overall measure of adherence. Adherence was good, with reported intake of >85% of the required number of tablets in 80% of participants. There were no significant between-group differences in adverse events. There was no statistically significant difference in the rate of vaginal bleeding (3.6% vs. 2.6%) and upper gastrointestinal (GI) symptoms (7.4% vs. 7.1%) between placebo and aspirin groups. In particular, the rates of vaginal bleeding (4.8% vs. 2.9%) and upper GI symptoms (6.8% vs. 6.4%) were not significantly different in women who were of normal weight versus women who were overweight in the aspirin arm.
Further, a secondary analysis of data of 1,620 participants with 1,571 liveborn neonates showed that the total length of stay in NICU was substantially longer in the placebo than aspirin group (1,696 vs. 531 days). This reflected significantly shorter mean lengths of stay in babies admitted to the NICU in the aspirin group compared to the placebo group (11.1 vs. 31.4 days; a reduction of 20.3 days).183 Overall, in the whole population, including zero lengths of stay for those that were not admitted to the NICU, the mean length of stay was longer in the placebo than aspirin group (2.06 vs 0.66 days; reduction of 1.4 days). This corresponded to a reduction in length of stay by 68%.183
Results from the ASPRE trial provide definitive evidence that effective screening for preterm PE can be achieved with a combined test of maternal factors and biomarkers at 11–13 weeks and aspirin treatment from the first trimester of pregnancy can significantly reduce the risk of developing preterm PE. Furthermore, in pregnancies at high risk of preterm PE, administration of aspirin reduces the length of stay in the NICU by 68%. The findings have implications for both the short- and long- term and savings as well as infant survival, disability, and human capital.
FIGO makes the following recommendation for early prevention of preterm PE:
Best practice recommendation:
Following the first-trimester screening and assessment for preterm PE, women identified at high risk should receive aspirin prophylaxis commencing at 11–14+6 weeks of gestation at a dose of ~150 mg to be taken every night until either 36 weeks of gestation, when delivery occurs, or when PE is diagnosed.171
| Quality of Evidence | Strength of Recommendation |
|---|---|
| High ⊕⊕⊕⊕ | Strong |
This recommendation is supported by the evidence from the ASPRE trial.182 The choice for recommending night-time consumption of low-dose aspirin is based on the results from a randomized, double-blind, placebo-controlled, chronotherapy trial on 350 high-risk women. This trial demonstrated that women taking low-dose aspirin at 100 mg, compared with placebo, had a significantly lower hazard ratio (HR) of serious adverse outcomes, a composite of PE, preterm birth, FGR and IUFD (HR 0.35, 95% CI: 0.22–0.56) and that the event rate of serious adverse outcomes was significantly lower in women taking low-dose aspirin in the evening, in comparison to morning and afternoon (HR 0.19, 95% CI 0.10–0.39).184
The latest systematic review and meta-analysis which included 16 randomized controlled trial studies for a total of 18,907 participants demonstrated that the administration of aspirin was associated with reduction in the risk of preterm PE (RR: 0.62, 95% CI 0.45 to 0.87). However, there was no significant effect on term PE (RR: 0.92, 95% CI 0.70 to 1.21). Only the subgroup in which aspirin was started at ≤16 weeks of gestation at a dose of ≥100 mg/day was associated with a reduction in the frequency of preterm PE [RR 0.33 (0.19–0.57); p=0.0001]. Aspirin started after 16 weeks or administered in a daily dose of <100 mg was not associated with a significant reduction in rates of preterm or term PE.185 Suggested aspirin dosages are provided in Table 5.
Table 5.
Suggested aspirin dosages are provided below.
| Maternal weight | Daily required dosage | Administration |
|---|---|---|
| <40 Kg | 100 mg | 1 × 100 mg |
| ≥40 Kg | ~150 mg | 2 × 60 mg 2 × 75 mg 2 × 81 mg 1 × 100 mg + 1/2 × 100mg (discard the other half) 1/2 × 300 mg (discard the other half) |
Low-dose aspirin is defined as dosage of <300 mg/day. In 1979, Masotti et al186 demonstrated that aspirin 2.5–3.5 mg/kg is the required dosage to produce a consistent inhibition of platelet aggregation with slight inhibition of prostaglandin production. The recommended dosage of 150 mg/day would be sufficient for an average woman with a weight of 65 kg at booking.
Pragmatic practice recommendation:
Where it is not possible to source the above-suggested aspirin regime, the minimum dosage of aspirin to be prescribed to high-risk women should be 100 mg/day.
| Quality of Evidence | Strength of Recommendation |
|---|---|
| Moderate ⊕⊕⊕O | Conditional |
Best practice recommendation:
High-risk women must be informed and counselled about the importance of treatment adherence and assessed for compliance at each antenatal visit.
| Quality of Evidence | Strength of Recommendation |
|---|---|
| High ⊕⊕⊕⊕ | Strong |
In a secondary analysis of data from the ASPRE trial, the influence of adherence on the beneficial effect of aspirin in prevention of preterm PE was evaluated. The choice of cut-off for good compliance was redefined as greater than 90%, which was based on an exploratory analysis of the treatment effect. Preterm PE occurred in 5/555 (0.9%) participants in the aspirin group with adherence greater than or equal to 90%, in 8/243 (3.3%) of participants in the aspirin group with adherence less than 90%, in 22/588 (3.7%) of participants in the placebo group with adherence greater than or equal to 90%, and in 13/234 (5.6%) of participants in the placebo group with adherence less than 90%. The OR in the aspirin group for preterm PE was 0.24 (95% CI, 0.09–0.65) for adherence more than 90% and 0.59 (95% CI, 0.23–1.53) for adherence less than 90%. The beneficial effect of aspirin in preventing preterm PE is dependent on adherence.187 In addition, there was no evidence of heterogeneity in the aspirin effect in subgroups defined according to maternal characteristics and obstetric history, with the exception of chronic hypertension. In women with chronic hypertension, preterm PE occurred in 10.2% (5/49) in the aspirin group and in 8.2% (5/61) in the placebo group (adjusted OR 1.29; 95% CI, 0.33–5.12); the respective values in those without chronic hypertension were 1.1% (8/749) in the aspirin group and 3.9% (30/761) in the placebo group (adjusted OR 0.27; 95% CI, 0.12–0.60). Prophylactic aspirin may not be as effective in lowering preterm PE risk in women with chronic hypertension compared with other high-risk groups. Further, in women with adherence of more than 90% the adjusted OR in the aspirin group was 0.24 (95% CI, 0.09–0.65), in the subgroup with chronic hypertension it was 2.06 (95% CI, 0.40–10.71), and in those without chronic hypertension it was 0.05 (95% CI, 0.01–0.41).
Pragmatic practice recommendation:
If vaginal spotting occurs, it must be duly assessed but does not necessitate stopping aspirin prophylaxis.
| Quality of Evidence | Strength of Recommendation |
|---|---|
| High ⊕⊕⊕⊕ | Strong |
Several systematic reviews of randomized controlled trials have demonstrated that the use of low-dose aspirin during pregnancy is not associated with hemorrhagic complications.179,188,189 The study by the U.S. Preventive Services Task Force, which included more than 23,000 pregnant women showed that the risk of placental abruption (RR 1.17; 95% CI: 0.93–1.48) and postpartum hemorrhage (RR 1.02; 95% CI: 0.96–1.09) did not significantly increase with the use of aspirin.188 In addition, women who were exposed to low-dose aspirin during pregnancy had similar mean blood loss to those who were not exposed to low-dose aspirin.188 A recent meta-analysis involving 12,585 pregnant women showed that the use of aspirin at <100 or ≥100 mg/day, regardless of initiation time (≤16 or >16 weeks), was not associated with an increased risk of placental abruption or antepartum hemorrhage.190 In the ASPRE trial, women exposed to aspirin did not have increased risk of bleeding adverse events.136 During the trial, women with vaginal spotting were not advised to stop the trial medication.
Best practice recommendation:
in women with low calcium intake (<800 mg/day), either calcium replacement (≤1g elemental calcium/day) or calcium supplementation (1.5g-2g elemental calcium/day) may reduce the burden of both early- and late-onset PE.191
| Quality of Evidence | Strength of Recommendation |
|---|---|
| Low ⊕⊕OO | Conditional |
PE was reduced consistently with low-dose calcium with or without co-supplements (nine trials, 2234 women, RR 0.38; 95% 95% CI 0.28–0.52), as well as for subgroups: low-dose calcium alone (four trials, 980 women, RR 0.36; 95% CI 0.23–0.57]); low-dose calcium plus linoleic acid (two trials, 134 women, RR 0.23; 95% CI 0.09–0.60); low-dose calcium plus vitamin D (two trials, 1060 women, RR 0.49; 0.31–0.78) and a trend for low-dose calcium plus antioxidants (one trial, 60 women, RR 0.24; 95% CI 0.06–1.01). Overall results were consistent with the single quality trial of low-dose calcium alone (171 women, RR 0.30; 95% CI 0.06–1.38). For high-dose calcium, the average risk of high blood pressure was reduced with calcium supplementation (vs placebo (12 trials, 15,470 women: RR 0.65, 95% CI 0.53–0.81). There was a reduction in the average risk of PE associated with calcium supplementation (13 trials, 15,730 women: RR 0.45, 95% CI 0.31–0.65). The effect was greatest for women with low baseline calcium intake (8 trials, 10,678 women: RR 0.36, 95% CI 0.20–0.65) and those selected as being at high risk (5 trials, 587 women: RR 0.22, 95% CI 0.12–0.42). The variable methods of selecting women as being at high risk limit the clinical usefulness of these pooled results.191
Pragmatic practice recommendation:
in high risk women who are sensitive or allergic to aspirin, and in the absence of other proven interventions, close vigil and expectant management are appropriate. These include frequent clinic blood pressure and / or home blood pressure monitoring to ensure early diagnosis of PE. The purported benefit of other treatments, such as heparin, vitamin C and E, magnesium, folate, metformin, statin, for prophylaxis of preterm PE is not as yet based on credible evidence and their use solely for the purpose of preventing preterm PE in pregnancy is neither justified nor recommended.192–198
| Quality of Evidence | Strength of Recommendation |
|---|---|
| Very Low ⊕OOO | Conditional |
Pragmatic practice recommendation:
In women with multiple pregnancies, the use of low-dose aspirin for the prevention of PE may be considered, however, more research is required to demonstrate a high level of evidence.
| Quality of Evidence | Strength of Recommendation |
|---|---|
| Very Low ⊕OOO | Conditional |
The latest systematic review and meta-analysis of six randomized controlled trials, including 898 pregnancies, demonstrated a significant reduction in the risk of PE (RR, 0.67; 95% CI, 0.48–0.94) and mild PE (RR, 0.44; 95% CI, 0.24–0.82) but not severe PE (RR, 1.02; 95% CI, 0.61–1.72) with low-dose aspirin. The risk of SGA was not changed (RR, 1.09; 95% CI, 0.80–1.47). The reduction of PE was not different between women randomized before (RR, 0.86; 95% CI, 0.41–1.81) or after 16 weeks of gestation (RR, 0.64; 95% CI, 0.43–0.96) (p = 0.50). The authors concluded that there is a low level of evidence supporting the use of low-dose aspirin for the prevention of PE and SGA neonates in multiple gestations.199
The FIGO initiative for PE is meant to provide a practical and pragmatic guide for national associations to adopt and promote a uniform approach to predicting and preventing preterm PE for all countries and regions based on their financial, human, and infrastructure resources. A pathway for preterm PE prevention and screening is shown in Figure 5.
Figure 5.

Pathway of preterm pre-eclampsia screening and prevention.
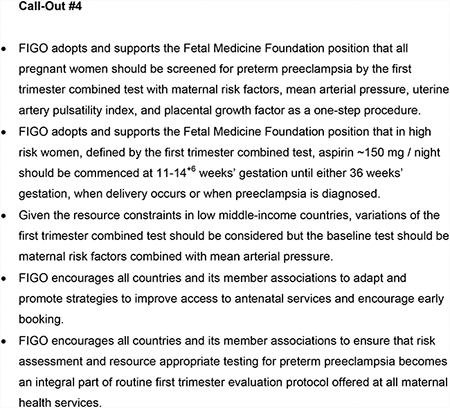
Resource-based Approach to Screening
Implementation of guidelines is a constant challenge. The reality is that most developing countries around the world are unable to implement a first-trimester screening program for preterm PE based on the combined test.
Recommendations that are rigid and impractical in real life settings are unlikely to be implemented and hence may produce little or no impact. On the other hand, pragmatic but less than ideal recommendations may produce significant impact due to more widespread implementation.
The FIGO approach is three pronged:
(1) to promote, encourage and advocate ideal evidence based guidance, (2) to offer pragmatic options for resource-constrained situations based on local experience backed by less than optimal evidence and (3) to promote research aimed at improving the evidence base in both well-resourced and resource constrained contexts.
FIGO recommendations are based on available resources at country level and evidence of local practice. Countries worldwide fall into four resource categories. There are also variations seen within any country. An affluent country may have pockets of poorly funded care and conversely, a low or middle resource country may have ‘state of the art’ care in the private sector for a selected few.
High resource countries:
Includes countries or regions like North America, Western Europe, Japan, South Korea, Australia, etc.
Upper middle resource countries:
Includes countries like Brazil, China, Colombia, Hungary, Malaysia, Mexico, Romania, South Africa, Turkey, etc.
Low middle resource countries:
Includes countries like India, Indonesia, Pakistan, Nigeria, Egypt, Vietnam, the Philippines etc.
Low resource countries:
Includes countries like Bangladesh, Nepal, Cambodia, Kenya, Tanzania, Uganda, Ethiopia, Congo, Sierra Leone, etc.
In low- and middle-income countries where resources are limited, variations of the first trimester combined test can be considered but the baseline test is one that combines maternal risk factors with MAP. In the absence of one or two of the biomarker(s), risk calculation can still be done but the detection rates for preterm PE will be reduced, in turn leading to a reduction in the treatment effect size by aspirin prophylaxis but may make the treatment economically feasible.
As 99% of serious morbidity occurs in low- and middle-income settings, any prediction and prevention strategies need to be applied in these settings to impact on the global burden. An estimated 70,000 women per year die from PE. Low- and middle-income countries are disproportionately affected by avoidable maternal deaths, with 84% of mortalities occurring in Sub-Saharan Africa and Southern Asia.200 Regional variation in hypertension disorders in pregnancy as a cause of maternal mortality is also seen with the highest burden in Latin America and the Caribbean, where it’s responsible for 22% of deaths compared to 14% globally. For every woman that dies, another 20 suffer life-altering morbidity.
Prediction and prevention of PE is an important goal in reducing avoidable mortality and morbidity on a global scale but enabling this in diverse health systems remains a challenge. Prediction models based on early maternal characteristics to improve risk stratification require contact with healthcare services in the first trimester. A systematic analysis of early antenatal care visits between 1990–2013 showed that although worldwide coverage increased by 40%, in 2013 only 24% of visits were in low-income countries compared to 82% in high-income countries.201 Although progress in coverage of antenatal care is improving over time it remains far from universal. Further understanding of contextual factors influencing barriers to antenatal care such as acceptability, affordability and geographical accessibility is crucial when considering approaches to improve quality and coverage of care.
Community outreach strategies such as mobile clinics are an example of attempts to increase coverage, however quality of care in these settings has rarely been evaluated. A cross sectional study comparing quality of antenatal care between fixed and mobile clinics in Haiti found low referral rates, with 95% of women found to be hypertensive not being referred to a higher level of care to screen for proteinuria.202 This highlights the need to focus on provider education, consistent adherence to clinical guidelines and improvement in referral pathways.
A health systems approach must be advocated for, particularly in low- and middle-income countries where systems are weakest. Concentrating solely on delivery of health services or new technologies aimed at risk prediction is unlikely to work alone to reduce the burden of mortality and morbidity. It however remains an important goal and must be accompanied by necessary pathways to deliver effective prophylaxis such as with aspirin. Although affordable, education and prescribing/delivery pathways must be established if this strategy is to be effective. Workforce, availability of essential drugs, information systems, governance and financing therefore must also be addressed.
Priorities for under-resourced settings may be focused around the availability of accurate, functional blood pressure monitoring devices, facility for assessment of risk such as proteinuria, training of staff (particularly if ultrasound is to be used for screening), including for appropriate escalation and management, ensuring reliable supply chains for the provision of aspirin, antihypertensives and magnesium sulphate and the availability of laboratory services. This will need to be in parallel with any strategy to implement prevention.
Cost effectiveness of early PE prediction and prevention approach has been evaluated in high-income countries and has shown substantial cost saving.203 However in low- and middle-income countries multiple system’s level barriers exist which will impact implementation, evaluation and sustainability of such approaches. Economic analysis of basic screening devices such as blood pressure monitors and urine dipsticks for use in low resource settings has shown that simple devices are most cost effective.204 The more sophisticated tools for first trimester screening must be evaluated in this context. More work is required to evaluate the balance between better detection versus cost of screening with current successful prediction algorithms, and treatment pathways when applied to a low-income setting.
A key barrier to early prediction and prevention of PE in the developing world is the delayed first antenatal visit or even contact with a healthcare worker. Further, in many places BP is not being measured at all at this moment. More efforts to raise awareness of the benefits of early antenatal visit, targeted at reproductive age women, primary health care workers, women self-help groups, etc., coupled with skill development of primary health care providers on risk assessment, accurate BP measurement, counselling skills; ensuring aspirin availability and adherence to treatment and follow up will have a far greater impact on PE outcomes then making more advanced testing technology and protocols available. Integrating PE risk assessment as an integral part of basic first trimester evaluation protocol - measuring weight, BP, hemoglobin, blood sugar, etc., will go a long way to improve implementation.

Cost-effectiveness of preeclampsia screening
It is well established that significant health care resources have to be invested in preventing morbidity and mortality related to PE and that, as a consequence, both maternal and neonatal costs are inflated compared to an uncomplicated pregnancy. Given the relative frequency of this disease, these costs are significant for the health care system and the widespread implementation of a prediction/prevention strategy would help ease this burden. As the best tests for prediction involve a multivariate model that includes a number of investigative tools, many consider screening to be complex and expensive. It is therefore important to first recognize the current costs of PE – and the potential benefit in spending a fraction of the sum that would be recouped through effective prevention on comprehensive screening.
The reported costs of PE do vary quite widely depending on the jurisdiction. Examples of costs include those reported within the USA and Irish health care systems. A review of billing data collected by the Californian Medi-Cal healthcare program estimated the cost of an uncomplicated vaginal delivery to be $4,500 in 2011 (US $4900 based on Consumer Price Index to 2017).205 The average incremental cost for a pregnancy complicated by hypertensive disease was US $8,200 – with an estimated total incremental cost for all Californian births of more than US $200M. Costs were highest for women who had severe disease requiring delivery at early (<34 weeks) gestations. In this cohort, the incremental cost was US $70,100 per pregnancy. Although costs for an uncomplicated delivery were reported to be lower in Ireland (US $3,000), there was a similar increase in cost for pregnancies affected by PE (increment of $3,300).206
Through linkage of the maternal and neonatal datasets, it is possible to show that the predominant driver for increased costs in preterm birth is neonatal care.207 Whilst costs of maternal care rise 2.7-fold for women needing to be delivered before 32 weeks of gestation, costs of neonatal care increase 35-fold. Preterm birth impacts just 8% of population, but it is responsible for 61% of all costs. Delivery before 32 weeks of gestation affects just 1% of infants but is responsible for 36% of obstetric costs. A third Californian dataset showed that these margins hold true for PE as well as other adverse outcomes. In this series, the cost burden was described as being US $1,311 at 36 weeks – compared to US $150,000 at 26 weeks of gestation.208 The authors suggested that the annual burden of PE to the USA in 2012, including care of mother and child for the first 12 months after delivery, was US $2.18 billion.
A systematic review of the literature shows that there are only four cost-effective analyses that focus on interventions for prevention of PE. Three of these examine the impact of aspirin, the fourth focuses on the potential value of calcium supplementation.
The first paper to assess the economic value of a comprehensive first-trimester screening tool (using maternal characteristics, the biomarkers placental protein 13 and PLGF and UTPI) described three end points: the prevalence of PE, costs until discharge after delivery, and incremental cost per quality-adjusted life-year (QALY) to avoid perinatal death.209 The authors were not prescriptive about the intervention, suggesting that low-dose aspirin, calcium or vitamin supplementation could be used – either alone or in combination - and using sensitivity analysis to demonstrate differential effect. The authors defined costs based on the Israeli health care system and also demonstrated that cost benefit was affected by prevalence of disease. Using these models, the authors concluded that screening for PE was effective in various scenarios.
Werner et al.210 used a decision model to determine which one of four potential strategies for prevention of PE was most cost effective. Treatment involved either no prophylaxis, provision of aspirin to women deemed high risk in accordance with ACOG guidelines or the US Preventative Services Task Force recommendations or universal prophylaxis.17,129 Costs were based on US health care prices. The model showed that both the US Preventative Services Task Force approach and universal prophylaxis led to a similar and significant reduction in the prevalence of PE, the major difference being that 76.5% of women would not be prescribed aspirin using the former approach. The authors suggested rolling out either of these policies to all four million pregnant women in the USA as this would result in cost savings of approximately US $370M (similar using either approach).
The cheap nature of the intervention (aspirin) makes a policy of universal screening attractive and easy to advocate. It is, however, important to recognize that despite the fact that aspirin is currently recommended for prophylaxis, only a minority of high risk women are treated, with medication starting at an appropriate time point.211. Secondly, there is no high quality evidence demonstrating that a policy of universal prophylaxis works. Third, many pregnant women prefer to avoid taking medications when they are pregnant and compliance is likely to be poor. Whilst the safety profile for aspirin is good, recent epidemiological data suggest that this drug may be associated with a small increase in the risk of having an infant affected by cerebral palsy.212 The relative risk for cerebral palsy is much lower than that associated with preterm birth – so this does not impact pregnancies deemed to be high risk through formal multivariate screening programs, but it should make clinicians more circumspect about universal prescription.
The ASPRE trial did not show a significant reduction in admission rates to the NICU (6.8% in controls vs. 6.2% in high-risk women who were prescribed aspirin) but did show a significant reduction in the length of stay (31.4 days vs. 11.1 days respectively).183 This equated to a 68% reduction in the length of stay for the aspirin treated group – and an equivalent reduction in neonatal costs – which, as has already been described, are the dominant costs in these models.
Prior to introducing first-trimester screening for PE, a Canadian group examined the potential cost benefit of screening with aspirin prophylaxis in high-risk women.203 The group used a decision analysis model assigning probabilities and associated costs at each node based on local published data and public databases. The intervention mimicked that described in ASPRE and this was compared to current standard of care (prescription of 81mg aspirin based on maternal history). Sensitivity analysis was performed to vary the uptake of screening and the probability of being prescribed aspirin if found to be in a high-risk group. The model showed that first-trimester screening and prescription of aspirin to high risk women led to both a reduction in prevalence of disease and a CAD $14.4M cost saving to the Canadian health care system. This saving was demonstrated despite the conservative nature of some of the costings. The cost of a mother/infant being delivered <34 weeks of gestation was only costed at CAD $13,268.21; therefore, the cost savings from prevention of early-onset PE may be underestimated. The cost of first-trimester screening was estimated at CAD $668.84; however, in circumstances where first-trimester aneuploidy screening is performed. this is likely lower (CAD $100 per test) – which would lead to a cost reduction (and further saving to the health system) of an additional CAD $220 million per year.
A fourth cost-effectiveness analysis focused on calcium prophylaxis and used a decision analytic model to examine the impact of this treatment if prescribed to all pregnant women, to women identified as being high risk for PE, or to women with low dietary intake of calcium.213 These three models led to corresponding reductions of disease prevalence of 25%, 8%, and 13%, respectively—all demonstrating cost savings ranging from €2 to 4.6M per 100,000 pregnancies. Once again, the low cost of the intervention makes universal prophylaxis appealing.
None of these models have adequately considered the long-term health effects of PE. Whilst maternal cerebrovascular events are rare, Pourat et al.205 estimated a lifetime cost of US $659,156 for such an event in a 25-year old woman. Similarly, women who had PE have higher risks of other cardiovascular pathologies in middle age that may be avoided through effective first-trimester screening and prophylaxis. Preterm infants have significant risk of cerebral palsy and neurodevelopmental delay—disabilities that have an associated estimated cost of US $38,250 per year.205 These children/young adults also have higher risks of hypertension, type 2 diabetes, and metabolic syndrome—all associated with their own burdens and health care costs.
Further cost effective analysis are needed to demonstrate the value of first trimester screening in different populations, with different disease prevalence and different models / costs of medical care. To this point, all models have suggested that the introduction of first trimester prediction and prevention dominates current screening strategies. This is largely driven by the cost savings associated with reduction of preterm delivery.
Supplementary Material
Appendix S1. Formulas for calculation of multiple of the median (MoM) values at 11–13 weeks of gestation. Algorithm for prediction of pre-eclampsia.
Acknowledgments
This project was funded by an unrestricted educational grant from PerkinElmer Life and Analytical Sciences, Waltham, USA, represented by Yvonne Parker.
NIH Funding Statement: This research was supported, in part, by the Perinatology Research Branch, Division of Obstetrics and Maternal-Fetal Medicine, Division of Intramural Research, Eunice Kennedy Shriver National Institute of Child Health and Human Development, National Institutes of Health, U.S. Department of Health and Human Services (NICHD/NIH/DHHS); and, in part, with Federal funds from NICHD/NIH/DHHS under Contract No. HHSN275201300006C.
Dr. Romero has contributed to this work as part of his official duties as an employee of the United States Federal Government.
List of abbreviations/acronyms
- ACOG
American College of Obstetrics and Gynecology
- APS
Anti-phospholipid syndrome
- ART
Assisted reproductive technologies
- ASPRE
Combined multi-marker screening and randomised patient treatment with aspirin for evidence-based pre-eclampsia prevention
- AUC
Area under receiver operating characteristic curve
- BMI
Body mass index
- CI
Confidence interval
- CRL
Crown-rump length
- dBP
Diastolic blood pressure
- DR
Detection rate
- FGR
Fetal growth restriction
- FIGO
International Federation of Gynecology and Obstetrics
- GI
Gastrointestinal
- GWAS
Genome-wide association studies
- HR
Hazard ratio
- HELLP
Hemolysis, elevated liver enzyme, low platelet
- IAD
Inter-arm difference
- ICSI
Intra-cytoplasmic sperm injection
- IGF
Insulin-like growth factor
- IQ
Intelligence quotient
- ISSHP
International Society for the Study of Hypertension in Pregnancy
- IUFD
Intrauterine fetal death
- IUI
Intrauterine insemination
- IVF
In vitro fertilization
- MAP
Mean arterial pressure
- MoM
Multiple of median
- NCDs
Non-communicable diseases
- NHFA
National Heart Foundation of Australia
- NICE
National Institute for Health and Care Excellence
- NICU
Neonatal intensive care unit
- OR
Odds ratio
- PAPP-A
Pregnancy associated plasma protein-A
- PE
Preeclampsia
- PlGF
Placental growth factor
- POC
Point of Care
- RR
Relative risk
- sBP
Systolic blood pressure
- SD
Standard deviation
- SGA
Small for gestational age
- SLE
Systemic lupus erythematosus
- UA
Umbilical artery
- USA
United States of America
- UK
United Kingdom
- UTPI
Uterine artery pulsatility index
- VEGF
Vascular endothelial growth factor
- VEGF-R1
Vascular endothelial growth factor receptor 1
Footnotes
Disclosure: The authors have no conflicts of interest to declare.
Supporting Information
Additional supporting information may be found online in the Supporting Information section at the end of the article.
REFERENCES
- 1.FIGO Working Group on Good Clinical Practice in Maternal–Fetal Medicine. Good clinical practice advice: First trimester screening and prevention of pre-eclampsia in singleton pregnancy. Int J Gynecol Obstet. 2019;144:325–329. [DOI] [PubMed] [Google Scholar]
- 2.Tranquilli AL, Dekker G, Magee L, et al. The classification, diagnosis and management of the hypertensive disorders of pregnancy: A revised statement from the ISSHP. Pregnancy Hypertens. 2014; 4: 97–104. [DOI] [PubMed] [Google Scholar]
- 3.Magee LA, Pels A, Helewa M, Rey E, von Dadelszen P. Canadian Hypertensive Disorders of Pregnancy Working G. Diagnosis, evaluation, and management of the hypertensive disorders of pregnancy. Pregnancy Hypertens 2014; 4: 105–45. [DOI] [PubMed] [Google Scholar]
- 4.Lowe SA, Bowyer L, Lust K, et al. SOMANZ guidelines for the management of hypertensive disorders of pregnancy 2014. Aust N Z J Obstet Gynaecol 2015; 55: e1–29. [DOI] [PubMed] [Google Scholar]
- 5.Brown MA, Magee LA, Kenny LC, et al. The hypertensive disorders of pregnancy: ISSHP classification, diagnosis & management recommendations for international practice. Pregnancy Hypertens 2018; 13: 291–310. [DOI] [PubMed] [Google Scholar]
- 6.Villar J, Say L, Gulmezoglu AM, Meraldi M, Lindheimer MD, Betran APPG. Eclampsia and pre-eclampsia: a health problem for 2000 years In Pre-eclampsia. Critchly H, MacLean A, Post L, Walk J, eds London, RCOG Press; 2003; : 189–207. [Google Scholar]
- 7.Ronsmans C, Graham WJ. Maternal mortality: who, when, where, and why. Lancet (London, England) 2006; 368: 1189–1200. [DOI] [PubMed] [Google Scholar]
- 8.Kuklina EV, Ayala C, Callaghan WM. Hypertensive disorders and severe obstetric morbidity in the United States. Obstet Gynecol 2009; 113: 1299–306. [DOI] [PubMed] [Google Scholar]
- 9.Lisonkova S, Joseph KS. Incidence of preeclampsia: risk factors and outcomes associated with early- versus late-onset disease. Am J Obstet Gynecol 2013; 209: 544.e1–544.e12. [DOI] [PubMed] [Google Scholar]
- 10.Lisonkova S, Sabr Y, Mayer C, Young C, Skoll A, Joseph KS. Maternal morbidity associated with early-onset and late-onset preeclampsia. Obstet Gynecol 2014; 124: 771–81. [DOI] [PubMed] [Google Scholar]
- 11.Redman CW, Sargent IL. Latest advances in understanding preeclampsia. Science 2005; 308: 1592–4. [DOI] [PubMed] [Google Scholar]
- 12.Jim B, Karumanchi SA. Preeclampsia: Pathogenesis, Prevention, and Long-Term Complications. Semin Nephrol 2017; 37: 386–97. [DOI] [PubMed] [Google Scholar]
- 13.Chaiworapongsa T, Chaemsaithong P, Yeo L, Romero R. Pre-eclampsia part 1: Current understanding of its pathophysiology. Nat Rev Nephrol 2014; 10: 466–80. [DOI] [PMC free article] [PubMed] [Google Scholar]
- 14.Thilaganathan B Pre-eclampsia and the cardiovascular-placental axis. Ultrasound Obstet Gynecol 2018; 51: 714–7. [DOI] [PubMed] [Google Scholar]
- 15.World Health Organization. WHO recommendations for prevention and treatment of pre-eclampsia and eclampsia. Geneva: WHO; 2011. [PubMed] [Google Scholar]
- 16.National Collaborating Centre for Women’s and Children’s Health (UK). Hypertension in pregnancy: the management of hypertensive disorders during pregnancy. London: RCOG Press; 2010. [PubMed] [Google Scholar]
- 17.American College of Obstetricians and Gynecologists; Task Force on Hypertension in Pregnancy. Hypertension in pregnancy. Report of the American College of Obstetricians and Gynecologists’ Task Force on Hypertension in Pregnancy. Obstet Gynecol. 2013;122:1122–1131. [DOI] [PubMed] [Google Scholar]
- 18.Lowe SA, Brown MA, Dekker GA, et al. Guidelines for the management of hypertensive disorders of pregnancy 2008. Aust N Z J Obstet Gynaecol 2009; 49: 242–6. [DOI] [PubMed] [Google Scholar]
- 19.Khalil A, Syngelaki A, Maiz N, Zinevich Y, Nicolaides KH. Maternal age and adverse pregnancy outcome: a cohort study. Ultrasound Obstet Gynecol 2013; 42: 634–43. [DOI] [PubMed] [Google Scholar]
- 20.Lamminpaa R, Vehvilainen-Julkunen K, Gissler M, Heinonen S. Preeclampsia complicated by advanced maternal age: a registry-based study on primiparous women in Finland 1997–2008. BMC Pregnancy Childbirth 2012; 12: 47. [DOI] [PMC free article] [PubMed] [Google Scholar]
- 21.Yogev Y, Melamed N, Bardin R, Tenenbaum-Gavish K, Ben-Shitrit G, Ben-Haroush A. Pregnancy outcome at extremely advanced maternal age. Am J Obstet Gynecol 2010; 203: 558.e1–7. [DOI] [PubMed] [Google Scholar]
- 22.Balasch J, Gratacos E. Delayed childbearing: effects on fertility and the outcome of pregnancy. Curr Opin Obstet Gynecol 2012; 24: 187–93. [DOI] [PubMed] [Google Scholar]
- 23.Poon LCY, Kametas NA, Chelemen T, Leal A, Nicolaides KH. Maternal risk factors for hypertensive disorders in pregnancy: a multivariate approach. J Hum Hypertens 2010; 24: 104–10. [DOI] [PubMed] [Google Scholar]
- 24.Duckitt K, Harrington D. Risk factors for pre-eclampsia at antenatal booking: systematic review of controlled studies. BMJ 2005; 330: 565. [DOI] [PMC free article] [PubMed] [Google Scholar]
- 25.Luo Z-C, An N, Xu H-R, Larante A, Audibert F, Fraser WD. The effects and mechanisms of primiparity on the risk of pre-eclampsia: a systematic review. Paediatr Perinat Epidemiol 2007; 21 Suppl 1: 36–45. [DOI] [PubMed] [Google Scholar]
- 26.Robillard PY, Hulsey TC, Alexander GR, Keenan A, de Caunes F, Papiernik E. Paternity patterns and risk of preeclampsia in the last pregnancy in multiparae. J Reprod Immunol 1993; 24: 1–12. [DOI] [PubMed] [Google Scholar]
- 27.Hernandez-Diaz S, Toh S, Cnattingius S. Risk of pre-eclampsia in first and subsequent pregnancies: prospective cohort study. BMJ 2009; 338: b2255. [DOI] [PMC free article] [PubMed] [Google Scholar]
- 28.Campbell DM, MacGillivray I, Carr-Hill R. Pre-eclampsia in second pregnancy. Br J Obstet Gynaecol 1985; 92: 131–40. [DOI] [PubMed] [Google Scholar]
- 29.Sibai BM, el-Nazer A, Gonzalez-Ruiz A. Severe preeclampsia-eclampsia in young primigravid women: subsequent pregnancy outcome and remote prognosis. Am J Obstet Gynecol 1986; 155: 1011–6. [DOI] [PubMed] [Google Scholar]
- 30.Lie RT, Rasmussen S, Brunborg H, Gjessing HK, Lie-Nielsen E, Irgens LM. Fetal and maternal contributions to risk of pre-eclampsia: population based study. BMJ 1998; 316: 1343–7. [DOI] [PMC free article] [PubMed] [Google Scholar]
- 31.Odegard RA, Vatten LJ, Nilsen ST, Salvesen KA, Austgulen R. Risk factors and clinical manifestations of pre-eclampsia. BJOG 2000; 107: 1410–6. [DOI] [PubMed] [Google Scholar]
- 32.van Rijn BB, Hoeks LB, Bots ML, Franx A, Bruinse HW. Outcomes of subsequent pregnancy after first pregnancy with early-onset preeclampsia. Am J Obstet Gynecol 2006; 195: 723–8. [DOI] [PubMed] [Google Scholar]
- 33.Langenveld J, Jansen S, van der Post J, Wolf H, Mol BW, Ganzevoort W. Recurrence risk of a delivery before 34 weeks of pregnancy due to an early onset hypertensive disorder: a systematic review. Am J Perinatol 2010; 27: 565–71. [DOI] [PubMed] [Google Scholar]
- 34.Rousso D, Panidis D, Gkoutzioulis F, Kourtis A, Mavromatidis G, Kalahanis I. Effect of the interval between pregnancies on the health of mother and child. Eur J Obstet Gynecol Reprod Biol 2002; 105: 4–6. [DOI] [PubMed] [Google Scholar]
- 35.King JC. The risk of maternal nutritional depletion and poor outcomes increases in early or closely spaced pregnancies. J Nutr 2003; 133: 1732S–1736S. [DOI] [PubMed] [Google Scholar]
- 36.Conde-Agudelo A, Rosas-Bermudez A, Kafury-Goeta AC. Effects of birth spacing on maternal health: a systematic review. Am J Obstet Gynecol 2007; 196: 297–308. [DOI] [PubMed] [Google Scholar]
- 37.Mignini LE, Carroli G, Betran AP, et al. Interpregnancy interval and perinatal outcomes across Latin America from 1990 to 2009: a large multi-country study. BJOG 2016; 123: 730–7. [DOI] [PMC free article] [PubMed] [Google Scholar]
- 38.Winikoff B The effects of birth spacing on child and maternal health. Stud Fam Plann 1983; 14: 231–45. [PubMed] [Google Scholar]
- 39.Klebanoff MA. The interval between pregnancies and the outcome of subsequent births. N. Engl. J. Med 1999; 340: 643–4. [DOI] [PubMed] [Google Scholar]
- 40.Jackson RA, Gibson KA, Wu YW, Croughan MS. Perinatal outcomes in singletons following in vitro fertilization: a meta-analysis. Obstet Gynecol 2004; 103: 551–63. [DOI] [PubMed] [Google Scholar]
- 41.Trogstad L, Magnus P, Moffett A, Stoltenberg C. The effect of recurrent miscarriage and infertility on the risk of pre-eclampsia. BJOG 2009; 116: 108–13. [DOI] [PubMed] [Google Scholar]
- 42.Pandey S, Shetty A, Hamilton M, Bhattacharya S, Maheshwari A. Obstetric and perinatal outcomes in singleton pregnancies resulting from IVF/ICSI: a systematic review and meta-analysis. Hum Reprod Update 2012; 18: 485–503. [DOI] [PubMed] [Google Scholar]
- 43.Thomopoulos C, Tsioufis C, Michalopoulou H, Makris T, Papademetriou V, Stefanadis C. Assisted reproductive technology and pregnancy-related hypertensive complications: a systematic review. J Hum Hypertens 2013; 27: 148–57. [DOI] [PubMed] [Google Scholar]
- 44.Martin AS, Monsour M, Kawwass JF, Boulet SL, Kissin DM, Jamieson DJ. Risk of Preeclampsia in Pregnancies After Assisted Reproductive Technology and Ovarian Stimulation. Matern Child Health J 2016; 20: 2050–6. [DOI] [PMC free article] [PubMed] [Google Scholar]
- 45.Albrecht ED, Bonagura TW, Burleigh DW, Enders AC, Aberdeen GW, Pepe GJ. Suppression of extravillous trophoblast invasion of uterine spiral arteries by estrogen during early baboon pregnancy. Placenta 2006; 27: 483–90. [DOI] [PubMed] [Google Scholar]
- 46.Imudia AN, Awonuga AO, Doyle JO, et al. Peak serum estradiol level during controlled ovarian hyperstimulation is associated with increased risk of small for gestational age and preeclampsia in singleton pregnancies after in vitro fertilization. Fertil Steril 2012; 97: 1374–9. [DOI] [PubMed] [Google Scholar]
- 47.Fisher SJ. Why is placentation abnormal in preeclampsia? Am J Obstet Gynecol 2015; 213: S115–122. [DOI] [PMC free article] [PubMed] [Google Scholar]
- 48.Smith GN, Walker M, Tessier JL, Millar KG. Increased incidence of preeclampsia in women conceiving by intrauterine insemination with donor versus partner sperm for treatment of primary infertility. Am J Obstet Gynecol 1997; 177: 455–8. [DOI] [PubMed] [Google Scholar]
- 49.Hoy J, Venn A, Halliday J, Kovacs G, Waalwyk K. Perinatal and obstetric outcomes of donor insemination using cryopreserved semen in Victoria, Australia. Hum Reprod 1999; 14: 1760–4. [DOI] [PubMed] [Google Scholar]
- 50.Salha O, Sharma V, Dada T, et al. The influence of donated gametes on the incidence of hypertensive disorders of pregnancy. Hum Reprod 1999; 14: 2268–73. [DOI] [PubMed] [Google Scholar]
- 51.Need JA, Bell B, Meffin E, Jones WR. Pre-eclampsia in pregnancies from donor inseminations. J Reprod Immunol 1983; 5: 329–38. [DOI] [PubMed] [Google Scholar]
- 52.Simeone S, Serena C, Rambaldi MP, Marchi L, Mello G, Mecacci F. Risk of preeclampsia and obstetric outcome in donor oocyte and autologous in vitro fertilization pregnancies. Minerva Ginecol 2016; 68: 9–14. [PubMed] [Google Scholar]
- 53.Nakabayashi Y, Nakashima A, Yoshino O, et al. Impairment of the accumulation of decidual T cells, NK cells, and monocytes, and the poor vascular remodeling of spiral arteries, were observed in oocyte donation cases, regardless of the presence or absence of preeclampsia. J Reprod Immunol 2016; 114: 65–74. [DOI] [PubMed] [Google Scholar]
- 54.Arngrimsson R, Bjornsson S, Geirsson RT, Bjornsson H, Walker JJ, Snaedal G. Genetic and familial predisposition to eclampsia and pre-eclampsia in a defined population. Br J Obstet Gynaecol 1990; 97: 762–9. [DOI] [PubMed] [Google Scholar]
- 55.Cincotta RB, Brennecke SP. Family history of pre-eclampsia as a predictor for pre-eclampsia in primigravidas. Int J Gynaecol Obstet 1998; 60: 23–7. [DOI] [PubMed] [Google Scholar]
- 56.Williams PJ, Broughton Pipkin F. The genetics of pre-eclampsia and other hypertensive disorders of pregnancy. Best Pract Res Clin Obstet Gynaecol 2011; 25: 405–17. [DOI] [PMC free article] [PubMed] [Google Scholar]
- 57.Zintzaras E, Kitsios G, Harrison GA, et al. Heterogeneity-based genome search meta-analysis for preeclampsia. Hum Genet 2006; 120: 360–70. [DOI] [PubMed] [Google Scholar]
- 58.Cnattingius S, Bergstrom R, Lipworth L, Kramer MS. Prepregnancy weight and the risk of adverse pregnancy outcomes. N Engl J Med 1998; 338: 147–52. [DOI] [PubMed] [Google Scholar]
- 59.Weiss JL, Malone FD, Emig D, et al. Obesity, obstetric complications and cesarean delivery rate--a population-based screening study. Am J Obstet Gynecol 2004; 190: 1091–7. [DOI] [PubMed] [Google Scholar]
- 60.Leung TY, Leung TN, Sahota DS, et al. Trends in maternal obesity and associated risks of adverse pregnancy outcomes in a population of Chinese women. BJOG 2008; 115: 1529–37. [DOI] [PubMed] [Google Scholar]
- 61.Syngelaki A, Bredaki FE, Vaikousi E, Maiz N, Nicolaides KH. Body mass index at 11–13 weeks’ gestation and pregnancy complications. Fetal Diagn Ther 2011; 30: 250–65. [DOI] [PubMed] [Google Scholar]
- 62.Liu L, Hong Z, Zhang L. Associations of prepregnancy body mass index and gestational weight gain with pregnancy outcomes in nulliparous women delivering single live babies. Sci Rep 2015; 5: 12863. [DOI] [PMC free article] [PubMed] [Google Scholar]
- 63.Rahman MM, Abe SK, Kanda M, et al. Maternal body mass index and risk of birth and maternal health outcomes in low- and middle-income countries: a systematic review and meta-analysis. Obes Rev 2015; 16: 758–70. [DOI] [PubMed] [Google Scholar]
- 64.Wei Y-M, Yang H-X, Zhu W-W, et al. Risk of adverse pregnancy outcomes stratified for pre-pregnancy body mass index. J Matern Fetal Neonatal Med 2016; 29: 2205–9. [DOI] [PubMed] [Google Scholar]
- 65.Catalano PM. Obesity, insulin resistance, and pregnancy outcome. Reproduction 2010; 140: 365–71. [DOI] [PMC free article] [PubMed] [Google Scholar]
- 66.Gregor MF, Hotamisligil GS. Inflammatory mechanisms in obesity. Annu Rev Immunol 2011; 29: 415–45. [DOI] [PubMed] [Google Scholar]
- 67.Spradley FT, Palei AC, Granger JP. Immune Mechanisms Linking Obesity and Preeclampsia. Biomolecules 2015; 5: 3142–76. [DOI] [PMC free article] [PubMed] [Google Scholar]
- 68.Mittendorf R, Lain KY, Williams MA, Walker CK. Preeclampsia. A nested, case-control study of risk factors and their interactions. J Reprod Med 1996; 41: 491–6. [PubMed] [Google Scholar]
- 69.Knuist M, Bonsel GJ, Zondervan HA, Treffers PE. Risk factors for preeclampsia in nulliparous women in distinct ethnic groups: a prospective cohort study. Obstet Gynecol 1998; 92: 174–8. [DOI] [PubMed] [Google Scholar]
- 70.Mostello D, Catlin TK, Roman L, Holcomb WLJ, Leet T. Preeclampsia in the parous woman: who is at risk? Am J Obstet Gynecol 2002; 187: 425–9. [DOI] [PubMed] [Google Scholar]
- 71.Caughey AB, Stotland NE, Washington AE, Escobar GJ. Maternal ethnicity, paternal ethnicity, and parental ethnic discordance: predictors of preeclampsia. Obstet Gynecol 2005; 106: 156–61. [DOI] [PubMed] [Google Scholar]
- 72.Ghosh G, Grewal J, Mannisto T, et al. Racial/ethnic differences in pregnancy-related hypertensive disease in nulliparous women. Ethn Dis 2014; 24: 283–9. [PMC free article] [PubMed] [Google Scholar]
- 73.Russell RB, Green NS, Steiner CA, et al. Cost of hospitalization for preterm and low birth weight infants in the United States. Pediatrics 2007; 120: e1–9. [DOI] [PubMed] [Google Scholar]
- 74.Burt VL, Whelton P, Roccella EJ, et al. Prevalence of hypertension in the US adult population. Results from the Third National Health and Nutrition Examination Survey, 1988–1991. Hypertens (Dallas, Tex 1979) 1995; 25: 305–13. [DOI] [PubMed] [Google Scholar]
- 75.Kestenbaum B, Seliger SL, Easterling TR, et al. Cardiovascular and thromboembolic events following hypertensive pregnancy. Am J Kidney Dis 2003; 42: 982–9. [DOI] [PubMed] [Google Scholar]
- 76.Bellamy L, Casas J-P, Hingorani AD, Williams DJ. Pre-eclampsia and risk of cardiovascular disease and cancer in later life: systematic review and meta-analysis. BMJ 2007; 335: 974. [DOI] [PMC free article] [PubMed] [Google Scholar]
- 77.Khalil A, Rezende J, Akolekar R, Syngelaki A, Nicolaides KH. Maternal racial origin and adverse pregnancy outcome: a cohort study. Ultrasound Obstet Gynecol 2013; 41: 278–85. [DOI] [PubMed] [Google Scholar]
- 78.Bartsch E, Medcalf KE, Park AL, Ray JG. Clinical risk factors for pre-eclampsia determined in early pregnancy: systematic review and meta-analysis of large cohort studies. BMJ 2016; 353: i1753. [DOI] [PMC free article] [PubMed] [Google Scholar]
- 79.Mudd LM, Owe KM, Mottola MF, Pivarnik JM. Health benefits of physical activity during pregnancy: an international perspective. Med Sci Sports Exerc 2013; 45: 268–77. [DOI] [PubMed] [Google Scholar]
- 80.Schneider S, Freerksen N, Rohrig S, Hoeft B, Maul H. Gestational diabetes and preeclampsia--similar risk factor profiles? Early Hum Dev 2012; 88: 179–84. [DOI] [PubMed] [Google Scholar]
- 81.Conti E, Zezza L, Ralli E, et al. Growth factors in preeclampsia: a vascular disease model. A failed vasodilation and angiogenic challenge from pregnancy onwards? Cytokine Growth Factor Rev 2013; 24: 411–25. [DOI] [PubMed] [Google Scholar]
- 82.de R Guimaraes MFB, Brandao AHF, de L Rezende CA, et al. Assessment of endothelial function in pregnant women with preeclampsia and gestational diabetes mellitus by flow-mediated dilation of brachial artery. Arch Gynecol Obstet 2014; 290: 441–7. [DOI] [PubMed] [Google Scholar]
- 83.Kane SC, Costa F da S, Brennecke S. First trimester biomarkers in the prediction of later pregnancy complications. Biomed Res Int 2014; 2014: 807196. [DOI] [PMC free article] [PubMed] [Google Scholar]
- 84.Karacay O, Sepici-Dincel A, Karcaaltincaba D, et al. A quantitative evaluation of total antioxidant status and oxidative stress markers in preeclampsia and gestational diabetic patients in 24–36 weeks of gestation. Diabetes Res Clin Pract 2010; 89: 231–8. [DOI] [PubMed] [Google Scholar]
- 85.Wiznitzer A, Mayer A, Novack V, et al. Association of lipid levels during gestation with preeclampsia and gestational diabetes mellitus: a population-based study. Am J Obstet Gynecol 2009; 201: 482.e1–8. [DOI] [PMC free article] [PubMed] [Google Scholar]
- 86.Zhou J, Zhao X, Wang Z, Hu Y. Combination of lipids and uric acid in mid-second trimester can be used to predict adverse pregnancy outcomes. J Matern Fetal Neonatal Med 2012; 25: 2633–8. [DOI] [PubMed] [Google Scholar]
- 87.Engeland A, Bjorge T, Daltveit AK, et al. Risk of diabetes after gestational diabetes and preeclampsia. A registry-based study of 230,000 women in Norway. Eur J Epidemiol 2011; 26: 157–63. [DOI] [PMC free article] [PubMed] [Google Scholar]
- 88.Feig DS, Shah BR, Lipscombe LL, et al. Preeclampsia as a risk factor for diabetes: a population-based cohort study. PLoS Med 2013; 10: e1001425. [DOI] [PMC free article] [PubMed] [Google Scholar]
- 89.Libby G, Murphy DJ, McEwan NF, et al. Pre-eclampsia and the later development of type 2 diabetes in mothers and their children: an intergenerational study from the Walker cohort. Diabetologia 2007; 50: 523–30. [DOI] [PubMed] [Google Scholar]
- 90.Mannisto T, Mendola P, Vaarasmaki M, et al. Elevated blood pressure in pregnancy and subsequent chronic disease risk. Circulation 2013; 127: 681–90. [DOI] [PMC free article] [PubMed] [Google Scholar]
- 91.Parretti E, Lapolla A, Dalfra M, et al. Preeclampsia in lean normotensive normotolerant pregnant women can be predicted by simple insulin sensitivity indexes. Hypertens (Dallas, Tex 1979) 2006; 47: 449–53. [DOI] [PubMed] [Google Scholar]
- 92.Sierra-Laguado J, Garcia RG, Celedon J, et al. Determination of insulin resistance using the homeostatic model assessment (HOMA) and its relation with the risk of developing pregnancy-induced hypertension. Am J Hypertens 2007; 20: 437–42. [DOI] [PubMed] [Google Scholar]
- 93.Legro RS. Insulin resistance in women’s health: why it matters and how to identify it. Curr Opin Obstet Gynecol 2009; 21: 301–5. [DOI] [PMC free article] [PubMed] [Google Scholar]
- 94.Ryan EA, Imes S, Liu D, et al. Defects in insulin secretion and action in women with a history of gestational diabetes. Diabetes 1995; 44: 506–12. [DOI] [PubMed] [Google Scholar]
- 95.D’Anna R, Baviera G, Corrado F, et al. Adiponectin and insulin resistance in early- and late-onset pre-eclampsia. BJOG 2006; 113: 1264–9. [DOI] [PubMed] [Google Scholar]
- 96.Soonthornpun K, Soonthornpun S, Wannaro P, Setasuban W, Thamprasit A. Insulin resistance in women with a history of severe pre-eclampsia. J Obstet Gynaecol Res 2009; 35: 55–9. [DOI] [PubMed] [Google Scholar]
- 97.Fuh MM-T, Yin C-S, Pei D, et al. Resistance to Insulin-Mediated Glucose Uptake and Hyperinsulinemia in Women Who Had Preeclampsia During Pregnancy*. Am J Hypertens 1995; 8: 768–71. [DOI] [PubMed] [Google Scholar]
- 98.Ray JG.Dysmetabolic syndrome, placenta-mediated disease and future risk of cardiovascular disease. Fetal Matern Med Rev 2004; 15: 231–46. [Google Scholar]
- 99.Harborne L, Fleming R, Lyall H, Sattar N, Norman J. Metformin or antiandrogen in the treatment of hirsutism in polycystic ovary syndrome. J Clin Endocrinol Metab 2003; 88: 4116–23. [DOI] [PubMed] [Google Scholar]
- 100.Girouard J, Giguere Y, Moutquin J-M, Forest J-C. Previous hypertensive disease of pregnancy is associated with alterations of markers of insulin resistance. Hypertens (Dallas, Tex 1979) 2007; 49: 1056–62. [DOI] [PubMed] [Google Scholar]
- 101.Beck DW, Menezes AH. Intracerebral hemorrhage in a patient with eclampsia. JAMA 1981; 246: 1442–3. [PubMed] [Google Scholar]
- 102.Zhang J, Meikle S, Trumble A. Severe maternal morbidity associated with hypertensive disorders in pregnancy in the United States. Hypertens pregnancy 2003; 22: 203–12. [DOI] [PubMed] [Google Scholar]
- 103.Chesley LC, Annitto JE, Cosgrove RA. The remote prognosis of eclamptic women. Sixth periodic report. Am J Obstet Gynecol 1976; 124: 446–59. [DOI] [PubMed] [Google Scholar]
- 104.Kaaja R Insulin resistance syndrome in preeclampsia. Semin Reprod Endocrinol 1998; 16: 41–6. [DOI] [PubMed] [Google Scholar]
- 105.Garovic VD, Hayman SR. Hypertension in pregnancy: an emerging risk factor for cardiovascular disease. Nat Clin Pract Nephrol 2007; 3: 613–22. [DOI] [PubMed] [Google Scholar]
- 106.Craici I, Wagner S, Garovic VD. Preeclampsia and future cardiovascular risk: formal risk factor or failed stress test? Ther Adv Cardiovasc Dis 2008; 2: 249–59. [DOI] [PMC free article] [PubMed] [Google Scholar]
- 107.Brown MC, Best KE, Pearce MS, Waugh J, Robson SC, Bell R. Cardiovascular disease risk in women with pre-eclampsia: systematic review and meta-analysis. Eur J Epidemiol 2013; 28: 1–19. [DOI] [PubMed] [Google Scholar]
- 108.McDonald SD, Malinowski A, Zhou Q, Yusuf S, Devereaux PJ. Cardiovascular sequelae of preeclampsia/eclampsia: a systematic review and meta-analyses. Am Heart J 2008; 156: 918–30. [DOI] [PubMed] [Google Scholar]
- 109.McDonald SD, Han Z, Walsh MW, Gerstein HC, Devereaux PJ. Kidney disease after preeclampsia: a systematic review and meta-analysis. Am J Kidney Dis 2010; 55: 1026–39. [DOI] [PubMed] [Google Scholar]
- 110.Fisher KA, Luger A, Spargo BH, Lindheimer MD. Hypertension in pregnancy: clinical-pathological correlations and remote prognosis. Medicine (Baltimore) 1981; 60: 267–76. [PubMed] [Google Scholar]
- 111.Vikse BE, Irgens LM, Leivestad T, Skjaerven R, Iversen BM. Preeclampsia and the risk of end-stage renal disease. N Engl J Med 2008; 359: 800–9. [DOI] [PubMed] [Google Scholar]
- 112.Callaway LK, Lawlor DA, O’Callaghan M, Williams GM, Najman JM, McIntyre HD. Diabetes mellitus in the 21 years after a pregnancy that was complicated by hypertension: findings from a prospective cohort study. Am J Obstet Gynecol 2007; 197: 492.e1–7. [DOI] [PubMed] [Google Scholar]
- 113.Carr DB, Newton KM, Utzschneider KM, et al. Preeclampsia and risk of developing subsequent diabetes. Hypertens pregnancy 2009; 28: 435–47. [DOI] [PubMed] [Google Scholar]
- 114.Carty DM, Delles C, Dominiczak AF. Preeclampsia and future maternal health. J Hypertens 2010; 28: 1349–55. [DOI] [PubMed] [Google Scholar]
- 115.Yu CKH, Khouri O, Onwudiwe N, Spiliopoulos Y, Nicolaides KH. Prediction of pre-eclampsia by uterine artery Doppler imaging: relationship to gestational age at delivery and small-for-gestational age. Ultrasound Obstet Gynecol 2008; 31: 310–3. [DOI] [PubMed] [Google Scholar]
- 116.Teramo KA, Hiilesmaa VK, Schwartz R, Clemons GK, Widness JA. Amniotic fluid and cord plasma erythropoietin levels in pregnancies complicated by preeclampsia, pregnancy-induced hypertension and chronic hypertension. J Perinat Med 2004; 32: 240–7. [DOI] [PubMed] [Google Scholar]
- 117.Aali BS, Malekpour R, Sedig F, Safa A. Comparison of maternal and cord blood nucleated red blood cell count between pre-eclamptic and healthy women. J Obstet Gynaecol Res 2007; 33: 274–8. [DOI] [PubMed] [Google Scholar]
- 118.Yucesoy G, Ozkan S, Bodur H, et al. Maternal and perinatal outcome in pregnancies complicated with hypertensive disorder of pregnancy: a seven year experience of a tertiary care center. Arch Gynecol Obstet 2005; 273: 43–9. [DOI] [PubMed] [Google Scholar]
- 119.Duley L The Global Impact of Pre-eclampsia and Eclampsia. Semin Perinatol 2009; 33: 130–7. [DOI] [PubMed] [Google Scholar]
- 120.Yerlikaya G, Akolekar R, McPherson K, Syngelaki A, Nicolaides KH. Prediction of stillbirth from maternal demographic and pregnancy characteristics. Ultrasound Obstet Gynecol 2016; 48: 607–12. [DOI] [PubMed] [Google Scholar]
- 121.Moutquin J-M. Classification and heterogeneity of preterm birth. BJOG 2003; 110 Suppl: 30–3. [DOI] [PubMed] [Google Scholar]
- 122.Ilekis JV, Reddy UM, Roberts JM. Preeclampsia--a pressing problem: an executive summary of a National Institute of Child Health and Human Development workshop. Reprod Sci 2007; 14: 508–23. [DOI] [PubMed] [Google Scholar]
- 123.Marlow N, Wolke D, Bracewell MA, Samara M. Neurologic and developmental disability at six years of age after extremely preterm birth. N Engl J Med 2005; 352: 9–19. [DOI] [PubMed] [Google Scholar]
- 124.Khashu M, Narayanan M, Bhargava S, Osiovich H. Perinatal outcomes associated with preterm birth at 33 to 36 weeks’ gestation: a population-based cohort study. Pediatrics 2009; 123: 109–13. [DOI] [PubMed] [Google Scholar]
- 125.Osmond C, Barker DJ. Fetal, infant, and childhood growth are predictors of coronary heart disease, diabetes, and hypertension in adult men and women. Environ Health Perspect 2000; 108 Suppl: 545–53. [DOI] [PMC free article] [PubMed] [Google Scholar]
- 126.Bibbins-Domingo K, Grossman DC, Curry SJ, et al. Screening for Preeclampsia: US Preventive Services Task Force Recommendation Statement. JAMA 2017; 317: 1661–7. [DOI] [PubMed] [Google Scholar]
- 127.Committee Opinion No. 638: First-Trimester Risk Assessment for Early-Onset Preeclampsia. Obstet Gynecol 2015; 126: e25–7. [DOI] [PubMed] [Google Scholar]
- 128.ACOG Committee Opinion No. 743 Summary: Low-Dose Aspirin Use During Pregnancy. Obstet Gynecol 2018; 132: 254–6. [DOI] [PubMed] [Google Scholar]
- 129.LeFevre ML. Low-dose aspirin use for the prevention of morbidity and mortality from preeclampsia: U.S. Preventive Services Task Force recommendation statement. Ann Intern Med 2014; 161: 819–26. [DOI] [PubMed] [Google Scholar]
- 130.American Diabetes Association. 13. Management of Diabetes in Pregnancy: Standards of Medical Care in Diabetes-2018. Diabetes Care 2018; 41: S137–S143. [DOI] [PubMed] [Google Scholar]
- 131.Wallenburg HC. Prevention of pre-eclampsia: status and perspectives 2000. Eur J Obstet Gynecol Reprod Biol 2001; 94: 13–22. [DOI] [PubMed] [Google Scholar]
- 132.O’Gorman N, Wright D, Poon LC, et al. Multicenter screening for pre-eclampsia by maternal factors and biomarkers at 11–13 weeks’ gestation: comparison with NICE guidelines and ACOG recommendations. Ultrasound Obstet Gynecol 2017; 49: 756–60. [DOI] [PubMed] [Google Scholar]
- 133.Akolekar R, Syngelaki A, Poon L, Wright D, Nicolaides KH. Competing risks model in early screening for preeclampsia by biophysical and biochemical markers. Fetal Diagn Ther 2013; 33: 8–15. [DOI] [PubMed] [Google Scholar]
- 134.O’Gorman N, Wright D, Syngelaki A, et al. Competing risks model in screening for preeclampsia by maternal factors and biomarkers at 11–13 weeks gestation. Am J Obstet Gynecol 2016; 214: 103.e1–103.e12. [DOI] [PubMed] [Google Scholar]
- 135.O’Gorman N, Wright D, Poon LC, et al. Accuracy of competing-risks model in screening for pre-eclampsia by maternal factors and biomarkers at 11–13 weeks’ gestation. Ultrasound Obstet Gynecol 2017; 49: 751–5. [DOI] [PubMed] [Google Scholar]
- 136.Rolnik DL, Wright D, Poon LCY, et al. ASPRE trial: performance of screening for preterm pre-eclampsia. Ultrasound Obstet Gynecol 2017; 50: 492–5. [DOI] [PubMed] [Google Scholar]
- 137.Tan MY, Wright D, Syngelaki A, et al. Comparison of diagnostic accuracy of early screening for pre-eclampsia by NICE guidelines and a method combining maternal factors and biomarkers: results of SPREE. Ultrasound Obstet Gynecol 2018; 51: 743–50. [DOI] [PubMed] [Google Scholar]
- 138.Tan MY, Syngelaki A, Poon LC, et al. Screening for pre-eclampsia by maternal factors and biomarkers at 11–13 weeks’ gestation. Ultrasound Obstet Gynecol 2018; 52: 186–95. [DOI] [PubMed] [Google Scholar]
- 139.Poon LC, Rolnik DL, Tan MY, et al. ASPRE trial: incidence of preterm pre-eclampsia in patients fulfilling ACOG and NICE criteria according to risk by FMF algorithm. Ultrasound Obstet Gynecol 2018; 51: 738–42. [DOI] [PubMed] [Google Scholar]
- 140.Park FJ, Leung CHY, Poon LCY, Williams PF, Rothwell SJ, Hyett JA. Clinical evaluation of a first trimester algorithm predicting the risk of hypertensive disease of pregnancy. Aust N Z J Obstet Gynaecol 2013; 53: 532–9. [DOI] [PubMed] [Google Scholar]
- 141.Oliveira N, Magder LS, Blitzer MG, Baschat AA. First-trimester prediction of pre-eclampsia: external validity of algorithms in a prospectively enrolled cohort. Ultrasound Obstet Gynecol 2014; 44: 279–85. [DOI] [PubMed] [Google Scholar]
- 142.Lobo GAR, Nowak PM, Panigassi AP, et al. Validation of Fetal Medicine Foundation algorithm for prediction of pre-eclampsia in the first trimester in an unselected Brazilian population. J Matern Fetal Neonatal Med 2019; 32: 286–92. [DOI] [PubMed] [Google Scholar]
- 143.Rocha RS, Alves JAG, Maia E Holanda Moura SB, et al. Simple approach based on maternal characteristics and mean arterial pressure for the prediction of preeclampsia in the first trimester of pregnancy. J Perinat Med 2017; 45: 843–9. [DOI] [PubMed] [Google Scholar]
- 144.Wright D, Syngelaki A, Akolekar R, Poon LC, Nicolaides KH. Competing risks model in screening for preeclampsia by maternal characteristics and medical history. Am J Obstet Gynecol 2015; 213: 62.e1–62.e10. [DOI] [PubMed] [Google Scholar]
- 145.Poon LCY, Zymeri NA, Zamprakou A, Syngelaki A, Nicolaides KH. Protocol for measurement of mean arterial pressure at 11–13 weeks’ ‘estation. Fetal Diagn Ther 2012; 31: 42–8. [DOI] [PubMed] [Google Scholar]
- 146.Wright A, Wright D, Ispas CA, Poon LC, Nicolaides KH. Mean arterial pressure in the three trimesters of pregnancy: effects of maternal characteristics and medical history. Ultrasound Obstet Gynecol 2015; 45: 698–706. [DOI] [PubMed] [Google Scholar]
- 147.Poon LCY, Kametas NA, Pandeva I, Valencia C, Nicolaides KH. Mean arterial pressure at 11(+0) to 13(+6) weeks in the prediction of preeclampsia. Hypertens (Dallas, Tex 1979) 2008; 51: 1027–33. [DOI] [PubMed] [Google Scholar]
- 148.National Heart Foundation of Australia. Hypertension Management Guide for Doctors. 2004. Website: www.heartfoundation.org.au. Accesses April 1, 2006.
- 149.Poon LCY, Kametas NA, Valencia C, Chelemen T, Nicolaides KH. Hypertensive disorders in pregnancy: screening by systolic diastolic and mean arterial pressure at 11–13 weeks. Hypertens pregnancy 2011; 30: 93–107. [DOI] [PubMed] [Google Scholar]
- 150.Poon LCY, Kametas N, Strobl I, Pachoumi C, Nicolaides KH. Inter-arm blood pressure differences in pregnant women. BJOG 2008; 115: 1122–30. [DOI] [PubMed] [Google Scholar]
- 151.Maynard SE, Min J-Y, Merchan J, et al. Excess placental soluble fms-like tyrosine kinase 1 (sFlt1) may contribute to endothelial dysfunction, hypertension, and proteinuria in preeclampsia. J Clin Invest 2003; 111: 649–58. [DOI] [PMC free article] [PubMed] [Google Scholar]
- 152.Levine RJ, Maynard SE, Qian C, et al. Circulating angiogenic factors and the risk of preeclampsia. N Engl J Med 2004; 350: 672–83. [DOI] [PubMed] [Google Scholar]
- 153.Ahmad S, Ahmed A. Elevated placental soluble vascular endothelial growth factor receptor-1 inhibits angiogenesis in preeclampsia. Circ Res 2004; 95: 884–91. [DOI] [PubMed] [Google Scholar]
- 154.Chau K, Hennessy A, Makris A. Placental growth factor and pre-eclampsia. J Hum Hypertens 2017; 31: 782–6. [DOI] [PMC free article] [PubMed] [Google Scholar]
- 155.Wortelboer EJ, Koster MPH, Kuc S, et al. Longitudinal trends in fetoplacental biochemical markers, uterine artery pulsatility index and maternal blood pressure during the first trimester of pregnancy. Ultrasound Obstet Gynecol 2011; 38: 383–8. [DOI] [PubMed] [Google Scholar]
- 156.Tidwell SC, Ho HN, Chiu WH, Torry RJ, Torry DS. Low maternal serum levels of placenta growth factor as an antecedent of clinical preeclampsia. Am J Obstet Gynecol 2001; 184: 1267–72. [DOI] [PubMed] [Google Scholar]
- 157.Thadhani R, Mutter WP, Wolf M, et al. First trimester placental growth factor and soluble fms-like tyrosine kinase 1 and risk for preeclampsia. J Clin Endocrinol Metab 2004; 89: 770–5. [DOI] [PubMed] [Google Scholar]
- 158.Akolekar R, Zaragoza E, Poon LCY, Pepes S, Nicolaides KH. Maternal serum placental growth factor at 11 + 0 to 13 + 6 weeks of gestation in the prediction of pre-eclampsia. Ultrasound Obstet Gynecol 2008; 32: 732–9. [DOI] [PubMed] [Google Scholar]
- 159.Zhong Y, Zhu F, Ding Y. Serum screening in first trimester to predict pre-eclampsia, small for gestational age and preterm delivery: systematic review and meta-analysis. BMC Pregnancy Childbirth 2015; 15: 191. [DOI] [PMC free article] [PubMed] [Google Scholar]
- 160.Smith GCS, Stenhouse EJ, Crossley JA, Aitken DA, Cameron AD, Connor JM. Early pregnancy levels of pregnancy-associated plasma protein a and the risk of intrauterine growth restriction, premature birth, preeclampsia, and stillbirth. J Clin Endocrinol Metab 2002; 87: 1762–7. [DOI] [PubMed] [Google Scholar]
- 161.Spencer K, Yu CKH, Cowans NJ, Otigbah C, Nicolaides KH. Prediction of pregnancy complications by first-trimester maternal serum PAPP-A and free beta-hCG and with second-trimester uterine artery Doppler. Prenat Diagn 2005; 25: 949–53. [DOI] [PubMed] [Google Scholar]
- 162.Dugoff L, Hobbins JC, Malone FD, et al. First-trimester maternal serum PAPP-A and free-beta subunit human chorionic gonadotropin concentrations and nuchal translucency are associated with obstetric complications: a population-based screening study (the FASTER Trial). Am J Obstet Gynecol 2004; 191: 1446–51. [DOI] [PubMed] [Google Scholar]
- 163.Morris RK, Bilagi A, Devani P, Kilby MD. Association of serum PAPP-A levels in first trimester with small for gestational age and adverse pregnancy outcomes: systematic review and meta-analysis. Prenat Diagn 2017; 37: 253–65. [DOI] [PubMed] [Google Scholar]
- 164.Wright D, Silva M, Papadopoulos S, Wright A, Nicolaides KH. Serum pregnancy-associated plasma protein-A in the three trimesters of pregnancy: effects of maternal characteristics and medical history. Ultrasound Obstet Gynecol 2015; 46: 42–50. [DOI] [PubMed] [Google Scholar]
- 165.Sotiriadis A, Hernandez-Andrade E, da Silva Costa F, et al. ISUOG Practice Guidelines: role of ultrasound in screening for and follow-up of pre-eclampsia. Ultrasound Obstet Gynecol 2019;53:7–22. [DOI] [PubMed] [Google Scholar]
- 166.Carbillon L, Perrot N, Uzan M, Uzan S. Doppler ultrasonography and implantation: a critical review. Fetal Diagn Ther 2001; 16: 327–32. [DOI] [PubMed] [Google Scholar]
- 167.Carbillon L, Challier JC, Alouini S, Uzan M, Uzan S. Uteroplacental circulation development: Doppler assessment and clinical importance. Placenta 2001; 22: 795–9. [DOI] [PubMed] [Google Scholar]
- 168.Olofsson P, Laurini RN, Marsal K. A high uterine artery pulsatility index reflects a defective development of placental bed spiral arteries in pregnancies complicated by hypertension and fetal growth retardation. Eur J Obstet Gynecol Reprod Biol 1993; 49: 161–8. [DOI] [PubMed] [Google Scholar]
- 169.Lefebvre J, Demers S, Bujold E, et al. Comparison of two different sites of measurement for transabdominal uterine artery Doppler velocimetry at 11–13 weeks. Ultrasound Obstet Gynecol 2012; 40: 288–92. [DOI] [PubMed] [Google Scholar]
- 170.Velauthar L, Plana MN, Kalidindi M, et al. First-trimester uterine artery Doppler and adverse pregnancy outcome: a meta-analysis involving 55,974 women. Ultrasound Obstet Gynecol 2014; 43: 500–7. [DOI] [PubMed] [Google Scholar]
- 171.Magee LA, Dadelszen PV, Stones WMM. The FIGO textbook of Pregnancy Hypertension An evidence-based guide to monitering, prevention and management. London: The Global Library of Woman’s Medicine, 2016. [Google Scholar]
- 172.Al-Rubaie Z, Askie LM, Ray JG, Hudson HM, Lord SJ. The performance of risk prediction models for pre-eclampsia using routinely collected maternal characteristics and comparison with models that include specialised tests and with clinical guideline decision rules: a systematic review. BJOG 2016; 123: 1441–52. [DOI] [PubMed] [Google Scholar]
- 173.Wright D, Gallo DM, Gil Pugliese S, Casanova C, Nicolaides KH. Contingent screening for preterm pre-eclampsia. Ultrasound Obstet Gynecol 2016; 47: 554–9. [DOI] [PubMed] [Google Scholar]
- 174.Francisco C, Wright D, Benkő Z, Syngelaki A, Nicolaides KH. Competing-risks model in screening for pre-eclampsia in twin pregnancy according to maternal factors and biomarkers at 11–13 weeks’ gestation. Ultrasound Obstet Gynecol 2017; 50: 589–95. [DOI] [PubMed] [Google Scholar]
- 175.Sibai BM. Thrombophilia and severe preeclampsia: time to screen and treat in future pregnancies? Hypertension. (Dallas, Tex. 1979). 2005; 46: 1252–3. [DOI] [PubMed] [Google Scholar]
- 176.Dekker G, Sibai B. Primary, secondary, and tertiary prevention of pre-eclampsia. Lancet (London, England) 2001; 357: 209–15. [DOI] [PubMed] [Google Scholar]
- 177.Crandon AJ, Isherwood DM. Effect of aspirin on incidence of pre-eclampsia. Lancet (London, England). 1979; 1: 1356. [DOI] [PubMed] [Google Scholar]
- 178.Beaufils M, Uzan S, Donsimoni R, Colau JC. Prevention of pre-eclampsia by early antiplatelet therapy. Lancet (London, England) 1985; 1: 840–2. [DOI] [PubMed] [Google Scholar]
- 179.Askie LM, Duley L, Henderson-Smart DJ, Stewart LA. Antiplatelet agents for prevention of pre-eclampsia: a meta-analysis of individual patient data. Lancet (London, England) 2007; 369: 1791–8. [DOI] [PubMed] [Google Scholar]
- 180.Bujold E, Roberge S, Nicolaides KH. Low-dose aspirin for prevention of adverse outcomes related to abnormal placentation. Prenat Diagn 2014; 34: 642–8. [DOI] [PubMed] [Google Scholar]
- 181.Roberge S, Giguere Y, Villa P, et al. Early administration of low-dose aspirin for the prevention of severe and mild preeclampsia: a systematic review and meta-analysis. Am J Perinatol 2012; 29: 551–6. [DOI] [PubMed] [Google Scholar]
- 182.Rolnik DL, Wright D, Poon LC, et al. Aspirin versus Placebo in Pregnancies at High Risk for Preterm Preeclampsia. N Engl J Med 2017; 377: 613–22. [DOI] [PubMed] [Google Scholar]
- 183.Wright D, Rolnik DL, Syngelaki A, et al. Aspirin for Evidence-Based Preeclampsia Prevention trial: effect of aspirin on length of stay in the neonatal intensive care unit. Am J Obstet Gynecol 2018; 218: 612.e1–612.e6. [DOI] [PubMed] [Google Scholar]
- 184.Ayala DE, Ucieda R, Hermida RC. Chronotherapy with low-dose aspirin for prevention of complications in pregnancy. Chronobiol Int 2013; 30: 260–79. [DOI] [PubMed] [Google Scholar]
- 185.Roberge S, Bujold E, Nicolaides KH. Aspirin for the prevention of preterm and term preeclampsia: systematic review and metaanalysis. Am J Obstet Gynecol 2018; 218: 287–293.e1. [DOI] [PubMed] [Google Scholar]
- 186.Masotti G, Galanti G, Poggesi L, Abbate R, Neri Serneri GG. Differential inhibition of prostacyclin production and platelet aggregation by aspirin. Lancet (London, England) 1979; 2: 1213–7. [DOI] [PubMed] [Google Scholar]
- 187.Wright D, Poon LC, Rolnik DL, et al. Aspirin for Evidence-Based Preeclampsia Prevention trial: Influence of compliance on beneficial effect of aspirin in prevention of preterm preeclampsia. Am J Obstet Gynecol 2017; 217: 685.e1–685.e5. [DOI] [PubMed] [Google Scholar]
- 188.Henderson JT, Whitlock EP, O’Conner E, Senger CA, Thompson JH, Rowland MG. Low-Dose Aspirin for the Prevention of Morbidity and Mortality From Preeclampsia: A Systematic Evidence Review for the U.S. Preventive Services Task Force [Internet]. Rockville, MD: Agency for Healthcare Research and Quality (US); 2014. [PubMed] [Google Scholar]
- 189.Duley L, Henderson-Smart DJ, Meher S, King JF. Antiplatelet agents for preventing pre-eclampsia and its complications. Cochrane database Syst Rev 2007;(2):CD004659. [DOI] [PubMed] [Google Scholar]
- 190.Roberge S, Bujold E, Nicolaides KH. Meta-analysis on the effect of aspirin use for prevention of preeclampsia on placental abruption and antepartum hemorrhage. Am J Obstet Gynecol 2018; 218: 483–9. [DOI] [PubMed] [Google Scholar]
- 191.Hofmeyr GJ, Lawrie TA, Atallah AN, Torloni MR. Calcium supplementation during pregnancy for preventing hypertensive disorders and related problems. Cochrane database Syst Rev 2018; (10):CD001059. [DOI] [PMC free article] [PubMed] [Google Scholar]
- 192.Rodger MA, Gris J-C, de Vries JIP, et al. Low-molecular-weight heparin and recurrent placenta-mediated pregnancy complications: a meta-analysis of individual patient data from randomised controlled trials. Lancet (London, England) 2016; 388: 2629–41. [DOI] [PubMed] [Google Scholar]
- 193.Mastrolia SA, Novack L, Thachil J, et al. LMWH in the prevention of preeclampsia and fetal growth restriction in women without thrombophilia. A systematic review and meta-analysis. Thromb Haemost 2016; 116: 868–78. [DOI] [PubMed] [Google Scholar]
- 194.Chiswick C, Reynolds RM, Denison F, et al. Effect of metformin on maternal and fetal outcomes in obese pregnant women (EMPOWaR): a randomised, double-blind, placebo-controlled trial. Lancet Diabetes Endocrinol 2015; 3: 778–86. [DOI] [PMC free article] [PubMed] [Google Scholar]
- 195.Kalafat E, Sukur YE, Abdi A, Thilaganathan B, Khalil A. Metformin for the prevention of hypertensive disorders of pregnancy in women with gestational diabetes and obesity: A systematic review and meta-analysis. Ultrasound Obstet Gynecol. 2018;52:706–714. [DOI] [PubMed] [Google Scholar]
- 196.Rumbold A, Ota E, Nagata C, Shahrook S, Crowther CA. Vitamin C supplementation in pregnancy. Cochrane database Syst Rev 2015;(9):CD004072. [DOI] [PMC free article] [PubMed] [Google Scholar]
- 197.Rumbold A, Ota E, Hori H, Miyazaki C, Crowther CA. Vitamin E supplementation in pregnancy. Cochrane Database Syst Rev. 2015;(9):CD004069. [DOI] [PMC free article] [PubMed] [Google Scholar]
- 198.Wen SW, White RR, Rybak N, et al. Effect of high dose folic acid supplementation in pregnancy on pre-eclampsia (FACT): double blind, phase III, randomised controlled, international, multicentre trial. BMJ 2018; 362: k3478. [DOI] [PMC free article] [PubMed] [Google Scholar]
- 199.Bergeron TS, Roberge S, Carpentier C, Sibai B, McCaw-Binns A, Bujold E. Prevention of Preeclampsia with Aspirin in Multiple Gestations: A Systematic Review and Meta-analysis. Am J Perinatol 2016; 33: 605–10. [DOI] [PubMed] [Google Scholar]
- 200.Say L, Chou D, Gemmill A, et al. Global causes of maternal death: a WHO systematic analysis. Lancet Glob Heal 2014; 2: e323–33. [DOI] [PubMed] [Google Scholar]
- 201.Moller A-B, Petzold M, Chou D, Say L. Early antenatal care visit: a systematic analysis of regional and global levels and trends of coverage from 1990 to 2013. Lancet Glob Heal 2017; 5: e977–83. [DOI] [PMC free article] [PubMed] [Google Scholar]
- 202.Phillips E, Stoltzfus RJ, Michaud L, Pierre GLF, Vermeylen F, Pelletier D. Do mobile clinics provide high-quality antenatal care? A comparison of care delivery, knowledge outcomes and perception of quality of care between fixed and mobile clinics in central Haiti. BMC Pregnancy Childbirth 2017; 17: 361. [DOI] [PMC free article] [PubMed] [Google Scholar]
- 203.Ortved D, Hawkins TL, Johnson JA, Hyett J, Metcalfe A. The cost-effectiveness of first trimester screening and early preventative use of aspirin in women at high risk of early onset pre-eclampsia. Ultrasound Obstet Gynecol. 2019;53:239–244. [DOI] [PubMed] [Google Scholar]
- 204.McLaren ZM, Sharp A, Hessburg JP, et al. Cost effectiveness of medical devices to diagnose pre-eclampsia in low-resource settings. Dev Eng 2017; 2: 99–106. [DOI] [PMC free article] [PubMed] [Google Scholar]
- 205.Pourat N, Martinez AE, Jones JM, Gregory KD, Korst L, Kominski GF. Costs of Gestational Hypertensive Disorders in California: Hypertension, Preeclampsia, and Eclampsia. Los Angeles (CA): UCLA Center for Health Policy Research; 2013. [Google Scholar]
- 206.Fox A, McHugh S, Browne J, Kenny LC, Fitzgerald A, Khashan AS, Dempsey E, Fahy C, O’Neill C, Kearney PM. Estimating the Cost of Preeclampsia in the Healthcare System: Cross-Sectional Study Using Data From SCOPE Study (Screening for Pregnancy End Points). Hypertension. 2017;70:1243–1249. [DOI] [PubMed] [Google Scholar]
- 207.Phibbs CS, Schmitt SK, Cooper M, Gould JB, Lee HC, Profit J, Lorch SA. Birth Hospitalization Costs and Days of Care for Mothers and Neonates in California, 2009–2011. J Pediatr. 2019;204:118–125.e14. [DOI] [PMC free article] [PubMed] [Google Scholar]
- 208.Stevens W, Shih T, Incerti D, et al. Short-term costs of preeclampsia to the United States health care system. Am J Obstet Gynecol 2017; 2017;217:237–248.e16. [DOI] [PubMed] [Google Scholar]
- 209.Shmueli A, Meiri H, Gonen R. Economic assessment of screening for pre-eclampsia. Prenat Diagn 2012; 32: 29–38. [DOI] [PubMed] [Google Scholar]
- 210.Werner EF, Hauspurg AK, Rouse DJ. A Cost-Benefit Analysis of Low-Dose Aspirin Prophylaxis for the Prevention of Preeclampsia in the United States. Obstet Gynecol. 2015;126:1242–50. [DOI] [PubMed] [Google Scholar]
- 211.Helou A, Walker S, Stewart K, George J. Management of pregnancies complicated by hypertensive disorders of pregnancy: Could we do better? Aust N Z J Obstet Gynaecol 2017; 57: 253–259. [DOI] [PubMed] [Google Scholar]
- 212.Petersen TG, Liew Z, Andersen AN, Andersen GL, Andersen PK, Martinussen T, Olsen J, Rebordosa C, Tollånes MC, Uldall P, Wilcox AJ, Strandberg-Larsen K. Use of paracetamol, ibuprofen or aspirin in pregnancy and risk of cerebral palsy in the child. Int J Epidemiol 2018; 47: 121–130. [DOI] [PMC free article] [PubMed] [Google Scholar]
- 213.Meertens LJE, Scheepers HCJ, Willemse JPMM, Spaanderman MEA, Smits LJM. Should women be advised to use calcium supplements during pregnancy? A decision analysis. Matern Child Nutr. 2018;14:e12479. [DOI] [PMC free article] [PubMed] [Google Scholar]
Associated Data
This section collects any data citations, data availability statements, or supplementary materials included in this article.
Supplementary Materials
Appendix S1. Formulas for calculation of multiple of the median (MoM) values at 11–13 weeks of gestation. Algorithm for prediction of pre-eclampsia.