

Abstract
Ruthenium complexes are promising photosensitizers (PSs), but their clinical applications have many limitations. Here, a multifunctional nano‐platform PDA‐Pt‐CD@RuFc formed by platinum‐decorated and cyclodextrin (CD)‐modified polydopamine (PDA) nanoparticles (NPs) loaded with a ferrocene‐appended ruthenium complex (RuFc) is reported. The NPs can successfully deliver RuFc to the tumor sites. The release of RuFc from the NPs can be triggered by low pH, photothermal heating, and H2O2. The combined photodynamic and photothermal therapy (PDT‐PTT) mediated by PDA‐Pt‐CD@RuFc NPs can overcome the hypoxic environment of tumors from several aspects. First, the platinum NPs can catalyze H2O2 to produce O2. Second, vasodilation caused by photothermal heating can sustain the oxygen supplement. Third, PDT exerted by RuFc can also occur through the non‐oxygen‐dependent Fenton reaction. Due to the presence of PDA, platinum NPs, and RuFc, the nanosystem can be used in multimodal imaging including photothermal, photoacoustic, and computed tomography imaging. The NPs can be excited by the near‐infrared two‐photon light source. Moreover, the combined treatment can improve the tumor microenvironments to obtain an optimized combined therapeutic effect. In summary, this study presents a tumor‐microenvironment‐adaptive strategy to optimize the potential of ruthenium complexes as PSs from multiple aspects.
Keywords: drug delivery, multimodal imaging, photodynamic therapy, ruthenium, tumor microenvironment
A multifunctional nanocomposite for ruthenium‐based photosensitizers that can successfully adapt to and remodel tumor microenvironments is developed. The release of the photosensitizer can be triggered by low pH, photothermal heating, and H2O2. The as‐fabricated nanoparticles can accumulate in tumor tissues and show great potential for combined therapy with multimodal imaging capacities.
1. Introduction
As a widely recognized noninvasive photoactivated tumor therapy technology, photodynamic therapy (PDT) has achieved great success in clinical practice.1 Compared with other cancer therapies, an advantage of PDT is that it is activated by intense light exposure, resulting in controllable phototoxicity and less adverse effects.2 In recent years, many Ru(II) polypyridyl complexes have shown potential as effective photosensitizers (PSs) due to their visible light absorption and long‐lived triplet excited states.3 Upon irradiation, Ru(II) complex can photosensitize O2 to generate singlet oxygen (1O2) efficiently, and many Ru(II) polypyridyl complexes have good water solubility and can be well internalized by cancer cells.[qv: 3b] In addition, they can be activated by the two‐photon (TP) light source to obtain better penetration depth than visible light.4 Because of these properties, PSs based on Ru (II) complexes have drawn much research interest. For example, Chao et al. reported a Ru(II) polypyridyl PS with high TP absorption properties exerted its PDT effects by destroying lysosomes.[qv: 4a] Weil et al. developed a mitochondria‐targeted Ru(II) PS showed efficient growth inhibition in an acute myeloid leukemia cell line.5 Keyes et al. designed Ru(II) PSs modified with different localizing signal peptides, and they could cause photodamage to nuclear DNA or mitochondrial DNA.6 Furthermore, some new strategies were used to optimize the performance of ruthenium‐based photosensitizers, e.g., photosensitization chain‐reaction7 and conjugation with tumor recognition groups.8 A Ru(II) PS named TLD1433 is currently in the clinical stage for the treatment of nonmuscle‐invasive bladder cancer.[qv: 3a] Notably, TLD1433 was administered to bladder cancer patients in a human clinical trial since 2017, and positive clinical outcomes supporting further application of TLD1433 were achieved.[qv: 3a] However, Ru‐based PSs still have many drawbacks for further clinical applications. Ru‐based PSs lack selectivity for cancer cells/tissues, resulting in unwanted toxicity to normal cells/tissues. Most of the Ru‐based PSs reported so far function via the oxygen‐dependent PDT process relying predominantly on photosensitized generation of 1O2,9 while the tumor microenvironment (TME) is hypoxic.10
TME is recognized as a key contributor for cancer progression, metastasis, dysregulated immune responses, and drug resistance, which should be taken into consideration for the development of anticancer treatment.11 Malignant tumor cells produce excessive amounts of H2O2, thus the levels of H2O2 in TME are significantly increased.12 The upregulated glycolytic metabolism generates an acidic TME.13 An important feature of TME that causes fundamental limitations of PDT is the extreme hypoxia that decreases PDT efficacy by inhibiting effective 1O2 production.14 Moreover, the consumption of O2 during PDT will deteriorate tumor hypoxia.15 At present, several strategies are proved to be useful in overcoming tumor hypoxia during PDT process. For instance, pure O2 is offered to patient in a pressurized sealed chamber to promote O2 transport to tumors in the hyperbaric oxygen therapy.16 Alternatively, various O2‐generating/delivery materials including MnO2 and catalase have been used to overcome hypoxia.[qv: 14,15b,17] Another way to combat tumor hypoxia is seeking PDT independent of O2. For example, hydroxyl radical (•OH), the most toxic reactive oxygen species (ROS), can be generated via the Fenton reaction (Fe2+ + H2O2 → Fe3+ + OH− + •OH) using H2O2.[qv: 15b,18]
Although researchers are aware of the importance of optimization of nanocarriers for metallodrugs in their clinical application,19 tailored nanocarriers for metal‐based PSs are still rare. In this work, we designed a platinum‐polydopamine (PDA) hybrid nanocomposite PDA‐Pt. PDA‐Pt is modified by cyclodextrin (CD) groups and loaded with a Ru(II) complex (RuFc) through host–guest interactions to form PDA‐Pt‐CD@RuFc nanoparticles (NPs; Scheme 1 a). PDA can produce the photothermal effect and platinum NPs can catalyze the decomposition of H2O2 to produce O2. RuFc is appended with a ferrocene group and can be released from CD under stimuli including low pH, photothermal heating, and H2O2. In addition, RuFc can also produce •OH by photocatalytic Fenton reaction. By integrating photothermal vasodilation to enhance O2 supply, Pt‐catalyzed O2 production, and O2‐independent PDT process, PDA‐Pt‐CD@RuFc NPs can effectively resolve the hindrances faced by Ru(II)‐based PSs (Scheme 1b). Due to the presence of PDA, Pt, and RuFc, the capability of PDA‐Pt‐CD@RuFc NPs in multimodal (photothermal, photoacoustic (PA), and computed tomography (CT) imaging‐guided therapy was investigated. Furthermore, we also explored the improvement of TME by PDA‐Pt‐CD@RuFc NPs through alleviating the hypoxic pressure. In conclusion, this study provides an integrated approach to overcome the shortcomings encountered by Ru(II)‐based PSs in vivo from various respects.
Scheme 1.
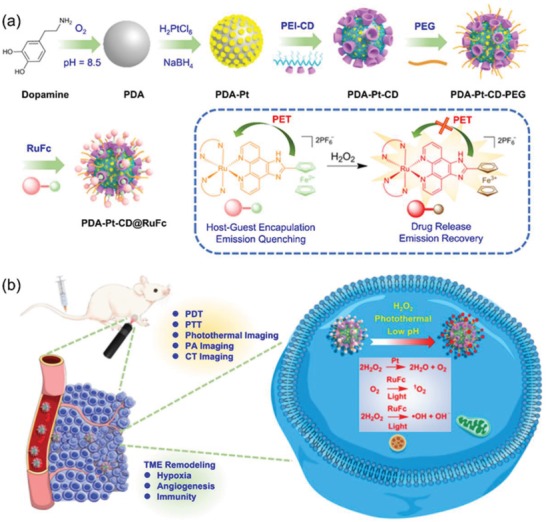
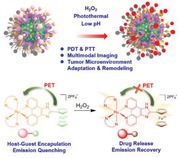
a) The construction of PDA‐Pt‐CD@RuFc NPs. Drug release and fluorescence recovery due to oxidation of the ferrocene group in RuFc by H2O2 are shown in the frame. b) Purposed action mechanisms of PDA‐Pt‐CD@RuFc NPs.
2. Results and Discussion
2.1. Synthesis and Characterization
The ligand was synthesized by the literature method,20 and RuFc was obtained by refluxing the ligand and the precursor in CH3CH2OH/H2O (3/1, v/v) followed by anion exchange and purification by column chromatography (Scheme S1, Supporting Information). RuFc was characterized by electrospray ionization‐mass spectrometry (ESI‐MS; Figure S1, Supporting Information), NMR spectroscopy (Figures S2 and S3, Supporting Information), and elemental analysis. The UV/vis absorption spectra of RuFc in degassed CH3CN, CH3Cl2, and H2O at 298 K show intense spin‐allowed intraligand (1IL) absorption bands in the UV region at approximately 250–340 nm, and less intense spin‐allowed metal‐to‐ligand charge transfer (1MLCT) absorption bands at approximately 350–530 nm, which are typical absorption properties of Ru(II)‐polypyridyl complexes (Figure S4, Supporting Information).21 In CH3CN, CH2Cl2, and H2O, RuFc exhibits relatively weak emission with quantum yields ranging between 0.022 and 0.243 (Figure S5 and Table S2, Supporting Information).
Cyclic voltammetry measurement shows that the half‐wave potential of RuFc is 0.585 V (Figure S6, Supporting Information). In the presence of ROS, the fluorescence of RuFc is greatly enhanced (Figure S7, Supporting Information). For example, in the presence of ClO− and •OH, the fluorescence intensity increases by 3.9‐ and 4.7‐fold, respectively. The phenomenon can be attributed to the oxidation of ferrocene groups, which blocks the intracellular photo‐induced electron transfer (PET) process (Scheme 1a).22
The synthetic procedures of PDA‐Pt‐CD@RuFc NPs are depicted in Scheme 1a. First, PDA NPs were synthesized by self‐polymerization of dopamine under alkaline conditions (pH = 8.5) with O2 as the oxidant according to literature methods.23 PDA‐Pt NPs are formed by in situ growth of Pt NPs on PDA through the reduction of H2PtCl6 by NaBH4 using a similar method reported in literature.24 PEI‐CD was synthesized by the substitution reaction of 6‐deoxy‐(p‐toluenesulfonyl)‐β‐CD (6‐OTs‐β‐CD) with the amine groups of polyethylenimine (PEI).25 Then, PEI‐CD is coated on PDA‐Pt NPs by noncovalent interactions to form PDA‐Pt‐CD NPs. In order to increase the water solubility of the NPs, methoxy poly(ethylene glycol) carboxylic acid (MPEG5000‐COOH) is coated on the surface of the NPs to form PDA‐Pt‐CD‐PEG NPs. Finally, RuFc is loaded on PDA‐Pt‐CD‐PEG NPs through host–guest interactions to afford PDA‐Pt‐CD@RuFc NPs.
Transmission electron microscopy (TEM) images (Figure 1a) reveal that the average diameters of PDA, PDA‐Pt, and PDA‐Pt‐CD@RuFc NPs are about 100, 120, and 290 nm, respectively. The TEM images of PDA‐Pt show that the structure of PDA is well maintained with Pt NPs uniformly decorated on the surface of PDA. Meanwhile, the TEM elemental mappings (Figure 1b) show the distribution of Pt, C, N, O, Ru, and Fe elements in the same particle, which proves the formation of Pt NPs on PDA and the subsequent loading of RuFc. Quantitative energy dispersive X‐ray analysis shows the content of C, N, O, Ru, Pt, and Fe in PDA‐Pt‐CD@RuFc NPs (Figure S8, Supporting Information). The Fourier‐transform infrared spectra of PDA and PDA‐Pt NPs exhibit the typical peaks of the benzene ring and the hydroxy group at 1494 and 3200 cm−1, respectively (Figure 1c). For PDA‐Pt‐CD NPs, the additional peaks at 1031 and 1156 cm−1 are attributed to the vibrational bands of C−O and C−C bonds in CD moieties, respectively. The average diameters of PDA, PDA‐Pt, PDA‐Pt‐CD‐PEG, and PDA‐Pt‐CD@RuFc NPs determined by dynamic light scattering (DLS) measurement are about 130, 195, 280, and 350 nm, respectively (Figure 1d). It can be seen that the size distribution is relatively narrow. The hydrodynamic particle sizes of these NPs measured by DLS are larger than those obtained by TEM, as DLS gives the hydrodynamic size that corresponds to the core and the swollen corona, whereas TEM often gives the size of the dried core of NPs. The zeta potential of PDA is −34.73 ± 1.25 mV, and it becomes −19.22 ± 2.87 mV after modification of the Pt NPs (Figure 1e). The result is in accordance with the literature report.24 The zeta potential of PDA‐Pt‐CD becomes 11.09 ± 0.82 mV after coated with the positively charged PEI‐CD, and then turns negative again after the absorption of the negatively charged PEG. As expected, the loading RuFc with positively charges results in smaller negative potential values of PDA‐Pt‐CD@RuFc NPs. After an incubation for 48 h, PDA‐Pt‐CD@RuFc NPs are still dispersed uniformly in phosphate buffered saline (PBS), cell culture medium, and fetal bovine serum (FBS) with no precipitate observed (Figure S9a, Supporting Information). The UV/vis absorption spectra of PDA‐Pt‐CD@RuFc NPs in PBS remain almost unchanged after 2 days (Figure S9b, Supporting Information). The results show that PDA‐Pt‐CD@RuFc NPs are stable in these media and suitable for biological applications.
Figure 1.
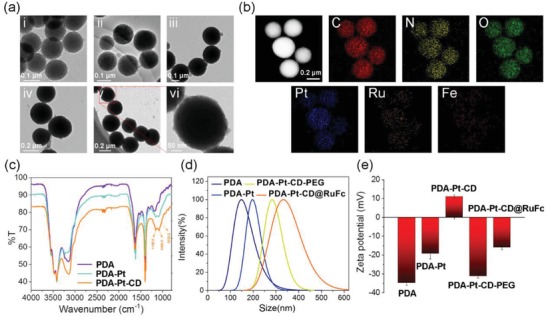
a) TEM image of: i) PDA, ii) PDA‐Pt, iii) PDA‐Pt‐CD, iv) PDA‐Pt‐CD‐PEG, and v) PDA‐Pt‐CD@RuFc NPs. vi) The detailed picture of (v). b) TEM elemental mapping of PDA‐Pt‐CD@RuFc NPs. c) The IR spectra of PDA, PDA‐Pt, and PDA‐Pt‐CD NPs. d) The particle size distributions of PDA, PDA‐Pt, PDA‐Pt‐CD‐PEG, and PDA‐Pt‐CD@RuFc NPs. e) The zeta‐potentials of PDA, PDA‐Pt, PDA‐Pt‐CD, PDA‐Pt‐CD‐PEG, and PDA‐Pt‐CD@RuFc NPs.
2.2. Drug Loading and Releasing Properties
Both PDA and PDA‐Pt‐CD‐PEG NPs show strong absorbance in the near‐infrared (NIR, wavelength = 700–1100 nm) region (Figure 2a). After loading with RuFc, another two peaks at approximately 275 and 470 nm are detected for PDA‐Pt‐CD@RuFc NPs. According to the law of Lambert–Beer, the loading rate of RuFc is calculated to be 8.5%. Accordingly, the loading of RuFc onto PDA‐Pt‐CD‐PEG leads to full quenching of the emission (Figure 2b), which can be attributed to the quenching effect of PDA and Pt NPs on chromophores.
Figure 2.
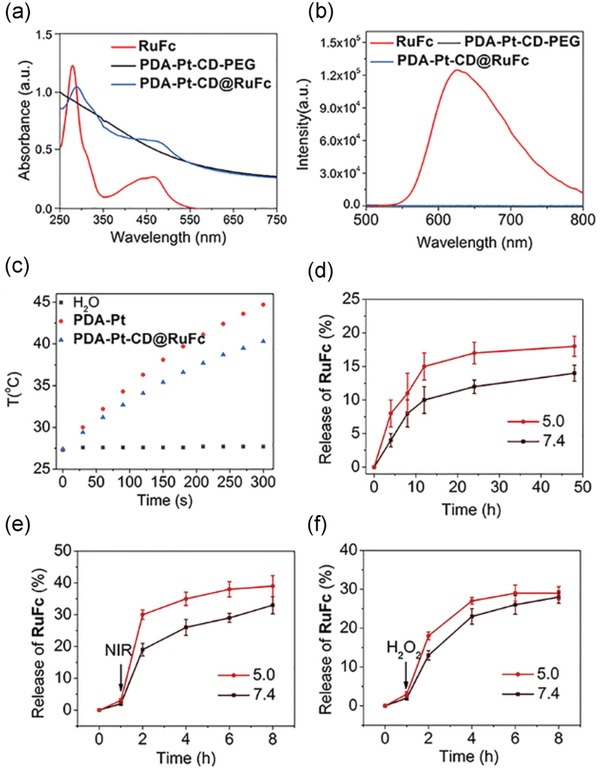
a) UV/vis spectra and b) fluorescence emission of RuFc (10 × 10−6 m), PDA‐Pt‐CD‐PEG (30 µg mL−1), and PDA‐Pt‐CD@RuFc (30 µg mL−1) NPs. c) The temperature changes of the PDA‐Pt (100 µg mL−1) and PDA‐Pt‐CD@RuFc (100 µg mL−1) upon irradiation at 808 nm (1 W cm−2) for different periods of time. d–f) In vitro pH‐dependent (d), photothermal‐triggered (e), and H2O2‐responsive (f) release of RuFc from PDA‐Pt‐CD@RuFc NPs at pH 5.0 and 7.4. The samples were irradiated with an 808 nm laser irradiation (1 W cm−2) or mixed with 100 µL H2O2 (100 × 10−3 m) at 1 h.
PDA‐Pt NPs show effective photothermal conversion capacities, and the photothermal performance is maintained after CD modification and RuFc loading (Figure 2c and Figure S9, Supporting Information). PDA‐Pt‐CD@RuFc NPs show a concentration‐dependent photothermal conversion efficacy. The efficiency of photothermal conversion of PDA‐Pt‐CD@RuFc NPs is calculated to be 44.5%, which is in the same range of those reported for other PDA‐based NPs.[qv: 23b,c] The photothermal conversion efficiency of PDA‐Pt‐CD@RuFc NPs is also higher than those of the commercial gold nanoshells (13.0%) and gold nanorods (21%).26
Responsive drug release prevents the immature release of the drug before it reaches the tumor tissue, which is beneficial for targeted cancer therapy. We find that three external stimuli (low pH, H2O2, and photothermal heating) can enhance the release of RuFc from PDA‐Pt‐CD@RuFc NPs (Figure 2d–f). After 48 h incubation, the release ratios of the RuFc are 18 ± 1.5% and 14 ± 1.2% at pH 5.0 and pH 7.4, respectively. The TME tends to be acidic (pH 5.7–7.8),27 and the environment in lysosomal (pH 4.5–5.5)/endosome (pH from 6.8 to <5.5) is also acidic.28 The release of RuFc will be facilitated under these conditions. Upon irradiation at 808 nm, the release ratios of RuFc at pH 5.0 and pH 7.4 reach 39 ± 3.3% and 33 ± 2.7%, respectively, which may be caused by the weakened interactions between RuFc and the NPs. In the presence of H2O2, the release rates of RuFc are 29 ± 1.7% and 28 ± 1.6% at pH 5.0 and pH 7.4, respectively. In the presence of the oxidants, RuFc can be released from the CDs due to the oxidation of the ferrocene groups.29 Both acidity and excessive H2O2 are important characteristics of TME, which are favorable for the release of RuFc. In addition, photothermal conditions can be applied externally to stimulate the release of RuFc. Further, the intracellular drug release responsive to different stimuli was investigated. Both lasers (450 and 808 nm) and H2O2 can stimulate the release of RuFc from PDA‐Pt‐CD@RuFc NPs, as indicated by the recovery of the fluorescence (Figure S11, Supporting Information). The phenomenon is more obvious as the cellular acidity increases (Figure S12, Supporting Information). The cellular distribution of RuFc, PDA‐Pt‐CD‐PEG, and PDA‐Pt‐CD@RuFc was measured by inductively coupled plasma‐mass spectrometry (ICP‐MS). After incubated in 4T1 cells for 12 h, RuFc tends to localize in mitochondria (Figures S13 and S14, Supporting Information). However, PDA‐Pt‐CD‐PEG and PDA‐Pt‐CD@RuFc are mainly detected in the cytoplasm.
2.3. Catalyze the Deposition of H2O2
As pH can influence the catalytic capacity of nanozymes,30 the catalase‐like activity of PDA‐Pt‐CD@RuFc NPs is measured at pH 7.4 and 6.5. UV light can decompose H2O2 to produce •OH, and the degree of H2O2 decomposition can be determined by quantifying the content of •OH using the radical trap 5,5‐dimethyl‐1‐proline‐N‐oxide (DMPO). The four characteristic peaks of DMPO/•OH adducts in the electron spin resonance spectra are weakened in the presence of PDA‐Pt‐CD@RuFc (Figure 3 a,b) and the catalyst (Figure S15, Supporting Information). The reaction between PDA‐Pt‐CD@RuFc NPs and H2O2 under different conditions were also investigated be measuring the absorbance at 240 nm of H2O2. The concentration of H2O2 is decreased as the reaction proceeds in the sample containing PDA‐Pt‐CD@RuFc NPs (Figure S16, Supporting Information).
Figure 3.
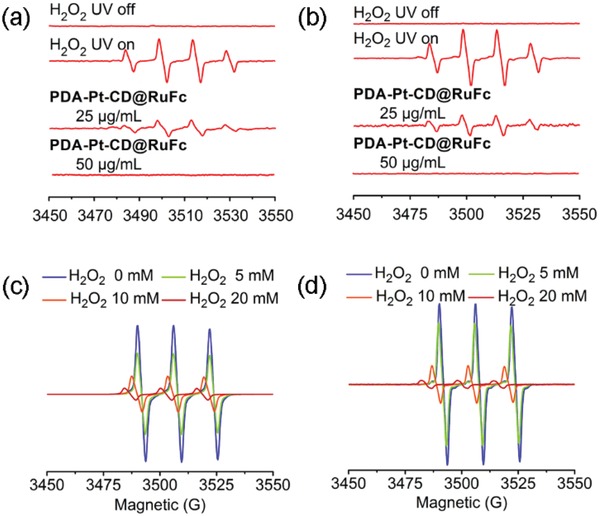
a,b) Effect of PDA‐Pt‐CD@RuFc NPs on •OH production in the H2O2/UV system at pH 6.5 (a) and pH 7.4 (b). c,d) Detection of the O2 (EPR spin label oximetry) produced by reaction catalyzed by PDA‐Pt‐CD@RuFc NPs (50 µg mL−1) at pH 6.5 (c) and pH 7.4 (d).
PDA‐Pt‐CD@RuFc NPs can decompose H2O2 to generate O2 like the catalase, as evidenced by the gas bubbles in the tubes and H2O2 at both pH 7.4 and 6.5 (Figure S17, Supporting Information). The O2 produced by the catalytic reaction is also detected by the electron paramagnetic resonance (EPR) measurement using the O2‐sensitive spin‐label probe 3‐carbamoyl‐2,2,5,5‐tetramethyl‐3‐pyrroline‐l‐yloxyl (CTPO). As the concentration of H2O2 increases, the signal of CTPO decreases gradually in the presence of PDA‐Pt‐CD@RuFc NPs (Figure 3c,d), which is similar to that observed for the catalyst (Figure S14, Supporting Information). In all these experiments, PDA does not show a catalytic activity for H2O2 decomposition, which confirms that the catalase‐like properties originate from the Pt NPs.
2.4. Catalyze the Photo‐Fenton Reaction and Photosensitize the Generation of 1O2
Next, we studied the reaction of RuFc with H2O2 to produce •OH through photo‐Fenton reaction using DMPO as the radical trap. RuFc can effectively generate •OH in the presence of H2O2 upon visible light illumination at both pH 6.5 and 7.4 (Figure 4a,b). Upon visible light irradiation, the absorbance of 9,10‐anthracenediyl‐bis(methylene)dimalonic acid (ABDA, an 1O2 indicator) decreases quickly (Figure 4c,d), which indicates that RuFc can efficiently photosensitize the generation of 1O2. The 1O2 quantum yields of RuFc are measured to be 0.098 and 0.152 at pH 7.4 and 6.5, respectively (Table S3, Supporting Information). In the presence of H2O2 (100 × 10−6 m, a concentration relevant to the tumor environment), the yields of 1O2 are increased at both pH 6.5 and 7.4 (Table S3, Supporting Information). The phenomena may be attributed to the oxidation of ferrocene groups by H2O2, which restores the fluorescence (Figure S7, Supporting Information) and photosensitizing properties by blocking the PET process.
Figure 4.
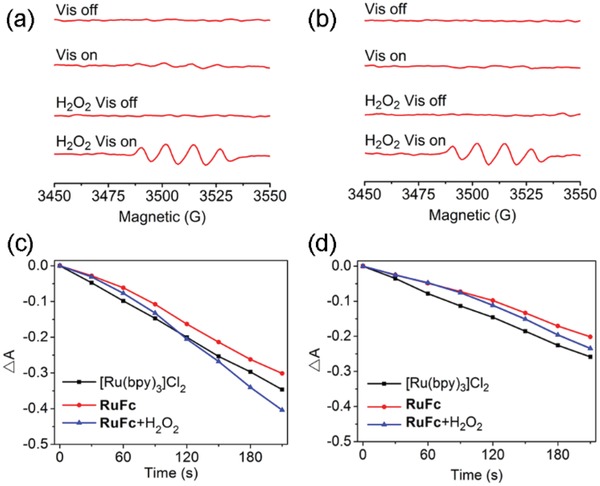
a,b) Production of •OH through photo‐Fenton reaction catalyzed by RuFc (50 × 10−6 m) at pH 6.5 (a) and pH 7.4 (b). Irradiation conditions: 450 nm, 20 mW cm−2, 3 min. c,d) Determination of the 1O2 by RuFc using ABDA (100 × 10−6 m) as the probe under visible light irradiation in the absence or presence of H2O2 (100 × 10−6 m) at pH 6.5 (c) and pH 7.4 (d). The solutions were irradiated with a 450 nm laser (20 W cm−2) for different time periods.
2.5. In Vitro Combined PDT‐PTT (Photothermal Therapy) Activities
Next, we studied the combined PDT‐PTT effects of PDA‐Pt‐CD@RuFc NPs on 4T1 breast cancer cells in vitro. PDA‐Pt‐CD@RuFc NPs shows low toxicity in the absence of light under both normoxia and hypoxia (Figure 5a–d). Appreciable cytotoxicities are observed for PDA‐Pt‐CD@RuFc NPs upon either photothermal (808 nm) or photodynamic (450 nm) treatment, and a good synergetic effect can be obtained for PDT‐PTT combined treatment. Under normoxia, the PDT effect is elevated in the presence of H2O2 because it can stimulate the release of RuFc and enhance the photon‐Fenton reaction (Figure 5a,c). In the presence of H2O2 under hypoxia, the efficacy of PDA‐Pt‐CD@RuFc NPs with combined PDT‐PTT treatment is similar to that obtained under normal conditions (Figure 5a,d). Moreover, PDA‐Pt‐CD@RuFc treatment can reduce the expression of hypoxia‐inducible factor 1a (HIF‐1a) and multi‐drug resistance (MDR1) genes as determined by real‐time polymerase chain reaction (Figure 5e,f). The expression of these genes are known to be induced by hypoxia.31 The results indicate that PDA‐Pt‐CD@RuFc NPs can well adapt to and improve the TME to produce a synergistic PDT‐PTT therapeutic effect.
Figure 5.
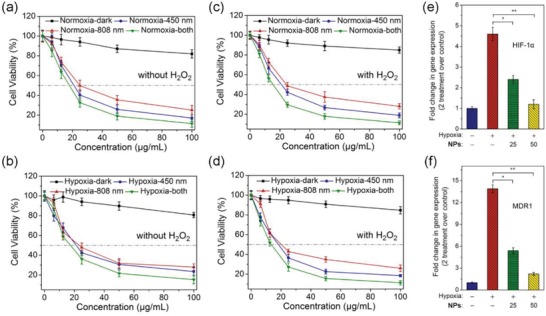
In vitro combined PDT‐PTT activities of PDA‐Pt‐CD@RuFc NPs measured on 4T1 cells. Cells were cultured under hypoxia (1% O2) or normoxia (21% O2) in the absence or presence of H2O2. a) Normoxia; H2O2 (0 × 10−6 m). b) Hypoxia; H2O2 (0 × 10−6 m). c) Normoxia; H2O2 (3 × 10⁻³ m). d) Hypoxia, H2O2 (3 × 10⁻³ m). Irradiation conditions: 450 nm, 17 mW cm−2, 1 min; 808 nm, 1 W cm−2, 10 min. e,f) The expression of HIF‐1α (e) and MDR1 (f) genes in 4T1 cells treated with PDA‐Pt‐CD@RuFc (25 or 50 µg mL−1) under hypoxia (1%) or normoxia (21%). Incubation time: 6 h. Statistical p‐value: *p < 0.05, **p < 0.01.
The in vitro combined PDT‐PTT activities were also tested on human breast cancer MB‐MDA‐231 cells, human cervical carcinoma HeLa cells, and human normal hepatic LO2 cells (Figure S19, Supporting Information). PDA‐Pt‐CD@RuFc NPs show very good combined therapeutic activity for cancer cells, especially for MB‐MDA‐231 cells. For normal cells, the inhibitory activity of the NPs is lower than that observed for tumor cells.
Since the penetration of visible light is limited, we also attempt to evaluate the two‐photon PDT (TPPDT) efficacy of PDA‐Pt‐CD@RuFc NPs in both 2D cells and multicellular tumor spheroids (MCTSs; Figure S20a, Supporting Information). The 3D MCTSs model can simulate the hypoxic TME and reflect the penetration capability of TP light source. First, the impact of TPPDT on viability of 2D 4T1 cells was visualized by Calcein AM staining. The viability of cells with photothermal (808 nm) or TP photodynamic (810 nm) treatment decreases significantly in both 2D and 3D models. After the combined TPPDT‐PTT therapy, the fluorescence of Calcein is further reduced. Cell viability assay also confirms the low toxicity of PDA‐Pt‐CD@RuFc toward MCTSs in the dark and high toxicity upon TPPDT‐PTT treatment (Figure S20b, Supporting Information). The results show that the PDT effects of PDA‐Pt‐CD@RuFc NPs can also be excited by the TP light source with higher penetration depth.
2.6. In Vitro Anticancer Mechanism
As PDT acted through elevation of ROS, we first detected the cellular ROS levels in cells using 2′,7′‐dichlorodihydrofluorescein diacetate (H2DCFDA) staining upon treatment.32 The level of ROS in the cells treated with PDA‐Pt‐CD@RuFc NPs in combination with light increases significantly under normoxia (Figure 6a). The capability of PDA‐Pt‐CD@RuFc NPs to photosensitize the generation of ROS under hypoxia is not obviously diminished, indicating that PDA‐Pt‐CD@RuFc‐mediated PDT can overcome tumor hypoxia.
Figure 6.
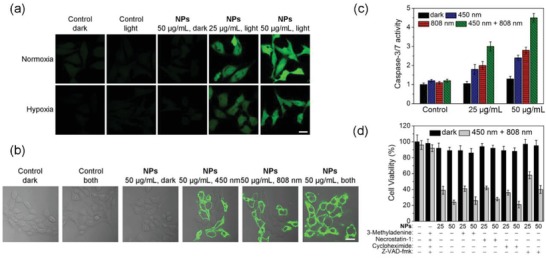
a) Intracellular ROS levels detected by H2DCFDA staining in 4T1 cells treated with PDA‐Pt‐CD@RuFc NPs in combination with light irradiation. Cells were cultured under hypoxia (1% O2) or normoxia (21% O2) atmosphere and treated with the NPs. Irradiation conditions: 450 nm, 17 mW cm−2, 1 min. b) Detection of apoptosis by Annexin V staining in 4T1 cells with PDT‐PTT combined treatment mediated by PDA‐Pt‐CD@RuFc. c) Detection of caspase‐3/7 activity in 4T1 cells with PDT‐PTT combined treatment mediated by PDA‐Pt‐CD@RuFc. d) The impact of different inhibitors on the viability of 4T1 cells with PDT‐PTT combined treatment mediated by PDA‐Pt‐CD@RuFc. Irradiation conditions for (b), (c), and (d): 450 nm, 17 mW cm−2, 1 min; 808 nm, 1 W cm−2, 10 min.
Subsequently, we studied the effects of ROS on the integrity of cellular organelles. First, we investigated the lysosomal damage in PDA‐Pt‐CD@RuFc‐treated 4T1 cells by Magic Red MR‐(RR)2 staining. The control cells show dot‐like red fluorescence mostly localized in the lysosomes. In contrast, PDA‐Pt‐CD@RuFc‐treated cells with light irradiation show diffused red fluorescence (Figure S21, Supporting Information). The changes in mitochondrial membrane potential (MMP) was evaluated by 5,5′,6,6′‐tetrachloro‐1,1′‐3,3′‐tetraethyl‐benzimidazolylcarbocyanine iodide (JC‐1) staining.33 Upon irradiation, a marked decrease in MMP, indicated by the decrease in JC‐1 red/green fluorescence ratio, can be observed in PDA‐Pt‐CD@RuFc‐treated cells (Figure S22, Supporting Information). The collapse of MMP is more pronounced in cells subjected to PDA‐Pt‐CD@RuFc‐mediated combined PDT‐PTT therapy. Accordingly, PDA‐Pt‐CD@RuFc NPs cause a significant decrease in adenosine triphosphate production in the presence of light (Figure S23, Supporting Information).
Next, we used the Annexin V staining to detect the externalization of phosphatidylserine, a key event during early apoptosis. After 4T1 cells are incubated with PDA‐Pt‐CD@RuFc NPs and exposed to light, the proportion of Annexin V‐positive cells increases significantly, as measured by confocal microscopy (Figure 6b). The phenomenon is more obvious for cells with combined PDT‐PTT treatment. Caspase 3/7 activity assay also confirms that PDA‐Pt‐CD@RuFc NPs induce cell death through the apoptotic pathway (Figure 6c). Using different inhibitors, we validated the cell‐death modes by which PDA‐Pt‐CD@RuFc NPs kill the cancer cells through combined therapy. In the presence of the autophagy inhibitor (3‐methyladenine),34 the necrosis inhibitor (necrostatin‐1, inhibitor of RIP1 kinase),35 and the paraptosis inhibitor (cycloheximide, an inhibitor of protein and RNA biosynthesis),36 no significant changes in cell variability are detected (Figure 6d). However, in the presence of the apoptosis inhibitor (Z‐VAD‐fmk, a pan‐caspase inhibitor),37 the cell viability increases obviously. These experiments show that the combined PDT‐PTT therapy kills tumor cells mainly by inducing apoptosis.
2.7. In Vivo Imaging, Biodistribution, Metabolism, and Anticancer Properties
Next, we studied the in vivo organ distribution and metabolism of PDA‐Pt‐CD@RuFc NPs. ICP‐MS measurements of Ru and Pt show that both elements are enriched in tumor and liver tissues 24 h post intravenous (i.v.) injection (Figure 7a), which can be attributed to the enhanced permeability and retention effects of nanomaterials. In addition, we find that a small amount of Ru accumulates in heart and kidneys, which may be due to the fact that the released small molecules can circulate between organs more easily. After 7 days, the contents of Ru and Pt in the organs are greatly reduced (Figure S24, Supporting Information), which indicates that PDA‐Pt‐CD@RuFc NPs can be metabolized in vivo.
Figure 7.
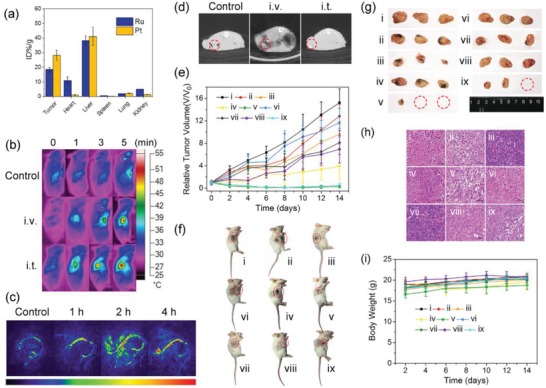
a) Biodistribution of Ru and Pt elements in different organs 24 h after i.v. injection of PDA‐Pt‐CD@RuFc NPs. The values are presented as the percentage of injected dose per g of the collected organs based on three mice per group. b) Thermal images of 4T1‐tumor‐bearing mice treated with PDA‐Pt‐CD@RuFc NPs (200 µL, 1 mg mL−1, 4 h) and exposed to an 808 nm laser (1 W cm−2) for 0, 1, 3, and 5 min. c) In vivo PA imaging of 4T1‐tumor‐bearing mice i.v. injected with PDA‐Pt‐CD@RuFc NPs (200 µL, 1 mg mL−1) for different time intervals. d) In vivo CT imaging of 4T1‐tumor‐bearing mice treated with PDA‐Pt‐CD@RuFc NPs (100 µL, 5 mg mL−1). The images were taken 30 min after i.t. injection and 2 h after i.v. injection. e) Tumor growth curves of different groups of mice (5 mice per group). f) Representative photos of different groups of mice after various treatments were taken at day 14. The tumor sites were marked with red dashed circles. g) Representative photos of tumors collected from different groups of mice at the end of treatment. The red dashed circles represent tumors that completely disappear. h) H&E staining of 4T1 tumor tissues of different groups of mice. i) Body weight curves of different groups of mice. The mice in (e)–(i) are divided into nine groups: i) control; ii) dark, i.t.; iii) 450 nm, i.t.; iv) 808 nm, i.t.; v) 808 nm + 450 nm, i.t.; vi) dark, i.v.; vii) 450 nm, i.v.; viii) 808 nm, i.v.; ix) 808 nm + 450 nm, i.v. Irradiation conditions: 450 nm, 12 W cm−2, 5 min; 808 nm, 1 W cm−2, 3 min.
Considering the potent photothermal effect of PDA‐Pt‐CD@RuFc, we studied the capability of it as a photothermal imaging agent. It can be seen that after 4 h treatment and illumination at 808 nm for 5 min, the temperature of the tumor area increases to 53 °C for intratumoral (i.t.) injection (Figure 7b). For mice with i.v. injection, the temperature of the tumor area gradually increases to 49 °C in 4 h, which shows that PDA‐Pt‐CD@RuFc NPs have good tumor‐targeting capabilities. Accordingly, after the mice were i.v. injected with the PDA‐Pt‐CD@RuFc NPs, obvious PA signals can be detected in the tumor site (Figure 7c). Moreover, because of the presence of heavy metal elements (Pt and Ru), PDA‐Pt‐CD@RuFc NPs can also be applied in CT imaging (Figure 7d). After i.t. or i.v. injection of PDA‐Pt‐CD@RuFc NPs, increased CT signals can be observed in the tumor sites (Figure 7d). Our results show that PDA‐Pt‐CD@RuFc NPs can be successfully applied in multimodal tumor imaging, which provides possibilities to integrate the functions of diagnosis and treatment together.
The in vivo antitumor potency of PDA‐Pt‐CD@RuFc NPs was then evaluated in mice bearing 4T1 tumors by i.t./i.v. injection. For both injection methods, PDT or PTT along shows a certain tumor inhibition efficiency (Figure 7e–g). Notably, the tumors almost completely disappear for PDT‐PTT combined therapy after treatment for 14 days. The in vivo anticancer efficacy was further evaluated by analyzing the tumor histological sections using hematoxylin and eosin (H&E) staining at the end of the treatment. Among these samples, the most serious cell death is observed for mice with PDA‐Pt‐CD@RuFc‐mediated combined therapy (Figure 7h). The results show that the multiple adaptive strategies of PDA‐Pt‐CD@RuFc NPs is effective in tumor treatment.
In order to assess the biocompatibility of PDA‐Pt‐CD@RuFc NPs in vivo, the body weight and H&E staining on histological sections of major organs were analyzed. The body weight of mice is not significantly reduced for all the groups (Figure 7i). No obvious pathological changes are present on the main tissues 14 days after the i.v. injection of PDA‐Pt‐CD@RuFc NPs (Figure S25, Supporting Information). The results indicate that the PDA‐Pt‐CD@RuFc NPs have low systemic toxicity.
2.8. Modulation of TME
As tumor hypoxia is closely related to many events such as inflammation, angiogenesis, and metastasis,38 we examined the effects of PDA‐Pt‐CD@RuFc on remodeling of TME. Both at the cellular level (Figure 8a,b) and in tumor slices (Figure 8c,d), the treatment of PDA‐Pt‐CD@RuFc NPs can significantly down‐regulate the expression of tumor necrosis factor (TNF)‐ɑ and interleukin 6 (IL‐6) that are markers of inflammatory TME. The expression of two important genes related to hypoxia, namely, HIF‐1ɑ and vascular endothelial growth factor (VEGF), was also investigated by immunofluorescence (Figure 8e,f) and immunohistochemical assays (Figure S26, Supporting Information). HIFs are key proteins regulating cellular response to hypoxia, and they can be activated by hypoxic TME.39 VEGF is a key regulator of many cancerous events including angiogenesis and metastasis.40 After combined treatment mediated by PDA‐Pt‐CD@RuFc NPs, both the expression of HIF‐1ɑ and VEGF are decreased significantly. Moreover, a decrease in the expression of cluster of differentiation‐31 (CD31, an endothelial cell marker gene)41 and an increase in the expression of ɑ‐smooth muscle actin (ɑ‐SMA, a marker of mature vascular endothelial cells)42 are also detected. The results show that PDA‐Pt‐CD@RuFc NPs can improve the hypoxic TME, which may further enhance their therapeutic effect.
Figure 8.
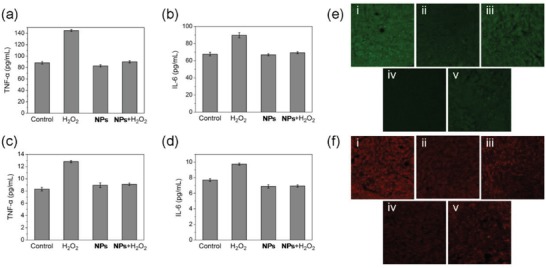
a) TNF‐a and b) IL‐6 level in 4T1 cells after various treatments. Raw 264.7 cells were treated with the supernate of 4T1 cells exposed to different treatments. c) TNF‐a and d) IL‐6 level in sera of mice after various treatments. e,f) Immunofluorescence images of HIF‐1α (e) and VEGF (f) of tumors after treatment with PDA‐Pt‐CD@RuFc. The mice are divided into five groups: i) control; ii) dark; iii) 450 nm; iv) 808 nm; v) 808 nm + 450 nm. Irradiation conditions: 450 nm, 12 W cm−2, 5 min; 808 nm, 1 W cm−2, 3 min.
3. Conclusions
The potential of ruthenium‐based PSs is limited by lacking of tumor‐targeting capability and the decline of PDT efficacy in TME, especially hypoxia. In this work, we report a multifunctional nano drug delivery system PDA‐Pt‐CD@RuFc that is modified with CD and loaded with a Ru(II) complex through host–guest interactions. The release of RuFc can be triggered by low pH, photothermal heating, and H2O2. The PDA‐Pt‐CD@RuFc NPs can accumulate in tumor tissues and show great potential for combined PDT‐PTT therapy with multimodal imaging capacities, including photothermal, PA, and CT. We prove that the nanosystem can overcome the hypoxic TME in many respects: 1) Pt NPs can catalyze the decomposition of H2O2 to produce O2; 2) photothermal heating can induce vasodilation; 3) RuFc can produce •OH through the oxygen‐independent photo‐Fenton reaction. Moreover, PDA‐Pt‐CD@RuFc NPs can remodel the TME in several aspects including hypoxia, immunity, and angiogenesis. In summary, the work offers multiple adaptive strategies to optimize the in vivo potential of ruthenium‐based PSs.
4. Experimental Section
Materials: RuCl3 ⋅ nH2O, 4,7‐diphenyl‐1,10‐phenanthroline, cisplatin, and chloroplatinic acid (H2PtCl6) were purchased from J&K Chemical, China. Dimethyl sulfoxide (DMSO), 3‐(4,5‐dimethyl‐2‐thiazolyl)‐2,5‐diphenyl‐2H‐tetrazolium bromide, Dulbecco's modified Eagle's medium, FBS, and the antibiotics (penicillin/streptomycin) were purchased from Gibco BRL. H2DCFDA, Annexin V‐FITC assay kit and JC‐1 were obtained from Sigma‐Aldrich (USA). Calcein AM were purchased from Shanghai Yusheng Biotechnology Co. Ltd. (China). Magic Red MR‐(RR)2 was purchased from Immunochemistry Tech (USA). The primary and secondary antibodies were obtained from Cell Signaling Technology (USA). All the other chemicals were of analytical grade obtained through commercial resources. Deionized water was purified by a Milli‐Q water purification system (Millipore, USA).
General Instruments: ESI‐MS was carried out on an LTQ XL H linear ion trap mass spectrometer. 1H NMR was carried out on a Bruker Avance III 400 MHz spectrometer (Germany). Shifts were referenced relative to the internal solvent signals. The element analysis (C, H, N) was determined by an Elemental Vario EL CHNS analyzer (Germany). Flow cytometry was carried by a BD FACSCalibur flow cytometer (Becton Dickinson, Oxford, UK). Confocal microscopic observations were taken on confocal microscopy (LSM 710, Carl Zeiss, Göttingen, Germany). The electrochemical measurement was performed on an electrochemical workstation (CHI760E).
Synthesis of [Ru(DIP)2(FIP)](PF6)2 (RuFc): The synthetic route of RuFc is depicted in Scheme S1 in the Supporting Information. Cis‐[Ru(DIP)2Cl2] · 2H2O43 and FIP (2‐ferrocenyl‐1H‐imidazo[4,5‐f][1,10]‐phenanthroline)44 were synthesized by literature methods. The precursor cis‐[Ru(DIP)2Cl2] · 2H2O (200 mg, 0.239 mmol) and the ligand FIP (97 mg, 0.239 mmol) were dissolved in 40 mL ethanol/water (75:25, v/v). The mixture was refluxed for 6 h under the protection of a nitrogen atmosphere. The solvent was removed by rotary vacuum evaporation. A small amount of acetonitrile was used to dissolve the crude product. The product was purified on a neutral alumina column using acetonitrile as the eluent for chromatographic separation. Concentrated aqueous solution of NH4PF6 was used to precipitate the product. After several times of washing with water and ether, the desired complex was dried in vacuum. Complex RuFc was obtained as deep red powder. Yield: 280.8 mg (84%). 1H NMR (400 MHz, DMSO‐d 6) δ 13.86 (s, 1H), 9.09 (d, J = 8.3, 2H), 8.35 (d, J = 5.5, 2H), 8.32–8.20 (m, 6H), 8.16 (d, J = 5.3, 2H), 7.92 (dd, J = 8.4, 5.3, 1H), 7.89–7.85 (m, 1H), 7.82 (d, J = 5.5, 2H), 7.76 (t, J = 5.7, 2H), 7.74–7.57 (m, 20H), 7.23 (d, J = 7.5, 1H), 7.16 (d, J = 7.7, 1H), 5.21 (t, J = 1.9, 2H), 4.61 (t, J = 1.9, 2H), 4.19 (s, 5H). 13C NMR (126 MHz, DMSO) δ 155.46, 152.99, 152.75, 150.48, 148.51, 148.36, 148.23, 135.96, 135.92, 130.42, 130.35, 130.10, 129.61, 128.60, 128.53, 127.00, 126.50, 74.21, 70.52, 70.07, 68.52. ESI‐MS (CH3CN): m/z 585.45 [M−2PF6]2+. Elemental analysis: calcd (%) for C71H48F12FeN8P2Ru⋅H2O: C, 57.70; H, 3.41; N, 7.58; found: C, 57.43; H, 3.35; N, 7.55.
Synthesis of PDA‐Pt: The PDA NPs were prepared following a literature procedure.23 PDA‐Pt was formed by in situ growth of Pt NPs on PDA through the reduction of H2PtCl6 by NaBH4 using a similar method reported in literature.24
Synthesis of PEI‐CD: PEI‐CD was synthesized by the substitution reaction of 6‐OTs‐β‐CD with the amine groups of PEI following the literature method.25
Synthesis of PDA‐Pt‐CD: PDA‐Pt and PEI‐CD were dispersed in 10 × 10−3 m Tris‐HCl buffer solution (10 × 10−3 m, pH = 8.5) at a 10:1 mass ratio. The mixture was stirred at room temperature for 20 h, centrifuged, and washed with a large amount of deionized water. The product PDA‐Pt‐CD was redispersed in ultra‐pure water for the next step.
Synthesis of PDA‐Pt‐CD‐PEG: MPEG5000‐COOH (5 mg, 1 eq) was dissolved in DMSO (0.5 mL). 1‐[bis(dimethylamino)methylene]‐1H‐1,2,3‐triazolo[4,5‐b]pyridinium 3‐oxid hexafluorophosphate (1.2 eq) and diisopropylethylamine (2 eq) were added and the mixture was stirred at room temperature for 30 min. After the addition of PDA‐Pt‐CD (1.5 mg mL−1 in water, 10 mL), the mixture was vigorously stirred overnight at room temperature, centrifuged, and washed with a large amount of deionized water. The solid obtained was redispersed in ultrapure water for the next step.
Synthesis of PDA‐Pt‐CD@RuFc: PDA‐Pt@CD‐PEG (10 mg, 1 mg mL−1 in water) and RuFc (500 µL, 1.2 mg in water) were mixed by ultrasound for 10 min. The mixture was stirred at room temperature for 24 h to make sure that RuFc was fully loaded onto the NPs. After centrifugation, free RuFc was removed by repeated washing with ultrapure water. PDA‐Pt‐CD@RuFc was redispersed in PBS (pH 7.4) and stored at 4 °C.
Catalase‐Like Activity of NPs: The decomposition of H2O2 under UV light could produce the short‐lived •OH that could be captured by DMPO to form a relatively stable adduct DMPO/•OH. The EPR signals of DMPO/•OH adducts were characterized by a 1:2:2:1 quadruple peak. The catalase‐like activity of PDA‐Pt‐CD and PDA‐Pt‐CD@RuFc NPs was investigated by EPR using the reaction. Briefly, DMPO (50 × 10−3 m) and H2O2 (30 × 10−3 m) were incubated with the NPs (25 and 50 µg mL−1) or the catalase (1 and 2 U mL−1) for 3 min in buffered solutions at different pH (6.5 and 7.4). The EPR spectra were measured on a Bruker A300 X‐band EPR spectrometer (modulation amplitude, 1 G; sweep width, 100 G; microwave power, 20 mW; time constant, 163.84 ms).
Decomposition of H2O2 by NPs: The amount of H2O2 remaining after the reaction were quantified by its absorption at 240 nm. Briefly, the decomposition experiment was carried out by adding PDA‐Pt‐CD@RuFc or PDA (50 µg mL−1) to the buffered solutions (pH = 6.5 or 7.4) containing H2O2 (30 × 10−3 m) at 37 °C. After incubation for different time intervals, the mixture was centrifuged and the UV/vis spectra of the residual H2O2 were recorded. The concentration was calculated from the calibration curve of absorbance at 240 nm.
Production of O2 from the Reaction between H2O2 with NPs: The production of O2 by the reaction of H2O2 (30 × 10−3 m) with the NPs (50 µg mL−1) or the catalase (2 U mL−1) at 37 °C was observed. The pictures were taken after the reaction proceeded for 30 min. O2 produced by the catalytic reaction was also detected by EPR measurement of the oxygen‐sensitive spin‐label probe CTPO. CTPO (0.1 × 10⁻³ m) was incubated with H2O2 at different concentrations in degassed buffered solutions (pH 6.5 or 7.4) for 15 min. After the addition of NPs (50 µg mL−1) or the catalase (2 U mL−1), the mixtures were incubated for different time intervals at room temperature. The EPR spectra were measured on a Bruker A300 X‐band EPR spectrometer (modulation amplitude, 1 G; sweep width, 100 G; microwave power, 20 mW; time constant, 163.84 ms).
Photo‐Fenton Reaction Measurement: The probe DMPO was used to detect the •OH produced from the Fenton reaction between RuFc and H2O2. DMPO (50 × 10−3 m) was incubated with H2O2 (30 × 10−3 m) and RuFc (50 × 10−6 m) in the presence or absence of light irradiation (450 nm, 20 mW cm−2, 3 min) at room temperature in a buffered solution (pH = 6.5 or 7.4). Then the EPR signals of DMPO/•OH were measured as described before.
Photosensitize Generation of 1O2: RuFc was incubated with ABDA (100 × 10−6 m) in the presence or absence of H2O2 (100 × 10−6 m) in buffered solutions at different pH (6.5 and 7.4). Then the mixtures were irradiated at 450 nm laser (20 W cm−2) for different periods of time. The characteristic UV/vis absorption spectra of ABDA were measured to determine the generation of 1O2. [Ru(bpy)3]Cl2 (bpy = 2, 2′‐bipyridine) was used as the standard (quantum yields for 1O2 production: Φ∆ = 0.18 in H2O).45
Conflict of Interest
The authors declare no conflict of interest.
Supporting information
Supplementary
Acknowledgements
J.H.L. and Y.Z. contributed equally to this work. This study was supported by the National Natural Science Foundation of China (nos. 21778078, 21837006, 21571196, and 21572282), the 973 program (no. 2015CB856301), the innovative team of Ministry of Education (no. IRT_17R111), the Guangdong Natural Science Foundation (2015A030306023), and the Fundamental Research Funds for the Central Universities. All animal procedures were performed in accordance with the Guidelines for Care and Use of Laboratory Animals of Sun Yat‐Sen University and the experimental protocols were approved by the Sun Yat‐Sen University Animal Care and Use Committee.
Liang J.‐H., Zheng Y., Wu X.‐W., Tan C.‐P., Ji L.‐N., Mao Z.‐W., A Tailored Multifunctional Anticancer Nanodelivery System for Ruthenium‐Based Photosensitizers: Tumor Microenvironment Adaption and Remodeling. Adv. Sci. 2020, 7, 1901992 10.1002/advs.201901992
Contributor Information
Cai‐Ping Tan, Email: tancaip@mail.sysu.edu.cn.
Zong‐Wan Mao, Email: cesmzw@mail.sysu.edu.cn.
References
- 1. Dolmans D. E., Fukumura D., Jain R. K., Nat. Rev. Cancer 2003, 3, 380. [DOI] [PubMed] [Google Scholar]
- 2. Lucky S. S., Soo K. C., Zhang Y., Chem. Rev. 2015, 115, 1990. [DOI] [PubMed] [Google Scholar]
- 3.a) Monro S., Colon K. L., Yin H., Roque J. III, Konda P., Gujar S., Thummel R. P., Lilge L., Cameron C. G., McFarland S. A., Chem. Rev. 2019, 119, 797; [DOI] [PMC free article] [PubMed] [Google Scholar]; b) Mari C., Pierroz V., Ferrari S., Gasser G., Chem. Sci. 2015, 6, 2660. [DOI] [PMC free article] [PubMed] [Google Scholar]
- 4.a) Huang H., Yu B., Zhang P., Huang J., Chen Y., Gasser G., Ji L., Chao H., Angew. Chem., Int. Ed. 2015, 54, 14049; [DOI] [PubMed] [Google Scholar]; b) Liu J., Chen Y., Li G., Zhang P., Jin C., Zeng L., Ji L., Chao H., Biomaterials 2015, 56, 140. [DOI] [PubMed] [Google Scholar]
- 5. Chakrabortty S., Agrawalla B. K., Stumper A., Vegi N. M., Fischer S., Reichardt C., Kogler M., Dietzek B., Feuring‐Buske M., Buske C., Rau S., Weil T., J. Am. Chem. Soc. 2017, 139, 2512. [DOI] [PMC free article] [PubMed] [Google Scholar]
- 6.a) Burke C. S., Byrne A., Keyes T. E., J. Am. Chem. Soc. 2018, 140, 6945; [DOI] [PubMed] [Google Scholar]; b) Burke C. S., Byrne A., Keyes T. E., Angew. Chem., Int. Ed. 2018, 57, 12420. [DOI] [PubMed] [Google Scholar]
- 7. Lou K., Lovell J. F., Chem. Commun. 2014, 50, 3231. [DOI] [PubMed] [Google Scholar]
- 8. Wang T., Zabarska N., Wu Y., Lamla M., Fischer S., Monczak K., Ng D. Y., Rau S., Weil T., Chem. Commun. 2015, 51, 12552. [DOI] [PubMed] [Google Scholar]
- 9. Liu J. P., Zhang C., Rees T. W., Ke L. B., Ji L. N., Chao H., Coord. Chem. Rev. 2018, 363, 17. [Google Scholar]
- 10. Liu J. N., Bu W., Shi J., Chem. Rev. 2017, 117, 6160. [DOI] [PubMed] [Google Scholar]
- 11.a) Chang C. H., Qiu J., O'Sullivan D., Buck M. D., Noguchi T., Curtis J. D., Chen Q. Y., Gindin M., Gubin M. M., van der Windt G. J. W., Tonc E., Schreiber R. D., Pearce E. J., Pearce E. L., Cell 2015, 162, 1229; [DOI] [PMC free article] [PubMed] [Google Scholar]; b) Quail D. F., Joyce J. A., Nat. Med. 2013, 19, 1423; [DOI] [PMC free article] [PubMed] [Google Scholar]; c) Bissell M. J., Hines W. C., Nat. Med. 2011, 17, 320; [DOI] [PMC free article] [PubMed] [Google Scholar]; d) Correia A. L., Bissell M. J., Drug Resist. Updates 2012, 15, 39. [DOI] [PMC free article] [PubMed] [Google Scholar]
- 12.a) Szatrowski T. P., Nathan C. F., Cancer Res. 1991, 51, 794; [PubMed] [Google Scholar]; b) Lim S. D., Sun C., Lambeth J. D., Marshall F., Amin M., Chung L., Petros J. A., Arnold R. S., Prostate 2005, 62, 200. [DOI] [PubMed] [Google Scholar]
- 13. De Palma M., Biziato D., Petrova T. V., Nat. Rev. Cancer 2017, 17, 457. [DOI] [PubMed] [Google Scholar]
- 14. Li X., Kwon N., Guo T., Liu Z., Yoon J., Angew. Chem., Int. Ed. 2018, 57, 11522. [DOI] [PubMed] [Google Scholar]
- 15.a) Chen H., Tian J., He W., Guo Z., J. Am. Chem. Soc. 2015, 137, 1539; [DOI] [PubMed] [Google Scholar]; b) Kim J., Cho H. R., Jeon H., Kim D., Song C., Lee N., Choi S. H., Hyeon T., J. Am. Chem. Soc. 2017, 139, 10992. [DOI] [PubMed] [Google Scholar]
- 16. Moen I., Stuhr L. E., Targeted Oncol. 2012, 7, 233. [DOI] [PMC free article] [PubMed] [Google Scholar]
- 17.a) Liu Y., Jiang Y., Zhang M., Tang Z., He M., Bu W., Acc. Chem. Res. 2018, 51, 2502; [DOI] [PubMed] [Google Scholar]; b) Meng L., Cheng Y., Tong X., Gan S., Ding Y., Zhang Y., Wang C., Xu L., Zhu Y., Wu J., Hu Y., Yuan A., ACS Nano 2018, 12, 8308; [DOI] [PubMed] [Google Scholar]; c) Chen Q., Feng L., Liu J., Zhu W., Dong Z., Wu Y., Liu Z., Adv. Mater. 2016, 28, 7129. [DOI] [PubMed] [Google Scholar]
- 18.a) Shen Z., Liu T., Li Y., Lau J., Yang Z., Fan W., Zhou Z., Shi C., Ke C., Bregadze V. I., Mandal S. K., Liu Y., Li Z., Xue T., Zhu G., Munasinghe J., Niu G., Wu A., Chen X., ACS Nano 2018, 12, 11355; [DOI] [PubMed] [Google Scholar]; b) Tang Z., Liu Y., He M., Bu W., Angew. Chem., Int. Ed. 2019, 58, 946; [DOI] [PubMed] [Google Scholar]; c) Ranji‐Burachaloo H., Gurr P. A., Dunstan D. E., Qiao G. G., ACS Nano 2018, 12, 11819. [DOI] [PubMed] [Google Scholar]
- 19.a) Villemin E., Ong Y. C., Thomas C. M., Gasser G., Nat. Rev. Chem. 2019, 3, 261; [Google Scholar]; b) Johnstone T. C., Suntharalingam K., Lippard S. J., Chem. Rev. 2016, 116, 3436. [DOI] [PMC free article] [PubMed] [Google Scholar]
- 20. Zapata F., Caballero A., Espinosa A., Tarraga A., Molina P., Dalton Trans. 2009, 2009, 3900. [DOI] [PubMed] [Google Scholar]
- 21. Elmes R. B., Orange K. N., Cloonan S. M., Williams D. C., Gunnlaugsson T., J. Am. Chem. Soc. 2011, 133, 15862. [DOI] [PubMed] [Google Scholar]
- 22. Fery‐Forgues S., Delavaux‐Nicot B., J. Photochem. Photobiol., A 2000, 132, 137. [Google Scholar]
- 23.a) Liu Y. L., Ai K. L., Liu J. H., Deng M., He Y. Y., Lu L. H., Adv. Mater. 2013, 25, 1353; [DOI] [PubMed] [Google Scholar]; b) Ding X., Liu J., Li J., Wang F., Wang Y., Song S., Zhang H., Chem. Sci. 2016, 7, 6695; [DOI] [PMC free article] [PubMed] [Google Scholar]; c) Zhang D. Y., Zheng Y., Zhang H., Sun J. H., Tan C. P., He L., Zhang W., Ji L. N., Mao Z. W., Adv. Sci. 2018, 5, 1800581. [DOI] [PMC free article] [PubMed] [Google Scholar]
- 24. Wang X.‐S., Zeng J.‐Y., Zhang M.‐K., Zeng X., Zhang X.‐Z., Adv. Funct. Mater. 2018, 28, 1801783. [Google Scholar]
- 25.a) Zhang J. X., Sun H. L., Ma P. X., ACS Nano 2010, 4, 1049; [DOI] [PMC free article] [PubMed] [Google Scholar]; b) Pun S. H., Bellocq N. C., Liu A. J., Jensen G., Machemer T., Quijano E., Schluep T., Wen S. F., Engler H., Heidel J., Davis M. E., Bioconjugate Chem. 2004, 15, 831. [DOI] [PubMed] [Google Scholar]
- 26. Hessel C. M., Pattani V. P., Rasch M., Panthani M. G., Koo B., Tunnell J. W., Korgel B. A., Nano Lett. 2011, 11, 2560. [DOI] [PMC free article] [PubMed] [Google Scholar]
- 27. Lee E. S., Gao Z., Bae Y. H., J. Controlled Release 2008, 132, 164. [DOI] [PMC free article] [PubMed] [Google Scholar]
- 28.a) Hou J. T., Ren W. X., Li K., Seo J., Sharma A., Yu X. Q., Kim J. S., Chem. Soc. Rev. 2017, 46, 2076; [DOI] [PubMed] [Google Scholar]; b) Casey J. R., Grinstein S., Orlowski J., Nat. Rev. Mol. Cell Biol. 2010, 11, 50. [DOI] [PubMed] [Google Scholar]
- 29. Liu L. C., Rui L. L., Gao Y., Zhang W. A., Polym. Chem. 2015, 6, 1817. [Google Scholar]
- 30. Lin Y. H., Ren J. S., Qu X. G., Acc. Chem. Res. 2014, 47, 1097. [DOI] [PubMed] [Google Scholar]
- 31. Comerford K. M., Wallace T. J., Karhausen J., Louis N. A., Montalto M. C., Colgan S. P., Cancer Res. 2002, 62, 3387. [PubMed] [Google Scholar]
- 32. Armstrong J. S., Steinauer K. K., Hornung B., Irish J. M., Lecane P., Birrell G. W., Peehl D. M., Knox S. J., Cell Death Differ. 2002, 9, 252. [DOI] [PubMed] [Google Scholar]
- 33. Salvioli S., Ardizzoni A., Franceschi C., Cossarizza A., FEBS Lett. 1997, 411, 77. [DOI] [PubMed] [Google Scholar]
- 34. Seglen P. O., Gordon P. B., Proc. Natl. Acad. Sci. U. S. A. 1982, 79, 1889. [DOI] [PMC free article] [PubMed] [Google Scholar]
- 35. Degterev A., Maki J. L., Yuan J., Cell Death Differ. 2013, 20, 366. [DOI] [PMC free article] [PubMed] [Google Scholar]
- 36. Sperandio S., de Belle I., Bredesen D. E., Proc. Natl. Acad. Sci. U. S. A. 2000, 97, 14376. [DOI] [PMC free article] [PubMed] [Google Scholar]
- 37. Garcia‐Calvo M., Peterson E. P., Leiting B., Ruel R., Nicholson D. W., Thornberry N. A., J. Biol. Chem. 1998, 273, 32608. [DOI] [PubMed] [Google Scholar]
- 38.a) Eltzschig H. K., Carmeliet P., N. Engl. J. Med. 2011, 364, 656; [DOI] [PMC free article] [PubMed] [Google Scholar]; b) Finger E. C., Giaccia A. J., Cancer Metastasis Rev. 2010, 29, 285. [DOI] [PMC free article] [PubMed] [Google Scholar]
- 39. Semenza G. L., Cell 2012, 148, 399. [DOI] [PMC free article] [PubMed] [Google Scholar]
- 40. Hicklin D. J., Ellis L. M., J. Clin. Oncol. 2005, 23, 1011. [DOI] [PubMed] [Google Scholar]
- 41. Finak G., Bertos N., Pepin F., Sadekova S., Souleimanova M., Zhao H., Chen H., Omeroglu G., Meterissian S., Omeroglu A., Hallett M., Park M., Nat. Med. 2008, 14, 518. [DOI] [PubMed] [Google Scholar]
- 42. Yamashita M., Ogawa T., Zhang X., Hanamura N., Kashikura Y., Takamura M., Yoneda M., Shiraishi T., Breast Cancer 2012, 19, 170. [DOI] [PubMed] [Google Scholar]
- 43. Puckett C. A., Barton J. K., Biochemistry 2008, 47, 11711. [DOI] [PMC free article] [PubMed] [Google Scholar]
- 44. Zhao X. L., Han M. J., Zhang A. G., Wang K. Z., J. Inorg. Biochem. 2012, 107, 104. [DOI] [PubMed] [Google Scholar]
- 45. Wessels J. M., Foote C. S., Ford W. E., Rodgers M. A. J., Photochem. Photobiol. 1997, 65, 96. [DOI] [PubMed] [Google Scholar]
Associated Data
This section collects any data citations, data availability statements, or supplementary materials included in this article.
Supplementary Materials
Supplementary