

Abstract
Cell-based therapeutics have considerable promise across diverse medical specialties; however, reliable human imaging of the distribution and trafficking of genetically engineered cells remains a challenge. We developed positron emission tomography (PET) probes based on the small-molecule antibiotic trimethoprim (TMP) that can be used to image the expression of the Escherichia coli dihydrofolate reductase enzyme (eDHFR) and tested the ability of [18F]-TMP, a fluorine-18 probe, to image primary human chimeric antigen receptor (CAR) T cells expressing the PET reporter gene eDHFR, yellow fluorescent protein (YFP), and Renilla luciferase (rLuc). Engineered T cells showed an approximately 50-fold increased bioluminescent imaging signal and 10-fold increased [18F]-TMP uptake compared to controls in vitro. eDHFR-expressing anti-GD2 CAR T cells were then injected into mice bearing control GD2− and GD2+ tumors. PET/computed tomography (CT) images acquired on days 7 and 13 demonstrated early residency of CAR T cells in the spleen followed by on-target redistribution to the GD2+ tumors. This was corroborated by autoradiography and anti-human CD8 immunohistochemistry. We found a high sensitivity of detection for identifying tumor-infiltrating CD8 CAR T cells, ∼11,000 cells per mm3. These data suggest that the [18F]-TMP/eDHFR PET pair offers important advantages that could better allow investigators to monitor immune cell trafficking to tumors in patients.
Keywords: CAR T cells, reporter gene, molecular imaging, cell tracking, PET imaging, trimethoprim, bioluminescence
Graphical Abstract
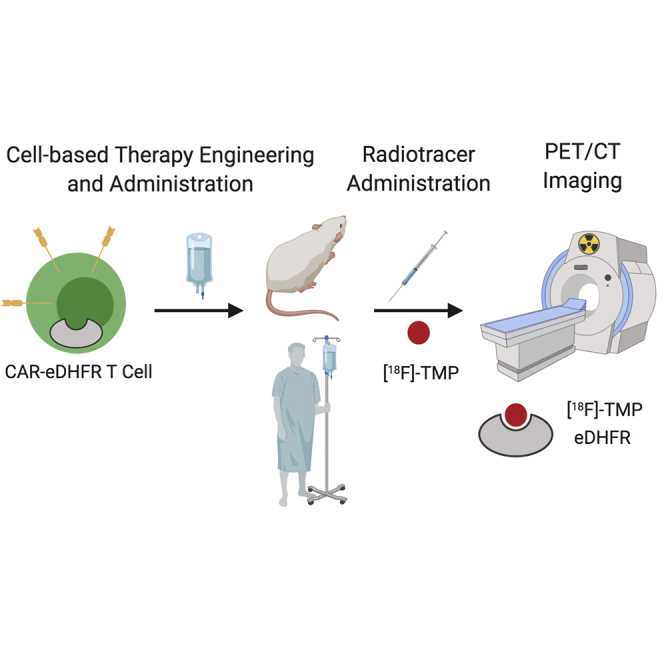
The ability to track genetically engineered cells in vivo has been a long-standing goal for molecular imaging. Sellmyer et al. show that eDHFR can be used as a positron emission tomography reporter gene to track chimeric antigen receptor (CAR) T cells longitudinally in a rodent model with high sensitivity.
Introduction
Given the increasing importance of cell-based therapies, there is a great need to develop techniques that allow for rapid characterization of new strategies and molecular targets.1 Imaging is particularly essential for clinical management of patients with cancer, and molecular imaging, most notably with the radiotracers [18F]-fluorodeoxyglucose ([18F]-FDG) and [68Ga]-DOTA-octreotate ([68Ga]-DOTATATE), has played a vital role in the assessment of target expression and treatment response.2,3 Similar position emission tomography (PET) radiotracers to monitor cell-based therapy, with respect to proper trafficking to the target or development of off-target toxicity, have been slow in developing in part because of the high barrier to entry of such molecular imaging technologies coupled with the various challenges of implementing gene therapy clinically.4 Several groups have developed new cell-based PET reporter genes, with strong preclinical benchmarking of strategies that use, for example, herpes simplex virus thymidine kinase (HSV-tk), human norepinephrine transporter (hNET), and prostate-specific membrane antigen (PSMA).5, 6, 7, 8, 9, 10 In one of these studies, hNET paired with meta-18F-fluorobenzylguanidine ([18F]MFBG) was extrapolated to be capable of identifying approximately 35,000–40,000 engineered cells. Still, only HSV-tk has been applied clinically, and its limitations include immunogenicity of the enzyme as well as background uptake at the tumor site.11, 12, 13
To address the clear need for facile human imaging of genetically engineered cells such as chimeric antigen receptor (CAR) T cells and to expand the tools available to investigators, we report the development of a high sensitivity PET reporter gene (Escherichia coli dihydrofolate reductase [eDHFR]) paired with a small molecule PET probe, [18F]fluoropropyl-trimethoprim ([18F]-TMP) (Figures 1A and 1B).14,15 In our previous work, we showed that [11C]-TMP paired with eDHFR had promising uptake in tumor xenograft models. In this work, we characterize the in vitro uptake as well as the in vivo rodent biodistribution of the eDHFR reporter gene-[18F]-TMP system and then apply this strategy to monitoring CAR T cells targeted to the GD2 disialoganglioside, a tumor antigen present on several cancers, such as neuroblastoma, melanoma, and some sarcomas (Figure 1C).16 In NSG mice bearing a GD2+ human osteosarcoma xenograft at one shoulder and GD2− colon cancer xenograft on the other shoulder, the CAR T cells were found to first accumulate in the spleen, and then traffic to antigen-positive tumors as compared to control tumors using bioluminescence and PET imaging. Key aspects in this work are the whole-animal PET images, which suggest a high degree of signal to noise originating from foci of CAR T cells invading into a tumor, and autoradiography correlation with CD8 immunohistochemistry (IHC). PET- detectable engineered cells are estimated to number in the thousands per mm3. This high sensitivity of [18F]-TMP-eDHFR suggests significant potential for future clinical application and broadening the available tools for human gene/cell therapy protocols.
Figure 1.

Structure of eDHFR PET Reporter Protein, TMP, and [18F]-TMP
(A) Bacterial DHFR complexed with NADPH and TMP (PDB: 3FRE).38 (B) Structures of TMP and [18F]-TMP. (C) Triple reporter plasmid in pELPS with eDHFR (PET reporter gene) fused to yellow fluorescent protein (YFP) and a T2A cleavage site followed by Renilla luciferase, and CAR plasmid pELPS with GD2-scFv-CD8 hinge 4-1BB-CD3z and a T2A cleavage site followed by mCherry selection marker.
Results
To test the ability of [18F]-TMP to enter mammalian cells and bind bacterial eDHFR, a cell uptake experiment was performed. Previously derived HCT116 cells (human colon cancer cell line) expressing eDHFR-yellow fluorescent protein (YFP) and control non-transduced (NTD) HCT116 cells were grown overnight in a 96-well plate.14 [18F]-TMP was synthesized as previously described with high specific activity (between 5,000 and 15,000 Ci/mmol) and radiochemical purity (99%).15 The cells were then incubated with [18F]-TMP with and without excess, competing, nonradioactive TMP (10 μM) or methotrexate (MTX, 10 μM). eDHFR cells showed a time-dependent increase in uptake whereas there was no accumulation in control (NTD) cells. Excess TMP blocked binding completely and MTX, which is also a potent inhibitor of both mammalian and bacterial DHFR, blocked binding completely by 120 min (Figures 2A and 2B).17,18 Numerical uptake values are shown in the Supplemental Information (Figure S1).
Figure 2.

[18F]-TMP Uptake in eDHFR Cells In Vitro and In Vivo
(A) Time course of in vitro uptake of [18F]-TMP in eDHFR-transduced HCT116 cells with MTX (10 μM) and unlabeled TMP (10 μM) as blocking agents (n = 4). (B) Similar to (A) but with NTD, control HCT116 cells. (C) Scheme of location of eDHFR HCT116 and control tumors. (D) Representative small animal PET/CT images in axial and coronal planes. (E) Time course quantification of eDHFR tumor uptake compared to control from (D) (n = 3). Error bars represent the SD.
Given rapid, high-level, and specific [18F]-TMP uptake in vitro, these same cell lines (HCT116 control and eDHFR-YFP) were xenografted on the shoulders of CD1 nu/nu mice and were grown for 3 weeks (Figure 2C). [18F]-TMP was administered by tail vein (∼100 μCi/mouse) and each mouse was imaged dynamically for 45 min with PET; static PET images were acquired 3 and 6 h after injection (Figures 2D and 2E). Ex vivo biodistribution analysis of [18F]-TMP after the final PET/CT imaging time point demonstrated marked uptake in eDHFR tumors compared to control tumors (Figure S2A) and a more than 40-fold increased uptake in eDHFR tumors compared to muscle (Figure S2B). Normal tissues with a very low level of uptake include the blood, heart, lungs, muscle, spleen, skin, and brain. Tissues that showed high uptake and/or excretion of the tracer include the kidney, liver, and bowel. Uptake in the bone has been shown to be in part due to defluorination of [18F]-TMP, a common occurrence in rodent models of fluorinated radiotracers that is not seen in nonhuman primates.15,19 Additionally, a nonhuman primate study of the [18F]-TMP biodistribution at various time points demonstrated the relatively low bone uptake and absence signal in the bowel (Supplemental Videos S1 and S2).15
Non-human Primate Chest and Abdominal Distribution of [18F]-TMP at 2 min
Given these findings in tumor cells, we next evaluated this strategy in imaging primary human T cells. We added Renilla reniformis luciferase to this construct, separated by a T2A ribosomal cleavage site to create a triple reporter plasmid we termed the DYR plasmid (eDHFR-YFP-Renilla, Figure 1C). The luciferase served as an imaging approach known to work well in small animals for identifying the location of live engineered cells. Lentivirus-transduced primary human T cells were sorted on YFP expression. We performed an initial in vitro test of the bioluminescence and PET reporters in the sorted T cells. There was a more than approximately 50-fold increase in bioluminescence signal from the DYR T cells in comparison to the control NTD T cells following co-incubation with coelenterazine (Figure 3A). Sorted DYR T cells demonstrated an approximately 10-fold increase in [18F]-TMP uptake relative to control NTD T cells following a 30-min incubation (Figure 3B).
Figure 3.

In Vitro Bioluminescence Imaging and [18F]-TMP Uptake of DYR-Transduced Primary Human T Cells
(A) Primary T cells were transduced with pELPS DHFR-YFP-Renilla (DYR) and sorted on YFP expression. 1 × 10⁵ DYR T cells or NTD T cells were incubated with 1.5 μM coelenterazine in a 96-well plate and subjected to bioluminescence imaging (BLI). Mean total flux is shown for each group (n = 3). (B) 1 × 10⁶ DYR or NTD T cells were incubated with 2 × 10⁶ cpm of [18F]-TMP for 30 min prior to washing with PBS. Uptake as a %ID was measured by gamma counting and normalized per million cells (n = 3). (C) Primary human T cells that had been activated with anti-CD3/CD28 antibody-coated beads were co-transduced with DYR lentivirus as well as lentivirus encoding the GD2-E101K-4-1BB CAR containing an mCherry fluorescent protein separated by a T2A site. The population of double-positive (DP) T cells was isolated by flow cytometric cell sorting. (The collected DP population is shown in red.) T cells within the YFP gate (blue) were collected to serve as CAR-negative control DYR T cells. Transduction efficiencies for the lentiviral vectors are shown in the inset. Error bars represent the SEM.
To evaluate CAR T cell trafficking in live animals, we applied our triple imaging reporter to a known CAR T cell system targeting GD2. Primary human T cells were co-transduced to express DYR and a high-affinity variant of a 4-1BB-based anti-GD2 CAR (GD2-E101K) containing an mCherry fluorescent protein separated by a T2A site.16 Transduced T cells (DYR-CAR) were sorted on YFP and mCherry to isolate double-positive DYR-CAR or single-positive control DYR-only T cells (Figure 3C). In order to determine whether the eDHFR affected T cell function, we subjected sorted DYR-CAR T cells to a number of functional assays, including cytokine release, cytotoxicity, antigen-induced proliferation, as well as metabolic and subset profiling. The DYR-CAR T cells performed similarly on these assays to control T cells expressing the same CAR in addition to GFP and luciferase but without the eDHFR (Figure S3). We designed a rodent model to evaluate the trafficking of DYR-CAR T cells to GD2+ 143b human osteosarcoma subcutaneous xenograft tumors and used a GD2− control tumor, HCT116 human colon carcinoma (Figure 4A). HCT116 tumors were confirmed to be GD2 negative with flow cytometry (Figure S4). 143b tumors are known to heterogeneously express GD2.16 GD2+ and GD− tumors were grown for 14 days on the opposite shoulders of recipient mice prior to T cell injection. The treatment group received the double-positive DYR-CAR T cells while the control group received DYR-only T cells by tail vein injection. Mice were imaged first by bioluminescence imaging (BLI) with coelenterazine injection followed by PET/CT with [18F]-TMP injection on days 7 and 13 after T cell administration. Mouse 1 of the DYR-CAR group died during a PET/CT imaging session, likely from anesthesia, and was excluded from the analysis.
Figure 4.

In Vivo CAR T Cell Trafficking
(A) NSG immunodeficient mice were xenografted in the subcutaneous shoulder regions with GD2+ tumors (143b human osteosarcoma, right shoulder) and GD2− tumors (HCT116 human colon cancer cells, left shoulder), 10 million cells per tumor. The tumors were grown for 14 days when mice were injected with 1 × 10⁶ DYR-CAR T cells or control DYR T cells via tail vein. The mice were imaged on days 7 and 13, first with BLI after coelenterazine (ctz) injection via tail vein and then with PET/CT after [18F]-TMP injection (∼100 μCi via tail vein). For quantification, regions of interest were drawn around the entire tumors, and the signal maximum in the tumors was divided by the signal maximum from the heart/mediastinal blood pool signal, thereby yielding a target-to-background ratio. (B) [18F]-TMP target-to-background ratio in the spleen was increased on day 7 in several mice treated with DYR-CAR T cells, which decreased by day 13. Mice treated with control DYR T cells showed no significant splenic signal over background. (C) Mouse 2 (M2, plus sign) demonstrated BLI and PET signal from the spleen at day 7 that decreased by day 13 (red arrowheads and red arrows). (D) Quantification of PET signal over background at the site of GD2+ 143b tumor at days 7 and 13 in the mice receiving DYR-CAR T cells (left panel) and mice receiving DYR control T cells (right panel). (E) BLI of mouse 4 (M4, plus sign), showing T cells present in the spleen at day 7 and then concentrated at the site GD2+ tumor on day 13. Focal areas of PET signal in the GD2+ tumor on PET/CT images are highlighted with red arrows. (F) Quantification of PET signal over background at the site of GD2− HCT116 tumor at days 7 and 13 in the mice receiving DYR-CAR T cells (left panel) and mice receiving DYR control T cells (right panel). Neither DYR-CAR nor DYR control T cells showed focal areas of [18F]-TMP uptake on PET/CT in HCT116 tumors. However, DYR-CAR mouse 3 (M3, asterisk) did show some signal above background on ex vivo [18F]-TMP autoradiography, which was supported by anti-human CD8 IHC (see Figure S6).
The spleens of DYR-CAR mice M2 and M3 demonstrated increased signal on day 7 relative to control mice and that decreased by day 13 in both optical and PET modalities (Figures 4B and 4C). The M4 mouse maintained a low level of signal near the spleen, which was corroborated by ex vivo IHC (Figure S5). Control mice showed no significant uptake in the spleen above basal levels on day 7 or 13. Representative DYR-CAR mouse M2 images demonstrate increased signal in the spleen on day 7 that decreased by day 13 (Figure 4C).
As splenic signal decreased over time, foci of increased signal developed within the GD2+ tumors using both optical and PET modalities (Figures 4D and 4E; Figures S6A and S6B). These foci were nonuniform and distributed about different locations in the tumor. At these early time points, the foci were generally peripheral, located medially against the chest wall or superficially within the tumor just beneath the dermis. The number and extent of the CAR T cell foci were seen to better advantage in rotating 3D maximum intensity projections at the day 13 time point (MIPs; Supplemental Videos 3, 4, 5, and 6). For quantification, regions of interest (ROIs) were drawn around the entire tumors, and the signal maximum in the tumors was divided by the signal maximum from the heart/mediastinal blood pool signal, thereby yielding a target-to-background ratio. Target-to-background ratios in GD2+ tumors reached a 6- to 8-fold increased signal, whereas in control tumors, target-to-background ratios were less than 4-fold. Importantly, foci of [18F]-TMP uptake were easily distinguished within the GD2+ tumors and in comparison to normal tissues. The GD2− control tumors did not demonstrate similar foci of increased uptake by PET imaging following treatment with DYR-CAR T cells (Figure 4F; Figure S6B).
To validate that the foci of increased signal on BLI and PET imaging were indeed coming from DYR-CAR T cells, we performed autoradiography on representative mouse spleens and tumors. For example, DYR-CAR mouse M4, which showed persistent uptake in the region of the spleen on PET imaging, also showed positive staining for anti-human CD8 cells in the spleen (Figure 4B; Figure S5). As expected, there was no autoradiography signal above background in the DYR-CAR mouse M4 GD2− tumor (Figure 5A), whereas there was clear correlation between the imaging, the autoradiography signal, and anti-CD8 IHC in the GD2+ tumor (Figure 5B).
Figure 5.

DYR-CAR M4 GD2− Tumor and GD2+ Tumor Autoradiography and IHC for Radiologic-Pathologic Correlation
(A) Gross specimen of GD2− HCT116 tumor paired with [18F]-TMP ex vivo autoradiography (acquired same day as day 13 PET imaging), and overlay image. (B) Gross specimen of GD2+ 143b tumor as in (A). The areas of autoradiography signal correlate with the areas containing positive anti-human CD8 IHC staining cells. Automated detection of tissue (yellow outlines) and DAB-positive cells (red marks) was performed using QuPath software.
Although there was no significant focal PET imaging signal from the GD2− tumor in M3 of the DYR-CAR group, there were a few superior foci of BLI signal within the tumor. This area correlated with moderately increased signal on autoradiography, and indeed positive CD8 T cells were noted on IHC (Figures S6B and S6D). Control DYR T cells did not show significant localization by BLI or PET imaging, nor was there any focal signal found by autoradiography or IHC (Figure S7).
Finally, to provide in silico evidence for the comparative potential for immunogenicity between HSV-tk and eDHFR, we performed representative HLA peptide motif searches (Figure S8) and found that there were 16 sequences for HSV-tk with an estimated HLA-A1 half-time of dissociation >1.0 s (maximum half-time of dissociation 67.5 s), whereas eDHFR had nine such sequences (maximum half-time of dissociation 12.5 s).20
Discussion
Expanding the available strategies for human cell-based therapy imaging is an important goal to maximize our understanding of therapeutic success or failure, especially given the growing numbers of cell-based therapies in clinical trials. These therapies include not only engineered T cells, but other types of immune cells.1 Moreover, fields such as regenerative medicine or non-cancer-related gene therapy stand to benefit from a long-term ability to track the functional engraftment of cells or persistence of viral vectors.21,22 Here we present a simple strategy for CAR T cell imaging, geared for human applications.
Our choice of this particular radiotracer-PET reporter gene pair was informed by the work of Cornish and colleagues23 who have used fluorescently derivatized TMP to image DHFR-tagged proteins using microscopy. Furthermore, the biochemical structure activity relationship between TMP and eDHFR is among the best characterized small molecule-protein interactions, and the clinical use of TMP as an antibiotic in combination with sulfamethoxazole (Bactrim/Septra) further underscores the translational potential of TMP radiotracer derivatives.17,24 Taken together, we suspected that TMP could be radiochemically modified, and that the biodistribution in animals might be favorable for high target to background imaging.
Prior to this work, we demonstrated this strategy using a carbon-11-labeled TMP ([11C]-TMP) in a simple rodent xenograft model.14 While the molecular similarity of [11C]-TMP to the clinically available therapeutic antibiotic has allowed us to rapidly test the biodistribution and estimated organ dosimetry in humans (M.A.S., unpublished data), fluorine-18 is more practical for human imaging given its longer half-life and energetics. The first synthesis of [18F]-TMP, and promising non-human primate biodistribution, recently was published in a complementary application of these radiotracers for bacterial infection imaging, and the use of [18F]-TMP in engineered human cells was a natural next step building upon the introductory work above.15
The uptake of [18F]-TMP in HCT116 cells carrying eDHFR compared to NTD cells was greater than 15-fold and demonstrated time-dependent accumulation. As expected, excess unlabeled TMP and MTX were able to compete with [18F]-TMP in eDHFR cells (Figures 2A and 2B). Taking these same cell lines into a xenograft rodent model, there was a more than 4-fold difference in [18F]-TMP uptake between eDHFR tumor and NTD control tumor using a ratio of the maximum counts from each tumor (Figures 2C–2E).
The ideal time after [18F]-TMP for imaging is between 2 and 4 h after injection. This allows for optimal radiotracer washout from blood. We show the growth and stability of the signal in eDHFR-expressing tumors (Figure 2E), suggesting that the technique will be robust and comparable across different imaging sessions (e.g., day 7 or day 21 after therapy), allowing for small differences in uptake time that otherwise could make large quantitative differences if the tracer uptake did not hold a reasonably steady state. This is in contrast to other tracers demonstrating temporal signal washout such as 124I-iodide.8,9
The ex vivo biodistribution suggested low background in many important tissues, for example, blood, muscle, lung, and brain, and the uptake ratio of eDHFR tumor to muscle was more than 40-fold (Figure S2), supporting the ability of this system to serve as a sensitive tool for detecting cells that carry the eDHFR reporter gene.
While there is notable bone and gastrointestinal (GI) uptake in mice treated with [18F]-TMP, this background uptake is not likely to be a problem for primate and human imaging. The bone uptake is due in part to defluorination of the radiotracer, and the GI uptake is due to the fast metabolic cycle of the mice, as well as the fact that the mice were not fasted during the imaging time period.14 This facilitated hepatobiliary excretion of the tracer. Non-human primate imaging of [18F]-TMP shows little uptake in the bowel and only trace amounts in the spine (Supplemental Videos S1 and S2).
An additional challenge for a PET reporter gene strategy is imaging systemically delivered cells, where cell numbers in a particular tissue or imaging voxel are often relatively low. Our group and others have been interested in characterizing the targeting of CAR T cells to GD2 disialoganglioside for the treatment of pediatric cancers such as neuroblastoma or osteosarcoma.16,25 We made a triple reporter imaging construct that fused eDHFR-YFP with a T2A cleavage site followed by Renilla luciferase (DYR, Figure 1C). After lentiviral transduction of primary human T cells, the bioluminescent signal and uptake of [18F]-TMP in transduced compared to control NTD T cells was tested, showing an approximately 50-fold bioluminescent signal induction and 10-fold radio signal induction (Figures 3A and 3B). The bioluminescent signal provided supporting evidence for the trafficking and accumulation of DYR-CAR T cells to the spleen and GD2+ tumors, and a handle for the optimal timing of the more operationally intensive tracer synthesis and PET/CT imaging.
Immunodeficient, humanized NSG mice were xenografted with GD2+ osteosarcoma 143b cells on one shoulder and GD2− human colon carcinoma HCT116 cells on the contralateral shoulder. The tumors grew for 2 weeks to similar sizes and were sufficiently large to be vascularized. DYR CAR T cells or control DYR T cells were injected by tail vein. As expected based on published tissue analysis showing accumulation in the spleen as early as 7 days following CAR T cell injection, CAR T cell PET signal was detected in the spleen on day 7 (Figure 4B).16,26,27 As the splenic signal both by BLI and PET dropped in several mice, there were increases in signal coming preferentially from the GD2+ 143b tumors (Figure 4D), suggesting a relative accumulation in epitope containing tissues by approximately 2 weeks. We found that in one GD2− HCT116 control tumor there was mild, diffuse [18F]-TMP uptake on PET imaging that could represent a component of alloreactivity (e.g., via the native αβ T cell receptor (TCR) on the T cells interacting with peptide-major histocompatibility complex [MHC] on HCT116 tumor cells), and that there were two foci of BLI signal that appeared to correlate with a collection of DYR-CAR T cells within that particular sample on IHC (Figure S6). There was no clear trend for this across other mice. Also, there was no significant signal from the DYR control T-cell-injected mice, suggesting that without the CAR, there was no proliferation or trafficking of the T cells (Figure 4; Figure S6).
A key component for clinical utility of this imaging strategy is the sensitivity of detection in terms of the number of cells in a particular tissue. For example, if approximately 0.6 to 6 × E8 cells are infused in the case of tisagenlecleucel, a CART19 therapy (package insert), related questions arise: How many cells need to reach the target tissue for efficacy? What are the off-tumor sites of accumulation/toxicity? We calculated that we can detect as few as 11,000 CD8 DYR-CAR T cells per mm3 in tumor tissues, a sensitivity that is comparable or better than other PET reporter techniques including human norepinephrine transporter (hNET) and HSV-tk recently benchmarked in a direct T cell injection approach (Figure S9).9 We focused on CD8 T cells in this study given that CD8 rather than CD4 T cells are the dominant tumor-infiltrating population in this CAR T model.16 Additionally, these data support and improve upon our empirically derived number of detectable cells in a xenograft model using the related radiotracer [11C]-TMP, which has a shorter isotope half-life and theoretically lower target-to-background ratio.14
The use of three reporters (eDHFR, YFP, and Renilla) in these animal experiments provided an important correlation between the BLI and PET imaging and allowed fluorescence-activated cell sorting (FACS) for double-positive cells without engaging the CAR itself. For human applications, only the eDHFR component would be needed, and thus CAR lentiviral constructs would only need to carry a bicistronic element such as an internal ribosome entry site (IRES) or cleavage site to co-express DHFR. This is in line with CAR constructs under clinical evaluation that contain other genes such as inducible caspase 9 and truncated epidermal growth factor receptor (EGFRt).28, 29, 30, 31 To evaluate for any negative impact of eDHFR on CAR T cell effector function, we assayed the cytotoxicity, immune activation, proliferation, and metabolism of CAR T cells showing that eDHFR was biologically inert and should not negatively impact the function of the CAR T cells.
The 143b osteosarcoma tumor cell line used in these experiments demonstrates heterogeneous expression of GD2. This feature made it well suited to the timing of these proof-of-concept preclinical experiments, as it provided an extended window in which to capture T cells within the tumor before the tumor is eradicated by T cells. Our results show punctate foci of CAR T cell invasion. It is not clear whether this represented focal hotspots of GD2 overexpression leading to CAR T activation, or whether these hotspots were stochastic events and just the earliest areas of invasion that were mediated by factors such as vascularity or tumor stroma.
Limitations of our study include that we did not document whether CAR T trafficking to GD2+ tumors resulted in a therapeutic response. Our goal was to catch the T cells “in the act” per se, rather than show efficacy, and thus mouse sacrifice and IHC endpoints were at critical times before tumor regression may have been seen. Future experiments to show the expansion of T cells in the target site, regression of the tumor, and co-regression of the T cells will be performed in downstream experiments.
One potential use of our imaging approach is the ability to create image-based pharmacokinetic data on “living drugs” such as CAR T cells. For example, a baseline image of a patient using [18F]-TMP prior to cell administration could be acquired. Then, subsequent follow-up [18F]-TMP images could be gathered at defined time points and CAR T cell biodistribution determined by normalizing the uptake to the baseline image. This is especially possible with the development of new whole-body PET scanner technology that allows for ultra-low-dose radiotracer administration.32
We show the ability to monitor the CAR T cell trafficking over time, for example, in the spleen at early time points and later in the tumor, suggesting that this approach allows long-term (weeks to months) monitoring of engineered cells, a feature that could be complementary to direct labeling techniques such as Zr-89 or In-111 oxine for shorter-term trafficking.33,34 This high-affinity GD2 CAR model is known to cause neurotoxicity, and thus monitoring for late trafficking to the brain and spinal cord experiments are also planned.16 While HSV-tk is known to cause an immunogenic reaction in human patients, and immunosuppression can be needed to prevent fratricide of HSV-tk-transduced cells, it is unknown whether bacterial eDHFR will have similar issues, noting some reassuring features of the bacterial protein, namely its smaller size and potential for engineering.11
In silico evidence suggests that in comparison to HSV-tk, eDHFR has fewer potential immunogenic peptides, and of those possible immunogenic peptides, eDHFR peptides show decreased half-times of dissociation with a representative human HLA (Figure S7).20 eDHFR is a smaller protein, 18 kDa, compared to HSV-tk, which is 46 kDa. In addition to eDHFR having fewer immunologically active epitopes, that humans live with large numbers of commensal intestinal bacteria raises the possibility of immune tolerance. Nevertheless, there is a possibility that eDHFR will prove to be immunogenic in humans and therefore unsuitable for repeated use. As we apply this approach in human patients, early assays will monitor for immune activation and suppression of eDHFR-engineered cells. Given the depth of biochemical understanding of the relationship between eDHFR and small-molecule ligands, modifications to improve the binding affinity and/or humanize/truncate the enzyme could be explored to mitigate the potential for immunogenicity in future studies.35,36
Conclusions
Here we present a PET imaging strategy to monitor CAR T cells using [18F]-TMP and eDHFR as a reporter gene. The ability to image small numbers of gene-modified cells in humans would be helpful to accelerate the translation of new cell-based therapies into the clinic, and it may reinforce our understanding of treatment success, failure, and toxicity.
Materials and Methods
Cloning and Molecular Biology
pTRPE lentiviral vector encoding GD2-scFv-CD8 hinge 4-1BB-CD3z with an E101K mutation was generated as described previously.16 This CAR construct was subcloned into a plasmid ELPS (pELPS) lentiviral vector upstream of a T2A-mCherry gene to allow flow sorting of CAR+ T cells in these experiments. To generate the eDHFR-YFP-Renilla reniformis luciferase (DYR) construct, PCR products encoding mammalian codon-optimized eDHFR-YFP with a T2A cleavage site followed by NheI restriction site and Renilla luciferase at the C terminus were ligated into pELPS (coding sequence and protein sequence provided in the Supplemental Information).
Mammalian Cell Culture
HCT116 cells (American Type Culture Collection [ATCC]) carrying the dhfr transgene were made as described previously.14 All cells (HCT116, 143b, SY5Y) were cultured in complete media: DMEM with 10% fetal bovine serum (Invitrogen), 2 mM glutamine, 100 U/mL penicillin, and 100 mg/mL streptomycin (all from Gibco). Cells were maintained in a humidified incubator at 37°C.
CAR T Cell Generation
Human primary bulk T cells used in these experiments were collected from healthy volunteers and purified by the Human Immunology Core at the University of Pennsylvania. T cells were expanded by co-incubation with anti-CD3/anti-CD28-coated magnetic beads at a ratio of 3:1 beads to T cells. The next day, T cells were co-transduced with lentivirus encoding DYR and GD2-E101K CAR-T2A-mCherry (or singly transduced with DYR alone) at an MOI of 5. Lentivirus had been harvested from the supernatants of 293T cells transfected with the lentiviral plasmid along with packaging plasmids as described previously.37 T cells were cultured in RPMI 1640 media supplemented with 10% FBS, 10 mmol/L HEPES buffer, 100 U/mL penicillin, and 100 g/mL streptomycin sulfate, without additional cytokines until they had rested down with a cellular volume of approximately 400 fL. At that point, beads and media were removed, and the cells were washed in Dulbecco’s phosphate-buffered saline (PBS) and resuspended in fetal bovine serum (FBS) with 5% DMSO for cryopreservation.
Flow Cytometry and Cell Sorting
For sorting, T cells that had been transduced with the DYR and CAR viruses, or DYR alone, were cultured for 8 days prior to sorting. Cells were washed with sorting buffer (PBS with 2% BSA and 1% HEPES) and analyzed and sorted on a FACSAria II (BD Biosciences) at the University of Pennsylvania Flow Cytometry and Cell Sorting Facility. Double-positive (YFP+mCherry+) or single-positive (YFP+) cells were collected and returned to conditioned media for the remainder of culture. T cells at day 9 following GD2 antigen exposure were stained with anti-CD8 (BioLegend), anti-CD45 RO (BD Pharmingen), and anti-CCR7 (BD Pharmingen). Gates were drawn based on fluorescence minus one controls. For staining of cell lines, trypsinized, PBS-washed tumor line cells were incubated with allophycocyanin (APC)-conjugated anti-GD2 clone 14G2a (BioLegend) or isotype control at 1:30 dilution for 15 min at room temperature. Cells were then washed once in 2 mL of PBS and analyzed on an LSRFortessa (BD Biosciences).
In Vitro Assays
Mammalian Cellular Uptake Studies
HCT116 dhfr cells were plated in a 96-well plate (40,000 cells/well) 24 h prior to assay, incubated with [18F]-TMP (∼70,000 cpm/50 μL/well, saline, <1% ethanol) in Opti-MEM (Gibco) for 120 min at 37°C. Excess unlabeled TMP (10 μM) or MTX (10 μM) was added as a blocking agent at the same time as adding the radiotracer to determine nonspecific binding. Protein was quantified using the Lowry method and uptake assayed on a gamma counter (PerkinElmer). [18F]-TMP uptake in primary T cells was performed by incubating 1 million CAR and DYR T cells in solution in a 1.7-mL epitube (2 million cpm/50 μL) for 30 min, washed three times with cold PBS, and assayed with a gamma counter. Uptake was measured by dividing counts by incubated dose of [18F]-TMP and normalizing to either protein concentration (% injected dose [ID]/μg) or cell number (%ID/million cells).
Cytokine Release Assays
Following an overnight co-incubation of T cells with SY5Y target cells at an effector-to-target ratio of 10:1 or media alone, supernatant was harvested and concentrations of interferon (IFN)-γ and interleukin (IL)-2 were determined by ELISA (R&D Systems).
In Vitro Proliferation
T cells were plated with irradiated SY5Y target cells at a ratio of 1:1, and total viable T cells present were determined on the indicated subsequent days using CountBright absolute counting beads and viability dye (Life Technologies).
Chromium Release Assays
T cells were co-incubated with 51Cr-loaded SY5Y target cells at the indicated effector-to-target ratios for 14 h. Supernatant was harvested, plated onto Luma plates (PerkinElmer), and counted on a MicroBeta2 instrument (PerkinElmer). The percentage specific cytotoxicity was determined using the following equation: [(experimental − spontaneous (targets with media alone))/(maximum (targets with SDS) − spontaneous)] × 100.
Metabolic Function
Metabolic function was assessed using an extracellular flux analyzer (Agilent Technologies/Seahorse Bioscience). Individual wells of an XF96 cell culture microplate were coated with CellTak in accordance with the manufacturer’s instructions. The matrix was adsorbed overnight at 37°C, aspirated, air-dried, and stored at 4°C until use. Mitochondrial and glycolytic function was assessed 5 days following exposure. CAR T cells were centrifuged at 1200 × g for 5 min. Cell pellets were resuspended in XF assay medium (nonbuffered RPMI 1640) containing 10 mM glucose, 2 mM glutamine, and 5 mM HEPES. T cells were seeded at 0.2 × 10⁶ cells/well. The microplate was centrifuged at 1,000 × g for 3 min and incubated in a CO2-free, 37°C incubator. XF96 assay cartridges were calibrated in accordance with the manufacturer’s instructions. Cellular oxygen consumption rates (OCRs) and extracellular acidification rates (ECARs) were measured under basal conditions (time points 1–3) and following treatment with 1.5 μM oligomycin A (time points 4–6), 1.5 μM fluoro-carbonyl cyanide phenlhydrazone (FCCP) (time points 7–9), and 5 μM rotenone/antimycin A (time points 10–12).
T Cell Bioluminescence Experiment
Primary human T cells (NTD) and DYR T cells (single transduction) that were sorted on YFP were added to a 96-well plate (100,000 cells). Coelenterazine h (NanoLight Technologies) was added to the wells to a final concentration 1.5 μM and cells were assayed on a luminometer (PerkinElmer).
Mouse Models
Tumor Uptake
CD1 nu/nu female mice (Charles River, 6–8 weeks, n = 3) received subcutaneous dorsal, shoulder injections of 10 × 106 HCT116 control or eDHFR cells. After 21 days of growth, tumors were palpable and animals were anesthetized (2% isoflurane), placed on the warmed stage for small animal PET and micro-CT imaging (Molecubes), and given a tail vein injection of [18F]-TMP (∼100 μCi/mouse). Dynamic PET/CT scans were initiated at the time of injection and acquired over 45 min. Static PET/CT scans were acquired for 30 min at 3 and 6 h postinjection. Elliptical ROIs were drawn around each tumor using the CT images, and the maximum counts from each ROI were determined using MIM (MIM Software, Cleveland, OH). The ratio of uptake between eDHFR tumors and control tumors was calculated for various time points postinjection. At the end of the imaging session mice were sacrificed and tissues were taken for ex vivo biodistribution calculation. Uptake in %ID/g was assayed with a gamma counter (PerkinElmer).
CAR T Cell Tracking
Female NOD-SCID-Il2rg−/− (NSG) mice (Jackson Laboratory) were subcutaneously xenografted with HCT116 human colon cancer cells (ATCC, 106) on the left shoulder and 143b human osteosarcoma (ATCC, 106) on the right shoulder in 100 μL of PBS (Corning). The tumors were allowed to grow for 14 days and then 1 million DYR T cells or 1 million CAR+DYR T cells were injected via tail vein in 100 μL of PBS (four mice per group). On days 7 and 13 after T cell injection, all mice were administered Inject-A-Lume highly pure coelenterazine (NanoLight Technology, 100 μg/mouse in 30 μL of solvent [Fuel-Inject]). Mice were imaged for 1–3 min dorsally and ventrally using an IVIS spectrum (PerkinElmer) under isoflurane anesthesia. On the same days, all mice were then injected with [18F]-TMP IV (∼100 μCi/mouse) and imaged with PET/CT 3 h after tracer administration and data were analyzed as above. On day 13, mice were sacrificed and tissues harvested for ex vivo autoradiography and IHC. Mouse number 1 of the CART cell group died during PET/CT imaging during day 13 and was omitted from analysis. All animal studies were completed with University of Pennsylvania’s Institutional Animal Care and Use Committee (IACUC) approval.
Autoradiography and Tissue Histology
Mice were sacrificed after [18F]-TMP injection and imaging. Tissues were dissected and embedded with in OCT. Sections (10 μm) were cut and exposed to a phosphor plate overnight (GE Healthcare) and developed on a Typhoon digital autoradiograph (GE Healthcare). Anti-human CD8 IHC and H&E staining of contiguous frozen sections was performed at the University of Pennsylvania Perelman School of Medicine Pathology Clinical Service Center and digitized (Zeiss Axio system). Pathology images presented here were taken using screen captures from QuPath (open-source digital pathology, GitHub). Autosensing of diaminobenzidine (DAB) staining for anti-human CD8 was used using “simple tissue detection” and “fast cell counting” features using QuPath.
Nonhuman Primate Imaging
Rhesus macaque imaging was performed as previously described.15 Images were reanalyzed to make rotating maximum intensity projections with MIM (MIM Software). All animal studies were completed with University of Pennsylvania’s IACUC approval.
Chemical Synthesis
[18F]-TMP synthesis was performed as previous described.15
Author Contributions
M.A.S. and S.A.R. contributed equally to this work. M.A.S., S.A.R., and M.D.F. designed and coordinated the research. M.A.S., S.A.R., K.L., C.H., R.S.O., and C.-C.W. performed the research and analyzed data. R.H.M., M.M., and M.D.F. helped design and interpret experiments and analyze data. M.A.S. wrote the initial draft, and all authors contributed to the final manuscript.
Conflicts of Interest
M.A.S. and R.H.M. have filed US patent US20180104365A1 assigned to the University of Pennsylvania on radiotracer derivatives of trimethoprim for medical imaging.
Acknowledgments
We thank members of the UPenn Cyclotron (Hsiaoju Lee), the UPenn Pathology Core, the Human Immunology Core, the Small Animal Imaging Facility (Eric Blankemeyer), and the Flow Cytometry and Cell Sorting Facility. We also thank David Mankoff, Mitchell Schnall, and Daniel Pryma for helpful discussions. M.A.S. is supported by the NIH Office of the Director Early Independence Award (DP5-OD26386), the Burroughs Wellcome Fund Career Award for Medical Scientists, RSNA Resident Research Award, and the NIH/NIBIB (T32 EB004311). S.A.R. is supported by St. Baldrick’s Foundation Scholar Award (524831) and was supported by the CHOP Cancer Center K12 (CA076931, NIH/NCI). R.O.C. is supported by the NIH/NCI (R01 CA226983-02). M.D.F. and K.L. are supported by Stand Up to Cancer (SU2C-AACR-IRG-15-17), and M.D.F. is also supported by the NIH/NIBIB (R01 EB026892), the National Center for Advancing Translational Science (NCATS) of the NIH (UL1TR000003), an RSNA Research Scholar Grant, and by the American Cancer Society (124268-IRG-78-002-35-IRG). The eTOC figure was created with Biorender.com.
Footnotes
Supplemental Information can be found online at https://doi.org/10.1016/j.ymthe.2019.10.007.
Contributor Information
Mark A. Sellmyer, Email: mark.sellmyer@pennmedicine.upenn.edu.
Michael D. Farwell, Email: michael.farwell@pennmedicine.upenn.edu.
Supplemental Information
References
- 1.June C.H., Sadelain M. Chimeric antigen receptor therapy. N. Engl. J. Med. 2018;379:64–73. doi: 10.1056/NEJMra1706169. [DOI] [PMC free article] [PubMed] [Google Scholar]
- 2.Pantel A.R., Mankoff D.A. Molecular imaging to guide systemic cancer therapy: Illustrative examples of PET imaging cancer biomarkers. Cancer Lett. 2017;387:25–31. doi: 10.1016/j.canlet.2016.05.008. [DOI] [PMC free article] [PubMed] [Google Scholar]
- 3.Weissleder R., Schwaiger M.C., Gambhir S.S., Hricak H. Imaging approaches to optimize molecular therapies. Sci. Transl. Med. 2016;8:355ps16. doi: 10.1126/scitranslmed.aaf3936. [DOI] [PubMed] [Google Scholar]
- 4.Collins S.A., Hiraoka K., Inagaki A., Kasahara N., Tangney M. PET imaging for gene & cell therapy. Curr. Gene Ther. 2012;12:20–32. doi: 10.2174/156652312799789271. [DOI] [PubMed] [Google Scholar]
- 5.Yaghoubi S., Barrio J.R., Dahlbom M., Iyer M., Namavari M., Satyamurthy N., Goldman R., Herschman H.R., Phelps M.E., Gambhir S.S. Human pharmacokinetic and dosimetry studies of [18F]FHBG: a reporter probe for imaging herpes simplex virus type-1 thymidine kinase reporter gene expression. J. Nucl. Med. 2001;42:1225–1234. [PubMed] [Google Scholar]
- 6.Yaghoubi S.S., Jensen M.C., Satyamurthy N., Budhiraja S., Paik D., Czernin J., Gambhir S.S. Noninvasive detection of therapeutic cytolytic T cells with 18F-FHBG PET in a patient with glioma. Nat. Clin. Pract. Oncol. 2009;6:53–58. doi: 10.1038/ncponc1278. [DOI] [PMC free article] [PubMed] [Google Scholar]
- 7.Krebs S., Ahad A., Carter L.M., Eyquem J., Brand C., Bell M., Ponomarev V., Reiner T., Meares C.F., Gottschalk S. Antibody with infinite affinity for in vivo tracking of genetically engineered lymphocytes. J. Nucl. Med. 2018;59:1894–1900. doi: 10.2967/jnumed.118.208041. [DOI] [PMC free article] [PubMed] [Google Scholar]
- 8.Castanares M.A., Mukherjee A., Chowdhury W.H., Liu M., Chen Y., Mease R.C., Wang Y., Rodriguez R., Lupold S.E., Pomper M.G. Evaluation of prostate-specific membrane antigen as an imaging reporter. J. Nucl. Med. 2014;55:805–811. doi: 10.2967/jnumed.113.134031. [DOI] [PMC free article] [PubMed] [Google Scholar]
- 9.Moroz M.A., Zhang H., Lee J., Moroz E., Zurita J., Shenker L., Serganova I., Blasberg R., Ponomarev V. Comparative analysis of T cell imaging with human nuclear reporter genes. J. Nucl. Med. 2015;56:1055–1060. doi: 10.2967/jnumed.115.159855. [DOI] [PMC free article] [PubMed] [Google Scholar]
- 10.Minn I., Huss D.J., Ahn H.H., Chinn T.M., Park A., Jones J., Brummet M., Rowe S.P., Sysa-Shah P., Du Y. Imaging CAR T cell therapy with PSMA-targeted positron emission tomography. Sci. Adv. 2019;5 doi: 10.1126/sciadv.aaw5096. eaaw5096. [DOI] [PMC free article] [PubMed] [Google Scholar]
- 11.Traversari C., Marktel S., Magnani Z., Mangia P., Russo V., Ciceri F., Bonini C., Bordignon C. The potential immunogenicity of the TK suicide gene does not prevent full clinical benefit associated with the use of TK-transduced donor lymphocytes in HSCT for hematologic malignancies. Blood. 2007;109:4708–4715. doi: 10.1182/blood-2006-04-015230. [DOI] [PubMed] [Google Scholar]
- 12.Keu K.V., Witney T.H., Yaghoubi S., Rosenberg J., Kurien A., Magnusson R., Williams J., Habte F., Wagner J.R., Forman S. Reporter gene imaging of targeted T cell immunotherapy in recurrent glioma. Sci. Transl. Med. 2017;9:eaag2196. doi: 10.1126/scitranslmed.aag2196. [DOI] [PMC free article] [PubMed] [Google Scholar]
- 13.Klebanoff C.A., Rosenberg S.A., Restifo N.P. Prospects for gene-engineered T cell immunotherapy for solid cancers. Nat. Med. 2016;22:26–36. doi: 10.1038/nm.4015. [DOI] [PMC free article] [PubMed] [Google Scholar]
- 14.Sellmyer M.A., Lee I., Hou C., Lieberman B.P., Zeng C., Mankoff D.A., Mach R.H. Quantitative PET reporter gene imaging with [11C]trimethoprim. Mol. Ther. 2017;25:120–126. doi: 10.1016/j.ymthe.2016.10.018. [DOI] [PMC free article] [PubMed] [Google Scholar]
- 15.Sellmyer M.A., Lee I., Hou C., Weng C.C., Li S., Lieberman B.P., Zeng C., Mankoff D.A., Mach R.H. Bacterial infection imaging with [18F]fluoropropyl-trimethoprim. Proc. Natl. Acad. Sci. USA. 2017;114:8372–8377. doi: 10.1073/pnas.1703109114. [DOI] [PMC free article] [PubMed] [Google Scholar]
- 16.Richman S.A., Nunez-Cruz S., Moghimi B., Li L.Z., Gershenson Z.T., Mourelatos Z., Barrett D.M., Grupp S.A., Milone M.C. High-affinity GD2-specific CAR T cells induce fatal encephalitis in a preclinical neuroblastoma model. Cancer Immunol. Res. 2018;6:36–46. doi: 10.1158/2326-6066.CIR-17-0211. [DOI] [PMC free article] [PubMed] [Google Scholar]
- 17.Baccanari D.P., Kuyper L.F. Basis of selectivity of antibacterial diaminopyrimidines. J. Chemother. 1993;5:393–399. [PubMed] [Google Scholar]
- 18.Matthews D.A., Alden R.A., Bolin J.T., Freer S.T., Hamlin R., Xuong N., Kraut J., Poe M., Williams M., Hoogsteen K. Dihydrofolate reductase: x-ray structure of the binary complex with methotrexate. Science. 1977;197:452–455. doi: 10.1126/science.17920. [DOI] [PubMed] [Google Scholar]
- 19.Ponde D.E., Dence C.S., Oyama N., Kim J., Tai Y.C., Laforest R., Siegel B.A., Welch M.J. 18F-fluoroacetate: a potential acetate analog for prostate tumor imaging—in vivo evaluation of 18F-fluoroacetate versus 11C-acetate. J. Nucl. Med. 2007;48:420–428. [PubMed] [Google Scholar]
- 20.Parker K.C., Bednarek M.A., Coligan J.E. Scheme for ranking potential HLA-A2 binding peptides based on independent binding of individual peptide side-chains. J. Immunol. 1994;152:163–175. [PubMed] [Google Scholar]
- 21.Ellebrecht C.T., Bhoj V.G., Nace A., Choi E.J., Mao X., Cho M.J., Di Zenzo G., Lanzavecchia A., Seykora J.T., Cotsarelis G. Reengineering chimeric antigen receptor T cells for targeted therapy of autoimmune disease. Science. 2016;353:179–184. doi: 10.1126/science.aaf6756. [DOI] [PMC free article] [PubMed] [Google Scholar]
- 22.Bennett J. Taking stock of retinal gene therapy: looking back and moving forward. Mol. Ther. 2017;25:1076–1094. doi: 10.1016/j.ymthe.2017.03.008. [DOI] [PMC free article] [PubMed] [Google Scholar]
- 23.Calloway N.T., Choob M., Sanz A., Sheetz M.P., Miller L.W., Cornish V.W. Optimized fluorescent trimethoprim derivatives for in vivo protein labeling. ChemBioChem. 2007;8:767–774. doi: 10.1002/cbic.200600414. [DOI] [PubMed] [Google Scholar]
- 24.Bushby S.R., Hitchings G.H. Trimethoprim, a sulphonamide potentiator. Br. J. Pharmacol. Chemother. 1968;33:72–90. doi: 10.1111/j.1476-5381.1968.tb00475.x. [DOI] [PMC free article] [PubMed] [Google Scholar]
- 25.Singh N., Liu X., Hulitt J., Jiang S., June C.H., Grupp S.A., Barrett D.M., Zhao Y. Nature of tumor control by permanently and transiently modified GD2 chimeric antigen receptor T cells in xenograft models of neuroblastoma. Cancer Immunol. Res. 2014;2:1059–1070. doi: 10.1158/2326-6066.CIR-14-0051. [DOI] [PMC free article] [PubMed] [Google Scholar]
- 26.Hu B., Ren J., Luo Y., Keith B., Young R.M., Scholler J., Zhao Y., June C.H. Augmentation of antitumor immunity by human and mouse CAR T cells secreting IL-18. Cell Rep. 2017;20:3025–3033. doi: 10.1016/j.celrep.2017.09.002. [DOI] [PMC free article] [PubMed] [Google Scholar]
- 27.Xu Y., Zhang M., Ramos C.A., Durett A., Liu E., Dakhova O., Liu H., Creighton C.J., Gee A.P., Heslop H.E. Closely related T-memory stem cells correlate with in vivo expansion of CAR.CD19-T cells and are preserved by IL-7 and IL-15. Blood. 2014;123:3750–3759. doi: 10.1182/blood-2014-01-552174. [DOI] [PMC free article] [PubMed] [Google Scholar]
- 28.Paszkiewicz P.J., Fräßle S.P., Srivastava S., Sommermeyer D., Hudecek M., Drexler I., Sadelain M., Liu L., Jensen M.C., Riddell S.R., Busch D.H. Targeted antibody-mediated depletion of murine CD19 CAR T cells permanently reverses B cell aplasia. J. Clin. Invest. 2016;126:4262–4272. doi: 10.1172/JCI84813. [DOI] [PMC free article] [PubMed] [Google Scholar]
- 29.Collinson-Pautz M.R., Chang W.C., Lu A., Khalil M., Crisostomo J.W., Lin P.Y., Mahendravada A., Shinners N.P., Brandt M.E., Zhang M. Constitutively active MyD88/CD40 costimulation enhances expansion and efficacy of chimeric antigen receptor T cells targeting hematological malignancies. Leukemia. 2019;33:2195–2207. doi: 10.1038/s41375-019-0417-9. [DOI] [PMC free article] [PubMed] [Google Scholar]
- 30.Straathof K.C., Pulè M.A., Yotnda P., Dotti G., Vanin E.F., Brenner M.K., Heslop H.E., Spencer D.M., Rooney C.M. An inducible caspase 9 safety switch for T-cell therapy. Blood. 2005;105:4247–4254. doi: 10.1182/blood-2004-11-4564. [DOI] [PMC free article] [PubMed] [Google Scholar]
- 31.Diaconu I., Ballard B., Zhang M., Chen Y., West J., Dotti G., Savoldo B. Inducible caspase-9 selectively modulates the toxicities of CD19-specific chimeric antigen receptor-modified T cells. Mol. Ther. 2017;25:580–592. doi: 10.1016/j.ymthe.2017.01.011. [DOI] [PMC free article] [PubMed] [Google Scholar]
- 32.Cherry S.R., Jones T., Karp J.S., Qi J., Moses W.W., Badawi R.D. Total-body PET: maximizing sensitivity to create new opportunities for clinical research and patient care. J. Nucl. Med. 2018;59:3–12. doi: 10.2967/jnumed.116.184028. [DOI] [PMC free article] [PubMed] [Google Scholar]
- 33.Weist M.R., Starr R., Aguilar B., Chea J., Miles J.K., Poku E., Gerdts E., Yang X., Priceman S.J., Forman S.J. PET of adoptively transferred chimeric antigen receptor T cells with 89Zr-oxine. J. Nucl. Med. 2018;59:1531–1537. doi: 10.2967/jnumed.117.206714. [DOI] [PMC free article] [PubMed] [Google Scholar]
- 34.Parente-Pereira A.C., Burnet J., Ellison D., Foster J., Davies D.M., van der Stegen S., Burbridge S., Chiapero-Stanke L., Wilkie S., Mather S., Maher J. Trafficking of CAR-engineered human T cells following regional or systemic adoptive transfer in SCID beige mice. J. Clin. Immunol. 2011;31:710–718. doi: 10.1007/s10875-011-9532-8. [DOI] [PubMed] [Google Scholar]
- 35.Liu C.T., Hanoian P., French J.B., Pringle T.H., Hammes-Schiffer S., Benkovic S.J. Functional significance of evolving protein sequence in dihydrofolate reductase from bacteria to humans. Proc. Natl. Acad. Sci. USA. 2013;110:10159–10164. doi: 10.1073/pnas.1307130110. [DOI] [PMC free article] [PubMed] [Google Scholar]
- 36.Campbell D.O., Yaghoubi S.S., Su Y., Lee J.T., Auerbach M.S., Herschman H., Satyamurthy N., Czernin J., Lavie A., Radu C.G. Structure-guided engineering of human thymidine kinase 2 as a positron emission tomography reporter gene for enhanced phosphorylation of non-natural thymidine analog reporter probe. J. Biol. Chem. 2012;287:446–454. doi: 10.1074/jbc.M111.314666. [DOI] [PMC free article] [PubMed] [Google Scholar]
- 37.Milone M.C., Fish J.D., Carpenito C., Carroll R.G., Binder G.K., Teachey D., Samanta M., Lakhal M., Gloss B., Danet-Desnoyers G. Chimeric receptors containing CD137 signal transduction domains mediate enhanced survival of T cells and increased antileukemic efficacy in vivo. Mol. Ther. 2009;17:1453–1464. doi: 10.1038/mt.2009.83. [DOI] [PMC free article] [PubMed] [Google Scholar]
- 38.Oefner C., Bandera M., Haldimann A., Laue H., Schulz H., Mukhija S., Parisi S., Weiss L., Lociuro S., Dale G.E. Increased hydrophobic interactions of iclaprim with Staphylococcus aureus dihydrofolate reductase are responsible for the increase in affinity and antibacterial activity. J. Antimicrob. Chemother. 2009;63:687–698. doi: 10.1093/jac/dkp024. [DOI] [PubMed] [Google Scholar]
Associated Data
This section collects any data citations, data availability statements, or supplementary materials included in this article.
Supplementary Materials
Non-human Primate Chest and Abdominal Distribution of [18F]-TMP at 2 min